
Abstract
The lack of research on why certain locations are perceived as unsafe has often been attributed to the scarcity of suitable data on place-based fear of crime. To address this gap, this study explores two spatial data collection methods applied in semi-rural areas of Kristianstad, Sweden. The first method uses a digital sketch map integrated with open-ended questions, accessed via an online web map platform, allowing participants to directly mark unsafe locations and resulting in geographically precise data on perceived fear of crime. The second method involves a random sample survey, employing open-ended questions to identify unsafe locations and circumstances, with responses geocoded into points, lines, or polygons for spatial inquiry. The study identifies similarities and differences in the geography of fear of crime derived from these methods. Strong alignment between the web map and survey is observed in both locations, and Spearman’s rank correlation also reveals a significant link between signal crimes and fear of crime. Kernel Density Estimation and Nearest Neighbour analysis reveal significant clusters of fear of crime in both areas, often overlapping with crime hotspots. The findings suggest that a convenience sample collected via a web application performs comparably to a traditional open-ended survey with a random sample, indicating that simpler and more cost-effective methods may be sufficient for capturing place-based fear of crime. This methodological insight supports pragmatic data collection and informs targeted, place-based fear of crime prevention strategies in both rural and urban contexts.
Introduction
Fear of crime is a multifaceted phenomenon shaped by social, spatial, and psychological dimensions (Brunton-Smith and Sturgis, 2011; Davidson, 2002; Ferraro and LaGrange, 1988; Solymosi et al., 2021). It manifests differently depending on geographic, demographic, and contextual factors (Garofalo, 1981). Understanding fear thus requires moving beyond crime statistics to consider how people perceive, interpret, and experience their environments. However, while much previous research has focussed on who is being unsafe, an increasing range of research focusses on where fear of crime and unsafety is perceived or experienced. Such a place-based approach to fear of crime tends to have lesser focus on individual-level explanatory variables and instead focus on characteristics of micro-environments (Guldåker et al., 2024; Solymosi et al., 2015). Recent studies have shown that place-based fear of crime is not evenly distributed across space, but tends to cluster at specific locations, or micro-places (Curtis et al., 2014; Jakobi and Pődör, 2020; Kronkvist, 2024; Pánek et al., 2019). These studies are, however, dependent on innovations in data collection moving beyond traditional “worry” or “unsafety” items in conventional neighbourhood surveys, allowing for more spatially sensitive approaches examining fear and unsafety. Such methodological approaches may, in turn, improve the precision of both research and intervention efforts (Solymosi et al., 2021). Whether in urban hotspots or semi-rural peripheries, addressing place-based fear of crime requires tailored strategies that consider both perception and reality.
While various methodological approaches exist to gather information of perceived unsafe locations and place-based fear of crime, including but not limited to GPS-enabled mobile surveys and participatory GIS (Solymosi et al., 2021), two emerging approaches in some recent studies includes the use of open-ended survey questions (Guldåker et al., 2024; Kronkvist, 2024) and digital sketch maps (Jakobi and Pődör, 2020; Pánek et al., 2019). Although both methods seek to capture spatial dimensions of fear and perceived unsafety, they entail distinct opportunities as well as challenges. These methods enable the collection of fine-grained, locally relevant data and support more targeted interventions, but they also raise concerns regarding participant burden, technological accessibility, and the interpretation of spatial data. In this study, we also examine the extent to which place-based fear of crime spatially aligns with crime hotspots. This raises questions about similarities and differences between perceived unsafety and actual crime, as well as the methodological need for comparable analytical approaches across datasets. Against this background, two research questions guide the current inquiry into place-based fear of crime in the semi-rural localities of Tollarp and Åhus, situated within Kristianstad municipality in southern Sweden:
By addressing the research questions, this study examines the feasibility of collecting geographically precise data on unsafe locations and compares methods for identifying fear of crime in two semi-rural contexts, focussing on their differences and methodological strengths.
Literature review
Fear of crime and unsafety
Fear of crime encompasses emotional, behavioural, and cognitive reactions to crime, ranging from immediate experiential fear to broader attitudinal concerns (Farrall et al., 2009; Ferraro and LaGrange, 1988). Fear of crime largely depends on individual characteristics (Hale, 1996), for instance in the form of different vulnerabilities (Evans and Fletcher, 2000). Fear is however also shaped by environmental, social, and structural factors, including physical disorder, the absence of informal social control, economic inequality, and crime rates (Breetzke and Pearson, 2014; Brunton-Smith and Sturgis, 2011; Nazzari et al., 2025; Sampson and Raudenbush, 1999). Fear of crime is also affected by broader structural conditions such as immigration patterns, economic disparities, welfare systems, and national crime rates (Hirtenlehner and Grafl, 2025). However, how fear of crime is constructed and measured will also affect its correlates. While much previous research has operationalised fear of crime by means of survey items relating to “how worried” respondents are of becoming victim of different types of crime (Brunton-Smith and Sturgis, 2011), or the extent to which respondents feel unsafe when walking about in their own neighbourhood (Breetzke and Pearson, 2014), some research has focussed on locations being perceived as unsafe or evoking feelings of fear of crime. Studies have shown that hotspots of unsafety frequently occur in public areas such as parks, shopping centres, and public transport hubs, highlighting the role of urban infrastructure in shaping perceptions of (un)safety (Ceccato and Snickars, 2000; Kronkvist, 2024). Such place-based fear of crime can also be influenced by factors beyond actual crime, such as gatherings of people in specific areas, rumors, and historical events (Guldåker et al., 2024). Nuanced analyses of place-based fear of crime provide greater opportunities for targeted interventions to improve safety at specific micro-places (Ceccato and Snickars, 2000; Kronkvist, 2024).
Methods for collecting data on place-based fear of crime
Traditional neighbourhood surveys with individual-level measures of worry or unsafety typically lack the spatial specificity needed to understand place-based fear of crime. Advances in data collection methods, including geocoded surveys (Guldåker et al., 2024), as well as sketch maps, and GPS-enabled mobile tools, have addressed this gap by allowing participants to pinpoint unsafe locations (Abraham et al., 2025; Kronkvist and Engström, 2020; Solymosi et al., 2021). This approach aligns with studies utilising sketch mapping to identify micro-places that evoke fear, advancing criminological understanding of specific environments and its dynamics (Curtis et al., 2014; Solymosi et al., 2021). The collection of precise micro-data over place-based fear of crime enhances the ability to conduct more accurate analyses of perceived unsafe locations and their underlying factors while improving the potential to align these insights with crime hotspots (Guldåker et al., 2024).
Fear of crime and unsafety in rural and semi-rural areas
While fear of crime in urban settings has been extensively studied, rural and semi-rural areas might exhibit different dynamics (Ceccato, 2015, 2017; Little et al., 2005; Lytle et al., 2022; Moreira and Ceccato, 2024; Pleggenkuhle and Schafer, 2018). In semi‑rural settings, fear of crime takes distinct forms influenced by factors such as isolation, inadequate lighting, and the presence of motorised youth (Wallhagen and Selander, 2024). Rural or semi-rural contexts also often lack the urban density and infrastructure that define many crime prevention strategies (Ceccato, 2015), while also suffering from lower police visibility and potentially longer response times, which raises the question of how fear is experienced and represented in environments where crime rates are quite low (Ceccato, 2022; Davidson, 2002; Prieto Curiel and Bishop, 2017). An absence of robust institutional support in rural contexts may lead to a compounded risk: individuals face both greater exposure to crime and a lack of formal protection, resulting in feelings of unsafety and diminished confidence in authorities (Moreira and Ceccato, 2024). The relationship between socioeconomic factors and fear of crime in more peripheral areas is notable (Chandola, 2001; Guldåker et al., 2024; Vieno et al., 2013), as disadvantaged areas with lower collective efficacy tend to report higher levels of unsafety, even when actual crime rates are low (Breetzke and Pearson, 2014; Gibson et al., 2002; Sampson et al., 2002). Fear of crime requires context-sensitive research approaches, with spatially precise methods especially valuable in semi-rural areas to capture localised patterns of perceived unsafety (Abraham and Ceccato, 2022). These considerations provide the backdrop for the study areas, introduced below through the case of Kristianstad and its semi‑rural communities Åhus and Tollarp.
Study areas, materials, and methods
Study areas
The municipality of Kristianstad in Sweden has a population of approximately 86,700, with around 46,000 residing in the city of Kristianstad. As of 31 December 2020, the smaller communities of Åhus and Tollarp had populations of approximately 10,487 and 3,449, respectively. Kristianstad (2025) also encompasses large rural areas, which contribute to its diverse landscape and character (Figure 1). Based on the Swedish Crime Survey and compared to other municipalities in Sweden, Kristianstad exhibits a relatively high level of perceived unsafety, with a risk ratio of 1.40 (40% higher than the average) for feeling unsafe during evening outdoor activities in residential areas, highlighting challenges in enhancing residents’ safety (Lundgren, 2021). Kristianstad’s (2024) annual safety survey 2024 indicate overall improvements in safety, especially in the city of Kristianstad, but challenges persist in semi-rural areas such as Åhus and Tollarp.
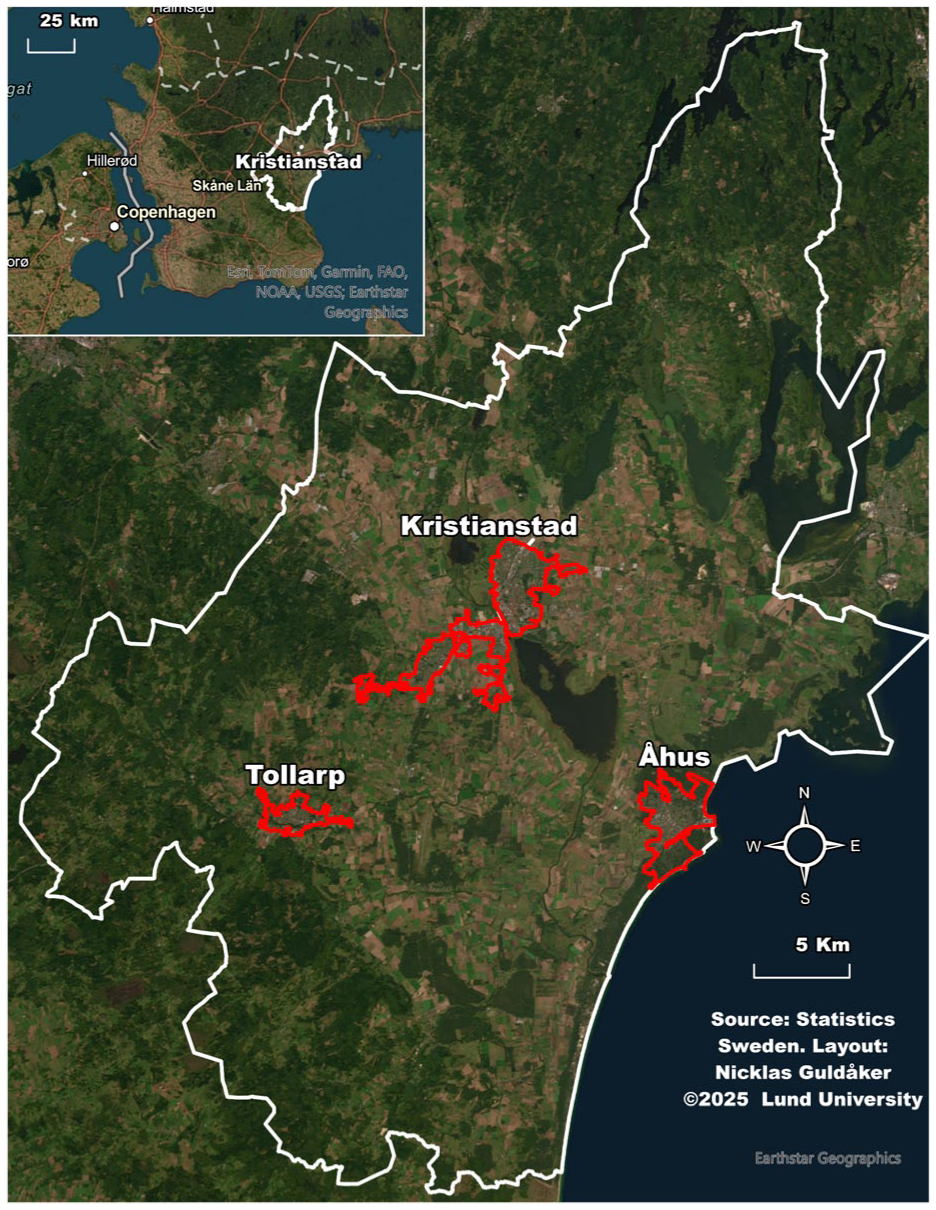
The municipality and city of Kristianstad, as well as the focus areas of Åhus and Tollarp.
Materials and methods
The material used in this study consists of three datasets collected using two data collection tools (1) a web application including an interactive mapping tool; and (2) an open-ended item within a community safety survey. These are described in more detail below. To compare with crime clusters, a dataset from the Swedish police covering the years 2018–2020 is also used, containing so-called signal crimes committed outdoors. Signal crimes refer to crimes or related deviant behaviours that can influence individuals’ perceptions and experiences of feeling unsafe (Doran and Burgess, 2011; Innes, 2004, 2014; Roach et al., 2012). The crime categories are: (1) property crime, (2) threat, (3) assault, (4) narcotics, (5) harassment, (6) robbery, (7) damage/vandalism, (8) theft, and (9) assault/violence against officials (e.g. police or security personnel). Perceptions of disorder and crime in the social environment can have a relatively strong impact on fear of crime (Innes, 2014), which justifies using crimes committed some years earlier. The number of reported signal crimes over the 3-year period in Tollarp and Åhus amounts to 252 and 404, respectively.
Web application
A digital sketch map integrated with open-ended questions, developed as a web application, was used for data collection in the rural towns of Tollarp and Åhus. The data were gathered between February 4 and 27, 2024, on both weekdays and public holidays. Data was collected at specific predetermined locations and times where there was a consistent flow of people, including the local grocery stores and other central places in the towns/areas. These locations were carefully selected in collaboration with the Police Authority and Kristianstad Municipality. The data collection was carried out using an iPad equipped with a web application specifically developed for the purpose. The collection process, conducted by research assistants from Malmö University, involved engaging local participants, recording their survey responses, and collaboratively marking relevant geographical locations on the map.
Each participant received a flyer and those who answered “no” on-site could later report via a web-tool link. To maintain data quality, each response was reviewed and confirmed with the participant before being finalised and entered into the system. The application featured both a digital sketch map and a structured survey. The digital sketch map enabled participants to navigate freely across a map and mark locations they consider unsafe and answer survey questions, similar to approaches used in previous research (Abraham et al., 2025; Engström and Kronkvist, 2023). Participants followed these steps: The first webpage provided information about the study and included a checkbox to confirm informed consent. They were then instructed to identify and mark locations they regarded as unsafe. Participants exclusively used point markers, prior to the use of polygons and lines, prioritising simplicity and user-friendliness, a methodological orientation that aligns with prior research (Jakobi and Pődör, 2020; Pánek et al., 2019). Participants could also mark multiple locations, each accompanied by the same set of follow-up questions.
The mapping tool, available only in Swedish, ensured anonymity by not collecting any identifiable participant information, and participation was voluntary with only the informed consent checkbox being mandatory. To increase the response rate, a flyer with a web link enabled online participation via an identical version of the location-based survey, with responses stored separately to distinguish them from on-site data. The flyer was distributed through Kristianstad Municipality’s various media channels.
In Tollarp, 73 respondents provided 138 on-site and 18 online responses, while in Åhus, 183 respondents contributed 286 on-site and 13 online responses. In total, 156 unsafe coordinates were collected for Tollarp and 299 for Åhus. The sample consisted of more women (64.4%) than men (35.6%), with similar figures recorded in Tollarp (67 vs 33) and Åhus (61 vs 31) respectively. The average age of the participants in the web application for the locations was 50 years for Tollarp but significantly higher for Åhus, with 64.3 years. No reference data on the mean age was available for the local population in the locations.
Survey
The second data collection involved a brief community survey of about 20 items covering demographics, signs of disorder, neighbourhood cohesion, informal social control, fear of crime, and personal victimisation. The survey was available in both web-based and paper-and-pen formats, offered in Swedish and English. Prior to participation, respondents were provided with information about the study, and those completing the web survey were required to give informed consent by checking a consent box. A random sample of individuals aged 18–85 years was drawn from the Swedish state personal address register (SPAR) as of January 1, 2024. The sample included 690 individuals from Tollarp and 2097 individuals from Åhus, representing approximately 20% of the population in the respective areas as of December 31, 2020 (the most recent data available).
Participants received study information and a link to the web-based survey via mail in early February 2024. About 3 weeks later, a reminder was sent, including both a link to the web survey and a paper version of the survey. A final reminder, containing only the web survey link, was distributed approximately 3 weeks after the second reminder. In total, 235 surveys were collected from Tollarp, corresponding to a 34% response rate, and 850 surveys were collected from Åhus, with a 41% response rate.
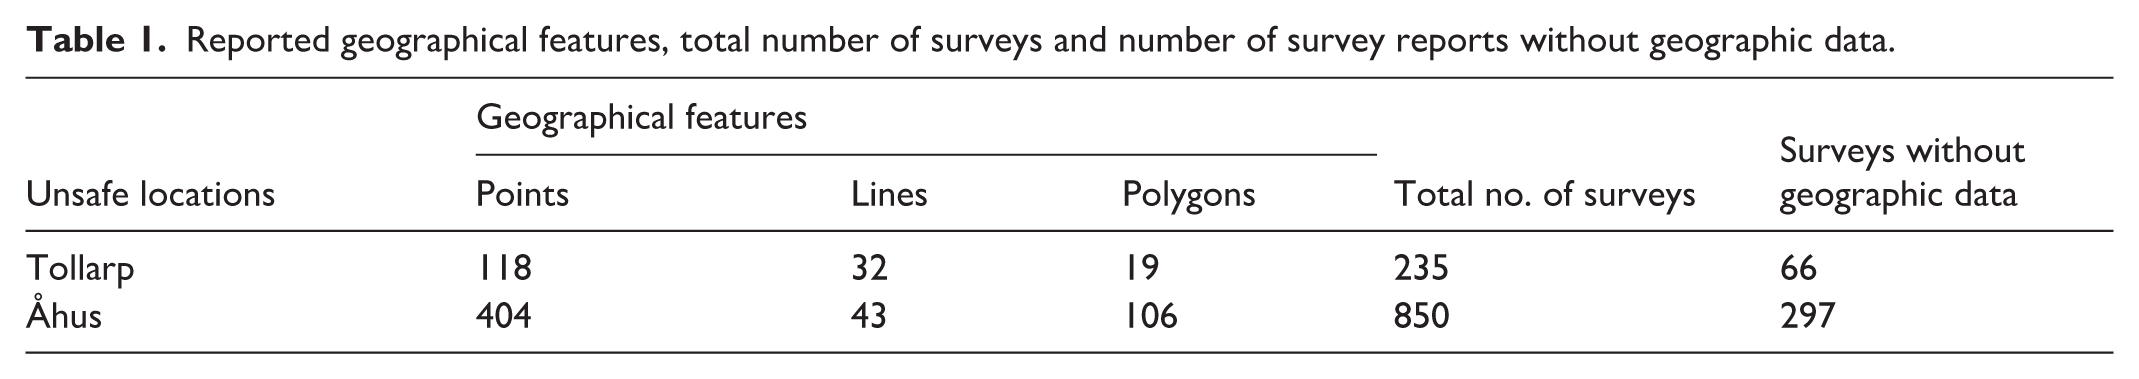
Unlike the web application approach, this method did not include a digital sketch map; instead, respondents were asked whether there were any particular unsafe locations close to their homes, or other parts of Tollarp or Åhus, that they perceived as unsafe to visit or pass through. Respondents answering “yes” to these questions were asked in follow-up questions to name the location or describe them in a way that makes it easy to identify which place or places it is, along with reasons and circumstances for perceiving them as unsafe. As the respondents did not use a specific mapping tool, unsafe places had to be geocoded based on information from the open-ended questions. This location could be linked to a specific point, roads or routes (lines), or to a residential area, forest section, or similar area (polygon). With the assistance of ArcGIS Professional, version 3.1.3, locations were then geocoded as point, line, or polygon features representing specific places. Table 1 shows reported geographical features per rural town, completed surveys, and surveys that did not report geographic features. In Tollarp, 169 of 235 surveys (72%) included geographical features, while in Åhus, 553 of 850 surveys (65%) reported such data. It should be noted that respondents were able to mark multiple locations, which may have influenced the distribution of results. However, this also provides more nuanced insight, as some individuals experience unsafety in several places, while simultaneously introducing a potential risk of bias, such as an overrepresentation of respondents who mark many locations compared to those who mark few or none. Nevertheless, this does not substantially affect the overall analysis of reported geographical features per rural town.
Reported geographical features, total number of surveys and number of survey reports without geographic data.
Geo-statistics
As illustrated in the process diagram in Figure 2, various geo-statistical methods were applied to identify the spatial patterns fear of crime in Åhus and Tollarp. The Kernel Density Estimation (KDE) method is utilised to create a smoothed density surface from point data on crime and fear of crime. KDE is commonly employed in point pattern analysis (Fischer and Wang, 2011; Shi and Pun-Cheng, 2019; Xie and Yan, 2008; Zhang et al., 2017), and in related application areas such as the case of fear of crimes (Guldåker et al., 2024), accidents (Anderson, 2009), fires (Guldåker and Hallin, 2014; Oliveira et al., 2014), crimes (Chainey et al., 2008; Gerber, 2014; Gorr et al., 2012; Mondal et al., 2022; Nakaya and Yano, 2010). Nearest Neighbour (NN) analysis, which measures spatial clustering or dispersion based on feature locations, was used to determine whether the observed patterns of crime and fear of crime are statistically significant or random. (Guldåker et al., 2024; Johnson, 2013). Significant clusters of fear of crime in Tollarp and Åhus were visualised as red-brown polylines and crime as black polylines (Figures 5 and 6), generated using the Contour List tool in ArcPro with a threshold of two standard deviations above zero. In the study, the following GIS-related methods were also applied: Fishnet to create analysis grids, spatial join and merge to combine data, union to integrate overlapping datasets, generate near table to identify proximity relationships between features, and calculate field and weighting to compute new attributes and assign data weights. As described below, statistics were employed to investigate relationships and patterns in the data (Goodchild et al., 2015; Harrie, 2020). Figure 2 presents a schematic representation of the methodological process, structured into four distinct stages of interpretation. For instance, it illustrates the transition from stage 2 to stage 3, showing how points, lines, and polygons are transformed into vector grids for visualisation purposes, as shown in Figures 3 and 4. These transformations serve analytical purposes by enabling spatial pattern recognition, comparative analysis, and the integration of multiple data layers of fear of crime and crime (see Figures 5 and 6). Additionally, to account for the spatial extent of polygons and polylines intersecting multiple grid-cells, each reported feature was weighted by dividing its count by the number of intersected cells, following a method outlined by Kronkvist (2022). For example, a polygon reported by 21 participants across 7 cells gives an unsafety score of 3 per cell; a line reported by 14 across 4 cells gives 3.5. Points remain unweighted.
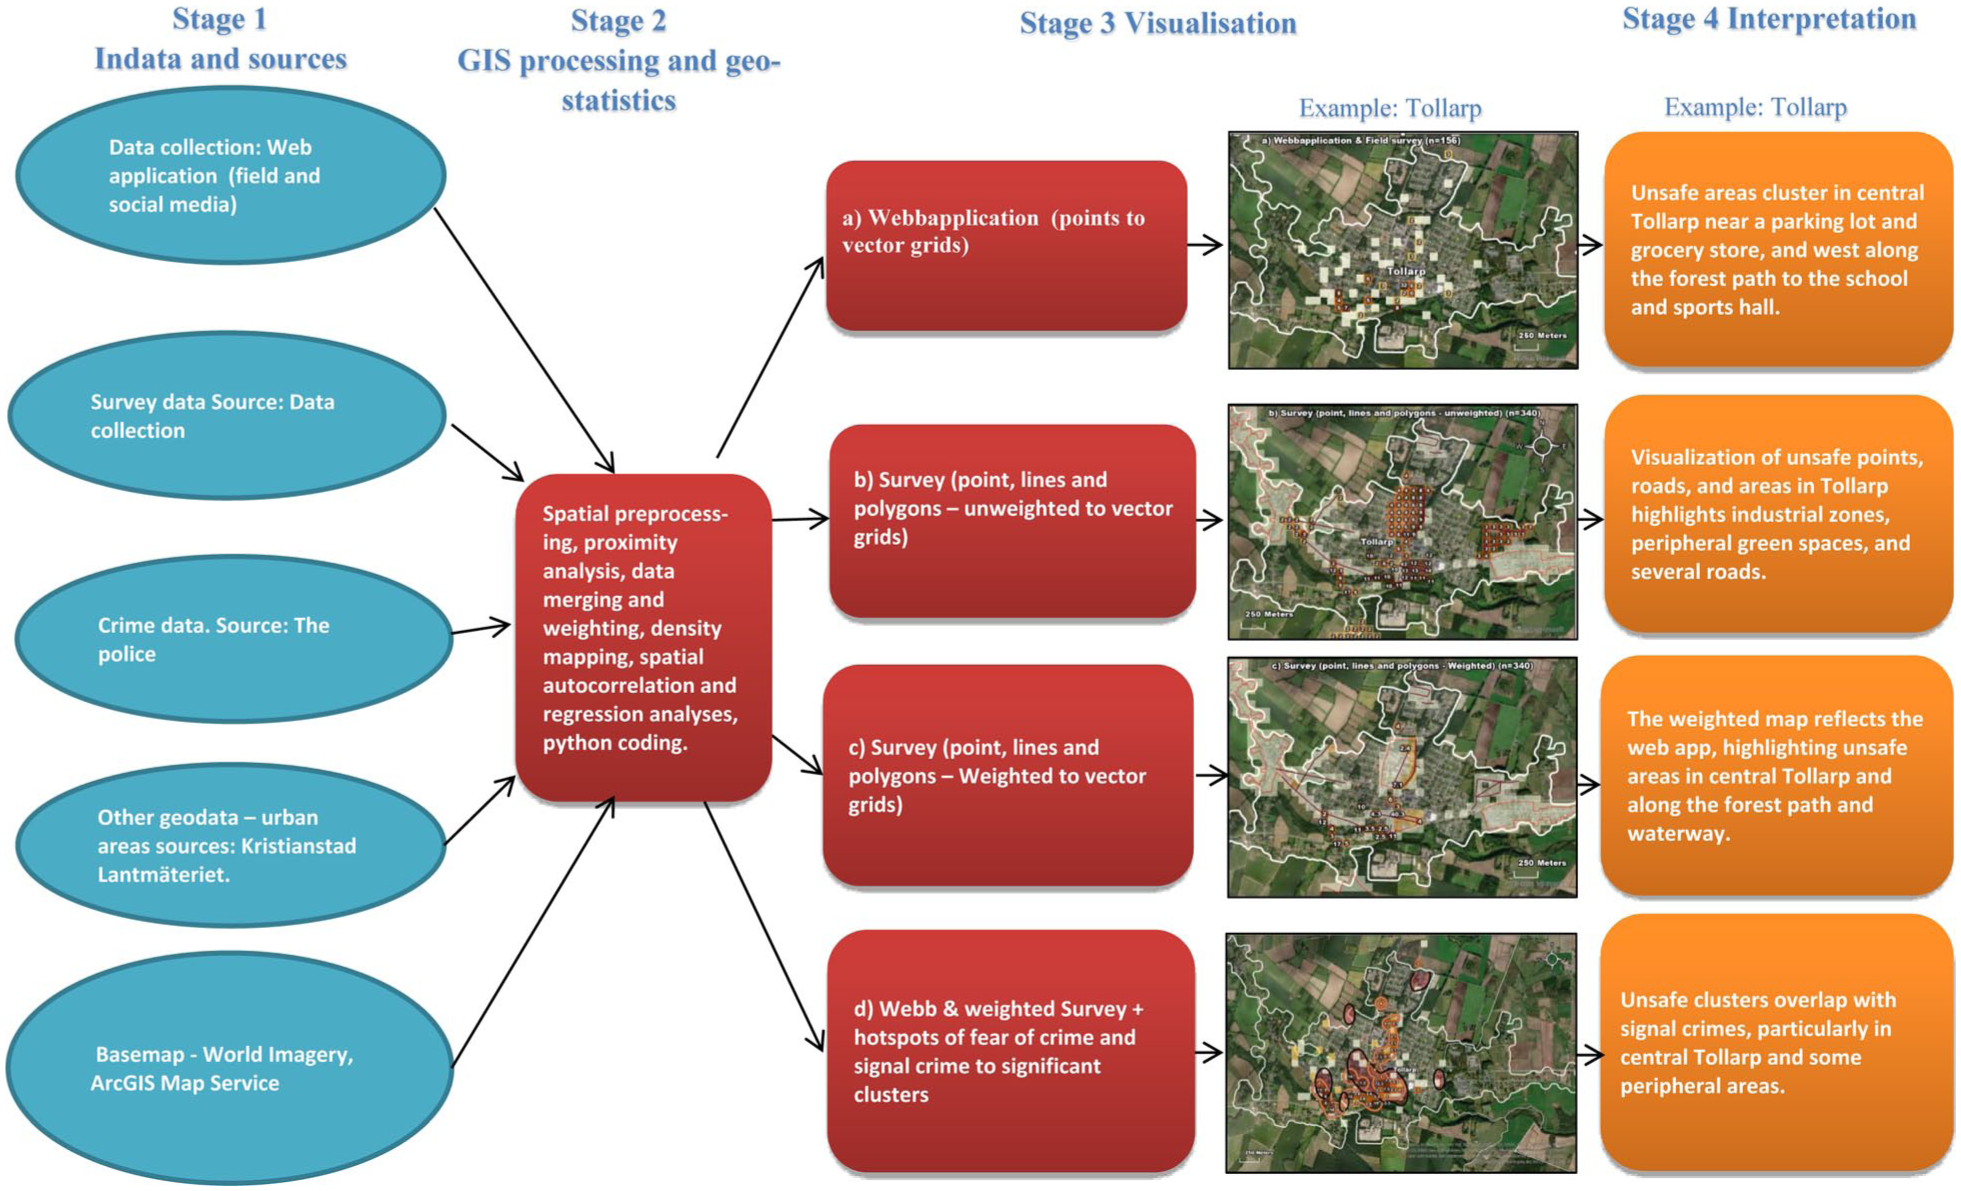
A schematic overview of the methodological processes in four stages including example interpretations of the results.
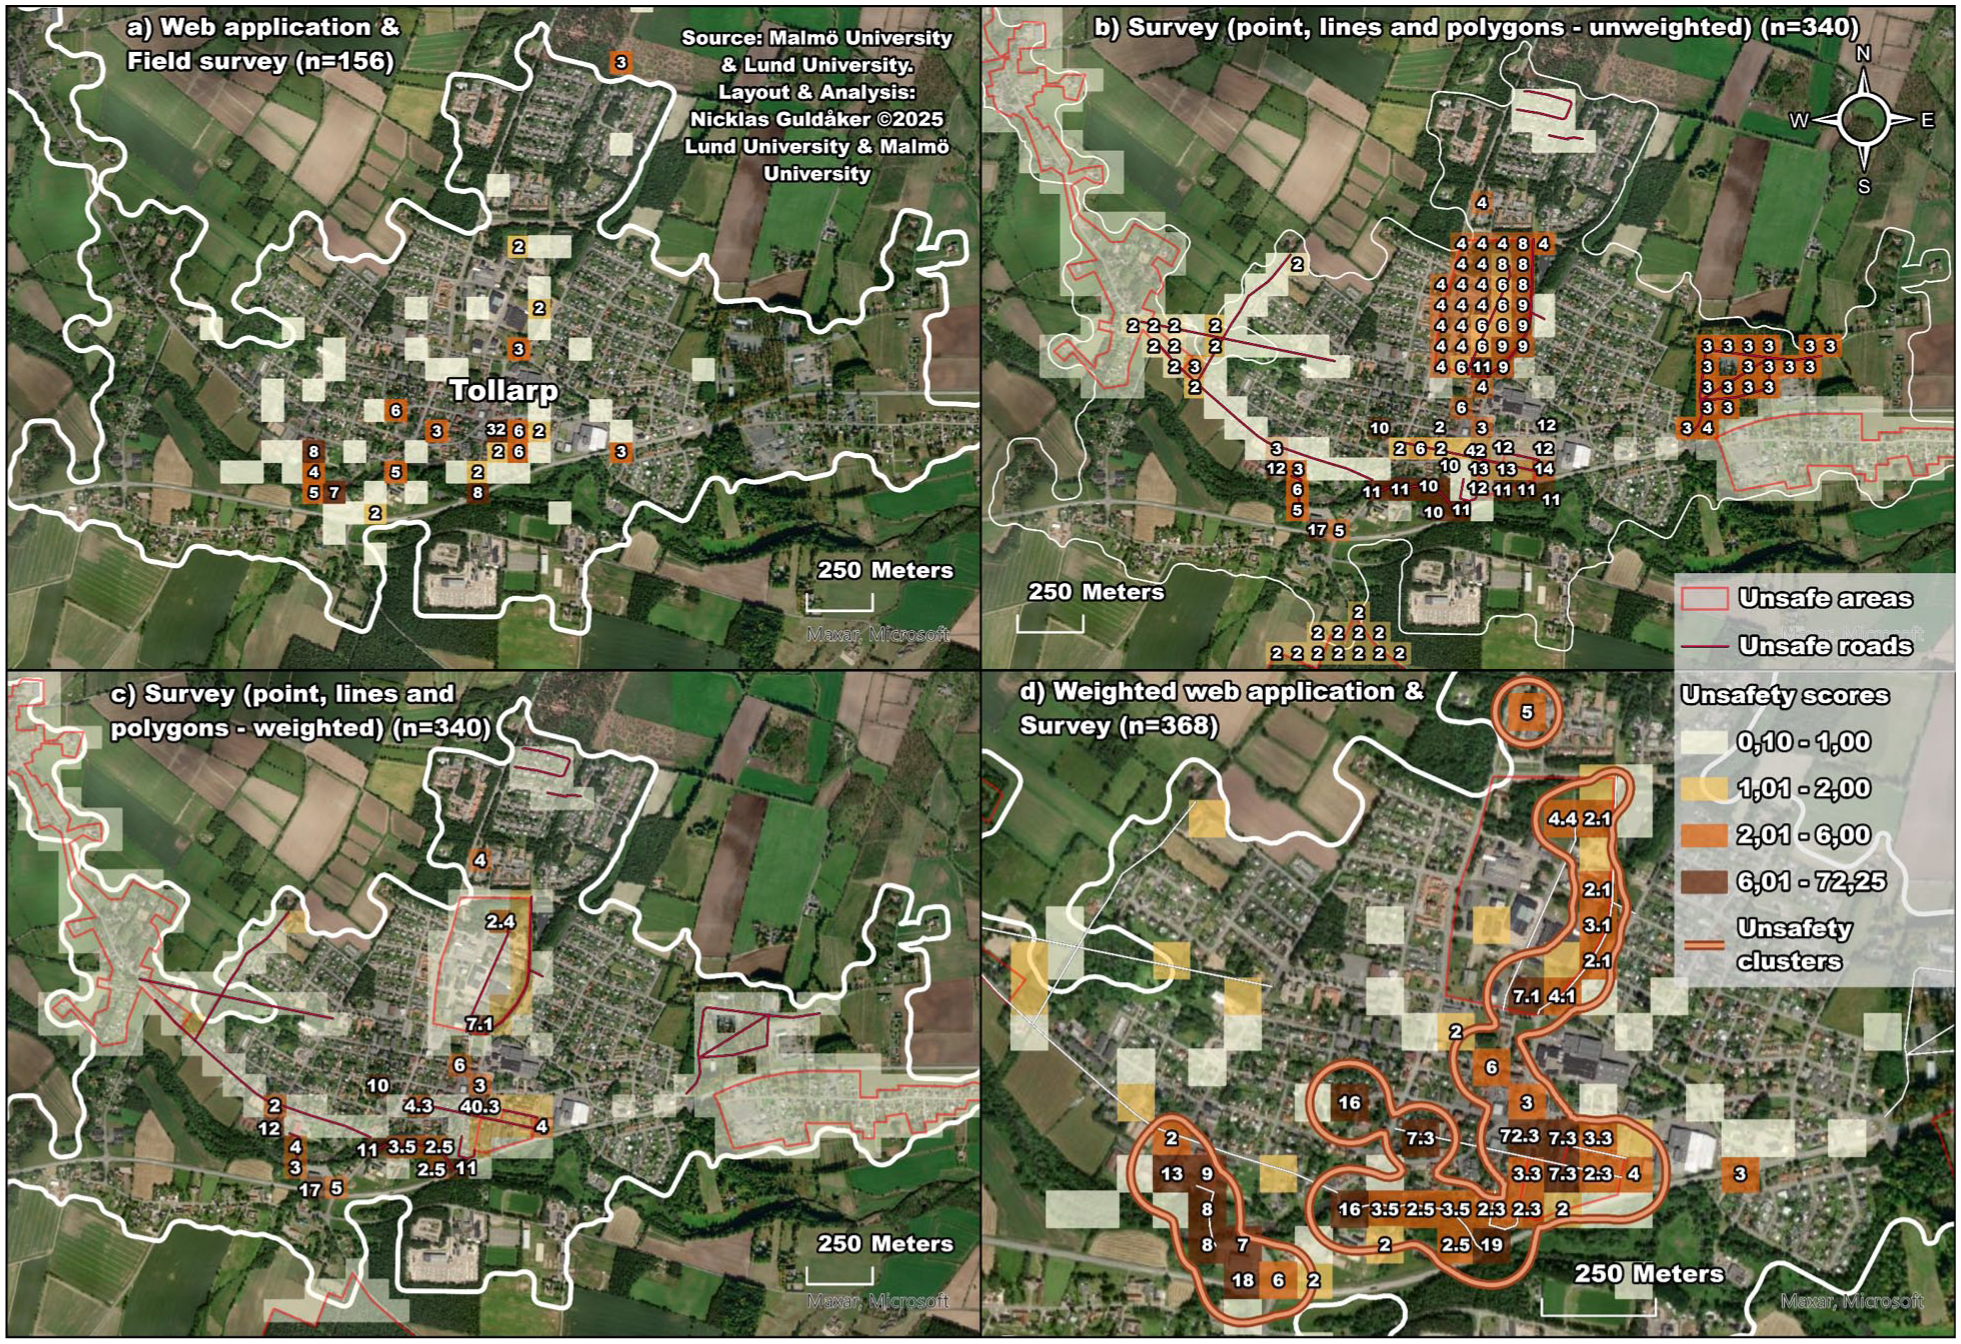
Unsafety scores and unsafety clusters in Tollarp, Kristianstad, Sweden: (a) a web application and field survey (n = 156), (b) survey (point, lines, and polygons-unweighted; n = 340), (c) survey (point, lines, and polygons-weighted; n = 340), and (d) weighted web application and survey (n = 368).
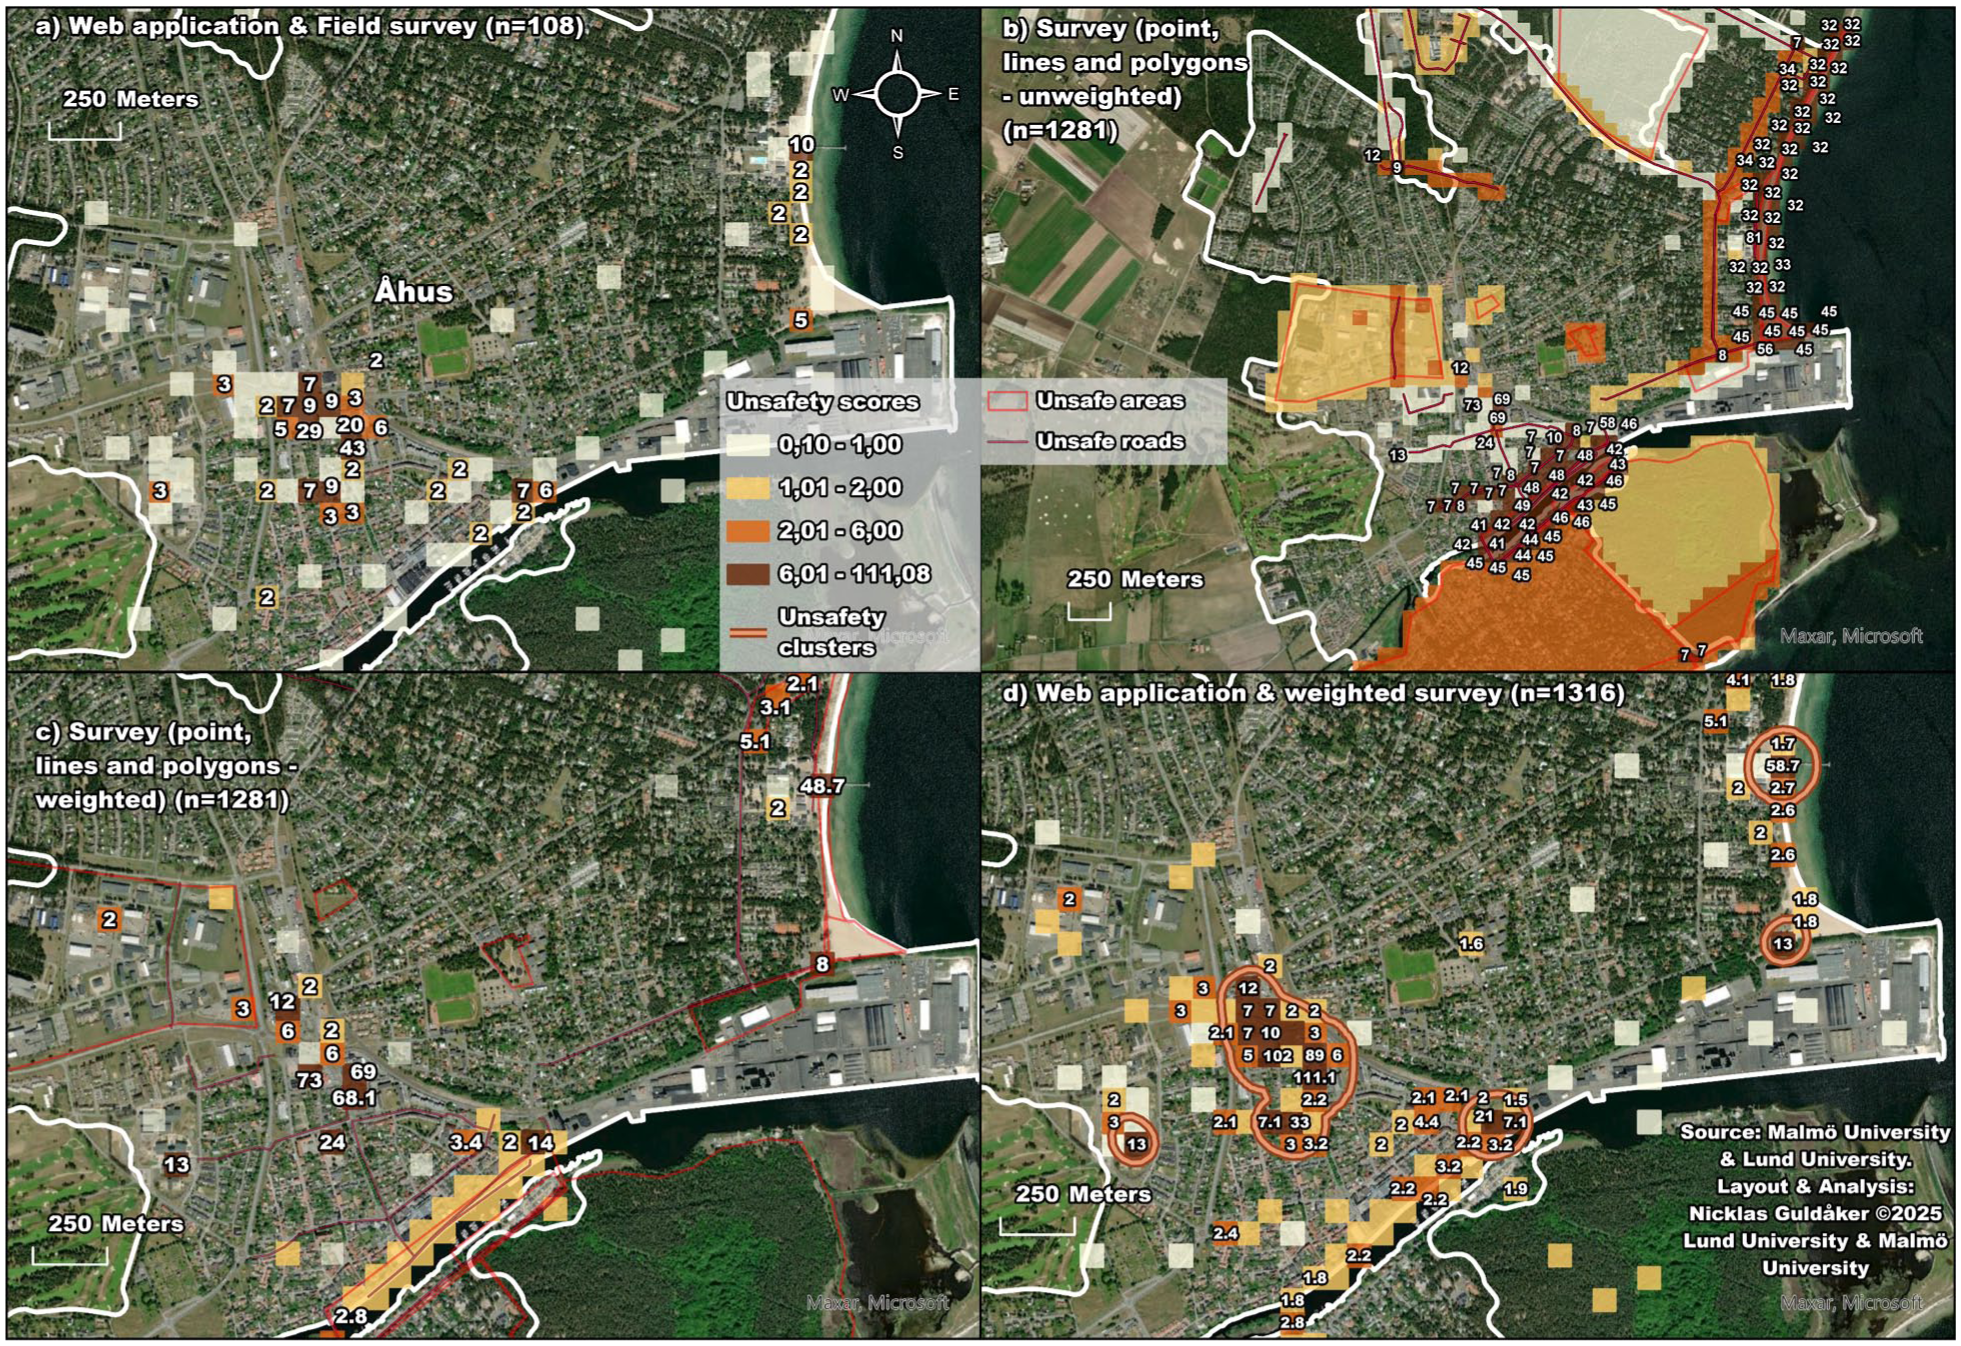
Unsafety scores and unsafety clusters in Åhus, Kristianstad, Sweden: (a) web application and field survey (n = 108), (b) survey (point, lines, and polygons-unweighted; n = 1281), (c) survey (point, lines, and polygons-weighted; n = 1281), and (d) web application and weighted survey (n = 1316).
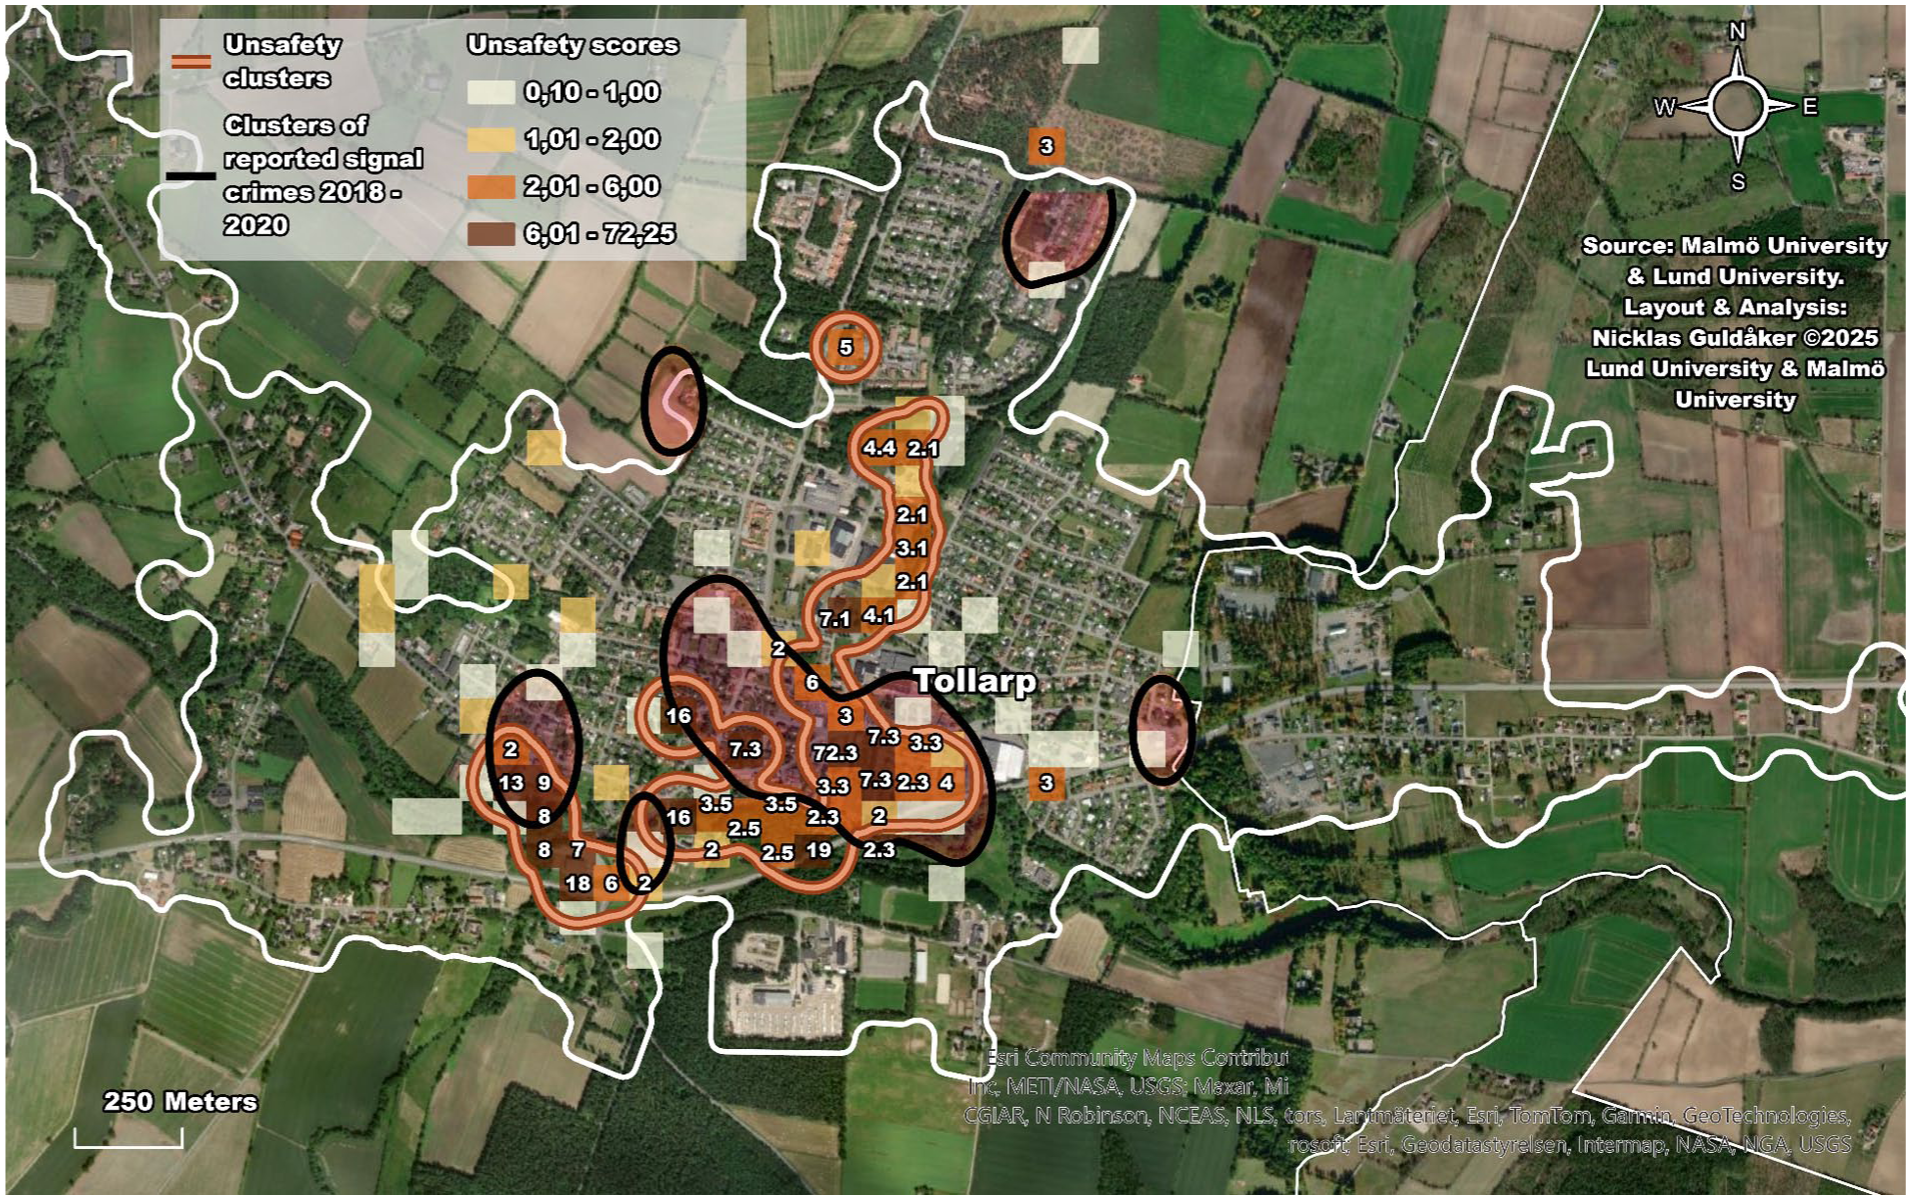
Spatial relationship between clusters of fear of crime (n = 368) and crime hotspots (n = 252) based on signal crime data 2018–2020 in Tollarp.
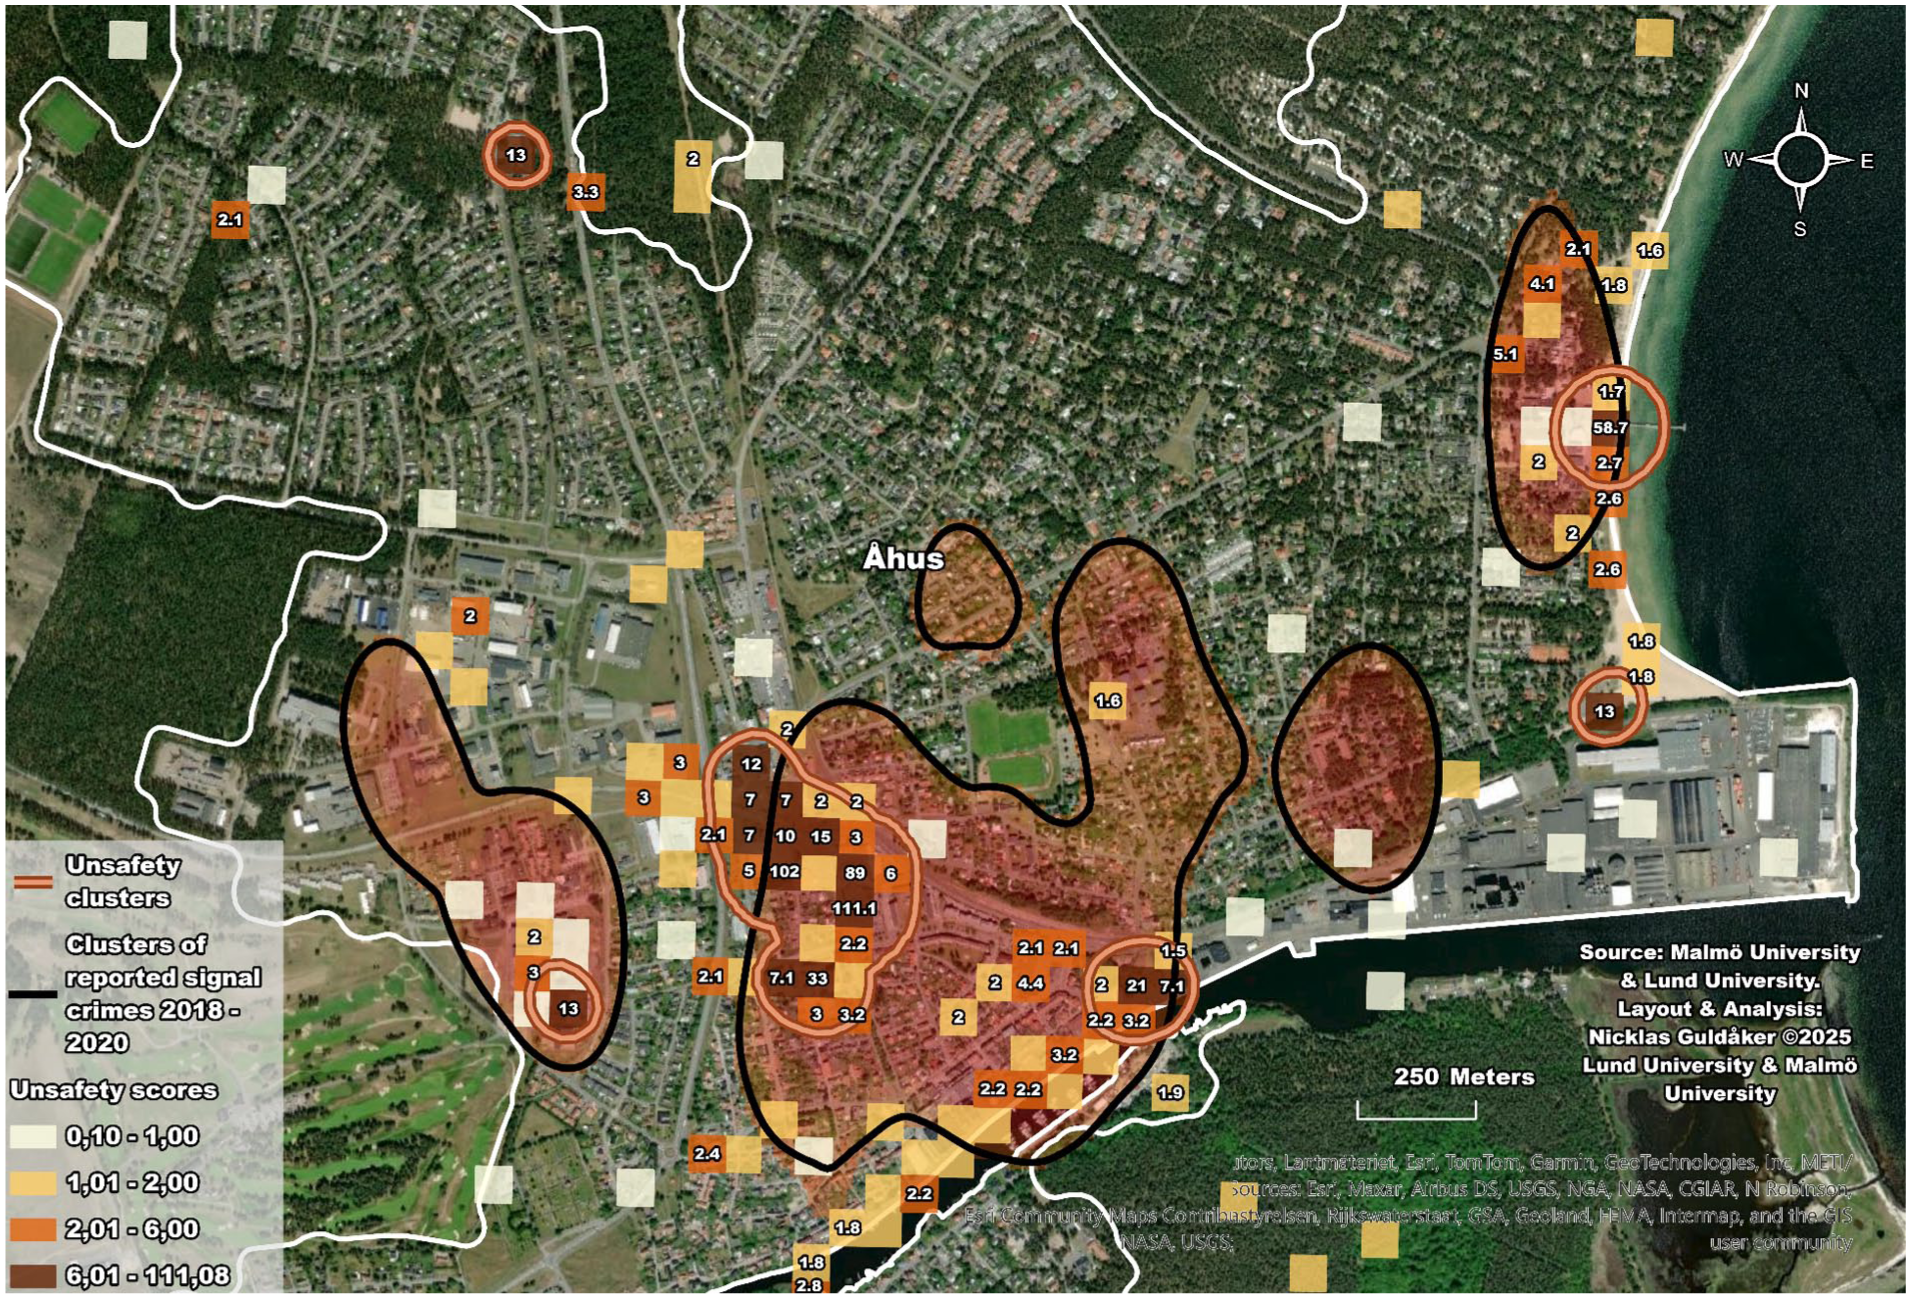
Spatial relationship between clusters of fear of crime (n = 1316) and crime hotspots (n = 404) based on signal crime data 2018–2020 in Åhus.
Statistical methods
During the analytical process, it becomes evident that the datasets do not follow a linear relationship nor exhibit a normal distribution. Therefore, Spearman’s rank correlation is used in the study (ρ). This non‑parametric approach enables a more robust assessment of the consistency between the ranked unsafe locations identified in the web map and those reported in the survey data (Ratcliffe, 2005; Weisburd et al., 2020). It is calculated by comparing the differences between ranks (d) for paired observations and using the formula:
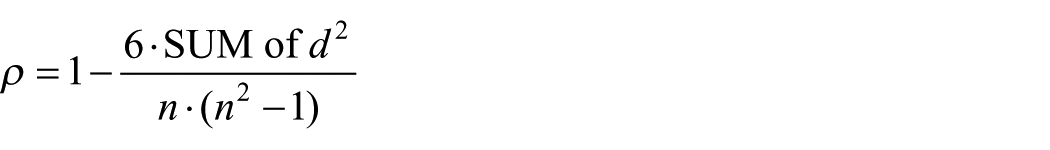
In this study, the calculations, including ranking and the computation of ρ, were performed using Python scripts in ArcGIS Pro (see Appendix 1 for a sample calculation script used in the analysis). The datasets compared were derived from the web map application and the community survey, both capturing spatial data on perceived fear of crime within vector grid cells in Tollarp and Åhus. The Spearman’s rank correlation incorporated data from surrounding grid cells within a 100-m radius, based on the assumption that perceived fear of crime is shaped by nearby areas rather than confined to discrete spatial units. Spearman’s rank correlation was also employed to assess the relationship between the spatial distribution of fear of crime and signal crimes across the two rural areas, also included data within 100 m to account for neighbouring cells and avoid overly localised interpretations, which could be affected by the inherent geographical inaccuracy of crime data (Buil-Gil et al., 2022; Gerell, 2018; Tompson et al., 2015).
Analysis and results
The analysis and results cover the descriptive and analytical research questions presented in the introduction.
The geography of fear of crime through different data collection methods
This section addresses the research question “how is the geography of fear of crime manifested through different data collection methods?” by examining spatial similarities, differences, and significant clusters of perceived unsafety in Tollarp and Åhus.
Geographical analysis
Figures 3 and 4 present the results of the geographic analysis of the geography of fear of crime in the towns of Tollarp and Åhus. Map a) in Figure 3 displays the results from the web application, with unsafe locations represented as 78-m cells in Tollarp, a threshold based on the town’s median street length to reflect its irregular street network. This aligns with previous spatial research that defines grid-cell sizes based on street lengths to reflect behaviour settings and spatially actionable risk interpretations (Hart and Zandbergen, 2014; Kennedy et al., 2011; Kronkvist et al., 2025a). The most unsafe place is located in central Tollarp and around Tollarps Square close to a parking lot and a grocery store, whose highest-rated cell has been mentioned 32 times in the data collection. Another cluster with multiple mentions (unsafety scores of 8, 4, 5, and 7) is located to the west, where there is a school with a pathway through a forest and over a waterway leading to a sports hall.
Map b) illustrates the locations coded from the survey responses, with the numbers indicating the unweighted frequency of mentions for specific unsafe places (points), roads (lines), and areas (polygons). The weighting is reflected in map c), where a similar pattern to the web application emerges. When combining the results from the web application and the weighted survey in map d), significant clusters (red/orange) of unsafety scores become evident in Tollarp, extending to the industrial area to the north (highest score: 7.1) and reaching a school with a parking lot, road crossing, and green space (score: 5) as the northernmost point. The highest unsafety score reaches 72.3 in the central part of the town.
In Åhus, the pattern observed in Tollarp is repeated when comparing the web application’s results (Map a) in Figure 4) with the unweighted and weighted survey results (maps b and c). In Åhus, several 75-m cells, based on the town’s median street length, indicate high unsafety scores around the largest grocery store and extensive parking areas (29 and 73 in maps a–c), the town’s waterfront along the Helge River’s outflow in the southern part (most visible in the unweighted map b) and Åhus Beach (in the east) are repeatedly identified as areas of perceived unsafety. Unsafety clusters are clearly visible on the map, especially at Bryggan pier (58.7), the grocery store parking area (over 100), Åhus guest harbour (7.1), a school and sports arena in the west (13), and Åhus Beach in the southeast (13).
The clusters in Tollarp and Åhus show different dynamics and levels of attraction, but they share a common trait: they are evening hangouts for youth with motorised vehicles (Wallhagen and Selander, 2024). Åhus, as a summer town, shapes the seasonal and time-specific nature of perceived crime fear, while Tollarp, a smaller inland rural community, presents a different context.
Geographical clustering
Table 2 shows that observed mean distances are consistently smaller than expected, indicating significant clustering. Based on both unsafety and signal crime data, there's less than a 1% chance these clusters in Tollarp and Åhus occurred randomly, confirming the statistical significance of those shown in Figures 3 to 6.
Average Nearest Neighbour Summary of data from different data sets of Tollarp and Åhus in Kristianstad.
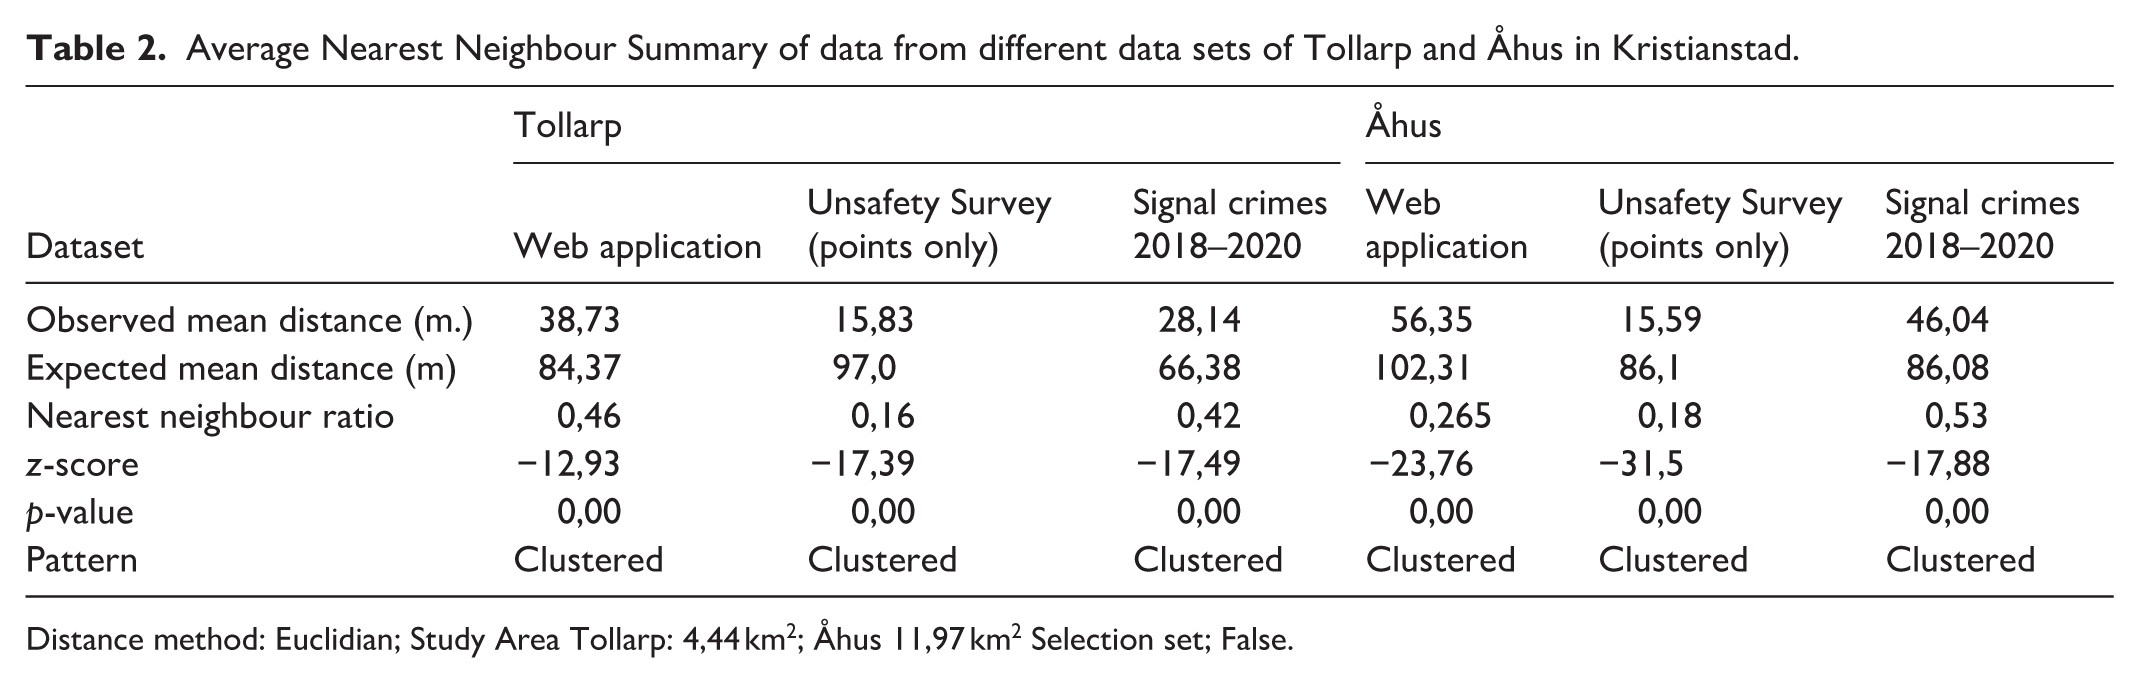
Distance method: Euclidian; Study Area Tollarp: 4,44 km2; Åhus 11,97 km2 Selection set; False.
Statistical analysis
A key question is whether the two methods yield consistent results in identifying unsafe locations. Due to non-linear relationships and non-normal distributions, Spearman’s rank correlation was used, considering neighbouring grid cells within 100 m. As shown in Table 3, Tollarp displays a very strong spatial correlation (ρ = 0.83) between web map and survey data, which remains significant even when zero values are excluded. In Åhus, the correlation is moderate to strong (ρ = 0.64), increasing to 0.78 when zeros are excluded from the web map, but slightly decreasing to 0.63 when removed from the survey.
For Spearman’s Rank Correlation of Webb versus Survey in Tollarp och Åhus incorporating neighbours within 100 m, including robustness test with without zeros.
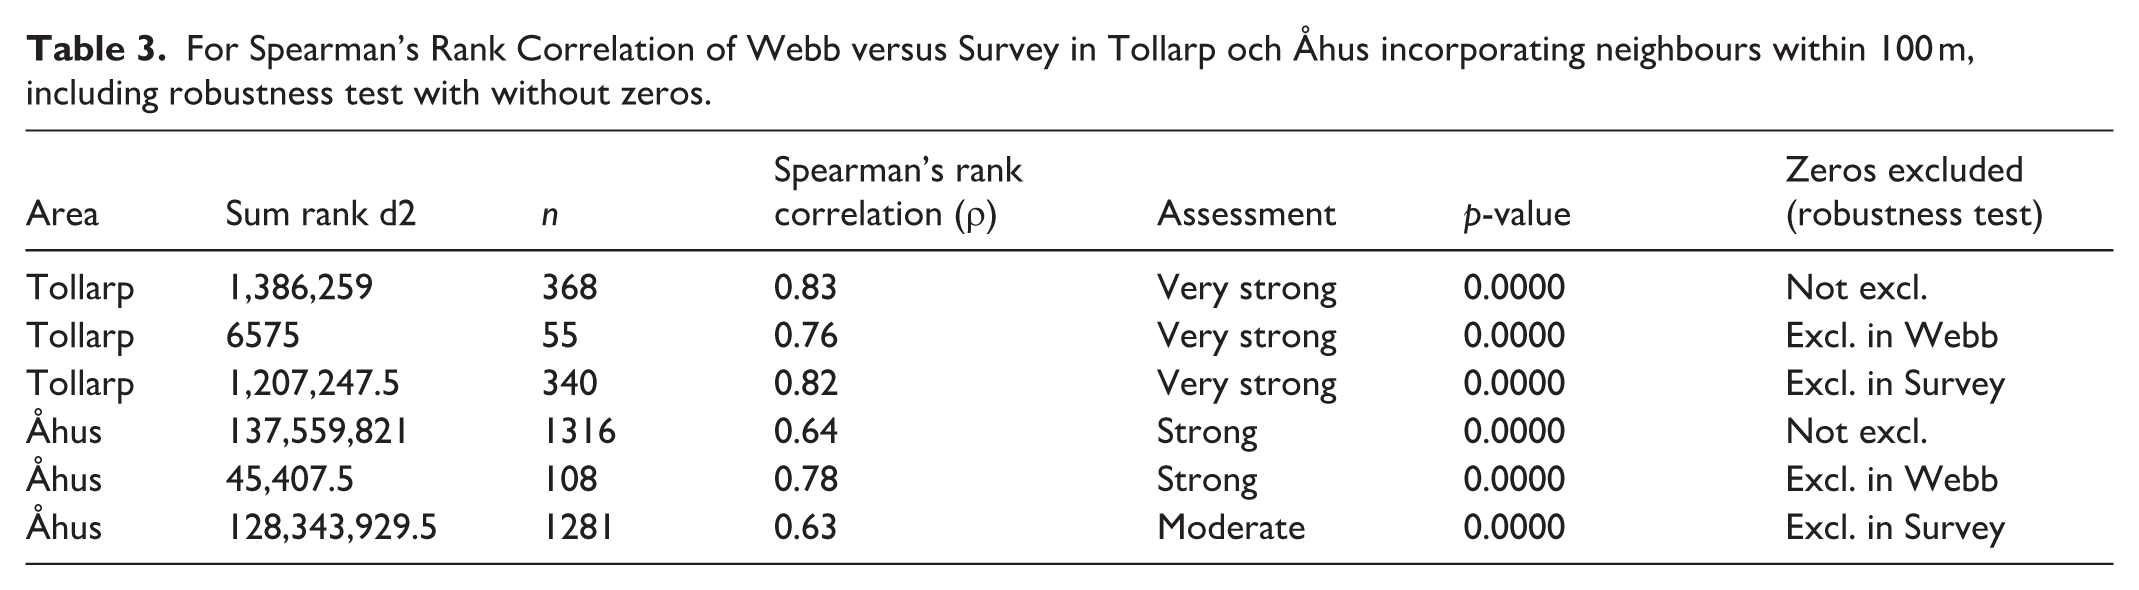
However, the stronger correlation observed in Tollarp indicates a greater consistency or alignment between the two methods in this location compared to Åhus. These findings provide valuable evidence that web map applications can serve as helpful tools for collecting data on public perceptions of unsafety, but at the same time, multiple methods combined, aimed at geographic precision, help create more reliable and representative results regarding which locations are perceived as unsafe.
Geography of fear of crime and crime hotspots in semi-rural areas
This section addresses the research question about the relationship between the geography of fear of crime and crime hotspots in these semi-rural in Tollarp and Åhus in Kristianstad.
Figures 5 and 6 show a clear spatial overlap between significant clusters of fear of crime and signal crime (see Table 2). In both Tollarp and Åhus, these clusters align with locations frequently identified as unsafe in the surveys. In Tollarp, overlaps appear mainly in central areas, with some on the outskirts. Åhus shows more crimes and larger clusters. The spatial alignment between crime and perceived unsafety supports earlier findings (Guldåker et al., 2024), though some locations may need closer attention to prevent them from becoming future crime hotspots. Overall, the spatial relationship between crime and unsafety aligns with findings from previous research, though with the caveat that there are unsafe places that may require more attention to prevent them from developing into significant crime hotspots.
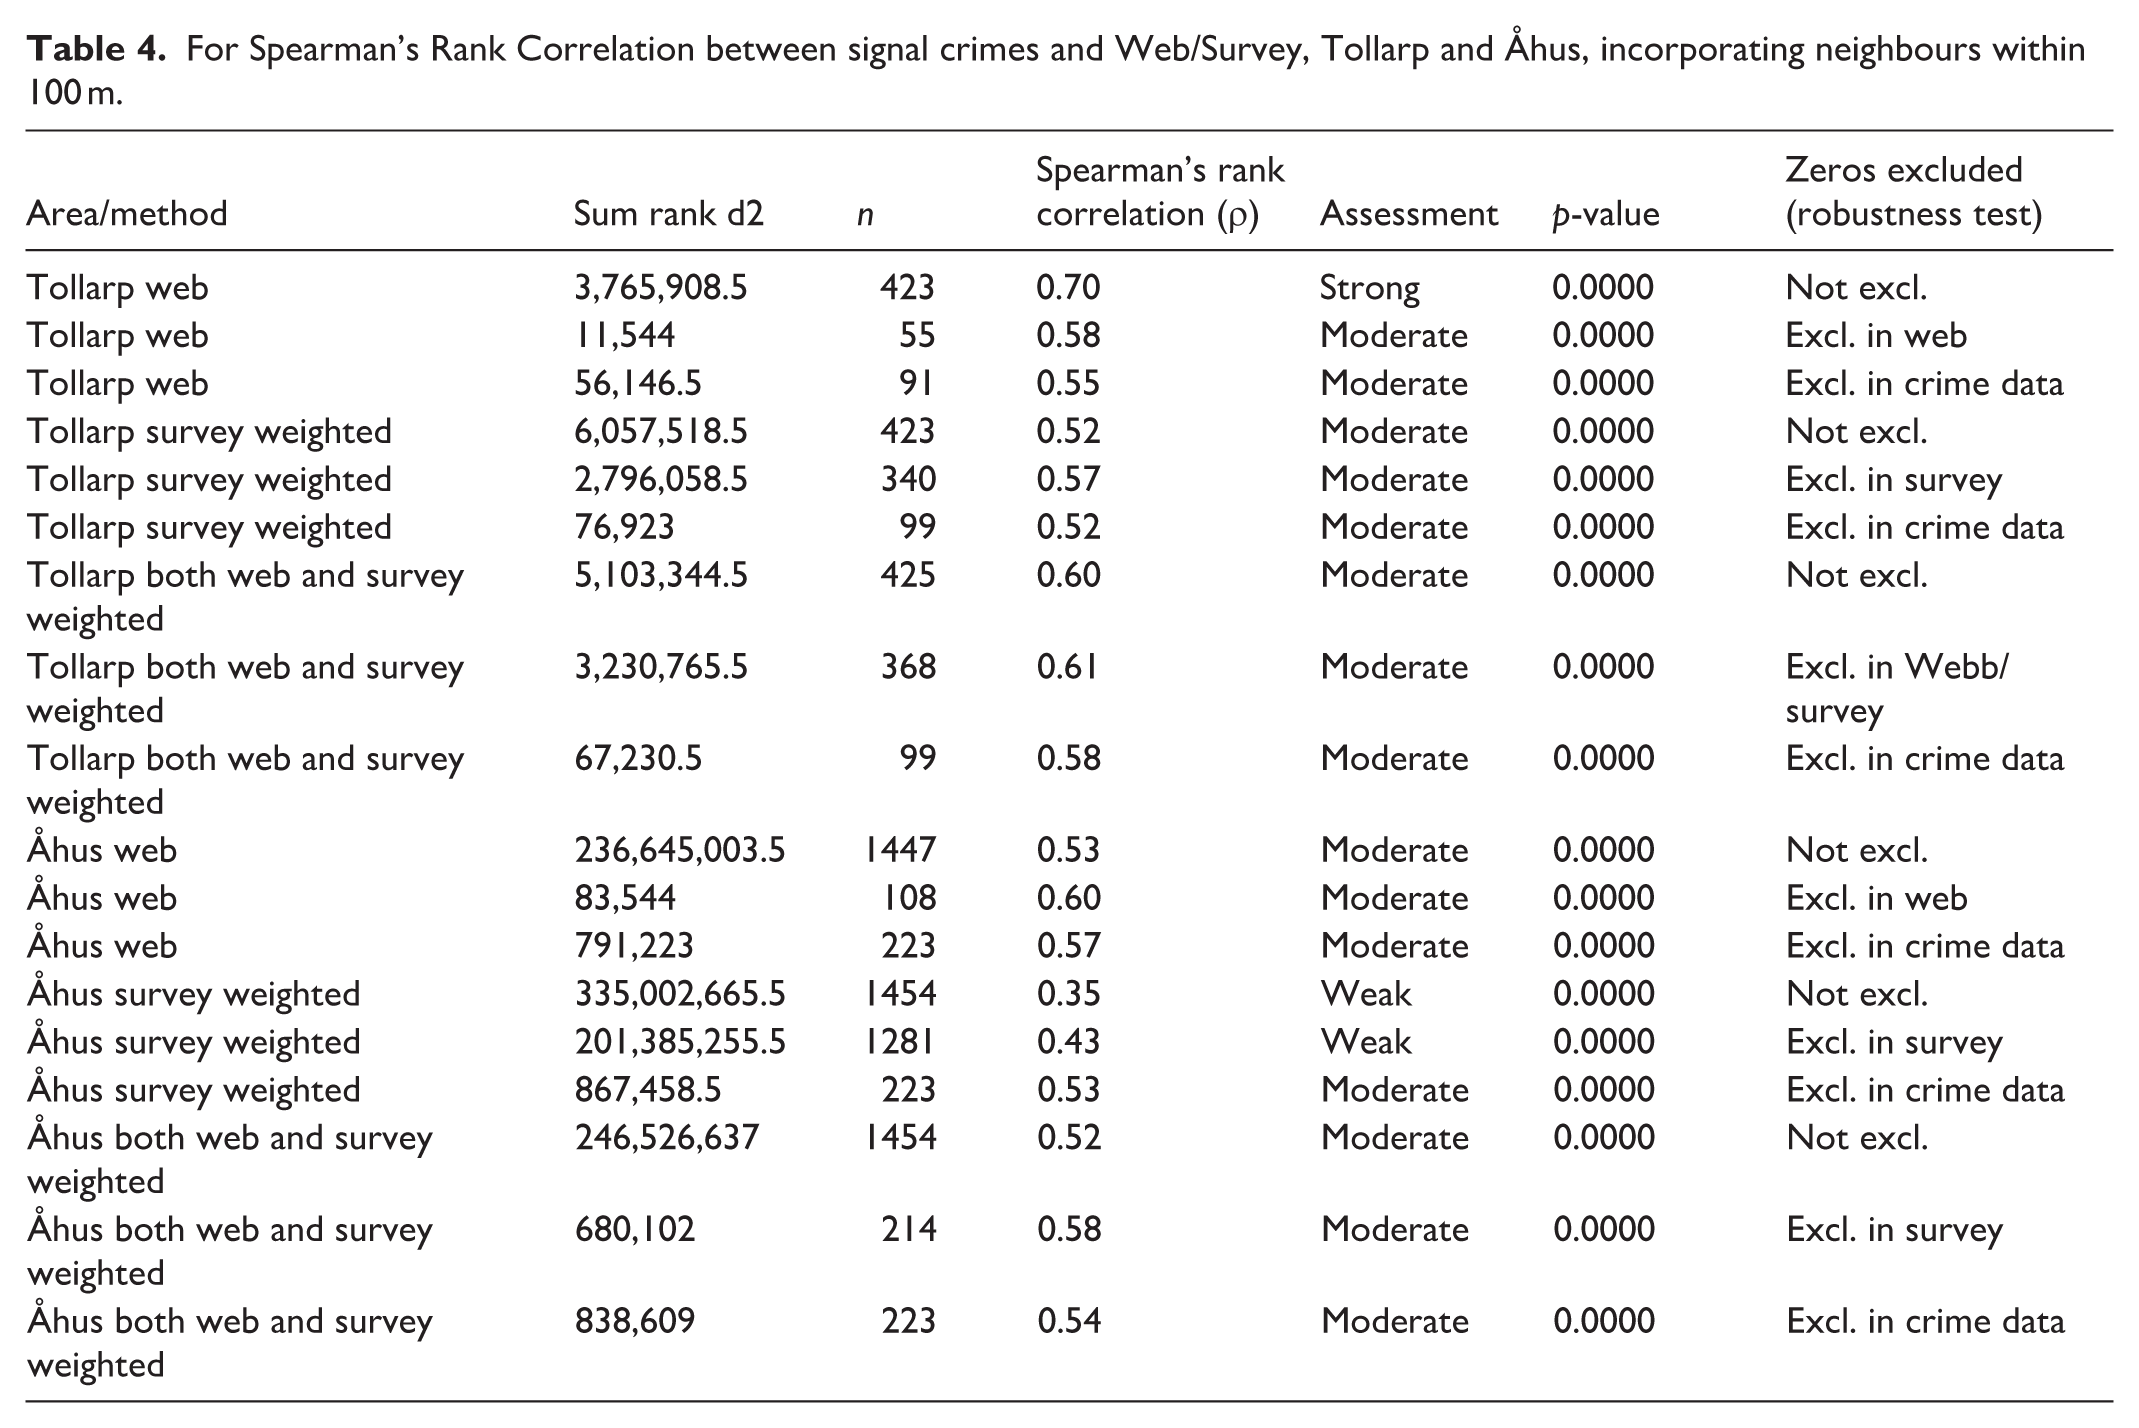
Spearman’s rank correlation was used to assess associations between signal crimes and fear of crime (Table 4), accounting for spatial dependencies by including neighbouring cells within 100 m and excluding zero values as a robustness test. All comparisons show statistically significant correlations. In Tollarp, the correlations range from moderate to strong (ρ = 0.52–0.70), with the strongest found in the full web dataset. In Åhus, web-based data shows moderate correlations (ρ = 0.53–0.60), while survey data yields weaker associations with signal crime (ρ = 0.35–0.43). When combining web and survey data, moderate correlations are observed in both areas. In Table 4, lower sum rank d2 (summed squared rank differences) values generally correspond to stronger correlations, as seen in Tollarp’s web data (ρ = 0.70), while higher values in Åhus align with weaker associations, particularly in survey-based measures. Figures 5 and 6 support these findings: in Åhus, clusters of crime and fear of crime are more spatially dispersed, while in Tollarp, they are more concentrated and overlapping, indicating a more pronounced spatial relationship between crime and perceived fear, meaning that the spatial correspondence between them appears more consistent and stable across the applied correlation and clustering procedures.
For Spearman’s Rank Correlation between signal crimes and Web/Survey, Tollarp and Åhus, incorporating neighbours within 100 m.
Discussion
Comparing methods for mapping fear of crime
This study seeks to advance scientific methods and understanding related to place-based fear of crime, building on the work of scholars such as Solymosi et al. (2021, 2022). An important contribution of this study is the development and testing of two distinct methods for identifying unsafe locations within the same spatial and temporal contexts in semi-rural environments, enabling an evaluation of their individual reliability. Most studies using web sketch applications rely on convenience samples (Kohm, 2009; Kronkvist, 2022), and to our knowledge, this is the first to compare such a sample with a traditional random survey in identifying unsafe places. Although the methods did not produce identical results, they largely agreed on which areas were perceived as unsafe, suggesting both are reasonably reliable. Notably, the convenience sampling used in the web survey yielded results similar to those from traditional random sampling.
This study, and its focus on comparing methods and results concerning spatial patterns of fear of crime, should be understood within a semi-rural and context-sensitive setting with low to modest levels of crime (Abraham and Ceccato, 2022; Ceccato, 2017), where possible causes of perceived fear of crime may be linked to temporal and seasonal variations, the gatherings of motorised youth during certain periods, poor lighting (Wallhagen and Selander, 2024), and other factors addressed in a parallel study of the same areas (Kronkvist et al., submitted).
Unsafety and crime
A similar pattern is seen in the link between unsafe places and signal crimes. As shown in Table 4, all correlations are statistically significant, though their strength varies depending on method and exclusion of zero-value cells. Overall, unsafe places tend to align with crime locations, though not always. Some variation may stem from measurement errors in both datasets, as highlighted in previous research (Gerell, 2018). Another way of explaining such a discrepancy can be that fear of crime often is related to incivilities and disorder even in the absence of more serious crime (Guldåker et al., 2024). A related result can be identified in different studies by Author et al., with a central city park being one of the highest ranked unsafe places in the city, while not being a particularly crime prone location (Kronkvist et al., 2025b). Simply put, some unsafe places appear not to have a lot of crime, whereas others do.
Validating participatory methods for fear of crime: Insights and limitations
Over the years, measures of fear of crime have been subjected to critical scrutiny (Ferraro and LaGrange, 2017; Hart et al., 2022; Jackson, 2005). Comparing a web application with digital sketch maps to open-ended survey questions requires moving beyond a simple strengths and weaknesses approach. By evaluating these methods through key methodological dimensions such as validity, reliability, and usability, we can gain a clearer understanding of how each contributes to capturing spatial and experiential aspects of fear of crime. Importantly, assessing them not only individually but also in combination may reveal how they complement one another in more robust and inclusive research designs.
Validity of such a test can be broken down into several dimensions, related to content and ecological aspects (Schmuckler, 2001; Sireci, 1998). The web application offers spatial precision but risks ambiguity, a mapped point may represent either a specific spot or a wider area. Its ecological validity is limited by the exclusion of digitally marginalised users. Reliability may also be affected by technical issues such as difficulty deleting points or inconsistent performance across devices, and results may vary depending on timing and location. From a practical utility perspective, it is easy to distribute and enables direct spatial visualisation, but it lacks place labels and may be unintuitive for some users.
In contrast, open-ended survey responses offer richer information and stronger content validity, though they lack geospatial precision. Ecological validity may be weakened by low response rates in postal formats. During analysis, textual descriptions of unsafe places were interpreted not only as points but also, when relevant, as routes (lines) or areas (polygons). While this approach offers spatial flexibility, it is also subject to validity threats related to participant subjectivity, the geocoding process, and the weighting procedure. The transition from a written location in an open-ended question, to the actual place a participant has in mind, and finally to its spatial representation, may vary to a greater or lesser extent (Kronkvist, 2022). Another challenge to the study’s internal validity concerns linguistic exclusion, as only the second survey was available in both English and Swedish, which may have limited the representation of non-Swedish-speaking residents and could have had a minor influence on the overall spatial patterns.
Nevertheless, the results from the current study indicate that reported unsafe locations are largely consistent across the two data collection methods, suggesting that these issues may not significantly affect the overall findings. Another issue concerns user experience and accessibility, both of which may influence the quality of the collected data. The web application can be technically challenging to use, especially on mobile devices, and the absence of place names forces researchers to infer locations from coordinates alone. It also risks excluding users with limited digital access. Each method presents trade-offs between usability, inclusiveness, and interpretability. While combining spatial inputs with narrative detail offers balance, depth, and precision, a web-based convenience sample provides a cost-effective alternative with results comparable to a traditional survey. Another validity concern highlighted in this study is representation across age groups, as the higher average age in the data collection techniques results in younger individuals being underrepresented, and targeted surveys in schools and workplaces could help reach a broader age range.
Future research
Future research should build on how participatory mapping methods can be integrated with real-time environmental data, seasonal dynamics, and qualitative insights from local stakeholders. Longitudinal studies could also examine whether interventions at identified hotspots influence both crime and perceived safety over time. Future research could examine why respondents identify the same locations as unsafe and whether both areas are perceived as insecure for similar or different reasons. This would clarify whether the two methods capture fear of crime in the same places for comparable motivations or not, an issue not analysed here due to the study’s focus on spatial data, but one that is partly addressed in a parallel study (Author, submitted).
Conclusion
This study sets out to (1) compare how different data collection methods manifest the geography of fear of crime, (2) examine the relationship between fear of crime and crime hotspots. The results show that fear of crime is distinctly clustered in both semi-rural areas, regardless of whether it is mapped through a web application or open-ended survey responses. Both methods identify largely the same unsafe locations, and statistical tests reveal moderate to very strong correlations between them, confirming that citizens consistently perceive certain micro-places as unsafe. These clusters often overlap with crime hotspots, particularly around central gathering points. However, some places show fear without crime, suggesting that perceptions are shaped not only by objective risk but also by social and environmental cues.
Regarding the methods used, the web tool offers efficiency and spatial precision, whereas the survey provides interpretive depth. Both methods for collecting data on unsafe places appear relatively effective, as the findings indicate that a web-based convenience sample can yield results comparable to a traditional survey, supporting the use of cost-effective approaches for mapping fear of crime and informing prevention strategies in both rural and urban areas.
Footnotes
Appendix: 1 Script for calculating Spearman rank correlation
from scipy.stats import spearmanr, rankdata
Acknowledgements
Thanks to Länsförsäkringars Research Fund and research assistants Ellinor Andersson, Linda Weichselbraun, Carl Ursing, Tove Strömberg, Ellen Alvemalm and Isak Lundgren for data collection and survey preparation, and to research assistant Lars Güettler for coding responses. We are also grateful to Kristianstad Municipality and the Police for their commitment and professional contribution.
Funding
The authors disclosed receipt of the following financial support for the research, authorship, and/or publication of this article: This work was supported by Länsförsäkringars Research Fund under Grant number 2022/01/003.
Declaration of conflicting interests
The authors declared no potential conflicts of interest with respect to the research, authorship, and/or publication of this article.