
Abstract
This article focuses on the use of a participatory social network mapping method with family carers. This is one of a suite of methods developed in a 5-year qualitative multi-centre project exploring how neighbourhoods support, enable or disable people with dementia and their families to live well in their communities. The article considers how mapping provides insights into family support networks, revealing the fluidity of support and care within relationships as well as providing opportunity for individuals to represent the complexities of their relationships with more and less significant others. However, the potential offered by the approach goes beyond those of visual representations of networks and contacts. Paying attention to the co-production process, as well as the reflexive dialogue that emerges in the exchange between researcher, participants, and the maps themselves, we consider how the maps emerge as affective artifacts, weighted with emotion.
Keywords
Introduction
Social scientists have long been interested in understanding kinship and social ties within communities. Such work has explored the ways in which individuals live out their everyday lives through their personal relationships and connections with families, friends and acquaintances. While quantitative social network analysis has developed sophisticated techniques for understanding the structural components of networks (Bellotti and Mora, 2016), qualitative approaches have grown in popularity, developed to understand the processural, experiential and emotional dynamics that play out in the formation and maintenance of ties with others (e.g. Fontaine and Bott, 1969; Heath et al., 2009; Morgan, 1996; Putnam, 2000; Wilson and Pahl, 1988; Young and Willmot, 1965). Aspirations to adequately document and analyse networked connections and processes have encouraged a range of creative ways to gather data on how networks are constructed, maintained, ‘used’ disassembled and experienced, as well as the meanings and values members place on belonging to the groupings and networks being described (Clark, 2009; Bagnoli, 2009; Edwards, 2010; Heath et al., 2009; Pahl and Spencer, 2004; Ryan et al., 2014).
This article contributes to ongoing understanding of qualitatively driven network mapping techniques. It focuses on the use of a participatory social network mapping tool to enable carers of people living with dementia to articulate and reflect on their relationships with others and the role these relationships play in supporting their care practices. In doing so, the article makes three points: first, that participants engage in a reflective sense-making process while producing the maps that are informed by cultural understandings of what it might mean to ‘map’ or diagrammatically represent one’s relationships with others. Second, although the maps provide a glimpse of a network at a particular point in time, they also support the emergence of the fluid and processural properties in accompanying articulated narratives. Third, drawing on the concept emotional reflexivity (Burkitt, 2012), the maps materialise through the reflexive dialogue that takes place between participant and researcher, and in doing so, do not just reflect back, but also reorientate ongoing dialogue that prompts additions and revisions to be made to the maps themselves.
The article proceeds as follows. We briefly review existing examples of social network mapping techniques as applied in qualitatively driven contexts, noting the ways in which particular approaches influenced our own approach. Then we outline the way in which a participatory social network mapping approach was developed in our work exploring locally situated lived experiences of people with dementia. The third part of the article considers how participants interpreted our request to produce a network map as part of a wider set of culturally informed understandings and competencies. In the final part of the article, we reflect on the emotion work that went into producing the maps and suggest that the maps offer more than abstract representations, and have the potential to reveal glimpses into the affective realities of emotionally charged relationships.
Existing approaches to qualitatively driven network mapping
A number of studies have used social network mapping from a qualitative perspective (Phillipson et al., 2004; Ryan et al., 2014). In a article in this journal, Ahrens (2018) demonstrated the utility of the qualitative network mapping method to understand the meanings of networks for individuals. Ahrens summarises a set of techniques for qualitative network mapping, including ‘free-style’ drawings and the ‘method of concentric circles’ (Kahn and Antonucci, 1980). In the first approach, individuals are free to illustrate however they choose their views on their personal networks. In the second, participants are offered more guidance, receiving ‘a piece of paper with a limited number of concentric circles [and a]… fixed definition of the circles or sectors of circles, for example, family, job, and friends’ (Ahrens, 2018: 3). Both the approaches are based on the premise that encouraging participants to not just talk about, but also to document or visualise, their relationships and contacts with others, can enable a more authentic representation of their structural and experiential complexities. Indeed, this was one of the reasons that we developed a qualitative and participative approach in the work we describe here, taking our cue from a core collection of studies that have also sought to better understand the qualitative properties of social networks.
First, Pahl and Spencer (2004) and Spencer and Pahl (2006) adopted a person-centric approach in their exploration of the variety of friendships in their participants’ lives. Using a person-centred technique, they encouraged participants to consider their relationships through a diagrammatic series of concentric circles emanating outward with the interviewee at the centre, accompanied by commentaries on who was included and missing across the life-course. In doing so, they illustrate how the mapping can reveal insights into an individual’s dispersed personal communities, such as their composition of many smaller networks, as well as the ways in which different groupings take on particular referential qualities associated with labels such as ‘friends’ or ‘family’.
Second, Clark (2009) explored the meanings of neighbourhood and network ties for residents within a particular geographical boundary and used a range of methods to illustrate the multi-dimensionality of neighbourhoods and communities and document the ‘complex relational social processes’ that make up the ‘doing and living of neighbourhoods’ (p. 2). Rather than proposing predetermined categories, they encouraged participants to map out, in their own ways, the different kinds of networks they belonged to. Bagnoli (2009) began from a similar position, using a mapping technique that provided individuals with the ‘space to construct their own representations’ of their networks (p. 555). As Clark (2009) and Bagnoli’s (2009) participants developed their maps they were used as elicitation devices to encourage more detailed articulation of the meanings and histories of the relationships. Bagnoli (2009) suggests that the mapping gave participants a chance to consider relationships in new ways and enabled information to be elicited that may have not been shared otherwise. Meanwhile Clark (2009) argues that participants go beyond the description of their social networks when using this method, to begin to theorise their networks and relationships in ways that enable the approach to move beyond a technique of data collection, to also include aspects of participant-led abstraction.
The final approach that influenced our thinking was that developed by Heath et al. (2009), who asked participants the names of those who influenced their decision-making in the context of making educational choices. This work offers insight into the complexity of the roles network members play in individuals lives, operating within given social contexts and with recourse to small-group dynamics, but also in ways that are malleable. Heath et al. (2009) note the partial rather than ‘achieved’ status of the networks being explained, and which are unable to account for the totality of an individual’s network, frequently omitting individuals and groupings that might exist in a network’s shadow (p. 469). They comment that it is not possible to make assumptions about the value of relationships either in the achieved network or those left out, with networks ‘altering in shape and texture over time’, including, we suggest, at the point at which data about such networks is collected (p. 657).
The approaches described here demonstrate the utility of mapping methods to elicit narratives and visual depictions that represent the complexity, fluidity and multi-dimensionality of social networks. In our own work we built on these ideas in three ways. First, although we begin with an individual participant, potentially encouraging ego-centric understandings, we deliberately avoided proposing any predetermined categories or groupings that may limit opportunities to understand the fluidity that cross-cuts the categories of, say ‘family’ or ‘friends’. Second, our focus on issues of care and support lends a degree of structure to our conversations with participants providing a way into a potentially messy world of endless contacts and relationships. Finally, our interest in the dynamic and processural ways in which networks operate and emerge in different contexts, we explicitly avoided attempts to organise individual ‘nodes’ on the networks in terms of, for example, orders of relative ‘importance’, ‘usefulness’ or ‘closeness’.
The research context and method: mapping relationships among carers of people living with dementia
The mapping technique was developed as a part of a project exploring the locally situated, lived experience of people with dementia and their care partners. There are strong associations between living with dementia and social isolation resulting from social stigma as well as the cognitive impact of the condition on memory, communication and orientation (Kane and Cook, 2013), while for carers, increasing time and responsibilities associated with care can make the ongoing maintenance of social connections challenging (Brodaty and Donkin, 2009). The result can be a ‘shrinking world’ in which maintaining access to social and physical realms beyond the home becomes difficult (Ward, Clark and Hargreaves, 2012; Brittain et al., 2010; Duggan et al., 2008; McShane et al., 1998). One result of a ‘shrinking world’ phenomenon may be an increase in the importance placed on local social and spatial connections to provide day-to-day practical support, including neighbourhood spaces (Ward et al., 2018; Keady et al., 2012). It was in this context that we sought to investigate how carers of people living with dementia perceived their social connections, and the context of their care responsibilities, particularly as understood in the context of neighbourhood spaces. The work formed part of a larger body of research investigating the meaning of neighbourhoods for individuals affected by dementia. There are 850,000 people living with dementia in the United Kingdom, many of whom continue to live in their own homes, supported by family, friends and health and social care services. The research is understanding how those affected by dementia experience their local neighbourhoods and exploring the ways in which local places might better support people living with dementia and their care-partners across three locations in England, Scotland and Sweden.
People living with dementia and a nominated care-partner engaged in three methods of data collection: walking interviews, participatory social network mapping and home tours. Participants were recruited mainly through third-sector support groups in Scotland and England, and through health and social care services in Sweden. Ethical approval was obtained for the research across all three settings via the applicable ethical governance systems in each locality, including the NHS Health and Social Care panel (REC reference: 15/IEC08/0007).
This article focuses on the development of a social network mapping approach within England and Scotland. It draws on 44 maps produced by 44 family carers of people living with dementia. The family carers ranged in age from their forties to their late eighties. We adopted a longitudinal approach, conducting a network mapping activity in the first phase of data collection. We then returned to 33 of these family carers up to 12 months later to discuss any changes that had occurred in their life, and in their social networks during this period. Participants were asked to revisit the network map that they had already produced, and were given the opportunity to annotate any changes onto the original map.
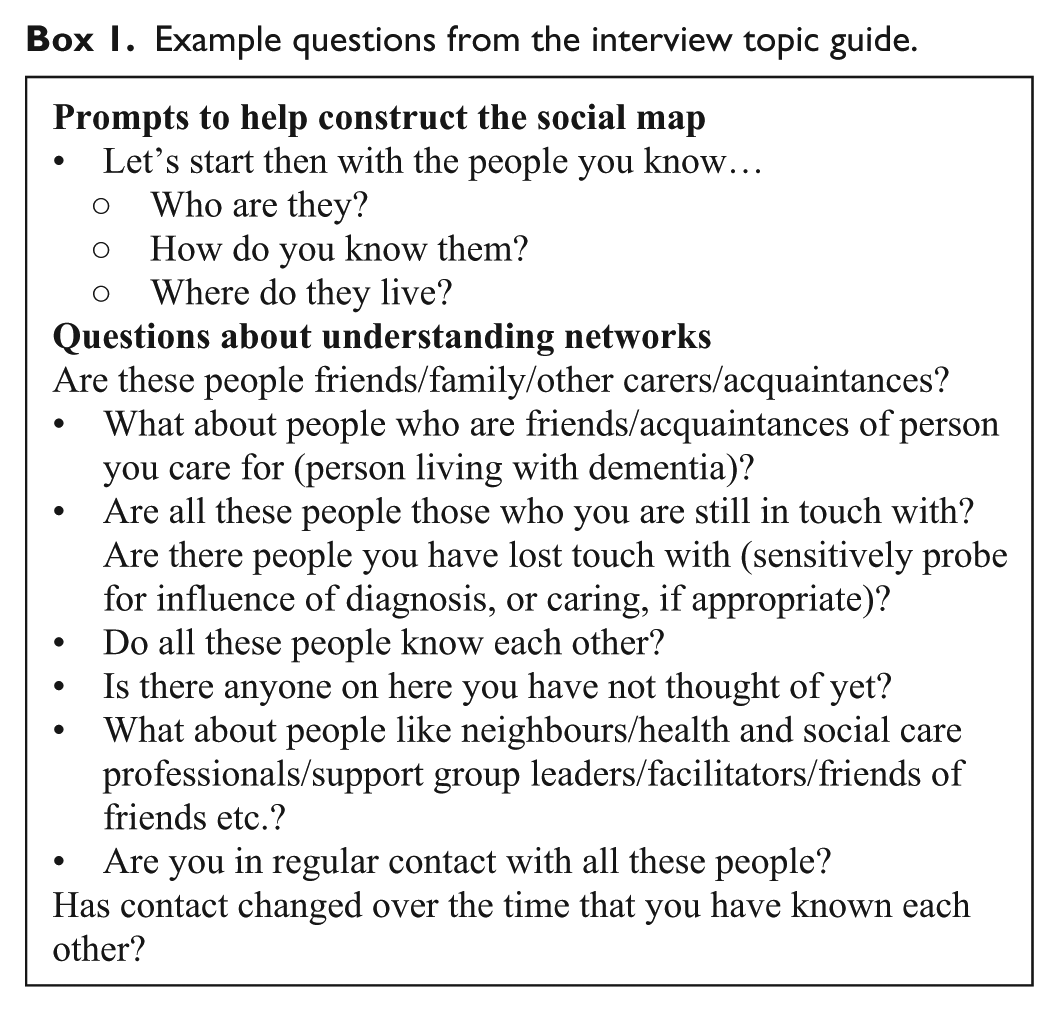
During the mapping activity, a principal carer of a person living with dementia was asked to ‘map’ their network and tell us about the people they have relationships with, who they saw on a regular basis, who supports them and in what way. We avoided offering prescriptive instructions on how the networks should be constructed, though we did provide some guidance when introducing the method to help orientate participants to the task. We ensured that participants understood that they may include support that was not only individuals but could include groups or organisations and even family pets. The map was then used for the purpose of elicitation during the interview encounter. For example, when a participant gave a name, we would then ask further questions about that person and their relationship with the participant. Box 1 provides examples of the kinds of questions asked during the mapping process and interview. All interviews were audio-recorded and transcribed ‘intelligent verbatim’.
Example questions from the interview topic guide.
In the subsequent parts of the article we outline how participants engaged with the request to map their networks. The maps that are presented in this article have been anonymised and pseudonyms have been used, they have also been copied into a readable ‘writing font’, however, the mapping styles and any emphasis on the maps have been replicated faithfully to the original version.
The structure and representation of the maps
Herz et al. (2014) consider the visual representation of a network map as being central to how subsequent analysis is undertaken. They have produced a set of structures as a basis for analysis: ‘structure-focused’ maps which investigate how ties are clustered or ordered; ‘actor-focused’ maps which consider the types of connections; and ‘tie-focussed maps’ which initiate an investigation of each individual tie. In doing so, they offer a possible typology of different ‘sorts’ of network maps. Although given a relatively free-reign to develop maps however they preferred, our participants produced maps that took one of three forms: a family tree type diagram (see Diagram 1); as a list often organised into categories (see Diagram 2) or as a spider diagram that had either the participant as a starting name, the couple/dyad, or the person living with dementia and then used lines and arrows that connected the name in the middle to others on the map (see Diagram 6a). In doing so, they take on the properties of culturally recognisable ways of presenting some types of relationships.
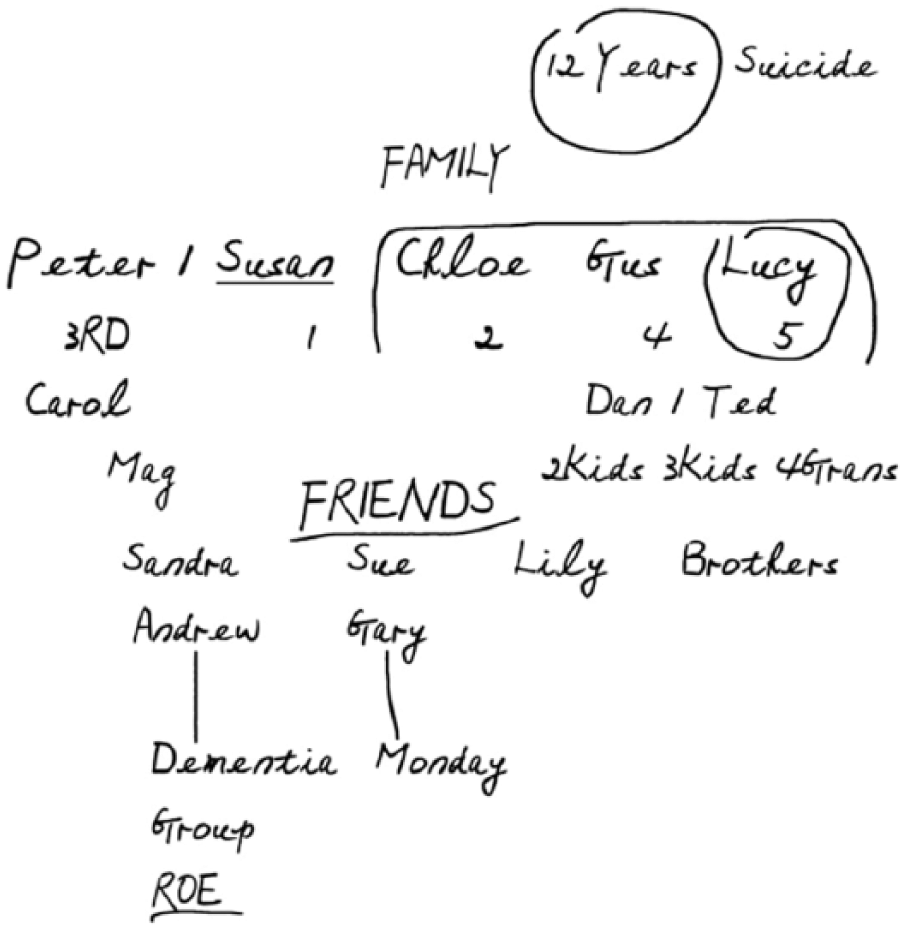
Map by Danny.
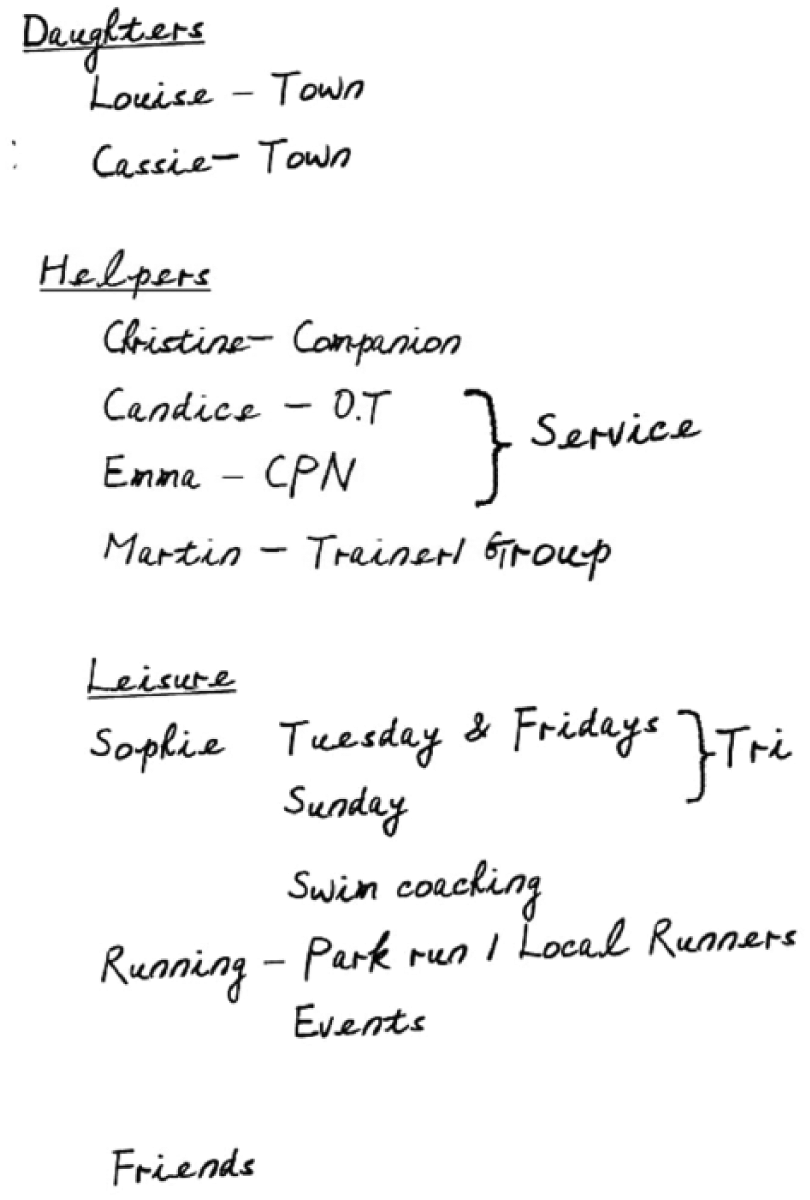
Map by Mark.
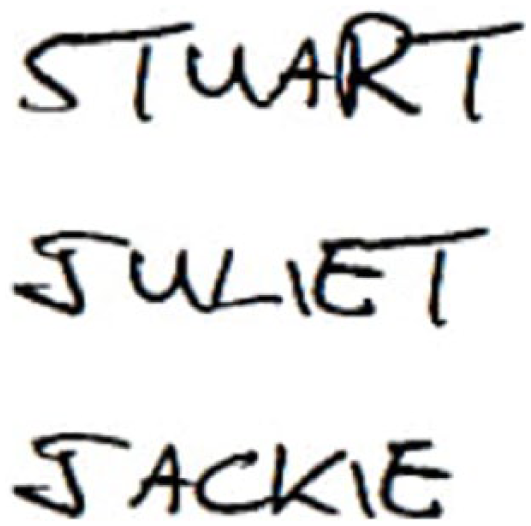
At the same time, and despite our insistence that we were not interested in assessing mapping skills, the maps are also influenced by the confidence and competencies of participants in terms of their abilities to write and create diagrams, and were linked to participants’ own cultural repertoire with regard to their understanding of what we meant them to do. Sometimes, participants would clarify meanings and understandings about what they were being asked. In this extract the interviewer suggested that Julie write down the name they had been discussing:
So do you want to put him…do you want to put him on the diagram and we’ll see who else?
Do you want it like a family tree?
Yeah, you can, however you want to draw it…
The forms the maps took illustrate how participants position the activity in their own cultural understandings of how network diagrams might look. Several found it helpful to think about their relationships in terms of a ‘family tree’ because this offered a culturally familiar representation of how relationships in families are represented. These participants frequently began with family relationships before expanding their ‘tree’ diagram to include others in their lives.
Others were concerned about their ability to draw a map at all, asking the researcher to draw for them. A number of participants were self-critical about their ability to manage the writing and talking or their understanding of what was required, possibly heightened by being in the presence of a researcher; one participant, Barb stated: I’m not very good at writing… [laughs] … Yeah, I know what to write down, but my brain…my brain, my brain’s faster than my writing.
Another participant, Hughie said: First of all, as a starter, I’m an absolute terrible speller.
As others have noted (Ryan et al., 2014), many participants needed encouragement to begin the process of writing expressing concern about ‘doing it right’. This could be considered a limitation with the method, however, most participants were able to take part in some kind of ‘mapping’ activity, once they were reassured and the process began. As the participants began the task and their reticence had subsided, they could begin to think about their networks in organised and complex ways. For instance, Simon began to annotate how the different individuals assumed different levels of significance that resulted in a list-like diagram, making conscious choices about who would go ‘higher’ or ‘lower’ on the list given criteria he developed during the course of the mapping. In doing so, he began to sense-make as he went on to construct his network map.
Participants used the technique to consider the structured nature of their routines and when they would see particular individuals or attend groups, giving rise to their own analysis of the temporal nature of their relationships. Some considered the particular role or relationship that they had with the network member and how this had changed or might change in the future. For instance, Danny used numbers to show the order of who they would turn to first for help if they needed it (Diagram 1; Map style: Family Tree).
Danny gave numbered names on their map as 1–5; Susan is given as no.1 to Lucy being the fifth named person for support. Others, like Mark, grouped network members into categories such as ‘helpers’, or ‘leisure’ activities (Diagram 2; Map style: Categorised list) which resulted in them being organised into social domains at the point of map making telling us something about the relationships within the networks and how they provide different kinds of support or connections. For the participants, this process may have been the first time that they had considered how others in their lives were drawn on in this way.
The process enables the co-production of maps that illustrate how support is categorised with regard to the types of help and care received, whether that be practical or emotional support. Some participants created a list which included the names of groups and organisations rather than naming individuals, indicating that it is the group or the nature of belonging to the group that elicits valuable support in these instances. They also revealed members of their network that were not included in information sharing because participants did not want to burden them, including, for instance, adult children who ‘had their own lives to lead’. Participants are thus not simply listing names on paper here, but are also categorising those names according to the nature of the care and support that they offered. In doing so, the maps imply knowledge about meaningful networks of care and sociability. Kittie’s map (Diagram 3; Map style: Family tree), for example, includes aspects of her new life engaged with dementia groups such as the dementia café and singing group.
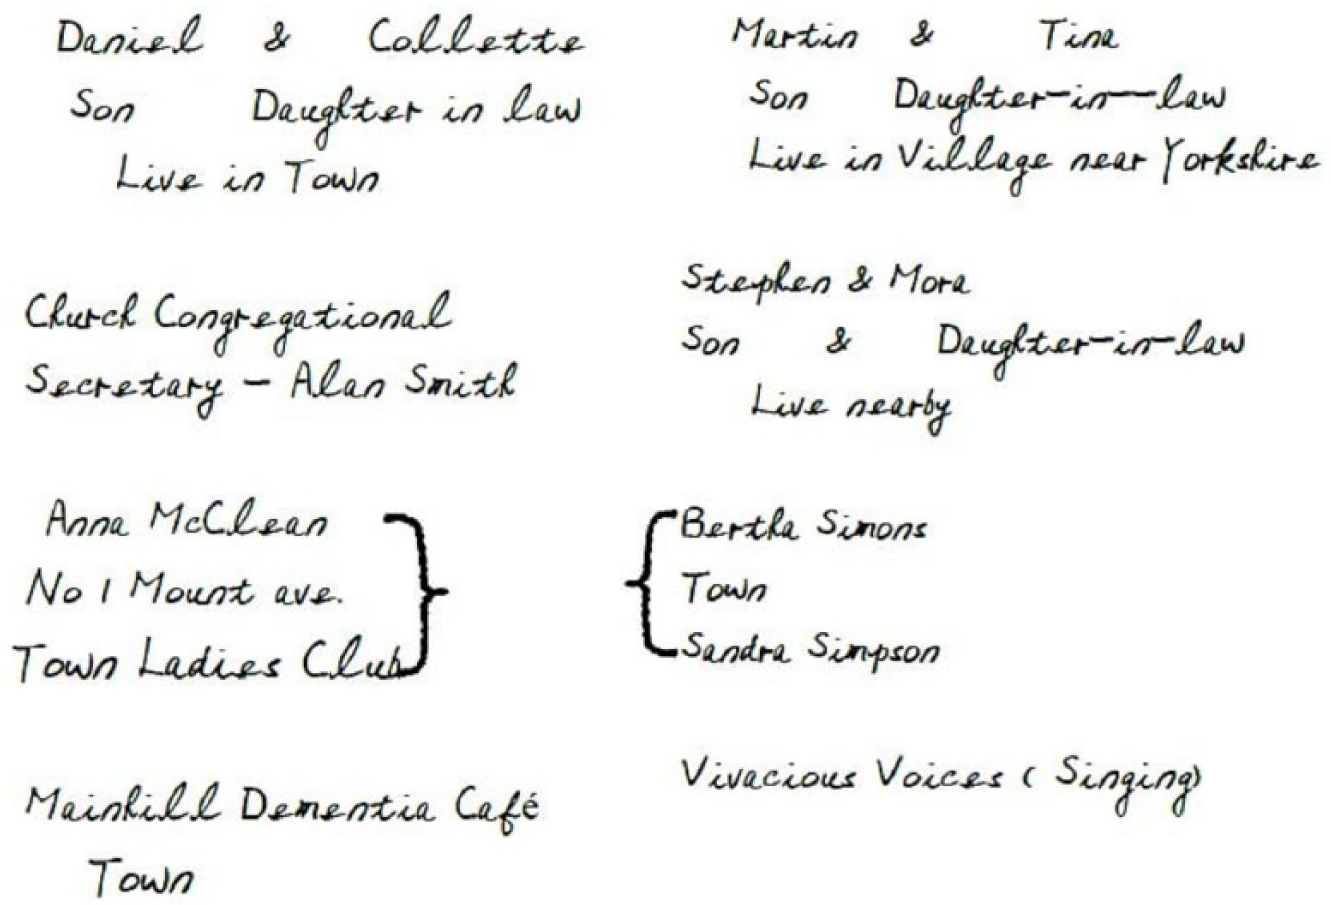
Map by Kittie.
Kittie also continues to attend a Ladies’ Club that she has been a member of for more than 50 years. Many of the maps are categorised into different kinds of support and social groups although these are not always separate categories and support crosses over into more than one category. In Kittie’s map the brackets she has drawn show how some of the people who are a part of the Ladies Club are also named as individuals. These two individuals are significant enough for Kittie to be explicitly named, because their relationship extends beyond the social domain initially attributed to. So, relationships are not fixed into one category, friendships blur into other types of relationships.
The mapping process is premised on their capacity to act as elicitation devices, revealing insight as participants strive to articulate their reasons for the categorisation and structural forms they plot (Ward et al., 2018; Morrow, 2004; Ryan et al., 2014). Josephine (Diagram 4; Map style; Temporal List) mapped out the week and who she spent time with on each day of the week, which offered some insight about how her time was allocated within her caring role but how she also maintained some relationships and connections that were linked to other aspects of her life and identity such as attending church and time spent with her sister.
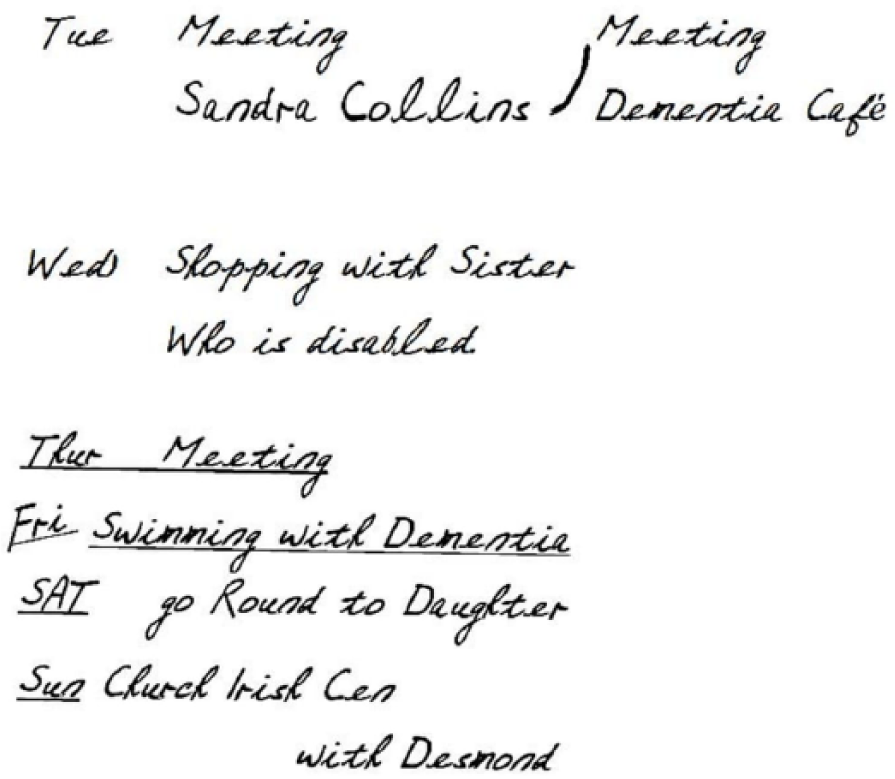
Map by Josephine.
The dynamic nature of lived networks
We now consider the ways in which the maps attempt to represent something of the lived nature of networks. By this we mean their existence in states of flux, partial rather than achieved (Heath et al., 2009), and never entirely satisfactory representations of the messy and complex realities that their creators hoped to depict. Of course, relationships are never completed and reflect the temporality of networked life. As they evolve and change with social contexts, so some participants attempted, albeit not always successfully, to depict this diagrammatically. Through the course of their production, some the maps would expand and contract as participants talk through their meanings, becoming somewhat indecipherable as visual depictions. The maps are boundary-less, with the potential to take on more, or fewer, individuals and groups.
For example, Elsie explained the complex arrangement of intergenerational support they provide for their grandchildren. She outlined how she and her husband make a journey each week to collect their grandchildren from school and take them back to their daughter’s house and provide tea for them. They describe the support they provide to their working lone-parenting daughter, as being invaluable, as they travel by bus to their daughter’s house to care for their grandchildren. Recently the arrangement has become more complex, requiring the support of two mothers from the grandchildren’s school to help make things easier for 80-year-old Elsie and her husband, bringing in a cluster of socially distant, but essential individuals into her network. This kind of setting up of support takes time, and is intricate in its detail, as Elsie describes: Well, I go and pick [name] up, the youngest one, he’s nine so he’s still at primary, and what I do… well, at the moment while my leg’s bad a couple of the mothers help out and they pick him up from school and bring him to [daughter’s] house, I just go up to her house. Because she lives… I don’t know whether you know [name of place]… She lives just on the road opposite there. So it’s [name] the eldest boy, said, ‘Nana, I’ve done it into miles and I’ve checked it for you so you’re walking two miles a day’ going up to school and then bringing him back. So, anyway, a couple of the mothers said, ‘Don’t come, we’ll’… they live nearby, ‘We’ll drop [name] off on the way home for you’. So I just go up and then make their tea and make sure there’s someone in for them to come home.
The support described provides us with an understanding of the complexity of family relationships and of support systems within participants’ networks. Time and again, participants explained how they assisted their working age children with childcare (Arber and Timonen, 2012) and this has long been the case, particularly among the working classes because of the need for unpaid caregiving (Clavan, 1978). It cannot be assumed that it is only children who provide assistance for their aging parents without receiving support back, yet the bidirectional nature of this support was rarely depicted easily on the network diagrams.
Elsie’s network map (Diagram 5; Map style: list) does not show the complexity of this support system nor the extended web of relationships that have become involved in making the situation easier. Instead, it is through Elsie’s articulation of the map-making process that the complexity of her relationship with her children, her grandchildren, and others emerges. Elsie found it difficult to ‘map-make’ and talk and stopped writing on the map after writing down the names of her children. She had a debilitating condition, which affected the use of one of her arms and made the map-making and writing a particularly difficult task. In this case without the narrative, a name on a map or even the number of times recorded that they visited their daughter could not have captured the effort and depth of care that this couple willingly give to their child and grandchildren because ‘there is no-one else to do it’. To echo Emmel (2008) then, it is not always possible for map makers to illustrate the complexity of the relationships that they discuss, though the maps can support the elicitation of these detailed narratives. More specifically, the maps have to be understood within the context of their production. Storying the complex and dynamic relationships that make up the lived network can thus overcome some of the limitations of mapping as a primarily visual depiction.
Map by Elsie.
Emotional reflexivity and the creation of affective maps
That the network maps need to be understood alongside the narratives that accompany them is not a new observation. Going beyond this though, our contention is that the maps are not neutral subjects of discussion but rather imbued with meanings and emotions that shape discussions about them and drive their ongoing development. We suggest that the maps have particular affective qualities. In other words, we think that they ‘do’ things. In this final section, we consider this idea with respect to the role that emotional reflexivity plays in the production of the map-making. Much has been written about reflexivity in research, usually with respect to encouraging researchers to consider the positions and identities of all those involved in the knowledge production process in ways that shape the direction and outcomes of research (Coffey, 1999; Finlay and Gough, 2008; May and Perry, 2017). Holmes (2010) has argued that there is a tendency for researchers to provide overly objective accounts, usually from the researchers’ own perspective. In response, she calls for greater acknowledgement of ‘emotional reflexivity’, a process that recognises that participants too will reflect upon their own attempts to articulate their lives in that process (Burkitt, 2012). So, while researchers’ reflections on their relations with research participants has become something of a mainstay of qualitative research practice, this needs to be broadened to include participant reflexivity. Emotional reflexivity is a capacity that participants as well as researchers have, and is ‘the practices of altering one’s life as a response to feelings, and to interpretations of one’s own and others’ feelings about one’s circumstances’. (Holmes, 2010: 61). Emotional reflexivity is interactional and Holmes (2010) has discussed the complexities of how to methodologically research this given the limitations imposed by textual-style analysis or written data, advocating joint interviewing (in other words, with more than one participant) to do this.
While our work did not interview couples together, we suggest that the network maps act as a sounding board against which ideas were developed, and as such, could be understood as a third party in the interaction between researcher and participant. Paying attention to participants’ responses and reflections on the network maps they produced provides scope to think through how emotion shaped both the narratives and the maps produced as a part of the interaction between researchers, participants and, crucially, the maps themselves. In calling attention to how emotion is a motivating factor within reflexive practice, and by putting it ‘back into the context of social interactions and relationships in which they arise’ (Burkitt, 2012: 459), we can begin to think through how emotion can shape the types of knowledge produced in the spaces in-between the researcher, the participant and the network map being constructed. As participants start to unpack the complexities of their relationships as they reveal to us their support networks, then so the maps evolve to take on, and drive forward, some of the emotion involved in reflecting on relationships. For instance, a family carer may mention a name, and the researcher would ask who that person was, and the narrative would begin to be elaborated. On one occasion Kittie talks about the painful loss of her very good friends, who she notes onto the map despite their now absence: Unfortunately, the ones that were really our very, very best friends, both have died… And she used to ring up nearly every morning about half nine. Do you know, it took me a long time to get used to the phone not ringing at half nine.
Another time, Malcolm writes down the name of the dementia support group he attends, the researcher asks him if he would say he had made any particular friends at the group. He begins to consider the group, drawn to be more reflexive in his processing and begins to describe his new friendships at the group. He notes what fuels the connection he and his wife have made: Yeah, I mean, there’s a couple of them who we’re pretty close to, you know, Sal and Trevor, and we have a good… we like a laugh, and it’s nice… Yeah, you’re on the same wavelength.
Here, the researcher and family carer engage in a situated dialogue that unfolds and as it does so the map becomes more developed. The maps begin to take on the participant’s attempt to make sense of the complexities, contexts and relationality of their everyday lives. It is in this context that the maps come to hold something of the emotionality that has produced them.
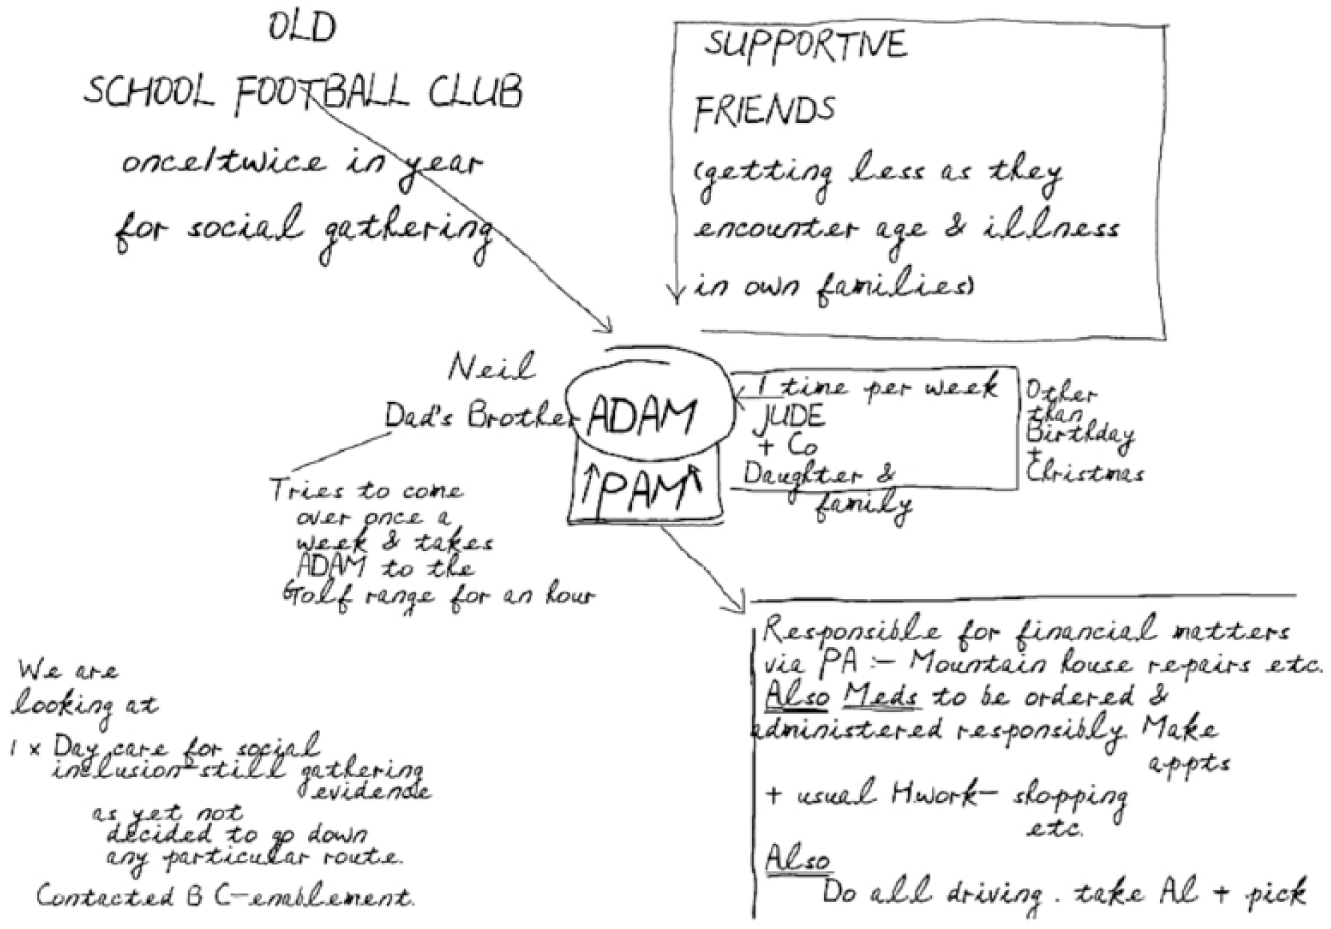
On one occasion, participant Pam produced a network map ahead of meeting with the researcher. Usually the maps are created during the interview dialogue between the researcher and participant and, in this instance, the map produced in advance was a rather ‘neat’ example of a Social Network Map spider diagram. It began with the participant’s husband who was living with dementia written into the middle of the paper and her name with arrows pointing to him, perhaps showing her connection to him (see Diagram 6a; Map style: Spider diagram).
Map by Pam.
Pam agreed to produce a new map while the interview process took place and they agreed, this map took a rather different form, (see Diagram 6b).
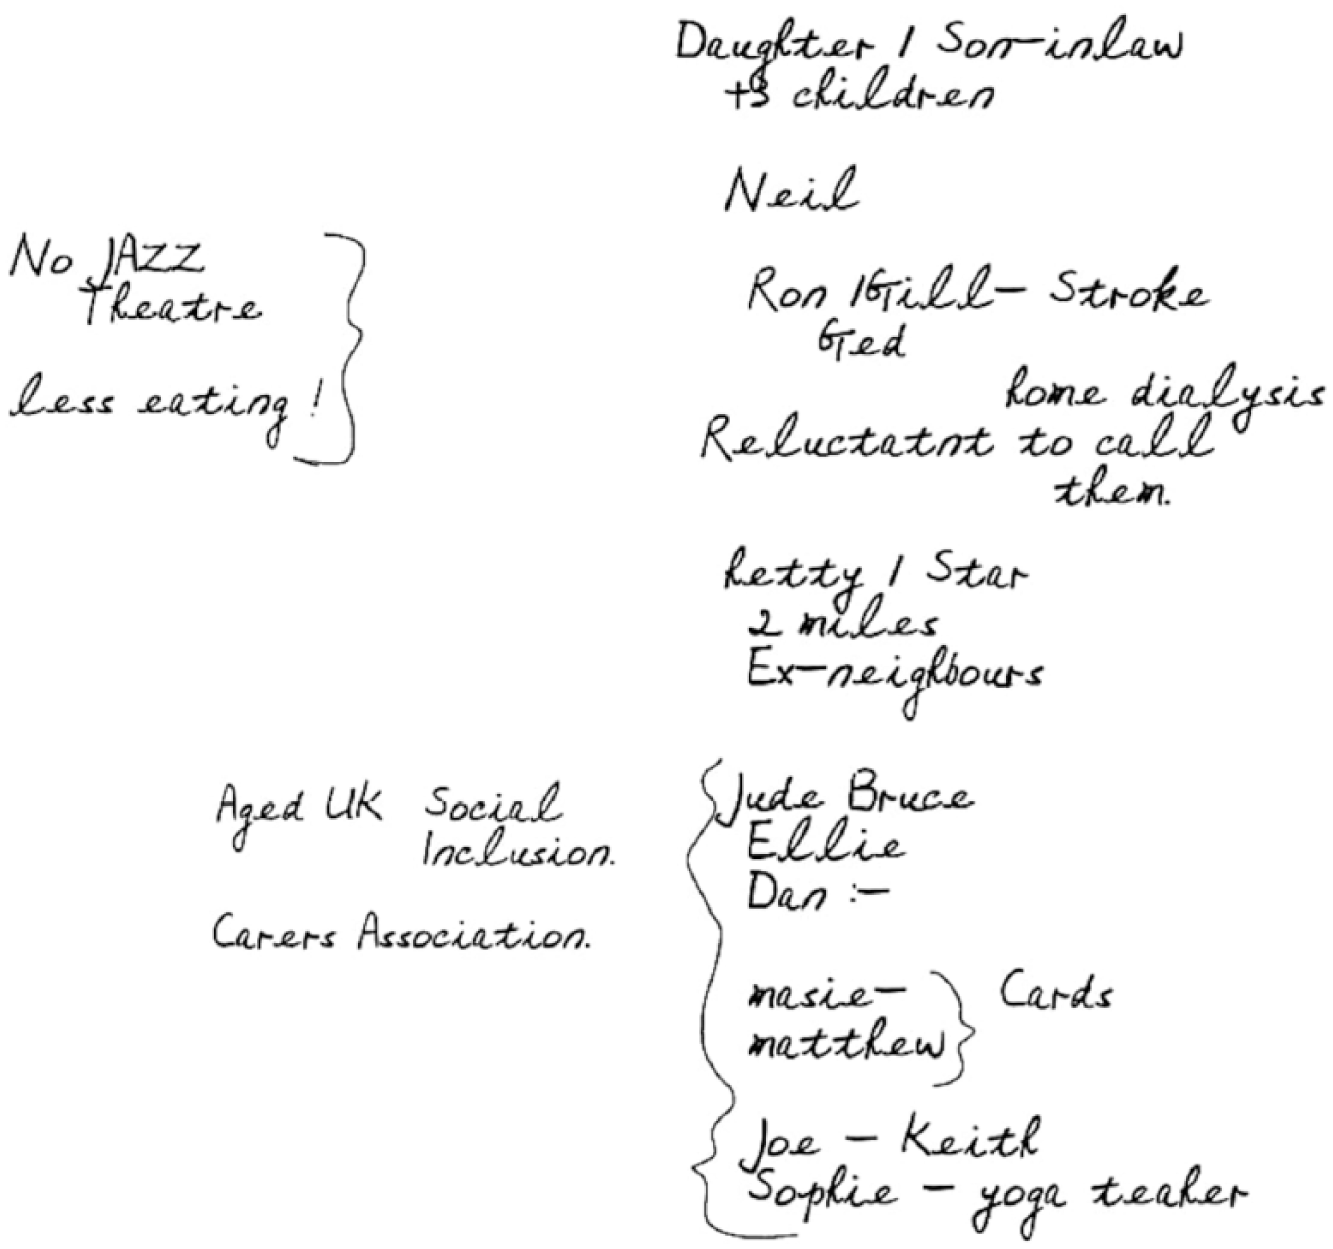
Map by Pam.
It is sparser; no one is named at the centre of the network, it provides names of the relationships being discussed rather than the more neutral explanations of support in the pre-prepared map and it lists relationships within similar groupings, as the participant begins to categorise their relationships. Importantly, it includes some of the emotion onto the page. For instance, as the mapping is in process when the participant refers to some good friends who are themselves struggling with illness where the initial diagram states ‘getting less as they encounter age and illness in own families’ the diagram produced in dialogue states ‘reluctant to call them’. This is arguably a more emotionally charged account of Pam’s relationships.
We suggest that Pam’s second map is created with more emotional engagement, partly because it becomes focused on Pam’s own support needs and relationships through the emotionally reflexive process of the interview. The accompanying narrative is materialised onto the map itself. It is through the relational aspect of the interview and the practice of making the map during the interview process that the method enables us to go beyond a more cognitive reflexive response to our questions and create a more emotional dialogue. The maps can thus be seen as ‘affective artifacts’ 1 (Rafaeli and Vilnai-Yavetz, 2004a, 2004b) not just diagrammatic representations of relationships, but also symbolic of the emotional context and connections to the relationship of care. Rafaeli and Vilnai-Yavetz (2004a) suggest that items and objects made by human production can evoke emotional responses through either their aesthetic value or their symbolic meaning, so implying an affective power or force possessed by objects. We argue that such forces are at play in the production and reappraisal of the maps and can be understood in the context of the emotional reflexivity required to produce the maps, such that the maps themselves take on particular resonance as ‘affective artifacts’ through the emotionally charged, performative work of the method (Ward et al., 2018; Rafaeli and Vilnai-Yavetz, 2004a).
The affective qualities of the maps operate in two ways. The first is during subsequent analysis when as researchers we return to them as items of visual data, we have the tangibility of the map (Emmel, 2008). We see the names and descriptions written by the participant, it acts to facilitate the memory of the research encounter and the relational reflexive process between researcher and participant, evoking ‘the sensoriality of the research encounter itself and concomitant memories and imaginaries’ (Pink, 2009: 4). The map serves as a material reminder of the emotional effort that was required for their creation; the maps then perform to support the researcher to reengage with the emotional and embodied memory of the interview. The second, and arguably more powerful way, is during the map-making process itself. For example, Gayle’s map created during the interview process helped her to reinforce the quality of her network. In reflecting on the map, it evoked an emotional response as she recognised that her world had not shrunk as she had initially thought but had in fact grown because of living with dementia. It was through this experience of reflecting on the map that she recognised this about her network; here Gayle states:
: Okay, looking at it all together, what keeps you going?
: Everything. Her, the dog, she’s my wee family. I said to my mother last night everything I thought I was going to have is gone, and that [map] just tells me I have everything. Sorry [starts crying].
: It’s okay.
: I said to her last night, everything I had, everything I thought I was going to have, is gone. But it’s not.
Gayle in reviewing her map recognises that her relationships have not disappeared in the way she anticipated might happen due to the experience of living with dementia. In fact, she has gained new relationships and has valuable care and support which not only keep her going, but lead her to reflect ‘I have everything’.
Meanwhile Trevor’s map (Diagram 7; Map Style: Categorised list.) is organised into categories, depicting a structure that the participant has evolved during the map-making process. The map includes writing, which illustrates the ‘emotionally reflexivity’ of the interview, the map-making evokes a response that is charged with emotion as he notes his feelings about his complex network of relationships onto the map itself.
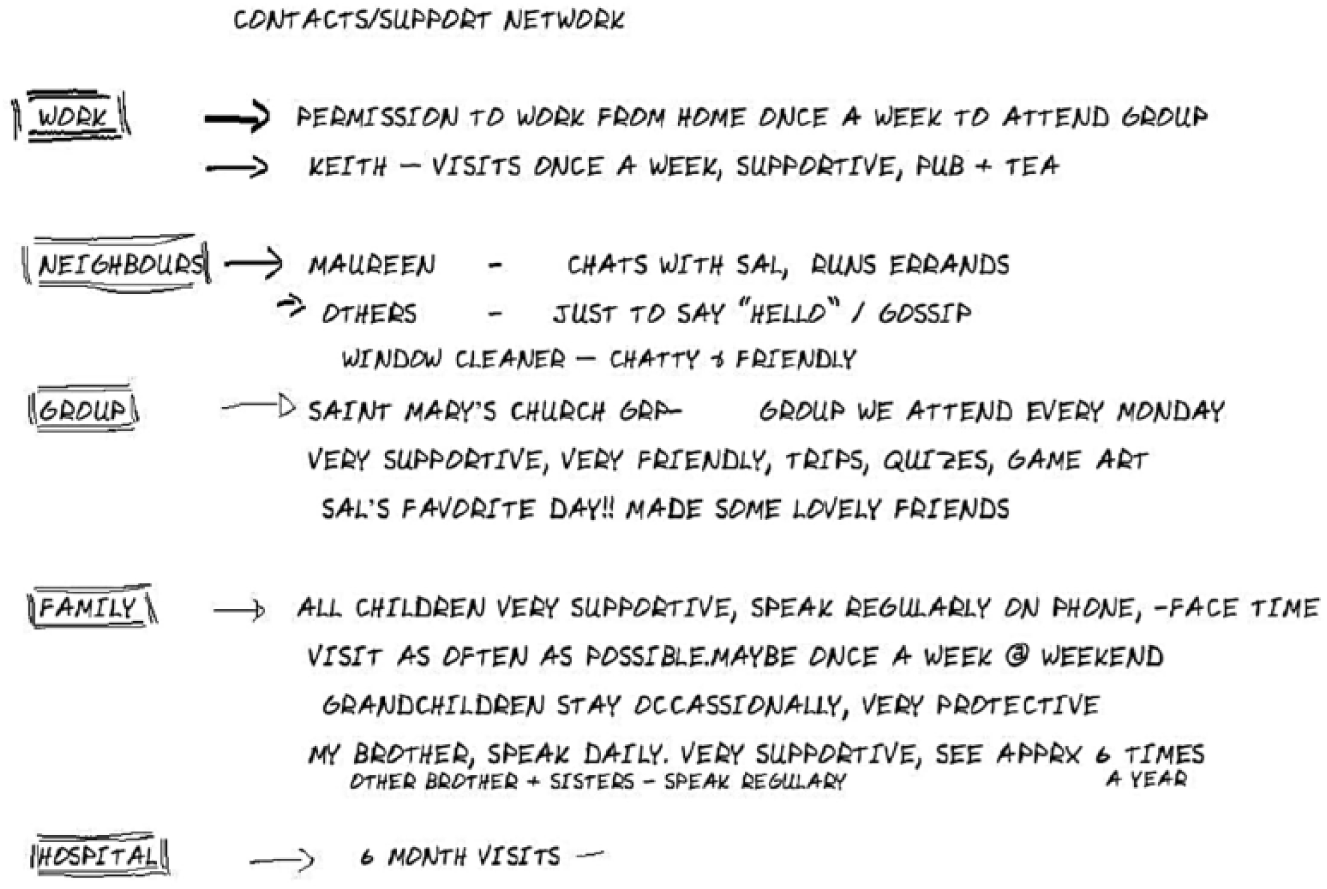
Map by Trevor.
Trevor writes ‘supportive, very friendly’ about the group he and his wife attend and elsewhere, writing about his children as ‘very protective’. The emotion that is materialised in this ‘lived network’ is a pertinent example of the reflexive process of engaging with the emotionality of the relationships as the participant considers and categorises his personal network. The emotional reflexivity that was drawn on during the dialogue between the researcher and the participant becomes manifest in the written map, as we illustrated in Pam’s second map. We saw this in a number of maps as the emotionally reflexive process became transferred onto the page as participants scribed their feelings and emotion onto their maps. Another participant, Betty, writes ‘important’ and underlines it with emphasis next to the names of a couple who are friends. Another participant, Jayne, writes next to the name of one of her relationships ‘83 years old. Can’t visit as often – didn’t think he’d still be here’ reflecting her thoughts directly onto the map on the realities of the ageing process and relationships through the life course.
Our point then, is that the maps begin to not just represent, but also take on some of the affective nature of the lived networks themselves as participants co-produce their social networks and narratives with the researcher, noting and reflecting on the significance of relationships and their connections. The maps thus have a threefold purpose: they enable the elicitation of the interview narrative to develop, and during the development of the interview the maps become a physical product that the participant makes to depict their networks, and then in turn they become an ‘affective artifact’ co-produced and support for the researcher during the analysis process.
As a result, the technique brings ethical concerns that researchers need to be prepared for. Particpants’ engagement with their maps, for example, gave rise to a range of emotional responses, from being upset at the recollection of friendships that have fallen away, or thoughts around loneliness and isolation, or the uncertainty of what the future may bring to both carers and those they care for. Researchers need to be mindful that ‘do no harm’ is more than an ethical mantra but an issue to actively engage with. Yet talking about relationships, and care more broadly, can be an emotionally charged process that, inevitably, raises the potential for distress. We contend that encouraging participants to actively map out their relationships with others can heighten this given the ways that the maps reflect back the scope and scale of these relations. We did all we could to ensure that participants were not feeling distressed at the end of the interviews. We remained for as long as necessary with participants and talked with them to make sure they were feeling okay. We would also ensure that participants had someone else that they could turn to for support after the interview if they felt that they needed to (Dickson-Swift et al., 2007). However, it is also important to acknowledge that the emotionally charged responses from participants were particularly important to our research, indeed with hindsight they were an inevitable part of what we set out to try to understand.
Conclusion
This article has built on existing understandings of participatory social network mapping (Clark, 2009; Heath et al., 2009; Ryan et al., 2014). The method encourages participants to reflect and consider their relationships over time and how they structure their social lives, encouraging them to depict these relationships on paper, to materialise the ties they describe within their everyday contexts. For many of the participants in our study, reflecting on their networks provided, perhaps for the first time, an opportunity to conceptualise the temporal nature of their networks either organising them into days of the week or through showing how the networks were ordered around a flow of time. Stories unfold as participants scribe a name onto paper and the participants engage emotionally with the technique.
Our experience of using participatory social network mapping brings useful insights that go beyond a dementia context. The findings here can contribute more widely to our understanding of how network maps are affective in their nature. Reflexive dialogue occurs as participants engage with the researcher to draw out the relationships that they have in their lives. The reflections in this article show how the method can enable us to see a network as a lived experience. The co-production of an in-depth narrative and the visualisation of the map enable us to evidence the complexity and dynamic multi-dimensionality of this lived experience through the ‘lived network’. However, the maps go beyond their purpose as a visual depiction to support a verbalised articulation of relationships. For while the map, even when considered alongside an accompanying elicitation interview, might appear objectively as a paper with names upon it, the emotional work that materialises the names on these diagrams mean that the maps themselves become affective.
Footnotes
Acknowledgements
Declaration of conflicting interests
The author(s) declared no potential conflicts of interest with respect to the research, authorship and/or publication of this article.
Funding
The author(s) disclosed receipt of the following financial support for the research, authorship, and/or publication of this article: The support of the Economic and Social Research Council (ESRC) and National Institute for Health Research (NIHR) is gratefully acknowledged.