
Abstract
This article is a review of issues associated with measuring ethnicity and using ethnicity measures in social science research. The review is oriented towards researchers who undertake secondary analyses of large-scale multipurpose social science datasets. The article begins with an outline of two main approaches used in social surveys to measure ethnicity, the ‘mutually exclusive category’ approach and the ‘multiple characteristics’ approach. We also describe approaches to the use of ethnicity measures in cross-national comparative research. We emphasise the value of sensitivity analyses. We also encourage researchers to carefully consider the possible relationships between ethnicity and other important variables in order to avoid spurious interpretations of the effects of ethnicity.
Ethnic differences often explain substantial patterns of social inequality (e.g. Heath and Cheung, 2007; Heath et al., 2008; Platt, 2005, 2007; Tomlinson, 1991). Ethnicity is far fuzzier a concept than either occupation or educational attainment. Most social surveys collect some level of information on ethnicity. In this article, we highlight a series of concerns for sociologists using ethnicity measures in existing social surveys.
An aim of this article is to provide information for secondary data analysts who are not experts in the field of ethnicity. Experts are well aware of the opportunities provided by the measures that are available in existing social surveys, as well as their limitations and complexities, but these issues are sometimes not appreciated by social survey analysts whose interests might lie outside of ethnicity research. Ethnic structures differ radically across nation states, therefore, in order to ensure that this article provides clear prescriptions, we confine most of our discussion to the United Kingdom (although the issues which we cover are often equally relevant to data from other nations).
How is ethnicity measured?
Ethnicity is frequently taken to represent a self-claimed or subjective identity linked to a perception of shared ancestry as a result of some combination of nationality, history, cultural origins and possibly religion (Bulmer, 1996; Platt, 2011, 2007). There is an extensive literature which discusses the meaning and use of the term ethnicity and how this concept differs and overlaps with the neighbouring concepts of race and national identity (for example, see Banton, 1998, 2014; Burton et al., 2008; Cornell and Hartmann, 2006; Mason, 1995; Ratcliffe, 1994; Smith, 1991). The definition of what constitutes an ethnic group or ethnicity is the subject of much detailed theoretical discussion (see, for example, Anthias and Yuval-Davis, 2005; Banton, 1998; Bulmer, 1996; Coleman and Salt, 1996; Murji and Solomos, 2005; Solomos and Back, 1996; Solomos and Collins, 2010). The focus of this article is on using those ethnicity measures which are widely available in large-scale multi-purpose social surveys.
In comparison with the measurement of occupations in social surveys, there is no standard, widely accepted, protocol for the collection of ethnicity or ethnic group data. In the United Kingdom, and many other countries, National Statistical Institutes (NSI) have proposed standardised measures to classify individuals into ethnic groups. This has often been driven by legal requirements associated with evaluating anti-discrimination policies, the need to monitor change in the social and economic circumstances of ethnic minorities and the need to have accurate information about the size and nature of the ethnic minority population (Bulmer, 1985). The standardised measures advocated by NSIs are frequently included within social surveys, but they are also common for alternative measures that are connected to the concept to be included (or constructed post-hoc). Indeed, researchers are sometimes interested in specific aspects of ethnicity that are not well captured by NSI standards, and/or the design of a particular survey may push researchers away from using NSI standards for pragmatic reasons, such as very low coverage of some relevant minority groups.
Nandi and Platt (2012) describe two main perspectives in the measurement of ethnicity. 1 First, social surveys often place individuals into mutually exclusive ethnic group categories. These are sometimes based upon a taxonomy that can be defined through objective characteristics (e.g. country of birth or parental country of birth). Alternatively, they may involve asking respondents (or even interviewers or proxy respondents) to allocate an appropriate category on substantially subjective grounds. In either case, to many analysts, the specification of categorical ethnic group measures is a necessity for studying ethnic inequalities using social survey data (Platt, 2011: 74). Second, social survey data collections may include multiple questions on different aspects of an individual’s ethnic identity and use an analytical approach that draws upon data from more than one measure (see Burton et al., 2008). As a heuristic device, we will refer to the first perspective as the ‘mutually exclusive category’ approach and the second perspective as the ‘multiple characteristics’ approach.
The mutually exclusive category approach
In this approach, the aim is to place individuals into the most appropriate ethnic group category based on their characteristics (Burton et al., 2008). These characteristics may include skin colour or nationality (for example, Burton et al., 2008, 2010; Platt, 2011). In the United Kingdom (as in the United States), the most commonly used measures of ethnic group involve presenting individuals with a list of ethnic group categories which make reference to national origins and to skin colour and asking them to indicate which category they feel is most appropriate for them. 2
In the United Kingdom, the Office for National Statistics (ONS) recommends ethnic group measures for use in social surveys (see Table 1 for the most recent measure, based on the 2011 census). These recommendations are based on the measures designed for the United Kingdom decennial censuses, which themselves have been constructed on the basis of wide consultations with a range of stakeholders and National Institutes. The measures are different in the four UK territories, reflecting the nature of the minority ethnic population, different legal requirements and variations in the prominent terminology used (ONS, 2013). Clear guidelines are also produced for researchers who are analysing ethnicity across the whole of the United Kingdom on recommended ways to combine the different ethnic groups into higher level ethnicity categories suitable for the UK-level analysis (see ONS, 2013).
The Office for National Statistics harmonised ethnicity measure recommended for use in social surveys (ONS, 2013).
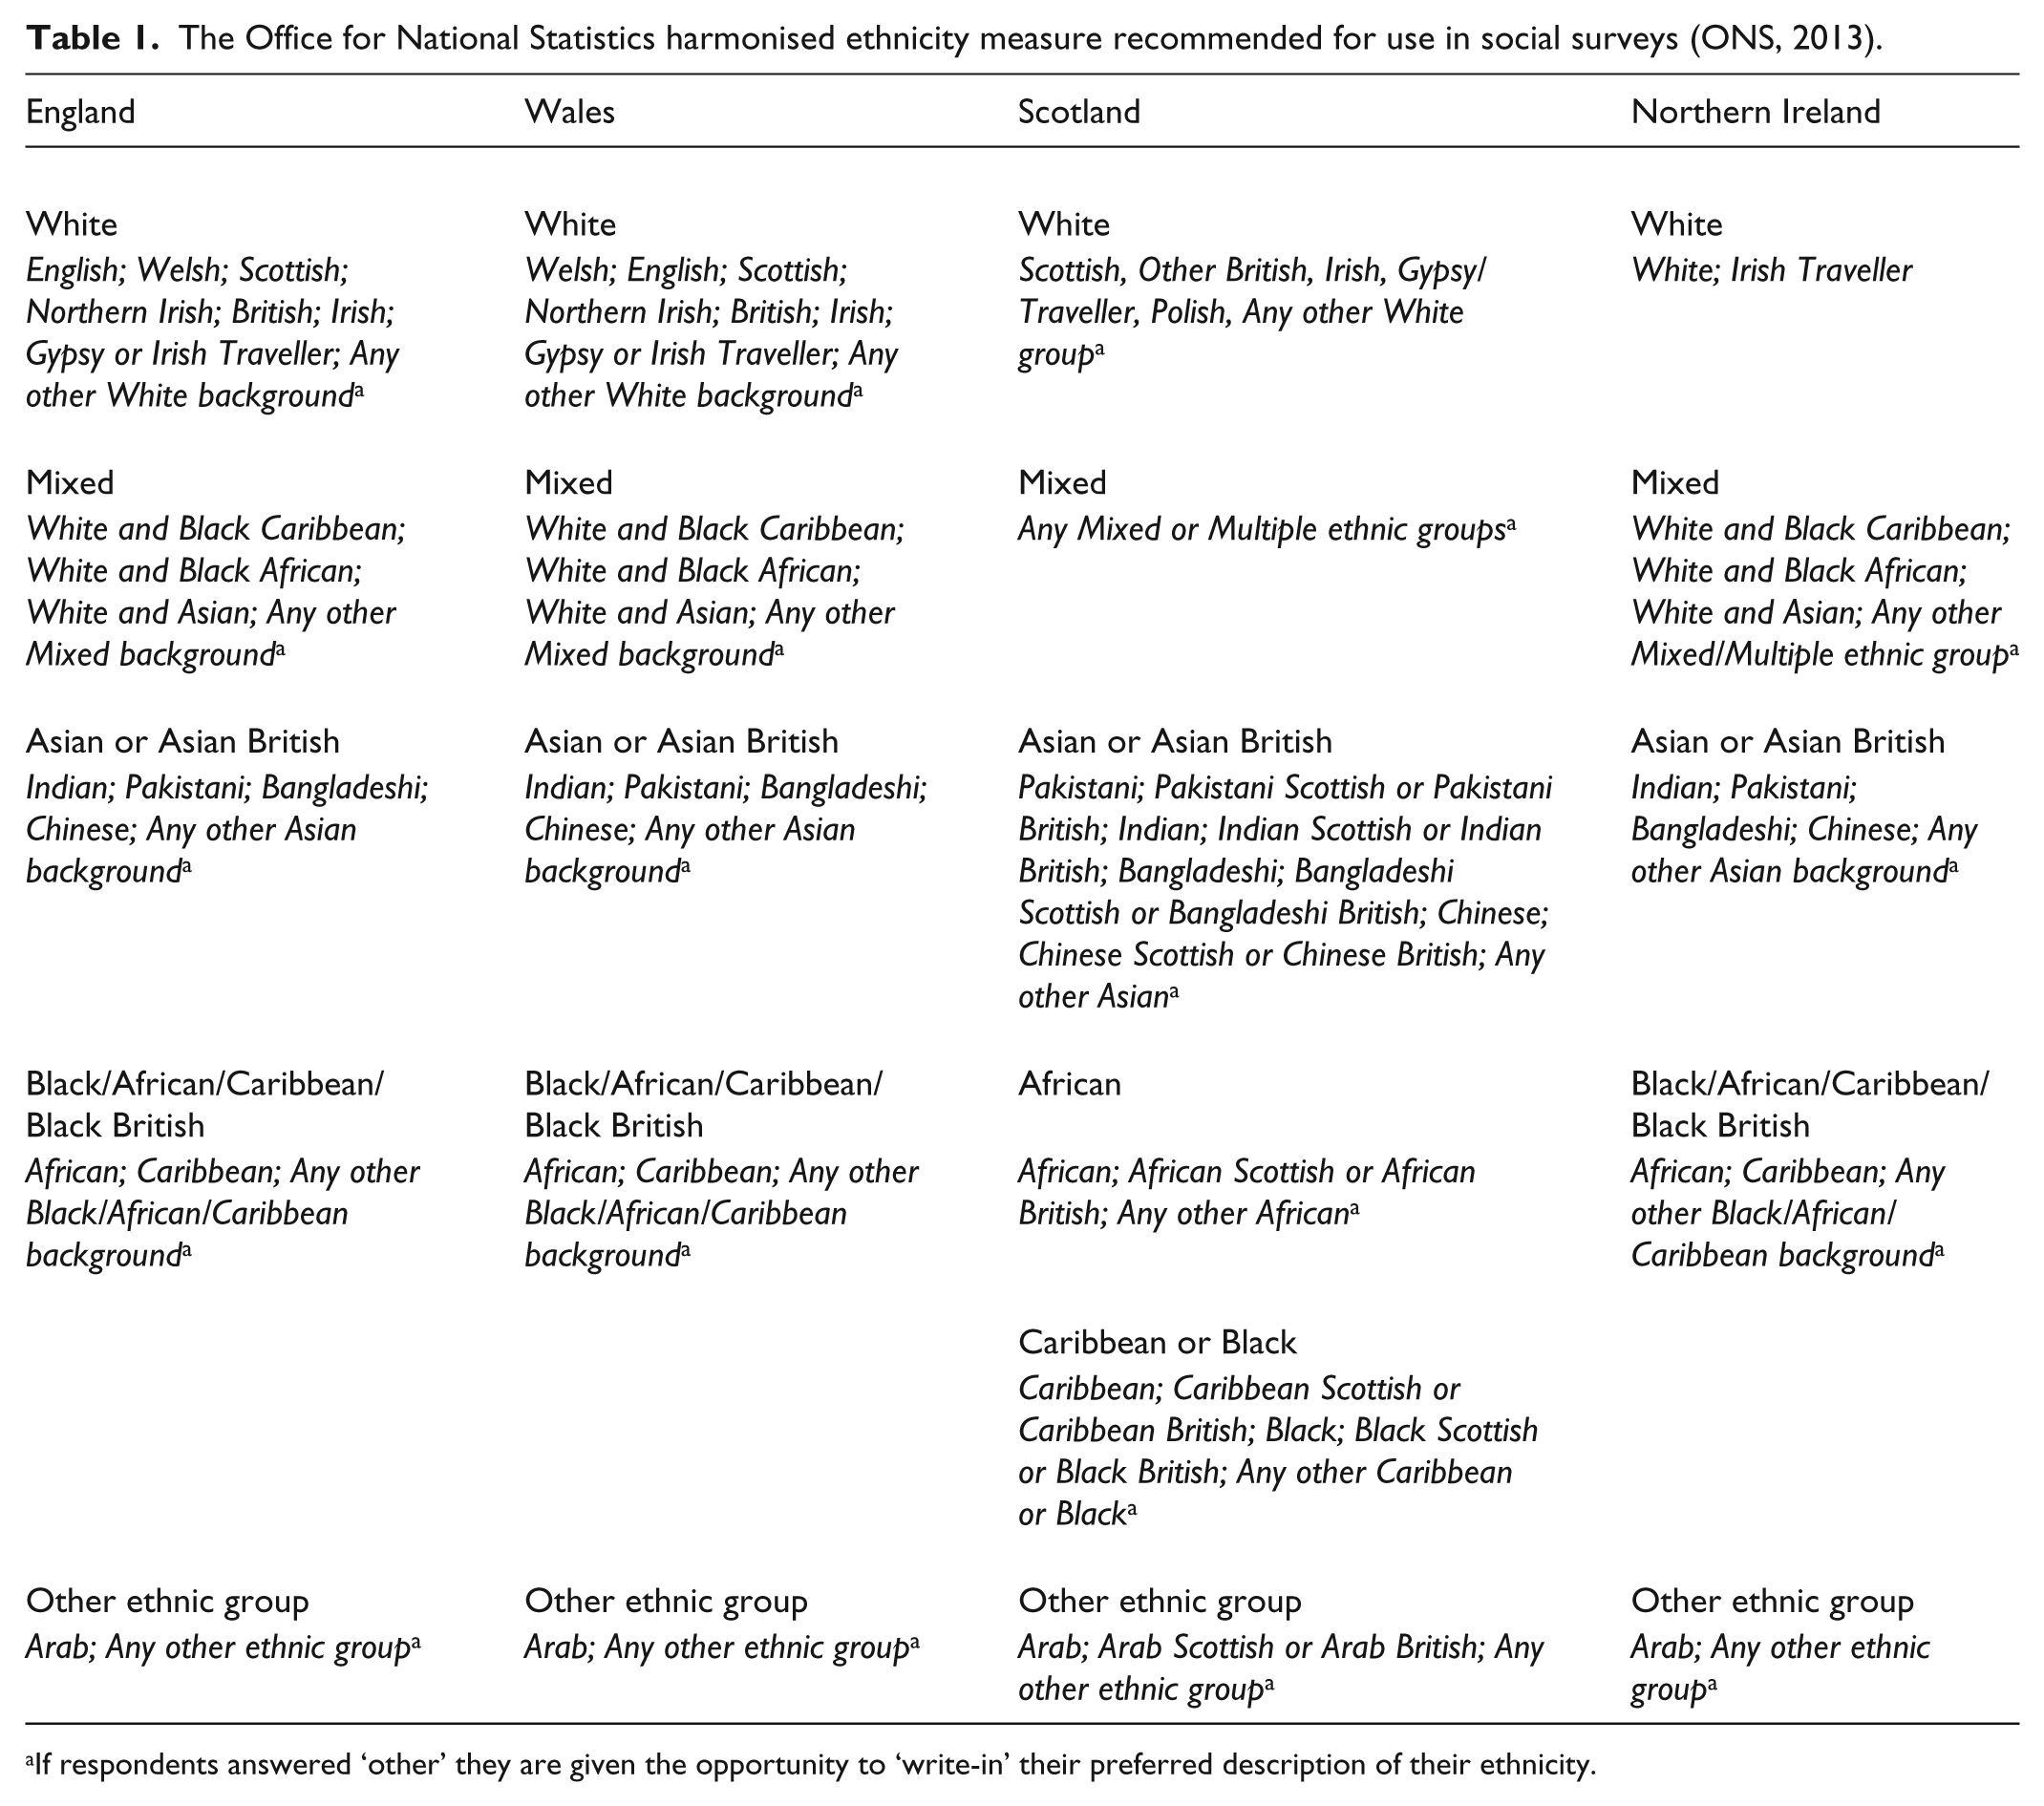
If respondents answered ‘other’ they are given the opportunity to ‘write-in’ their preferred description of their ethnicity.
The ONS recommended standard includes provision for various ‘mixed’ categories, and it also allows individuals to classify themselves as belonging to ‘other’ unspecified ethnic groups and to write in their chosen description (see Table 1). The use of this ‘write-in’ section has been shown to improve perceptions of the acceptability of this question to respondents and to improve response rates (ONS, 2013). In line with the aims of the ‘mutually exclusive category’ approach, data collectors may seek to re-allocate those individuals who have written-in their ethnic identity to one of the existing ethnic group categories based on objective guidelines (see ONS, 2013).
The ONS standardised measures have been adopted in a number of large-scale social surveys (for a review, see Afkhami, 2012). The use of these existing standardised measures can facilitate the comparability of analyses across studies. For many social science investigations using large-scale social survey data, the use of these measures within a multivariate analysis, along with other key variables, will fulfil the requirement of providing increased control for the ethnic group composition of the United Kingdom. The ONS standard measures represent an extensively considered and transparent approach (e.g. ONS, 2013), and although there may sometimes be special circumstances that provide a compelling reason for a specific study to depart from the ONS standard categories, for theoretical or operational reasons, such departures should generally be discouraged without good reason.
A common complication in the United Kingdom survey research arises when analyses are conducted using non-standard ethnic group categories. This sometimes happens because a standard format ethnicity measure is not available in the survey data. In the case of analysis using large-scale surveys, it more commonly arises because the researcher has decided to re-code the measure of ethnicity into a non-standard format. Often this decision is made because of small sample sizes in the different ethnic group categories. Generally speaking, we would argue that researchers should resist the impulse to generate derived and variant measures when standardised taxonomies are available (see Lambert et al., 2009). If standardised measures are not available in the social survey used, and/or there are operational reasons that preclude the use of standard categories (e.g. an analytical focus on an ethnic division that is not captured by the standard measure), researchers should provide clear justification for, and documentation and metadata about, how the measures were derived, in order that other researchers can test the measures and adequately replicate results. 3
An additional complexity arises when researchers seek to use ethnic group measures from surveys collected at different periods in time. In the case of comparisons across different time points (e.g. using repeated cross-sectional surveys), finding equivalent measures might be difficult. In the United Kingdom, the standard measures used in large-scale social surveys are usually based on those of the UK Census, and these are revised decennially 4 (for a discussion of the comparability of the ethnicity measures used in the 2001 and 2011 UK Censuses see ONS, 2012). Even if similar measures are collected over time, they may have only ‘nominal equivalence’ and lack ‘functional equivalence’, because the relative meaning of being in a certain category may not be the same from one time point to another (Van Deth, 2003). There are some published recommendations of good practice for using standard ethnicity categories for longitudinal comparisons (see Afkhami, 2012; Platt et al., 2005; Simpson and Akinwale, 2007), and it is often the case that previous comparative studies provide the most appropriate benchmarks for further endeavours. In the special case when longitudinal data allow for records to be linked for the same people at different time points, it is sometimes possible to derive consistent ethnicity measures by focussing upon the measures used at a particular agreed time point (see Platt, 2005).
As well as challenges of temporal consistency, survey data analysis projects often experience difficulties because the survey data itself have coverage of ethnic groups that is in some way sub-optimal. Large-scale nationally representative social surveys may have only a small numbers of cases from certain ethnic minority groups. This sparsity can inhibit some statistical analyses. A commonly used strategy to respond to data sparsity when analysing ethnic group patterns is to merge together smaller ethnic groups into combined categories or to drop the groups from the analysis altogether. These steps are usually taken for pragmatic rather than theoretical reasons. This approach may be plausible in some situations, but it is obvious that there are also risks that more complex empirical patterns might be overlooked.
Some modern social surveys (e.g. the UK Millennium Cohort Study and the UK Household Longitudinal Study) have complex sampling designs, such as ‘boost’ samples that are designed to increase coverage of selected minority categories. This is not a simple solution to the problem of sparsity as it adds complexity to the survey sample which should be appropriately taken into account in analyses (for an accessible introduction see Treiman, 2009: 195–224). Unfortunately, it is common for survey researchers to generate summary statistics from data with complex sampling designs that use methods which do not take account of the complex survey design. This practice has the potential to introduce bias and/or inefficiency into statistical results (i.e. the inaccurate estimation of statistical parameters and/or inaccurate conclusions about their generalisability).
To bypass such complications, researchers interested in studying ethnicity often deliberately focus on datasets that maximise coverage of ethnic minority groups. Nevertheless, while there are many possible strategies for dealing with survey data that have sparse coverage of minority groups and/or that have a complex sampling design, it is always desirable to clearly communicate the approach taken (such as merging categories), and when possible to explore different analytical strategies through theoretically grounded sensitivity analysis (such as generating results with and without sampling design controls or different merged categories).
The multiple characteristics approach
Placing survey respondents in a single, mutually exclusive category may overlook some important dimensions of ethnicity. In many accounts, ethnicity is a multidimensional concept which includes a number of elements (e.g. ancestry, national identity, religion and country of birth) (see Aspinall, 2011), and there is some evidence that the importance of different dimensions of ethnicity may vary between people. For example, when providing descriptions of their ethnicity in free-text responses, ‘Black’ groups in the 1991 and 2001 UK Censuses were found to emphasise their national identity (i.e. being British) as a central element of their ethnic identity (ONS, 2006). South Asian groups, however, have been found to emphasise their religion as a central element of their ethnic identity (Modood et al., 1994).
Attention to multiple dimensions of ethnicity can be important, for instance, when investigations require more insight into how individuals view their own ethnic identity, what characteristics make up this identity, or how important this identity is to the individual (Burton et al., 2008). For example, researchers might be interested in how an ethnic identity is formed and how this changes over the life course (French et al., 2006; Phinney, 1989, 1990; Phinney and Alipuria, 1990; Torres, 2003). Similarly, investigating how ethnicity relates to well-being (Mossakowski, 2003; Phinney et al., 2001) or how self-esteem is influenced by ethnicity (Bracey et al., 2004; Umaña-Taylor, 2004; Umaña-Taylor and Shin, 2007) will probably require measures which capture more nuanced aspects of ethnicity.
The use of multiple measures within a social survey, which examine different aspects of the concept of ethnicity, offers an effective approach to the measurement of ethnicity in more detail, since multiple responses across differing characteristics allow respondents to provide more nuanced information about their particular circumstances (Burton et al., 2010). The measures developed for Understanding Society (the United Kingdom Household Longitudinal Study 5 ) are a prime example of this approach (see Table 2 for selected examples of the ethnicity questions used in the survey). In addition to measuring ethnicity using standardised ethnic group measures, described above, a suite of measures were also developed to provide information on various aspects of ethnicity (e.g. country of birth, language, nationality, religion), and also the extent to which the respondents felt these characteristics were important to their identity. Nandi and Platt (2012) developed these questions to offer a comprehensive set of measures suitable for the specialist and detailed study of ethnicity in the United Kingdom. The use of multiple measures has also been advocated as a solution to comparability in cross-national survey research (see Hoffmeyer-Zlotnik and Warner, 2010).
Examples of questions that are suited to a multidimensional approach. Questions used in wave 2 of Understanding Society (The UK Household Longitudinal Study).
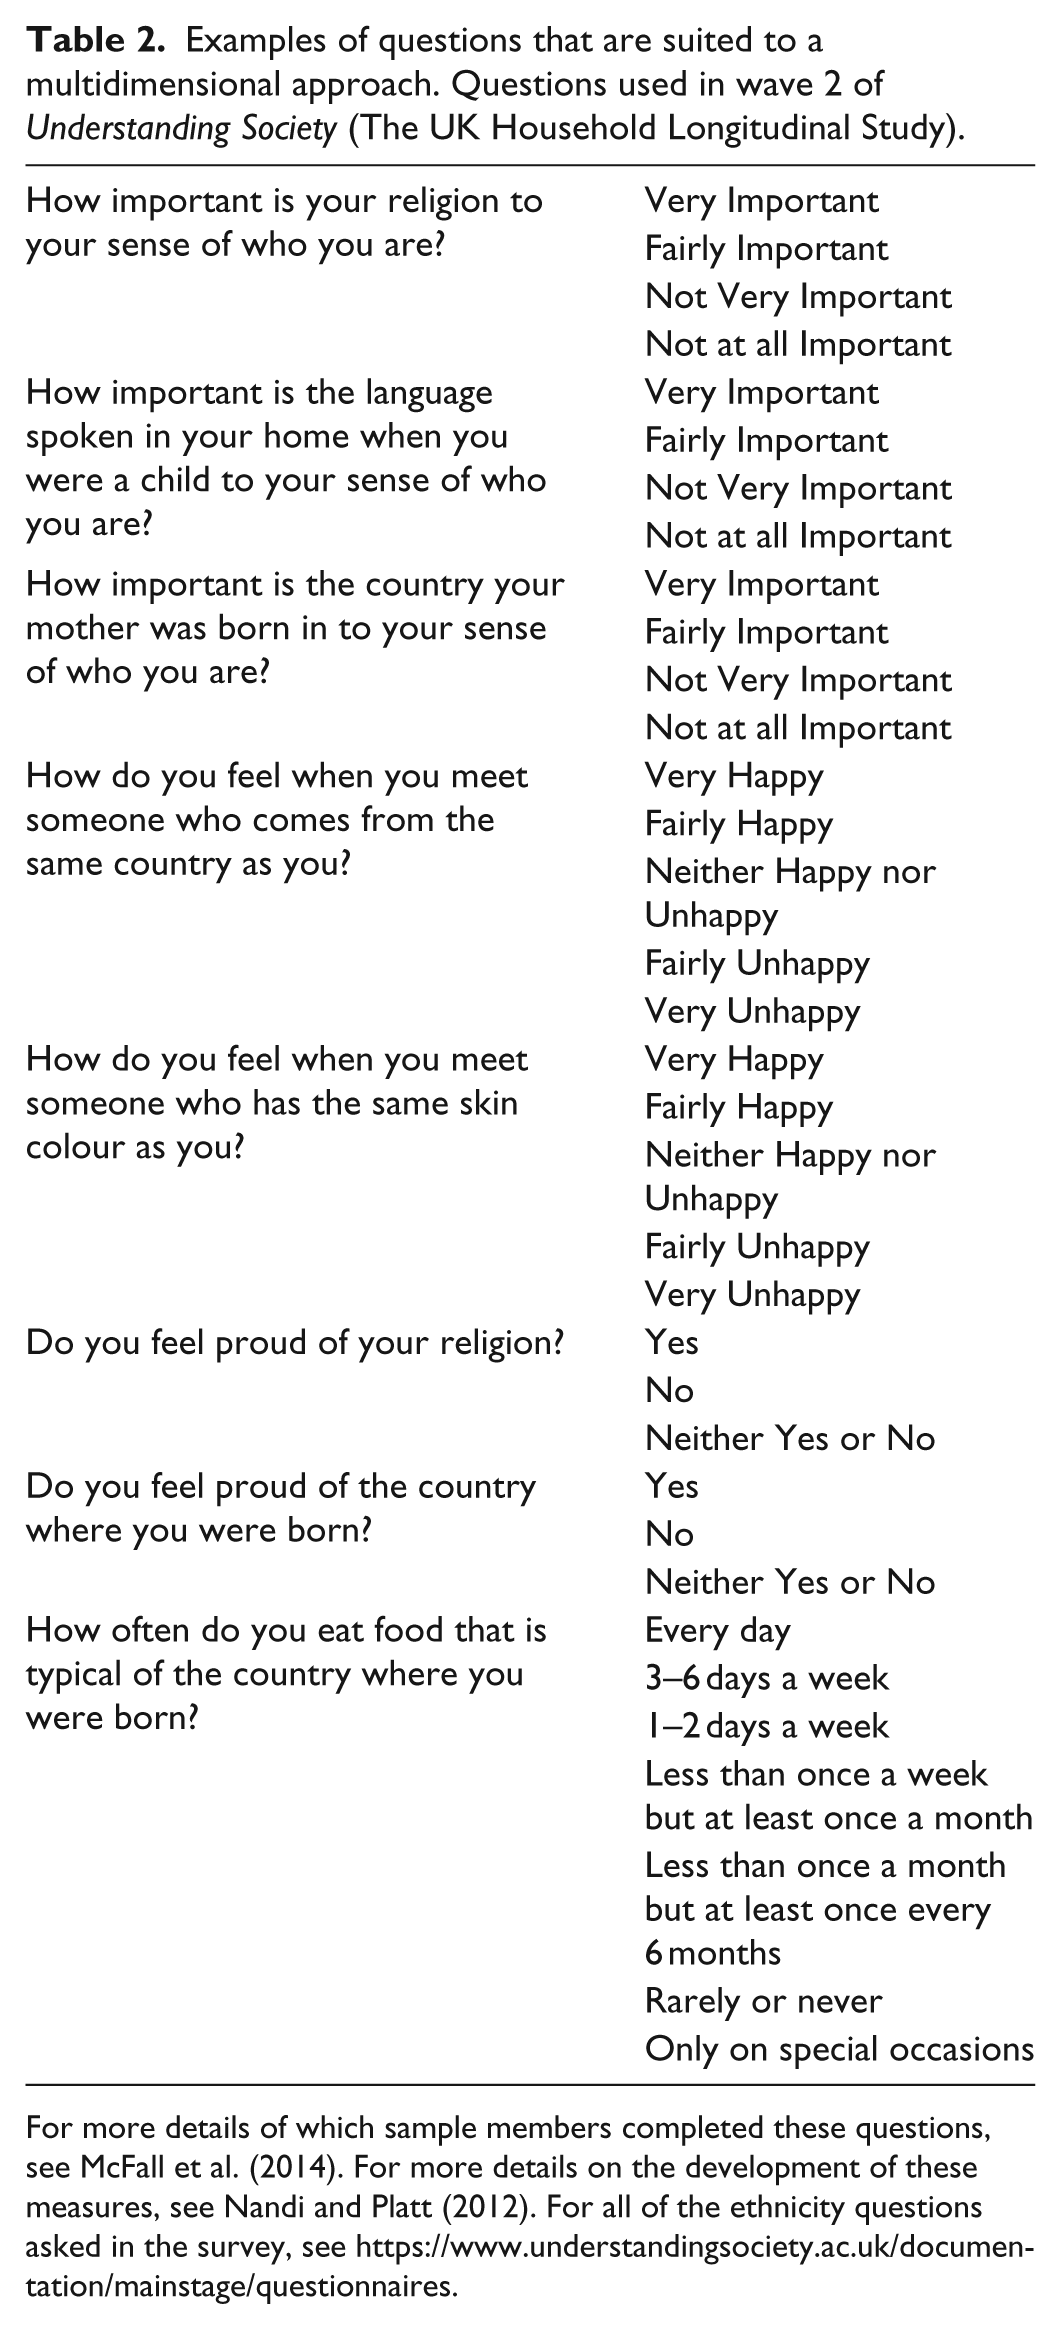
For more details of which sample members completed these questions, see McFall et al. (2014). For more details on the development of these measures, see Nandi and Platt (2012). For all of the ethnicity questions asked in the survey, see https://www.understandingsociety.ac.uk/documentation/mainstage/questionnaires.
In many analyses, a standardised categorical ethnicity measure, for example, the ONS measure described above will be sufficient when included in a multivariate analysis with other key variables because this will provide suitable additional statistical control to help to represent the demographic structure of the United Kingdom. Indeed, despite their recognition of the relevance of multiple subjective identities, Burton et al. (2008) point out that just as in most situations, it is possible to study social class inequalities without the need to measure class consciousness, therefore, ethnic group inequalities can be studied using social survey data without capturing an individual’s conscious ethnic identity.
In other analyses, using a standardised categorical ethnicity measure may be less suitable. There are circumstances where the analytical focus on ethnic inequalities involves important divisions that are not well captured by the standard ethnicity variables. Well-documented examples in the United Kingdom include the importance of immigrant ‘generation’ to analyses of social inequality (e.g. Heath and Cheung, 2007) or the specific interest in ‘East African Asians’ in the United Kingdom in the late 20th century (e.g. Modood et al., 1997). More generally, authors such as Yancey et al. (1976) and, more recently, Aspinall (2012) have suggested that ethnicity is a changeable, complex and multidimensional concept which cannot be measured by allocating individuals to a single mutually exclusive category.
Relationships with other variables
Alongside definitional issues, an important consideration in most analyses of ethnicity is the way in which ethnic categories are linked to other key differences between people. In multivariate analyses, a common statistical objective is to isolate the relative influence of background factors in order to identify the distinctive empirical associates with a variable of interest, net of other factors. In the case of measures of ethnicity, there are strong correlations between ethnic categories and other socio-demographic differences, so particular care is needed in order to avoid drawing spurious conclusions about ethnic differences. The key point is that a misleading understanding of the influence of ethnicity might emerge if measures are not considered in the context of other correlations (see, for example, Heath and Martin, 2013). Survey data analysts should place a suitable amount of thought, into which key variables and demographic measures, they include within models that contain measures of ethnicity and should develop their multivariate analyses from theoretically guided exploratory data analyses.
One important issue to consider is that in the United Kingdom, there are strong cohort demographic patterns that are linked to ethnic minority groups due to concentrated waves of immigration (Fryer, 1984; Hansen, 2000; Panayi, 1999; Spencer, 1997). Substantial age and regional settlement differences arise between ethnic groups that reflect their immigrant-cohort background (including some regional settlement patterns that have led in time to disproportionate residence of some minority groups in areas of high deprivation).
Some social outcomes and many health outcomes vary substantially according to age. Because certain ethnic groups have younger age structures than others, there is a pressing need to control for these differences in age when analysing data (for details on the age profiles of ethnic groups in the United Kingdom, see Haskey, 1996; Scott et al., 2001). In statistical modelling approaches, additional controls for the main effects of age may often be adequate. It is also plausible that an ageing process itself may vary by ethnic group, these patterns could ideally be explored by testing for statistical interactions between measures of age and ethnicity.
For many ethnic minorities in the United Kingdom, data that can be measured in relation to immigration may also be very important to build into an analysis. For example, whether or not individuals are born in the country of residence, how long their family has lived in the country, their proficiency in the host country language and whether their educational participation was in the host or origin country, may be relevant to some analyses. These patterns may affect important outcomes such as chances and choices in the labour market.
In the social sciences, there is an analytical literature on the differences between the experiences and outcomes of immigrants, and those born in the host society (e.g. Algan et al., 2010; Levels et al., 2008; Raftery et al., 1990; Schnepf, 2007). One common approach is to characterise survey respondents into different ‘immigrant generations’. Typically the ‘first generation’ of immigrants are those born abroad and the ‘second generation’ are those born in the host society whose parents were born abroad. Other categories are occasionally identified such as the ‘third’ and ‘subsequent generations’. In some cases, researchers also define the ‘1.5 generation’, which are those who were born abroad but moved to the host society as young children and had the bulk of their schooling in the host country (e.g. Allensworth, 1997; Harklau et al., 1999; Quirke et al., 2010). Many studies of ethnic inequalities in the United Kingdom have not taken account of characteristics linked to immigration or differences between immigrant ‘generations’. However, large-scale social surveys do often include measures related to immigration, and some writers argue that these should be increasingly central to research on ethnicity (Platt, 2005).
In the United Kingdom and in many other nations, some ethnic minority groups exhibit sustained differences in patterns of family formation and living arrangements in comparison with other groups. Most well-known in the United Kingdom are patterns of larger household size and younger average ages at marriage and family formation, among South Asian ethnic minority groups (e.g. Coleman and Salt, 1996). Differences in family patterns are often presumed to reflect the influence of cultural heritage, but there are also complexities to demographic differences between ethnic groups which defy a characterisation based on cultural heritage alone (e.g. Shaw, 2014). Family circumstances do have a substantial influence on many other social outcomes within the United Kingdom, including employment arrangements, socio-economic circumstances and patterns of lifestyle and social support. Accordingly, the association between ethnicity and average variations in family circumstances is another issue to consider. It might often be unsatisfactory to analyse differences by ethnic group without considering other variations in average family circumstances.
There are pronounced ethnic differences in settlement patterns within countries such as the United Kingdom (Finney and Simpson, 2009; Ratcliffe, 1997). Compared with other areas of the United Kingdom, some urban areas in London, the North West of England and the English Midlands have much higher ethnic minority populations. Ethnic minority groups are often clustered in areas of high deprivation, and this may be particularly relevant to studies of social networks and neighbourhood effects (see, for example, Bécares et al., 2009, 2011; Laurence, 2014). Equally, Finney and Simpson (2009) argue that the extent and consequences of regional segregation are sometimes exaggerated.
From a survey data analytical perspective, there is a persuasive argument for considering geographical issues when studying patterns of ethnic difference. Conventionally, higher level regional measures can be entered into analyses to attempt to separate geographic from ethnicity effects. In some applications, different regional settlement patterns by ethnic groups in the United Kingdom are thought to occur because of differential industrial and employment sector opportunities (see Iganski and Payne, 1999). In this scenario, an appropriate response to the recognition of regional settlement differences may be to include measures of industrial sector or employment circumstances in analyses rather than crude measures of geography.
All of these additionally relevant factors have an influence on the interpretation of patterns of difference linked to measures of ethnicity. Clearly, it is important for the researcher to consider whether and how the relationship between ethnicity and other measures is best represented within the analysis. It may be a priority to ‘control for’ separable differences, for example, by using a multivariate statistical technique that isolates the distinctive effect of one variable (e.g. a measure of ethnicity) from any patterns that might arise due to correlations with another variable (e.g. age). Regression models are routinely used for this purpose in social statistics, although both simpler and more complicated, alternative statistical methods can also be used. The important point to appreciate, however, is that the connections between ethnicity and other social differences (as described above) are such that, in the United Kingdom at least, it will ordinarily be the case that the pattern of effects linked to ethnicity will not be the same with or without ‘controls’ of this nature.
It is also important to recognise that ‘controlling for’ other factors is not the only plausible approach to summarising social patterns related to ethnicity. First, in some scenarios, it may be theoretically irrelevant that another measureable factor is in some way driving some or all of a measured ethnic difference. In this situation, the bivariate pattern of difference between ethnic group categories may be all that a researcher is interested in, and bivariate analytical techniques will be appropriate tools of analysis. Second, there is increasing recognition and interest in the social sciences given to communicating the distinctive experiences of individuals that arise due to their unique constellation of circumstances according to a number of different measurable factors. An extensive theoretical literature on ‘intersectionality’ stresses, in particular, that ethnic inequalities often work in complex combination with other social differences (e.g. Anthias, 2001). From this perspective, the best way to summarise ethnic inequalities is often to regard the situations defined by important combinations of circumstances (such as ethnicity, social class, gender and age) as being of distinctive importance. For applied researchers, an ‘intersectional’ approach can potentially be followed by summarising statistical patterns for different distinctive social groups. In a statistical modelling approach, the estimation of interaction terms between measures of ethnicity and other relevant measures of circumstances also has considerable potential to communicate the average influences associated with ‘intersectional’ combinations.
In summary, when researchers are seeking to describe the relationship between ethnicity and a key outcome of interest (e.g. health or educational outcomes), the relatively strong empirical relationship between measures of ethnicity and other measureable aspects of individuals’ circumstances, can be responded to through at least three analytical approaches. The relationship might be deliberately ignored on theoretical grounds, leading to reports of bivariate summary patterns between ethnicity measures and the outcome of interest. Alternatively, efforts might concentrate upon ‘controlling for’ other measurable differences, such as by using regression models or other methods to isolate the effect of ethnicity net of other correlated factors (such as age, region or family circumstances). Last, analysts might, on the contrary, try to prioritise the description of the intersection between ethnicity and other factors, such as by communicating interaction effects or using other summarising devices that focus on particular combinations of circumstances. Researchers might make a choice, ideally with theoretical justification, over which approach to follow. We would argue that the most compelling approach in a scientific sense should be to undertake and understand analytical patterns according to all three of these frameworks. This should be expected to give the researcher the most insight into the ethnic patterns that they are exploring and should best equip them to make an appropriate judgement over the empirical patterns that should be focussed upon.
Cross national comparisons
An emerging feature of contemporary social sciences is the interest in conducting cross-nationally comparative analyses with survey data (see Hoffmeyer-Zlotnik and Harkness, 2005; Hoffmeyer-Zlotnik and Wolf, 2003). In principle, the analysis of ethnicity is an intrinsically international theme, given its relationship with international migration. One difficulty arises because different countries have different histories of immigration, meaning that it is unlikely that comparative studies of ethnicity will be dealing with comparable minority groups in different countries. A strategy sometimes followed is to identify and compare minorities from the same background in different countries (e.g. Crul and Vermeulen, 2003; Model, 2005). This strategy may still be unsatisfactory because it is likely that there are differences between migrants from the same nation who settled in different countries. An alternative comparative strategy is simply to study different ethnic minority groups in different countries and make only carefully qualified comparisons (e.g. Heath and Cheung, 2007).
Some reviews have suggested ways for specific measurement instruments to be applied consistently to facilitate cross-national comparisons (e.g. Aspinall, 2007; Hoffmeyer-Zlotnik, 2003; Lambert, 2005). These reviews identify a second major challenge for cross-national comparative research on ethnicity, namely that different nations have strong traditions of difference in the measures related to ethnicity that they collect in surveys. In many countries, the measurement of ethnicity is highly politicised, and an approach used in one nation might never be considered acceptable in another. To a limited extent, recent social survey instruments are beginning to negotiate this problem, usually by collecting data on multiple measures that could be subsequently adapted to the researcher’s needs. For example, Hoffmeyer-Zlotnik and Warner (2010) encourage survey designers to collect measures of characteristics such as citizenship, country of birth, parents’ country of birth and language, regardless of national traditions in measuring ethnicity.
Conclusion
Most nationally representative large-scale social surveys collect information on ethnicity. We have provided an account of how ethnicity is measured in social surveys and reflected on the relationship between ethnicity and other social inequalities. Researchers undertaking survey data analyses must typically deal with a number of options and challenges that relate to using ethnicity measures as key variables in their research.
We argue that when studying ethnicity from the ‘mutually exclusive category’ approach, researchers should always use existing measures that have agreed upon and well-documented standards, and which will facilitate comparability and replication. We also advise researchers not to develop their own ethnicity measures without strong justification or use existing measures in an un-prescribed or ad hoc manner. We have highlighted that general social surveys often contain categorical measures of ethnicity based on the mutually exclusive category approach. For many sociological research questions, these measures will be adequate, especially when all that is required is improved control for underlying patterns in the data that are linked to ethnicity.
We have highlighted the potential impact of the inter-relationships between ethnic groups and other variables. When exploring statistical patterns linked to ethnicity variables, we advise researchers to be cognisant of the potential associations between ethnicity and a number of other variables (for instance age, family situation, regional location and socio-economic situation). This may help to better elucidate important patterns in social outcomes. If unrecognised, such undetected associations can lead to spurious interpretations of ethnicity effects. Contemporary data analysis software packages make it relatively straightforward to estimate statistical models that include multivariate controls for other potentially related factors, and which can test interaction effects between ethnicity and other variables. Controls and interactions can often have an important effect on the conclusions drawn from research, and we would advise any researcher working on ethnic inequalities to consider a wide range of controls and interactions when developing their analytical findings. As we have also said with regard to using other social science variables, many of the different options available when analysing measures of ethnicity can usefully be explored by conducting additional sensitivity analysis, something that is made relatively easy by contemporary software capabilities. For instance, it is sensible to run a series of analyses with and without different alternative versions of measures of ethnicity, and with and without different additional controls and interaction terms.
Footnotes
Declaration of conflicting interests
The author(s) declared no potential conflicts of interest with respect to the research, authorship and/or publication of this article.
Funding
The author(s) received no financial support for the research, authorship and/or publication of this article.