
Abstract
This article is a review of issues associated with measuring education and using educational measures in social science research. The review is orientated towards researchers who undertake secondary analyses of large-scale micro-level social science datasets. The article begins with an outline of important context, which impinges upon the measurement of education. The United Kingdom is the focus of this review, but similar issues apply to other nation states. We provide a critical introduction to the main approaches to measuring education in social survey research, which include measuring years of education, using categorical qualification based measures and scaling approaches. We advocate the use of established education measures to better facilitate comparability and replication. We conclude by making the recommendation that researchers place careful thought into which educational measure they select, and that researchers should routinely engage in appropriate sensitivity analyses.
Introduction
Measures of education are routinely incorporated into analyses of a wide variety of social outcomes and in analyses of social and population change. Education is a powerful explanatory factor influencing a number of economic phenomena, most notably both participation and success in the labour market (e.g. Card, 1999; Hartog, 2000; Jenkins and Siedler, 2007). Education is also important in far less obvious fields such as health (e.g. Desai and Alva, 1998; Kunst and Mackenbach, 1994; Lindeboom et al., 2009; Ross and Wu, 1995). Measuring education appropriately is more difficult than researchers might initially assume, because there is no simple, universal or agreed upon measure of education. Most societies have complex educational systems that have often changed over time. Therefore, the seemingly prosaic activity of measuring an individual’s education within a social survey is far from straightforward, and analysts of social survey data should be mindful of the challenges and potential pitfalls associated with using education variables in statistical analyses.
There are a number of high-quality social surveys which are specifically designed to collect detailed and comprehensive educational information. 1 Most of the more general and multipurpose social surveys (e.g. large-scale cross-sectional surveys and household panel surveys) also collect information on a respondent’s educational background but usually in less detail. Because there is no simple measure of education that is universally agreed upon, the information collected in social surveys can take numerous forms. For example, details on the respondent’s experiences in compulsory education, their school grades, how much formal education they have completed, the title or nature of their qualifications and the types of institution that they attended post-school, are all often collected in multipurpose social surveys, but there are variations from survey to survey in the range of measures collected. Social survey data collectors also usually construct one or more ‘derived’ education variables. These summary measures tend to be the most popularly used in sociological analyses but often vary from survey to survey.
In specialist fields such as educational sociology and social stratification research, educational measures are frequently analysed by researchers who have specific expertise in the field of education (for an illustration see Breen and Jonsson, 2005; Lucas, 2001; Paterson and Iannelli, 2007). Outside of these specialist areas, secondary analysts may wish to use an education measure as either an outcome or explanatory variable, but they may have less in-depth knowledge of the scope and limitations of the possible ways they can summarise this information. An aim of this article is to increase awareness of the issues associated with measuring education in context and to provide guidance for researchers who are not experts in this field.
We commence with an outline of important context which impinges upon the measurement of education. The United Kingdom is the focus of this article, but similar issues apply to many other nation states. We outline the main approaches to handling educational information in social survey data. This article is not orientated towards a theoretical evaluation of education measures nor does the article document the history or development of education measures. It is our intention that this article will serve as a useful reference for researchers seeking guidance on summarising educational attainment information effectively when analysing social surveys. We conclude by making a series of practical recommendations for researchers engaged in secondary social survey data analysis.
Education in context
General social surveys usually collect data on a large sample of respondents which reflect the wider structure of a population (e.g. the nation). Therefore, samples will routinely include respondents of different ages and at different stages of the life course. There have been radical changes in the education systems in most nations within living memories, and older cohorts of respondents in surveys will tend to have been educated in different circumstances to younger cohorts. For ease, we will refer to different groups as ‘educational cohorts’. Below, we elaborate upon a number of changes to educational systems and opportunities that have influenced ‘educational cohorts’ in the United Kingdom and stress that there are comparable stories of substantial educational change, albeit with different specific details, in other countries.
The difference between ‘educational cohorts’ is easily illustrated using a British example. The British Household Panel Survey (BHPS) is a multipurpose household panel survey of approximately 5000 households and 10,000 individuals (Berthoud and Gershuny, 2000; Institute for Social and Economic Research, 2010). In the first wave of the survey (1991), the oldest adult respondent was born in 1894 and the youngest in 1975, a span of 81 years. A small number of very old BHPS respondents attended school before the First World War, about a quarter attended school in the inter-war years, and the bulk of respondents attended school after the Second World War. The respondents also had varying access to educational opportunities beyond compulsory schooling. Those born before 1945 had very limited opportunities to gain post-school qualifications. Those born from 1945 benefitted from higher education expansion, and those born after 1965 benefitted from greater expansion in both further and higher education. Each of these educational cohorts were educated under different conditions, the structure and organisation of educational institutions differed, and the educational opportunities available to pupils were markedly different.
Minimum school leaving age 2
The ‘raising of the school leaving age’ (ROSLA) is a term used in the United Kingdom to describe an act brought into force when the legal age that a young person is allowed to leave compulsory education increases (Ainley, 1988; Blackburn and Jarman, 1992; Bolton, 2012; Paterson, 2003; Trowler, 2003). In the United Kingdom, the compulsory school leaving age was increased from 14 to 15 years in 1947, as a result of the 1944 Education Act. It was raised again in 1973 to 16 years, and more recently in England the school leaving age has been further extended. 3 Many researchers include a measure of years of full-time education completed within their analyses (Eikemo et al., 2008; Kunovich and Slomczynski, 2007). In some research applications using a duration measure is a straightforward and functional strategy. The organisational changes to the length of compulsory education in Britain might be consequential but would be hidden in an analysis that included adults of very different ages (and therefore from different educational cohorts). A naïve analysis of all adults in the BHPS might overlook this important contextual detail. In such circumstances, it might prove beneficial to include an explicit indicator for educational cohort within the analysis.
Changing school structures
Over the course of the 20th century different educational cohorts in the United Kingdom have passed through very different school and post-school systems. The 1944 Education Act sought to provide compulsory secondary education for all, free of charge through a school system that was highly selective (Blackburn and Jarman, 1992). On the basis of an ability test taken at the age of 11 years (the 11-plus exam), most children were allocated to one constituent of a tripartite system of schooling (Ainley, 1988). Children who passed the 11-plus examination were generally allocated places at grammar schools, whereas pupils who failed the 11-plus were generally allocated places at secondary modern schools. In some regions, education was also provided at technical schools. Grammar schools provided traditional academic education leading to formal qualifications and the possibility of entering higher education, while a more vocationally orientated curriculum was delivered in secondary modern and technical schools.
The United Kingdom has since moved away from the tripartite school system. The ‘11-plus’ was abolished in most regions by the early 1970s, and comprehensive schools (i.e. schools which do not select their intake on the basis of academic achievement or perceived ability) became the most common types of school, although a small number of areas of England still maintain selective grammar schools (Bolton, 2012; Paterson, 2003). Given the context of changes in school structures over time, an analysis that uses an educational measure such as the type of secondary school attended has the potential to be misleading when respondents from different educational cohorts are included within the same analytical sample.
Changing school-age qualifications
Nations like the United Kingdom have education systems with a wide range of qualifications. In addition to the school leaving age increasing and school systems being reorganised, there have also been dramatic changes in school-level qualifications (Bolton, 2012). Noah and Eckstein (1992) highlight that in the period since the end of the Second World War new qualifications have emerged and later disappeared. In England, Wales and Northern Ireland the General Certificate of Education Ordinary Level (O’ Level) was introduced in the 1950s and was the normal examination, at the end of compulsory education, for pupils attending grammar Schools. The Certificate of Secondary Education (CSE) was introduced in the 1960s and was designed for pupils performing at a lower level, but its highest grade was considered to be equivalent to a low grade O’ Level. These qualifications were replaced by the General Certificate of Secondary Education (GCSE) in the late 1980s (Department of Education, 1985; Mobley et al., 1986; North, 1987).
The Scottish education system has always had a different set of school-age qualifications. The Ordinary Grade of the Scottish Certificate of Education (commonly known as O-Grades) was usually taken at the ages of 15 or 16 years until the late 1980s when they were replaced by Standard Grades. A new system of National grades was introduced in Scotland in 2014 (see Kidner, 2013).
The UK school education system has generally been organised into a two tier qualification structure which comprises a lower tier of examinations that are undertaken at the end of compulsory school and a higher tier of more advanced qualifications which are undertaken usually in the years that immediately follow post-compulsory school. The more advanced school-level qualifications (which are usually targeted towards entry into higher education) have remained relatively more stable. The General Certificate of Education Advanced Level (A’ Level), usually requiring 2 years of study, has been undertaken by pupils in England, Wales and Northern Ireland since the early 1950s. Pupils usually undertake three subject-specific A’ Levels. These qualifications are the standard requirement for university entry and a prerequisite for some jobs. Other qualifications such as the more advanced Scholarship Level and Special Papers existed for pupils in the post-compulsory school stage during various periods but were abolished sometime ago. At other times a range of intermediate qualifications such as the Advanced Supplementary Level (AS) and the more recent Advanced Subsidiary (AS) Level have been available to pupils (the similarity of the titles and abbreviations of these qualifications often causes confusion). Recently advanced qualifications such as the International Baccalaureate and Pre U are beginning to be offered by some schools as alternatives to A’ Levels. Scotland has also experienced substantial variations in advanced school-level qualifications in recent decades (see Paterson, 2003). These changes are summarised succinctly in a timeline produced by the Scottish Credit and Qualifications Framework. 4
The chequered history of both lower and higher tier school qualifications, means that care is required when undertaking secondary analyses of school-level qualification measures. If the survey dataset contains respondents who gained school-level qualifications in different time periods, this issue is especially acute. Even within the same educational cohort pupils could have gained a mixture of qualifications. For example, during the early 1980s comprehensive school pupils in England and Wales frequently undertook a mixture of O’ Levels and CSEs at the age of 16 years and might have undertook a mixture of O’ Levels and A’ Levels in the following school years. Similarly, in Scotland during the last decade it was not uncommon for pupils to study a mixture of Advanced Highers, Highers and Intermediates in the last stages of school.
In the United Kingdom pupils undertake a portfolio of school qualifications across a range a subjects. In England, Wales and Northern Ireland pupils study for many GCSEs and the award is for the individual subject (e.g. Maths, English, History, etc.). 5 Pupils choose their subjects based on the prescriptions of their teachers and schools and also to some extent based on personal and parental choice. This means that pupils will have studied a reasonably individualised personal portfolio of GCSEs. Therefore, school GCSE attainment cannot be easily summarised by an obvious single measure.
In some specialist surveys (e.g. the Youth Cohort Study of England and Wales) data on individual qualifications and grades awarded in individual subjects are collected. Each individual GCSE is awarded a separate grade from A* (the highest) to G (the lowest grade of pass). The grade is alphabetical rather than numerical, therefore there is no single clear indicator of an individuals’ overall level of school attainment. Gaining five or more GCSEs at grades A*–C is a standard benchmark and it is used in official reporting (see Leckie and Goldstein, 2009). This benchmark is routinely employed in a wide variety of social science applications (e.g. Connolly, 2006; Gayle et al., 2003; Sullivan et al., 2011). A limitation of this measure is that it treats an A* in history, a C in maths and a B in geography equally in determining whether or not a pupil has five GCSEs at grades A*–C (Gorard and Taylor, 2002). In more recent years, the UK Government has produced league tables which have also included a measure of the proportion of pupils in a school gaining five or more GCSEs at grades A*–C including maths and English (Taylor, 2011). The addition of achieving grades A*–C in maths and English does not, however, overcome the more general obstacle of how best to suitably combine alphabetical grades from a portfolio of different GCSE results.
A plausible alternative strategy for measuring GCSE attainment is to construct measures based on scores. There are many possible scores that could be assigned to the alphabetical grades ascribed to the levels of GCSE attainment. In line with a Qualifications and Curriculum Authority (QCA) scoring method, Croxford et al. (2007: 52) calculated a measure of GCSE attainment by allocating 7 points for an A*/A, 6 points for a B, 5 points for a C, 4 points for a D, 3 points for an E, 2 points for an F and 1 point for a G, and therefore producing an overall score for each pupil’s attainment. More recently, a new set of scores has been proposed, 6 although we note that the scores for each alphabetical GCSE grade are similarly spaced in both schemes and are therefore unlikely to dramatically alter observed patterns of attainment. Haque and Bell (2001) converted GCSE attainment into numerical scores and then used these scores to calculate a mean score for each pupil. Their method has the potential advantage of taking into account variations in the number of GCSEs which pupils have undertaken, which is often a result of school policies. An innovative approach has recently been developed by Playford and Gayle (2016) who have studied subject-specific GCSE attainment using latent class analysis and have identified distinct groups of pupils based on their attainment across a number of subjects.
We hope that the information presented in the passages above indicates that there are alternative approaches to using detailed survey data on school-level qualifications. Some approaches will be better suited to specific analyses. Our empirical research leads us to conclude that representing school-level attainment information in as much resolution as possible and avoiding the simple categorisation of results is a favourable analytical approach when the data have sufficient detail (see Connelly et al., 2013; Gayle et al., 2014). We advise that it is good practice to avoid constructing arbitrary or ad hoc measures of school-level attainment from existing social survey data. We suggest that it is preferable, wherever possible, for data analysts to stick with established measures (e.g. the QCA scoring methods) as these are transparent, documented, used by other researchers and are replicable.
Post-school educational institutions and educational expansion
In Britain the number of pupils staying on in education past the compulsory school leaving age increased dramatically through the second half of the 20th century, from around 10% in 1950 to around 70% in 2000 (Clark et al., 2005). This expansion was associated with growth in both further education and higher education (involving University courses). The expansion in participation in higher education was uneven, with general patterns of increase punctuated by two periods of accelerated expansion. The first period was between 1963 and 1970 (Walford, 1991). The second period was between 1988 and 1992 (Bathmaker, 2003). To illustrate the scale of expansion, official statistics report that there were 414,000 full-time undergraduate students in 1970/1971 and 1,052,000 in 1997/1998 (Office for National Statistics (ONS), 2000 Table 3.12). There has been further expansion in British higher education, for example by the mid-1990s around 30% of 18- to 19-year-olds in the United Kingdom were participating in higher education, but this increased to 36% by the end of the 2000s (Higher Education Funding Council for England (HEFCE), 2010). The expansion of participation in British higher education can be illustrated using social survey data. Using data from the General Household Survey, 7 Figure 1 depicts the variation by age in the probability of a respondent having a degree which is the result of the expansion in higher education.
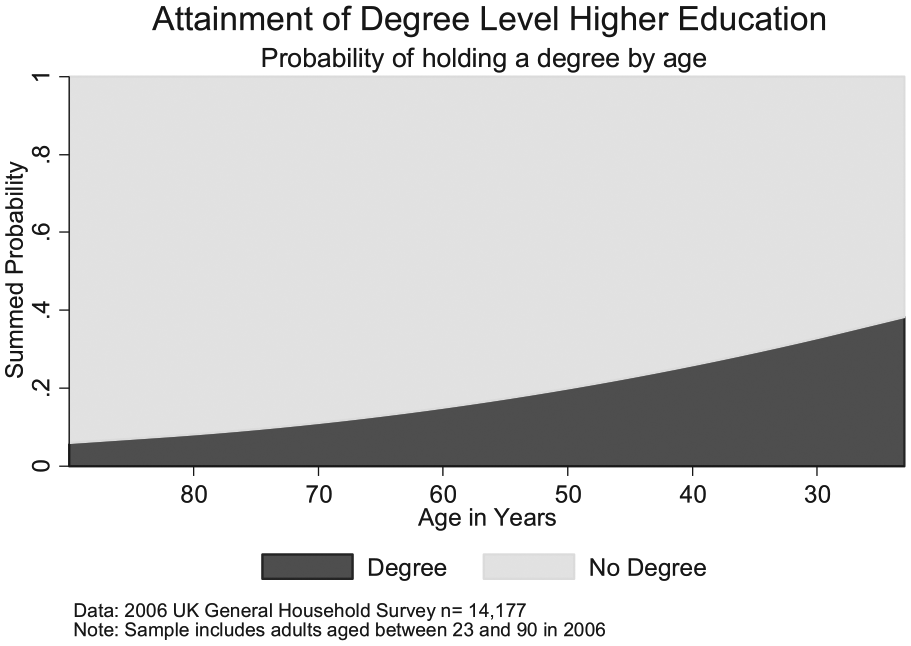
Higher education expansion – attainment of a University Degree by age.
Post-school educational expansion has led to dramatic increases in the average levels of educational attainment of different educational cohorts (Glennerster, 2001; Greenaway and Haynes, 2003). It is argued that educational expansion has also led to changes in the relative social value which can be attributed to educational qualifications, a process sometimes known as ‘credential inflation’ (see Blackburn and Jarman, 1992; Brown, 1995; Burris, 1983; Clogg and Shockey, 1984; Groot and Van den Brink, 2000). The credential inflation thesis predicts that as the supply of highly educated labour increases, the value of specific educational qualifications decrease within the labour market (Van de Werfhorst and Andersen, 2005). Similarly, the social meaning of an educational qualification such as a university degree will change over time; this is particularly evident in the United Kingdom, which has moved from an elite to a mass system of higher education. These dramatic transformations in post-school education have substantial implications for survey data collected from respondents from different educational cohorts, and secondary data analysts should, therefore, exercise suitable caution.
Approaches to measuring education in social surveys
Despite the key importance of education in sociological research, the practical process of constructing measures from social survey data is often handled rather cursorily. At least three broad categories of approach are commonly used to measure education in survey research. First, measures of the time spent in education (i.e. years of education). Second, taxonomies of the highest educational qualifications held (Schneider, 2010). Third, scaling techniques which attribute scores to the highest educational qualifications held (Buis, 2010). We critically evaluate each of these three approaches in this section.
Years of education
Many social surveys include a measure of years of full-time education completed (Schneider, 2011). This measure is routinely included in analyses (see Eikemo et al., 2008; Kunovich and Slomczynski, 2007). As metric measures of education these are particularly attractive within statistical modelling approaches as they can be added to regression models as continuous covariates (see Treiman, 2009: 382). Measures of years of education are particularly popular in economics where an attempt to represent educational assets gradationally often fits neatly with theories or analyses of incremental returns to human capital (see Harmon et al., 2003). It is commonplace for economists to convert categorical data on a respondent’s highest qualification into a measure of time spent in education, on the basis of external information about the average time in education for each qualification (see Dearden et al., 2002).
A potential limitation of using measures of years in full-time education is that it may not necessarily work well as a proxy for educational attainment. In Britain, for example, qualifications with very different levels often require a similar amount of time in education due to the structure and organisation of the educational year. This can be a significant shortcoming for using years of education as a measure, as it risks conflating different qualifications that may provide different competencies and have a different value in the labour market (see Dearden et al., 2002). Hoffmeyer-Zlotnik and Warner (2013) warn that in practice, measures of years of education are only weakly associated with measures of educational qualifications (p. 106).
Qualification-based categorizations
Qualification-based measures provide more detailed information about formal educational experiences, the courses and subjects studied, and the vocational or academic nature of the education undertaken. It is often assumed that as a result qualification based measures provide additional information on the education which an individual has attained. For example, the signals which the qualifications held might send to potential employers. Frequently, social surveys ask individuals to describe the highest qualification that they hold (either by providing a textual description of the qualification or by choosing one option from a selection of categories). In addition, some surveys include extensive questioning in order to enumerate all of the respondent’s formal qualifications and the grades attained for their qualification(s) (Jenkins and Siedler, 2007; Schneider, 2011). Given the large number of qualifications available in countries like the United Kingdom, it is generally necessary for researchers to reduce this information into an education measure with a much smaller number of categories (see Schneider, 2011). Survey data analysts generally focus upon the highest qualification which a respondent holds when analysing adult samples.
A common approach to educational measurement is to make use of the ‘derived’ measures deposited with social survey datasets. These summary measures of qualification categories are prepared by the data depositors (Schneider, 2011). Unfortunately, there are substantial variations from survey to survey in the content, format and quality of the derived educational measures. For example, the BHPS generated a 12 category typology of highest educational qualification. 8 This measure is not the same as the highest educational qualification measure deposited with either the Labour Force Survey 9 or the General Household Survey. 10 Therefore, consideration is still required when using a derived educational measure that has been deposited with a large-scale dataset because the measure might not be readily comparable across surveys.
In order to promote a standardised measurement instrument for education, the ONS has suggested a taxonomy of qualifications with three categories (degree level and above, other and none; ONS, 2005). Schneider (2011) highlights the obvious point that such a simple classification does not represent the full variety of educational qualifications and levels of attainment in education within the United Kingdom. We are convinced that the diverse range of qualifications placed within the same category of this crude measure will lead to a large degree of unhelpful within-category variation. Therefore, the ONS educational measure is likely to be sub-optimal for almost all empirical social science analyses.
The National Vocational Qualification (NVQ) levels provide another approach to categorising UK qualifications. Due to concerns over the complexity of vocational qualifications in the late 1980s, the National Council for Vocational Qualifications developed a new framework of vocational qualifications called NVQs (Jenkins and Sabates, 2007). Although the original NVQ qualifications have been replaced, researchers such as Dearden et al. (2002) have found the NVQ levels useful for classifying both vocational and academic qualifications into a convenient scheme for empirical research. Examples of qualifications and their NVQ levels are shown in Table 1.
Examples of UK educational qualifications and their NVQ level.
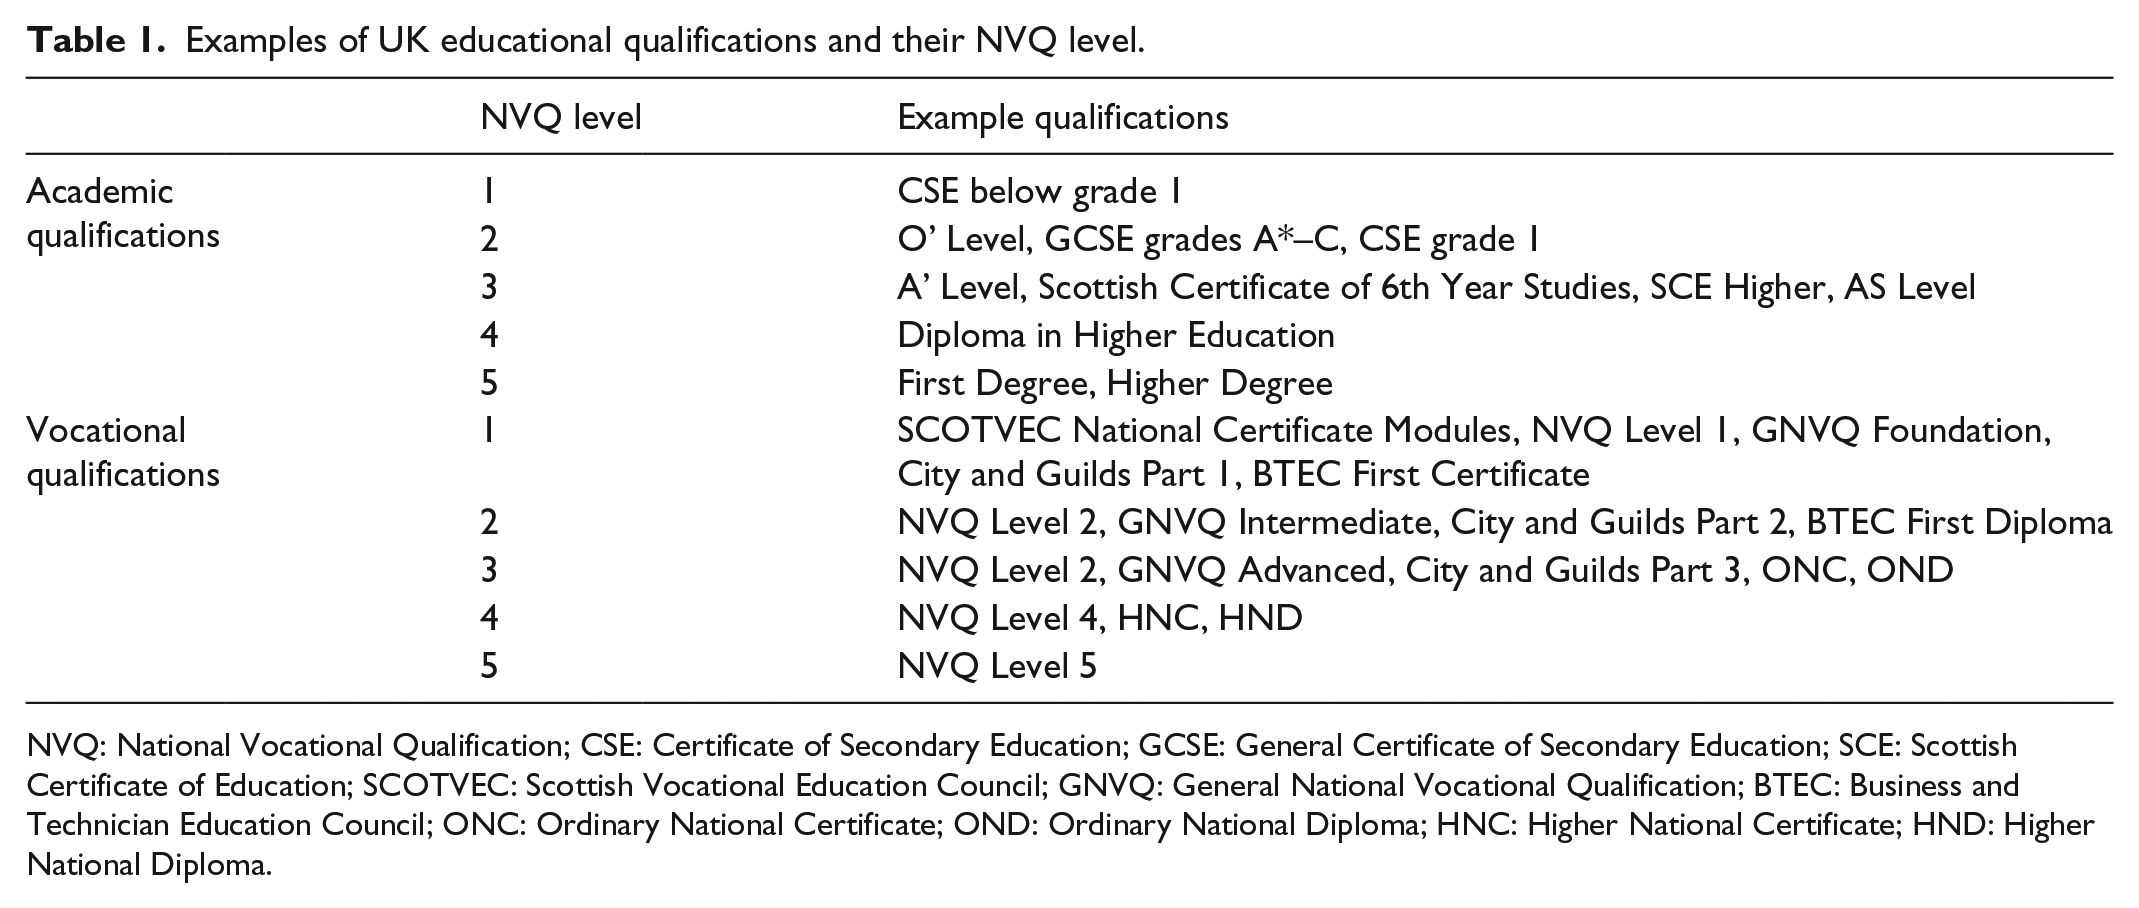
NVQ: National Vocational Qualification; CSE: Certificate of Secondary Education; GCSE: General Certificate of Secondary Education; SCE: Scottish Certificate of Education; SCOTVEC: Scottish Vocational Education Council; GNVQ: General National Vocational Qualification; BTEC: Business and Technician Education Council; ONC: Ordinary National Certificate; OND: Ordinary National Diploma; HNC: Higher National Certificate; HND: Higher National Diploma.
There are other well-known recommendations for categorising educational qualifications, which are available. Two prominent examples are the ‘Comparative Analysis of Social Mobility in Industrial Nations’ (CASMIN) classification of education (Brauns et al., 2003) and the ‘International Standard Classification of Education’ (ISCED; UNESCO, 1997, 2012). CASMIN (see Table 2) contains nine categorical levels and differentiates between academic and vocational qualifications. By contrast, ISCED contains seven levels, with further sub-categories within each level, but also incorporates academic and vocational skills (see Table 3).
The Comparative Analysis of Social Mobility in Industrial Nations (CASMIN) with UK qualification examples (Schneider, 2011).
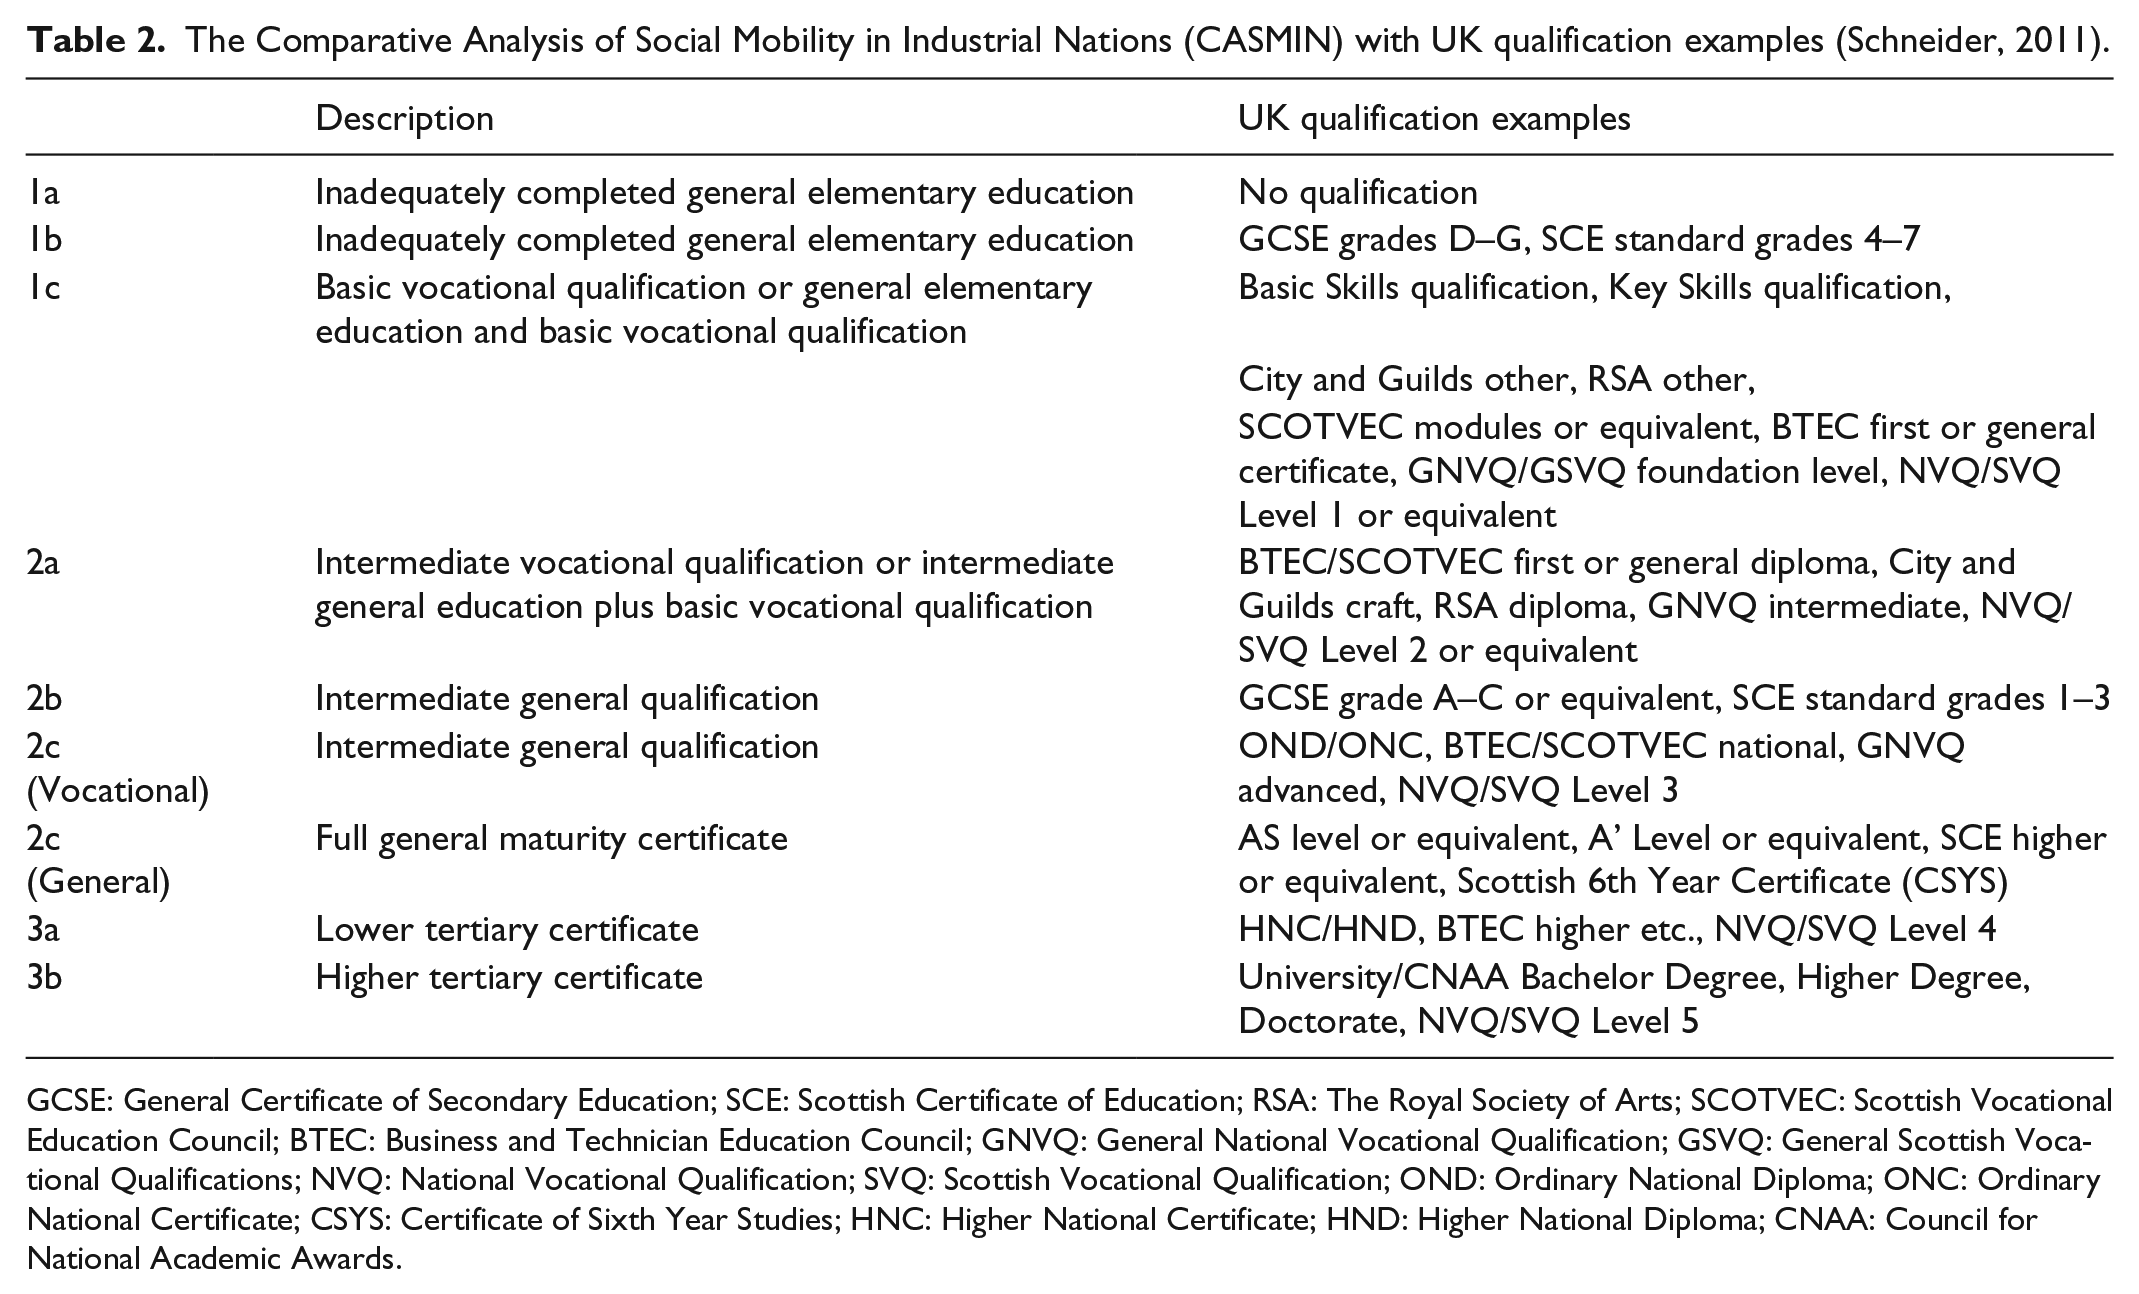
GCSE: General Certificate of Secondary Education; SCE: Scottish Certificate of Education; RSA: The Royal Society of Arts; SCOTVEC: Scottish Vocational Education Council; BTEC: Business and Technician Education Council; GNVQ: General National Vocational Qualification; GSVQ: General Scottish Vocational Qualifications; NVQ: National Vocational Qualification; SVQ: Scottish Vocational Qualification; OND: Ordinary National Diploma; ONC: Ordinary National Certificate; CSYS: Certificate of Sixth Year Studies; HNC: Higher National Certificate; HND: Higher National Diploma; CNAA: Council for National Academic Awards.
The 2011 International Standard Classification of Education 1997 (ISCED) (UNESCO, 1997).
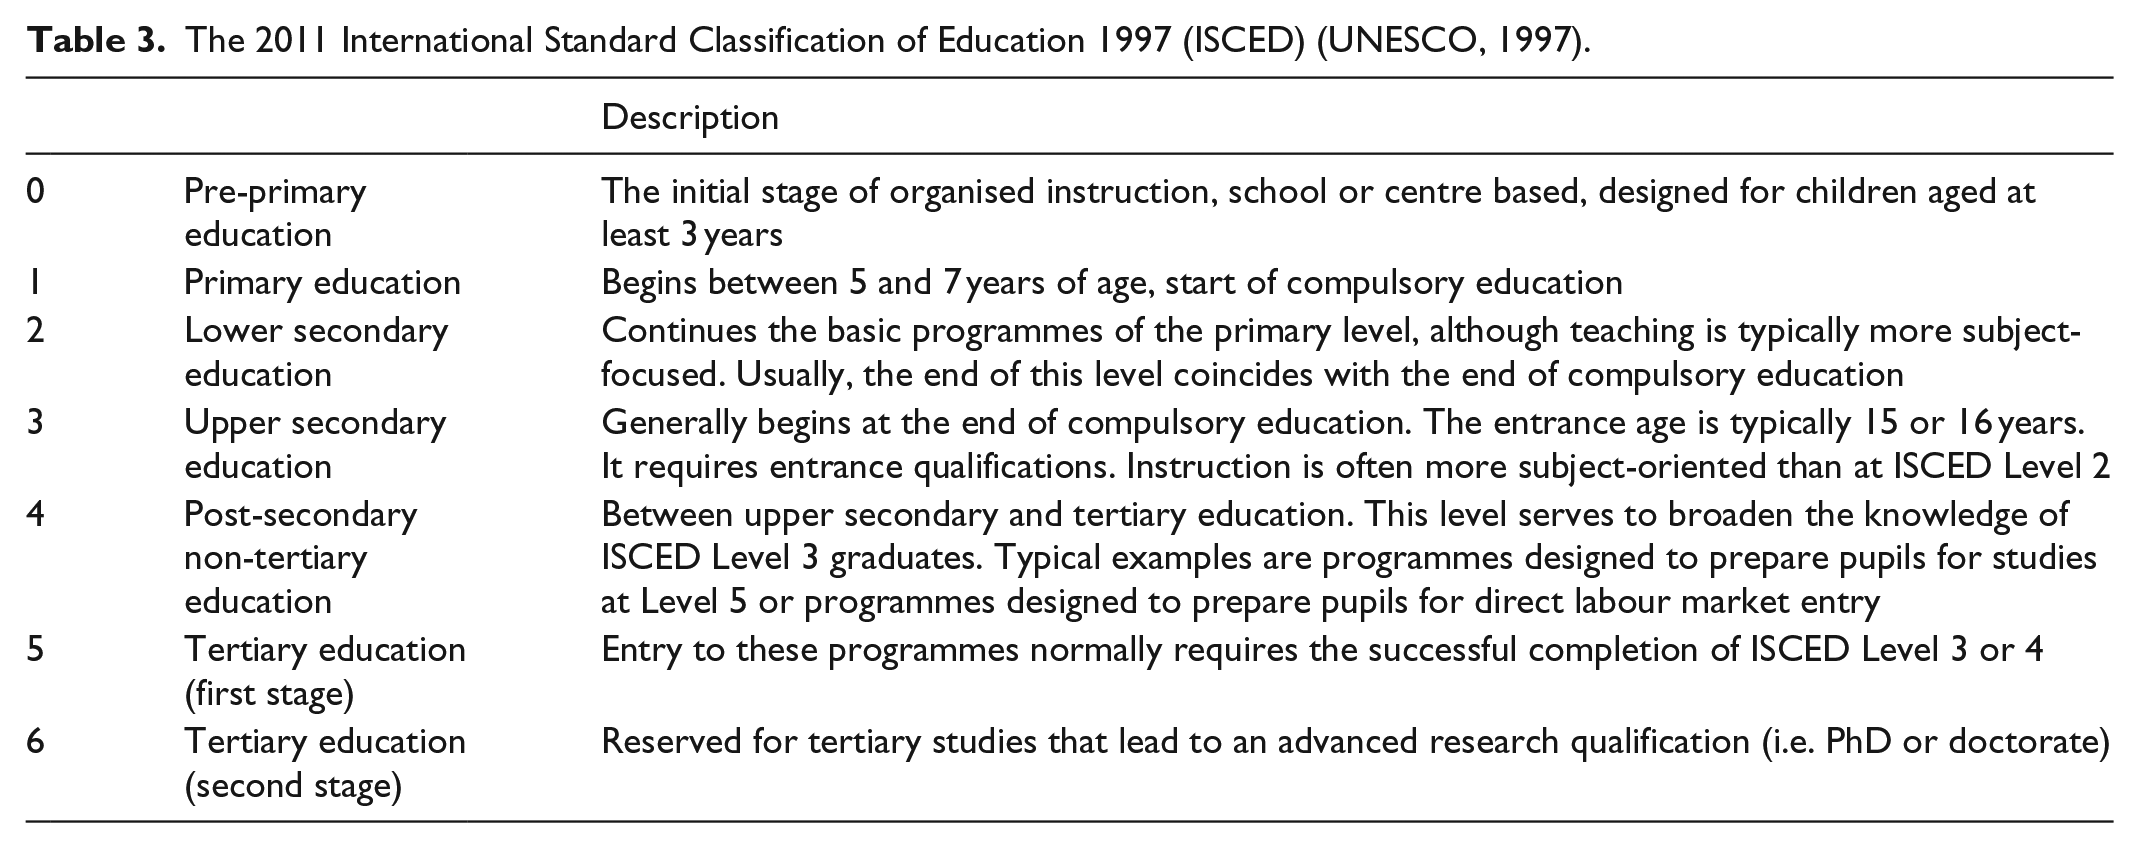
CASMIN and ISCED are specifically designed to permit cross-national comparisons and have been successfully used in large-scale comparative projects (e.g. Blossfeld and Hofmeister, 2005; Breen, 2004; Heath et al., 2007). In the United Kingdom the BHPS has deposited CASMIN and ISCED along with other educational measures, an example of good practice that other large-scale social surveys could also usefully adopt.
CASMIN and ISCED measures could also be deployed in national level analyses, although at the current time this approach is not widely used. Using these measures might help to overcome the general problem of different measures being deposited with different large-scale surveys. For within-country analyses there may also be benefits to developing similar theoretically informed but nationally specific, standardised educational categorizations. Although the methodologies behind such new measures must be theoretically informed and well thought through, they must be appropriately documented and must not be developed on an ad hoc basis.
Despite their ubiquity in large-scale surveys there are limitations to undertaking analyses using categorical educational qualification measures. Many qualification measures have large numbers of categories which can be cumbersome to work with. Educational measures with many levels routinely have some sparse categories, even when sample sizes are relatively large. In practice, researchers will often want to make comparisons between respondents with different education levels, which are more difficult with measures with a large number of categories. In our experience interpreting the influence of an interaction between a categorical educational measure and another explanatory variable can be taxing especially when both measures have a large number of categories. The use of scales is an obvious strategy for addressing this problem, 11 this is the focus of the next section.
Scaling education measures
Another approach to the analysis of educational qualifications involves developing scales based upon some relevant criteria. For example a qualification might be ranked by the average income of workers with that certain level of education. Treiman (1977, 2007, 2009) has advocated this approach which is sometimes called ‘effect proportional scaling’. Buis (2010) has demonstrated a variety of methods for producing scales of education, based upon the association between educational qualifications and other outcomes, for example income and occupational positions. Buis (2010) and Lambert (2012) advocate scoring educational qualifications because a large number can be attributed to a single scale. In a statistical modelling framework scoring offers a parsimonious way of summarising detailed educational data. In our experience interpreting the influence of an interaction between a metric educational measure and another explanatory variable can be more straightforward than interpreting an interaction between two categorical variables (especially when one or both measures have a large number of categories). Despite these attractive properties a cursory review of existing studies leads us to conclude that approaches which scale education are not popular in secondary social survey data analyses within contemporary sociology, but as Treiman (1977, 2007, 2009) demonstrates in some empirical inquiries scales may be beneficial.
Scaling approaches are not without limitations, Chauvel (2002) for instance argues that the nature of educational attainment is too complex, heterogeneous and multi-dimensional to be represented on a unidimensional scale. He concludes that scaling educational attainment may therefore hide complex qualitative differences between individuals. We recognise that this is a justifiable methodological point. Buis (2010) and Lambert (2012) however provide extended exploratory analyses that persuade us that in practice, for many research purposes, this is not a serious limitation to using a scaling approach.
Credential inflation is a particularly difficult issue to deal with when categorical schemes of educational qualifications are used. Scaling approaches have the attraction of allowing the adjustment of scores to reflect changes between educational cohorts. For example, the score attributed to a degree level qualification could be set lower for more recent educational cohorts, in order to recognise the relative growth in graduate level education. We note that a useful alternative method to combating credential inflation has been demonstrated by Tam (2007). This approach is called a Positional Status Index (PSI), and scores represent the percentage of other survey respondents that an individual has to overtake in order to reach their educational level. The PSI approach provides a within educational cohort measure and therefore lends itself towards providing increased control for credential inflation. Bukodi and Goldthorpe (2013) have successfully employed this approach when analysing data from three British birth cohorts covering different educational periods. 12
Conclusion
Measures of education are essential components of many sociological analyses and are powerful predictors of a diverse range of social outcomes. We began this article with the claim that education is more difficult to measure than is often assumed. We have tried to draw attention to some hidden challenges associated with undertaking analyses, which include educational measures. We conclude by making the recommendation that researchers place careful thought into which educational measure (or measures) they select when analysing survey data.
In nations such as the United Kingdom, the education system and qualifications appear to almost be in a constant state of flux. We have highlighted that these changes have genuine influences on education data. It is important for survey data analysts to consider the educational context in which survey respondents undertook their education. We advise against researchers developing ad hoc educational measures which do not facilitate comparability across studies and which do not support reliable and valid replications. When social surveys contain a number of competing measures, or when researchers can produce different measures, we argue that they should undertake sensitivity analyses which evaluate the merits of different educational measures. As a routine part of their analytical programme researchers should make their sensitivity analyses public, for example in data supplements, on web pages or in institutional repositories.
In circumstances where survey data analysts construct new educational measures, it is desirable that they place effort into clearly documenting the theoretical basis of the measures and how they were practically constructed. It is also important that these details are preserved and made available to the wider research community. These practices chime squarely with efforts to introduce more replicability and with an atmosphere of ‘open data’ in the social sciences (see Freese, 2007). There have already been a few efforts in the social sciences to bring together documentation and metadata about the construction of educational measures (Ganzeboom and Treiman, 1992; Lambert et al., 2011). We suggest that these good practices should be encouraged. These activities should support researchers in being better positioned to operationalise and compare the properties of multiple relevant measures. These are good habits which have the potential to bring long-term improvements in the way in which data on education is used in social science research.
Footnotes
Declaration of conflicting interests
The author(s) declared no potential conflicts of interest with respect to the research, authorship, and/or publication of this article.
Funding
The author(s) received no financial support for the research, authorship, and/or publication of this article.