
Abstract
The interaction between music and the environment has been widely investigated in various domains; however, the effects of music on the perception of outdoor environments have not been adequately examined. A better understanding of audio-visual interactions between music and the natural environment is important for music psychology, because the field is currently employing natural sounds, yet their pairing remains poorly understood. Furthermore, this understanding is vital for soundscape research, given that individuals are increasingly listening to music on headphones in natural settings. This has practical implications wherever music and the natural environment are paired. This study explored the audio-visual interaction between music and the perception of natural environments. Four types of natural images were presented based on their attractiveness/unattractiveness and visual openness/closedness. At the same time, the participants listened to sad or happy music. Both self-reported assessment data and data obtained through automated software analysis of emotional facial expressions represented in the form of emotional engagement were analyzed. The results showed that, compared to listening to sad music or no music, exposure to happy music resulted in an increase in self-reported environmental preference. However, sad music did not significantly decrease self-reported environmental preference or self-reported pleasant feelings compared to the control no-music condition. Analysis of the engagement in facial emotional expressions showed that sad music decreased engagement compared to the no-music condition in all types of environments; however, when listening to happy music, the participants’ engagement was lower in unattractive environments but not in attractive environments compared to when they did not listen to any music.
Keywords
Introduction
People listen to music during various daily activities, and many musical experiences occur in public spaces (e.g., Greasley & Lamont, 2011; North et al., 2004; Rentfrow, 2012). People also listen to music while walking or running outdoors (Heye & Lamont, 2010; Leman et al., 2013; Styns et al., 2007). Moreover, listening to music also occurs during various individual activities in the natural environment. In this context, there have also been attempts to incorporate music into relaxation activities in nature parks (Steele et al., 2021). Similarly, music has also become part of various relaxation videos in which the natural environment and music are combined and has been included in natural history documentaries (Wheatley, 2004).
Pairing music and nature raises the question of how specific music can change perceptions of diverse outdoor environments. Although the audio-visual interaction between music and the environment has been widely investigated in certain domains, for example, in marketing studies that have explored the effects of in-store music on customers’ perceived atmosphere (for reviews, see Garlin & Owen, 2006; North et al., 2004), the effects of music on the perception and evaluation of outdoor environments, either built or natural, have not been adequately examined. The present study explored audio-visual interactions, specifically the effect of listening to music on the perception of and responses to different types of natural scenery. Audio tracks with sad or happy music were used as musical stimuli, and the natural environments differed in their attractiveness and visual openness. Both self-reported assessment data and data from automated software analysis of emotional facial expressions were used and compared.
Audio-Visual Interactions Between Music and the Natural Environment
Within the environmental psychology literature, the audio-visual interactions between natural and anthropogenic sounds and assessments of the natural environment have been explored. In a pioneering study, Anderson et al. (1983) reported that natural and animal sounds had enhancing effects on evaluations of wooded natural and residential sites, while other sounds had detracting effects on evaluations of the same sites. More recently, Gan et al. (2014) reported that anthropogenic sounds (e.g., vehicle alarms, motorcycle rumbling, and the roar of engineering machinery) had a negative impact on landscape preference in contrast to biological and geophysical sounds. A series of studies have examined the effect of anthropogenic sounds on the evaluation of landscapes in U.S. natural parks. Mace et al. (1999) showed that helicopter tour noise, unlike natural sounds, impaired evaluations of scenic overviews in a national park. Benfield et al. (2010) reported that anthropogenic sounds negatively affected the visual assessment of landscapes. Furthermore, Weinzimmer et al. (2014) showed that motorized recreation noise had detrimental effects on the ratings of both aesthetic and affective dimensions of the environment. In contrast, the positive effect of natural sounds, specifically bird songs, contributes to positive values associated with urban green space (Hedblom et al., 2014).
Conversely, it has been documented that the evaluation of sound environments can be affected by co-occurring visual settings. For instance, Lee et al. (2014) showed that noise from a high-speed train was rated as less annoying if the sound was presented with a picture containing a greater percentage of natural features. Similarly, Van Renterghem and Botteldooren (2016) reported that the extent to which vegetation was visible through the living room window was a strong predictor of self-reported noise annoyance among residents with high exposure to traffic noise.
A body of research has shown that restoration and physiological recovery from stress occur faster during exposure to pleasant nature sounds than during exposure to anthropogenic sounds, which are perceived as less pleasant (e.g., Medvedev et al., 2015; Ratcliffe, 2021; Zhao et al., 2018). The widespread use of virtual reality has led to attempts to use virtual natural environments for therapy and preventive health care (for review, see Nukarinen et al., 2022), especially to reduce work-related stress (e.g., Adhyaru & Kemp, 2022). Clearly, presentations of virtual natural environments benefited from the abovementioned soundscape research and associated virtual visual nature with natural sounds to increase the positive effect (e.g., Gerber et al., 2017; Jeon & Jo, 2020; Jo & Jeon, 2022; Xu et al., 2020).
However, few studies have examined the interactions between music and the natural environment. Iwamiya (1997) asked participants to view various landscapes from a car while listening to different types of music and to rate both the landscapes and the music on semantic differential scales. The landscapes were rated most pleasant when the participants heard music they perceived as relaxing, and their impression of the landscapes was more powerful when music was present than when it was absent. Yamasaki et al. (2015) conducted an experiment in naturalistic conditions in which participants evaluated three outdoor environments—specifically, a quiet residential area, a busy crossroads, and a tranquil park area—while listening to different types of music characterized by a level of activation and perceived valence. Their results showed that highly positive music increased the positivity ratings of the evaluated environments. Moreover, highly active music increased the activation ratings of environments that were perceived as inactive without music. In contrast, inactive music decreased the activation ratings of environments that were perceived as highly active without music. Ahmaniemi et al. (2017) explored the effect of virtual reality on stress recovery. Videos of nature scenes were presented via a head-mounted display, accompanied by natural sounds or calm music. Curiously, the stress recovery effect was stronger in audio-only conditions than in the combination of videos and sounds. Franěk et al. (2020) examined the effect of fast and slow music on the perception of environmental and emotional dimensions of outdoor environments (urban nature or urban environment without natural elements). Environments with natural elements were perceived as more pleasant, interesting, coherent, and mysterious than urban built environments, but music had only a slight influence on the evaluation of the environment. Moreover, the effect of music was mediated by the liking of music.
A recent study by Smalley et al. (2023) employed the data obtained through the BBC Soundscapes for Wellbeing initiative. This initiative engaged audiences in conversations focusing on the links between nature, music, and health. With these debates, the audience participated in an online experiment that examined responses to digital nature. They analyzed the effect of an audio-visual track with silence, natural sounds, or music specially composed for a video. The results demonstrated that adding music to this scene led to increased feelings of excitement, but no other restorative or affective benefits compared to silence. The drawback of the study was that the natural scene during the audio-visual track gradually changed to reflect the continuous changes in scenery during the day, from the early morning to the evening. However, participants rated its effect after the whole track was presented. Therefore, the study could not precisely describe the direct effects of music and specific environmental features. In contrast, the present study aimed to describe these relationships.
Environmental Preference
For several decades, a large body of studies in environmental psychology (e.g., Hartig et al., 2003; Knopf, 1983; Ulrich, 1983) has been concerned with differences in environmental preference between natural and built environments (for review, see Yang et al., 2021) and with various psychological effects associated with contact with the natural environment (for review, see Bowler et al., 2010; Bratman et al., 2012; McMahan & Estes, 2015; Yao et al., 2021). It has been repeatedly confirmed that the natural environment is preferred over built environments, and urban environments with greenery are preferred over urban environments without greenery.
Several decades ago, two influential theories that can explain these emerged. The first is the Attention Restoration Theory proposed by Stephen Kaplan and Rachel Kaplan (Kaplan & Kaplan, 1989). This theory focuses on how nature can help replenish attention and reduce the fatigue associated with prolonged exposure to the stress that accompanies everyday life in urban environments. Unthreatening natural environments can promote attention restoration because they attract unfocused attention (soft fascination) and thus help to restore attention resources. These environments have characteristics that support passive and restorative perception, allowing the brain to rest and recover from the fatigue associated with focused attention. Much research has further explored and elaborated upon this theory (e.g., for review, Bratman et al., 2012; Li & Zhang, 2024), but more recently, it has also been criticized for insufficient empirical support (Joye & Dewitte, 2018).
The second theory is Stress Reduction Theory proposed by Ulrich (1983). This theory suggests that exposure to natural environments can have positive effects on human health and well-being by reducing stress, promoting positive emotions and relaxation and alleviating negative emotions. This theory proposes that exposure to natural elements can induce a state of relaxation and calmness, leading to stress reduction. This theory was confirmed by empirical evidence based on both self-reports and diverse physiological measurements (e.g., for review, see Bratman et al., 2012).
Attractiveness and Visual Openness of the Environment
Natural environments exhibit a variety of forms, types, colors, and vegetation. There are various ways to describe and distinguish natural environments, including the following: specific physical features, such as high mountains and forest areas; water features in landscapes, such as rivers, lakes, and seas (Herzog, 1985; Völker & Kistemann, 2015; Wang et al., 2019; White et al., 2010; Yuan et al., 2023); general structural features, such as diversity and complexity (Liu et al., 2021; Lückmann et al., 2013; Ode et al., 2009); visual properties, such as visual contrast and color saturation (Berman et al., 2014); and the presence of straight lines and curves (Kardan et al., 2015). The present study follows the study by Franěk (2023), which classified natural environments according to two characteristics: attractiveness and spatial openness.
The attractiveness of an environment is not only defined by its physical features (e.g., forests, water), but also by the distinctive forms these natural elements take (e.g., pond vs. mountain lake, suburban forest vs. wild forest). This characteristic is not simply associated with notions of beauty or landscape aesthetics; rather, it reflects a distinction between the ordinary, easily accessible nature that can be found in local neighborhoods and the extraordinary, more natural scenes that can be observed in attractive tourist destinations. Firstly, the study by De Groot and van den Born (2003), which investigated visual preferences for different types of landscape in a sample of the Dutch population, highlighted the dichotomy between perceived attractive and unattractive nature (nature from our neighborhood). While most of today's Western population live in cities or suburban rural cultural landscapes, their image of “nature” is different from the landscapes of their neighborhoods and reflects their desire to escape from everyday routines. The authors showed that for the majority of respondents, the concept of “nature” is associated with visually appealing landscapes that evoke a sense of grandeur and strength, such as the sea or high mountains.
Despite this, a considerable amount of research in environmental psychology has failed to address this dichotomy. Instead, it has tended to use exceptional examples of the natural environment, such as high mountain areas or coastal and marine scenes, to illustrate the natural environment, while other studies have examined the impact of rural landscapes or examples of nature in urban parks or other urban natural settings (for review, see McMahan & Estes, 2015; Yao et al., 2021). It is clear that further research should consider this dichotomy and the meanings that participants ascribe to particular landscapes. It should be noted that perceptions of attractiveness are culturally dependent. For instance, data from the Netherlands indicated that rural residents (farmers) exhibited diminished preferences for wilderness landscapes relative to their urban counterparts (de Groot & van den Born, 2003; van den Berg & Koole, 2006). Furthermore, it remains unclear which landscapes are perceived as attractive by people living in high mountain regions, an environment that is often perceived as attractive by the typical urban population. It may be the case that people living in high mountain areas perceive a quiet and flat landscape as an attractive environment. It is therefore important to consider the impact of cultural influences and to ensure that the sample population is sufficiently homogeneous to minimize potential confounding factors.
Another physical feature of the outdoor environment that has an impact on how much people like it is the openness of the space. Whereas attractiveness is based on a subjective perception of the quality of the environment, openness is clearly given by its physical characteristics. According to Appleton’s (1996) Evolutionary Prospect-Refuge Theory, a landscape that provides a visual prospect is important for survival and will therefore be preferred. This theory has been confirmed by several studies which show that the sense of danger increases in a closed environment (e.g., Andrews & Gatersleben, 2010; Chiang et al., 2014; Gatersleben & Andrews, 2013; Nasar & Jones, 1997). Furthermore, numerous studies have confirmed that the spatial openness of a landscape is a factor that positively influences its preference (Liu et al., 2021; Sahraoui et al., 2016; Wartmann et al., 2021). Thus, both the attractiveness and the openness of an environment can contribute to environmental preference.
Emotions in Music
Music evokes emotional reactions and induces moods through a variety of intra- and extramusical mechanisms (see Juslin & Laukka, 2004, for reviews and discussions of possible mechanisms). However, Scherer (2004) argues that research into the emotional effects of music is still limited by a lack of appropriate research paradigms and methods, due to a lack of conceptual-theoretical analysis of the processes underlying the production of emotions through music. Although it can be said that music expresses emotions and that we can feel emotions in response to music, music psychologists and aestheticians have debated whether the emotions contained in music evoke an authentic and full emotional experience in the listener. Whereas “emotivists” argue that music induces real emotions in listeners (e.g., Levinson, 2011), “cognitivists” believe that the connection between musical experience and emotion is based on the habit of describing music in terms of emotional categories (Meyer, 1956; Wedin, 1972). Some proponents of this concept (e.g., Kivy, 1990) have completely rejected the idea that there is a connection between the recognized emotion contained in the music and its direct experience in the listener.
Another way of looking at emotions is to distinguish between perceived (expressed) emotions and felt emotions. The emotion expressed by a piece of music is referred to as being in the external locus, because listeners generally perceive it as part of the music itself. Moreover, listening to music can also be accompanied by a felt emotional experience (Evans & Schubert, 2008). Gabrielsson (2001) suggested that the relationship between felt and perceived emotion can take different forms: (1) a positive relationship appears when the listener's emotional response is in agreement with the emotional expression in the music; (2) a negative relationship appears when the listener reacts with an emotion opposite to that expressed in the music; (3) no systematic relationship appears when the listener stays emotionally neutral regardless of the expression of the music; and (4) no relationship appears when a person feels an emotion that cannot be expressed in music. The author suggested that a positive relationship is the most common. For instance, in an experiment validating this theoretical concept, Evans and Schubert (2008) showed that a positive relationship between perceived and felt emotions occurred in 61% of cases.
A further insight into the nature of emotions in music perception was provided by Sloboda (1992), who argued that music does not create or alter emotions, but rather allows a person to access the experience of emotions that they already experience at some level. For example, if someone is experiencing joy, a certain type of music may increase their experience of joy. However, his research did not look at immediate responses to music, but rather a generalized experience with the effect of music.
The paradox of why people enjoy listening to music that makes them sad has puzzled music psychologists and aestheticians for many years, but recent research on the paradox of “pleasurable sadness” has provided the answer. Sachs et al. (2015) provided a systematic review of research documenting the pleasures of sad music and concluded that sadness elicited by music is pleasurable (1) when it is nonthreatening, (2) when it is aesthetically pleasing, and (3) when it produces certain psychological benefits. In addition, Vuoskoski and Eerola (2017), based on research investigating the enjoyment of sad films (Hanich et al., 2014), showed that felt sadness may contribute to the enjoyment of sad music by intensifying feelings of being moved.
Measuring Emotions
No full agreement on what an emotion is has yet been reached (Izard, 2007). However, there is a consensus that subjective feelings, physiological arousal, cognitive appraisal, and expressive behavior are included in emotions (Zentner & Eerola, 2010). Among the various models of emotions (e.g., Scherer, 2000), two basic models are mostly used for measuring emotions in music. First, the categorical or discrete emotion model proposes that there is a set of primary or basic emotions. The model typically includes six primary emotions: anger, disgust, fear, joy, sadness, and surprise (e.g., Ekman, 1992). In contrast, in the second, dimensional model proposed by Russell (1980), emotional expressions can be described in two-dimensional space. One dimension is valence, which defines the positivity or negativity of an emotion, ranging from unpleasant to pleasant. The second dimension is arousal, which describes the level of excitement that the emotion represents, ranging from sleepiness or relaxation to excitement.
Emotional reactions to music have been measured predominantly by self-reports. Although this method is easily accessible, the problem with self-reported emotions is that people may sometimes have limited access to internal processes. Therefore, physiological methods (for a review, see Mauss & Robinson, 2010), such as electroencephalography, functional magnetic resonance imaging, electrocardiography, galvanic skin response, and facial electromyography, with or without combinations with self-report measures, are used in music psychology research.
Measurement of Emotional Facial Expressions
In the present study, analysis of emotional facial expressions was used to complement self-report measures. Three methods are used to measure emotional facial expressions: the Facial Action Coding System, facial electromyography, and automatic computer analysis of facial expressions. The first method, the Facial Action Coding System (FACS), is based on the subjective identification of six basic emotions. FACS is based on the premise that facial expressions are produced by the contraction and relaxation of specific facial muscles, known as action units, that account for the expression of six basic emotions (Ekman & Friesen, 1976). Action units in videorecorded faces are evaluated by specially trained human coders. This method provides sufficient validity, but its disadvantage is the considerable time required for data processing.
Facial electromyography (EMG) is based on monitoring the electrical activity of facial muscles during changes in emotional responses. Electrodes are placed on the surface of the skin. EMG enables the identification of the facial muscle patterns used to display specific emotions (e.g., Fridlund & Cacioppo, 1986). The advantage of this technique is that it can detect subtle facial muscle activity, but the problem is its technical complexity. In addition, having electrodes attached to the face is far from a natural condition.
There are some cultural differences in the expression of facial emotions. Although Ekman (Ekman & Friesen, 1976) suggested cultural universality in the expression of these basic emotions, more recent research (Jack et al., 2009; Masuda et al., 2008) has documented that Asians express some facial emotions less prominently. When recognizing emotional facial expressions, Asians look more to the area around the eyes, while Westerners look more to the area around the mouth.
Automated Facial Expression Analysis
Recent technological advances have opened new avenues for automated facial expression analysis. Recently, there have been commercial software tools for automated facial expression analysis have become available, such as Noldus’s FaceReader (Noldus Information Technology, Wageningen, the Netherlands), the iMotions FACET module (iMotions, Copenhagen, Denmark), and the iMotions AFFDEX module (iMotions, Copenhagen, Denmark).
In general, automated facial expression analysis software is based on machine learning algorithms that have been trained to recognize and classify facial expressions from training data. Facial expression analysis uses computer vision algorithms to detect faces in images. The next step is to identify key facial landmarks, such as the corners of the eyes, the corners of the mouth, and the tip of the nose. Next, features are extracted from the face to represent different facial expressions. In the final step, the classification model is applied to determine the facial expressions present. The model provides a probability score for each possible emotional expression (joy, sadness, anger, etc.) based on the learned patterns.
There is some debate about the reliability of these software programs in emotion recognition compared to facial electromyography or the Facial Action Coding System. These software tools have been validated for the classification of standardized prototypical facial expressions, and their reliability has been tested in several research studies (e.g., Beringer et al., 2019; Kulke et al., 2020; Küntzler et al., 2021; Stöckli et al., 2018; Zaharieva et al., 2024). According to some studies, facial expression analysis may have a worse ability to detect subtle affect (Stöckli et al., 2018) than does EMG, as well as to detect facial mimicry (emotional contagion through a feedback mechanism, e.g., Höfling et al., 2021; Westermann et al., 2024).
The Present Study
A study by Franěk (2023) reported that attractive and open environments are preferred and perceived as significantly more restorative than attractive closed environments, and that attractive environments are preferred and perceived as more restorative than unattractive environments, regardless of visual openness. In this follow-up study, we investigated audio-visual interactions between two types of music, sad or happy, and natural environments defined by their attractiveness/unattractiveness and spatial openness/closeness. The dependent variables were self-reports of preferences for the environment and feelings of pleasure in the environment. Self-reports were combined with measures of facial expressions of emotional engagement using automated software analysis. Since Yamasaki et al. (2015) reported that highly positive music increased the positivity ratings of the evaluated environments, it can be assumed that happy music could have a similar effect on the perception of the environment and the emotional feelings in the environment, including corresponding facial emotional expressions. The effect of sad music is not clear. Recent research has shown that sad music may also be associated with pleasure (e.g., Sachs et al., 2015). A further question concerns the interaction between type of music and type of environment, and whether specific music has a different effect in attractive/unattractive and open/closed environments.
We also wanted to test the possibility of measuring emotional expression through automatic computer analysis. Kayser (2017) proposed the use of facial expressions of emotion in the study of music-induced emotion as a new approach that could avoid some of the shortcomings associated with other methods, but to date this method has only been used exceptionally in music psychology research (e.g., Kayser et al., 2022; Weth et al., 2015). Clearly, facial emotional expressions are spontaneous and involuntary manifestations of emotional experience. Therefore, they may provide more reliable results in terms of representing subjectively felt emotional experiences than the way emotions in music are subjectively rated.
In summary, the present study addresses the following research questions:
Does happy music increase environmental preference, pleasant feelings, and emotional facial responses when viewing environments compared to sad music and no-music conditions? Do sad and happy music in different types of environments affect environmental preference, pleasant feelings, and emotional facial responses differently? Is there an effect of the type of environment on music liking? Does the method of measuring emotional expression through automated software analysis sufficiently reflect differences in emotional responses to music and the environment?
Materials and Methods
Design
This study utilized a mixed 3 × 4 design with the between-subjects factor music condition (no-music condition, sad music, happy music) and the within-subject factor type of environment (attractive open, attractive closed, unattractive open, unattractive closed environments).
Participants
The sample size was calculated with G*Power (Faul et al., 2007) considering an effect size (f) of 0.25, an alpha level of 0.05, a power value of 0.95, and repeat measures and within-between-subject interactions. The analysis revealed that the study required at least 45 participants. The data were collected from 125 participants aged between 18 and 25 (Mage = 20.8, SD = 1.46), 50 of whom were female. The participants were undergraduate students of informatics, business, and tourism at the University of Hradec Králové who were enrolled in various psychology courses. The participants were randomly assigned to one of the two conditions involving music listening (sad music [n = 41] vs. happy music [n = 41]) or to the no-music control group [n = 42].
Stimuli
Music. Two types of music were used in the experiment: sad music and happy music. The sad music was represented by the music track Mad World (Michael Andrews, movie “Donnie Darko”, 2001), and the happy music was represented by the music track One Fine Day (The Offspring, Conspiracy of One, 2000). Each piece was repeated several times in the music track. These pieces were borrowed from the study by Franěk et al. (2014), in which the participants were asked to select and submit two files of different types of music that they liked. We used two typical examples from this selection, which could fully represent sad and happy music.
Following the selection of the aforementioned music tracks, we additionally asked the participants who did not take part in the main study to rate the degree of sadness and happiness associated with the music track Mad World and the degree of happiness and sadness conveyed by One Fine Day, in addition to expressing their liking for each. Thirty-five participants aged between 18 and 24 (Mage = 21.29, SD = 1.49), 16 of whom were female, participated in the evaluation. The participants were undergraduate informatics, business, and tourism students at the University of Hradec Králové. The items “It is a sad music” and “It is a happy music” were assessed on a 5-point Likert-type scale ranging from 1 (not at all) to 5 (completely). For the music track Mad World, the agreement with the item “It is a sad music” was M = 4.71, SD = 0.75 and for the item “It is a happy music” was M = 1.40, SD = 0.95. The t-test showed that the sadness rating was significantly higher than the happiness rating, and the effect size was high (t = 21.96, p < 0.001, Cohen's d = 3.87). For the music track One Fine Day, the agreement with the item “It is a happy music” was M = 4.66, SD = 0.80 and the agreement with the item “It is a sad music” was M = 1.20, SD = 0.47. The t-test showed that the happiness rating was significantly higher than the sadness rating, and the effect size was high (t = 21.96, p < 0.001, Cohen's d = 5.27).
The item “I like the music” was assessed on a 5-point Likert-type scale ranging from 1 (not at all) to 5 (completely). The agreement with the item for the music track Mad World was M = 3.48, SD = 1.15. The agreement with the item for the music track One Fine Day was M = 3.96, SD = 0.90. The t-test showed no significant differences between the music preference scores (t = 0.07, p = 0.945).
Visual stimuli. We used visual stimuli from the study by Franěk (2023). These stimuli consisted of four images of attractive and open environments, four images of attractive and closed environments, four images of unattractive and open environments, and four images of unattractive and closed environments (Figure 1). In that study (Franěk, 2023), the attractiveness/unattractiveness of images was selected according to the participants’ ratings, while the spatial openness of the scene was determined by the author of the study because this openness of the environment was an unambiguous feature of the images used. The attractive images were downloaded from the Pixabay internet server (https://pixabay.com/), and the unattractive images were taken by the author (Franěk, 2023). The attractive open images consisted of photographs of high mountains, lakes, or coastal areas. The unattractive open scenes were typical landscapes from the Czech Republic where the participants were living. The attractive closed scenes represented images of different forests and were also downloaded from the Pixabay internet server, while the unattractive closed scenes were taken from Czech forests.

Visual stimuli used in the study: attractive open environments, attractive closed environments, unattractive open environments, and unattractive closed environments.
Measures
Self-reported assessment of environmental preference. Environmental preference was rated by the item “I like the environment.” This item was assessed on a 5-point Likert-type scale ranging from 1 (not at all) to 5 (completely). The question about liking a particular environment has been used in environmental preference questionnaires (e.g., Kaplan, 1977).
Self-reported assessment of pleasant feelings. Perceived pleasant feelings related to the specific environment was rated by the item “I have pleasant feelings here.” The item was assessed on a 5-point Likert-type scale ranging from 1 (not at all) to 5 (completely).
Measure of facial expressions—engagement. Facial expressions were measured with the iMotions Facial Expression Analysis Module AFFDEX (iMotions, Copenhagen, Denmark). The web camera recorded facial videos while the participants viewed the stimuli, and then the videos were further processed with the software iMotions. The AFFDEX classifiers enable the determination of seven basic emotions (joy, anger, surprise, fear, contempt, sadness, and disgust) and compute measures for valence and emotional engagement. The AFFDEX is based on a machine learning principle. It works with a database of 27,000 human FACS-encoded videos of faces expressing an affect. To evaluate the likelihood of activity of action units of new videos, AFFDEX compares them with the database. In a further step, the combined activity of specific action units is used to derive the probability of the presence of a basic affect. (McDuff et al., 2016).
The software has been validated in several research studies (Kulke et al., 2020; Stöckli et al., 2018), but it is still not widely used in relevant research. Although software enables the registration of basic individual emotions, we analyzed only the measure of engagement. Previous investigations from environmental psychology research using similar visual stimuli (Franěk & Petružálek, 2021; Franěk et al., 2022) has shown that facial movements corresponding to individual basic emotions do not occur in a distinct way in response to images of the natural environment under laboratory conditions. Engagement, or the subject's expressiveness, is a measure of facial muscle activation that reflects the emotional responsiveness that the stimuli elicit. It is a weighted sum of the facial expressions of brow raise, brow furrow, nose wrinkle, lip corner depressor, chin raise, lip pucker, lip press, mouth open, lip suck, and smile. The measure of engagement reflects the emotional responsiveness with positive valence in the facial expressions that the stimuli trigger. All emotional indicators were scored by the software on a scale from 0 to 100, indicating the probability of the emotion being detected. A magnitude of 0 indicated that the emotion was absent, and a magnitude of 100 indicated a 100% probability of having detected the emotion.
Liking the music. The participants’ liking of the music was rated by the item “I like the music.” The item was assessed on a 5-point Likert-type scale ranging from 1 (not at all) to 5 (completely).
Procedure
After arriving at the laboratory, the participants provided written informed consent for the collection and use of the data. Then they were informed about the experiment and read the instructions. The instructions were as follows: “During this experiment, you will see 16 pictures. The pictures show a certain natural environment. Try to imagine that you are in this natural environment right now and look carefully at the picture.” Facial emotional expressions were registered while the participants viewed the pictures. After each picture was presented, the next page was presented with the same picture of reduced size and with a questionnaire containing questions about the level of environmental preference, the pleasant feelings in the environment, and the liking of the music. In both musical conditions, a music track was initiated during the presentation of the first picture and played continuously until the end of the experiment. The presentation of 16 visual stimuli and their evaluation lasted approximately two to three minutes.
The experiment was controlled by a PC computer with a 1920 × 1200 pixel resolution screen and a diagonal of 61 cm with a Logitech Webcam C920 camera situated on the top of the screen. All stimuli were presented on a computer screen. The participants sat approximately 70 cm from the display monitor. The pictures were presented in a random order. Every trial started with a fixation cross situated in the center of the screen on a grey background. The participants had to focus on the fixation cross for 2 s before the image appeared. Each picture was displayed for 15 s.
Statistical Analyses
Prior to the analyses, the normality and sphericity of the data were tested. The data met the required assumptions for parametric testing. A series of mixed ANOVAs were conducted to assess the effect of music condition and type of environment on the dependent variables. The music condition (no-music, sad music, happy music) was chosen as a between-subject factor, and the type of environment (attractive open, attractive closed, unattractive open, unattractive closed) was chosen as a within-subject (repeat-measures) factor. The dependent variables were environmental preference, pleasant feelings, engagement, and music liking. The statistical analyses were performed with Statistica 12 software (StatSoft, Inc.).
Results
Correlations Between the Variables
The correlation matrices between the variables of environmental preference, pleasant feelings, and engagement are shown in Table 1. The results revealed highly significant correlations between the magnitudes of environmental preferences and pleasant feelings in all types of environments, as well as significant correlations among facial expressions of engagement in all types of environments. However, significant correlations between engagement and the corresponding values of environmental preferences and pleasant feelings were not found.
Correlation matrix between the variables of environmental preference, pleasant feelings and engagement.

The significant correlations (p < 0.05) are marked with asterisks.
Self-Reported Assessment of Environmental Preference
The average environmental preference scores are shown in Table 2 and Figure 2. A mixed ANOVA revealed a significant main effect of music condition (F(2,121) = 3.868, p = 0.024, partial η2 = 0.060) and a significant main effect of the environment (F(3,363) = 135.031, p < 0.001, partial η2 = 0.527), but not a significant interaction between music condition and environment (F(6,363) = 1.697, p = 0.121). A post-hoc Tukey test showed that the environmental preference score was significantly higher for happy music than for sad music and for happy music and the no-music condition. There was no significant difference between the environmental preference scores for the no-music condition and sad music. Furthermore, a post-hoc Tukey test showed significant differences between the environmental preference scores of all environments in the following direction: attractive open, which was the highest, attractive closed, unattractive open, and unattractive closed, which was the lowest.
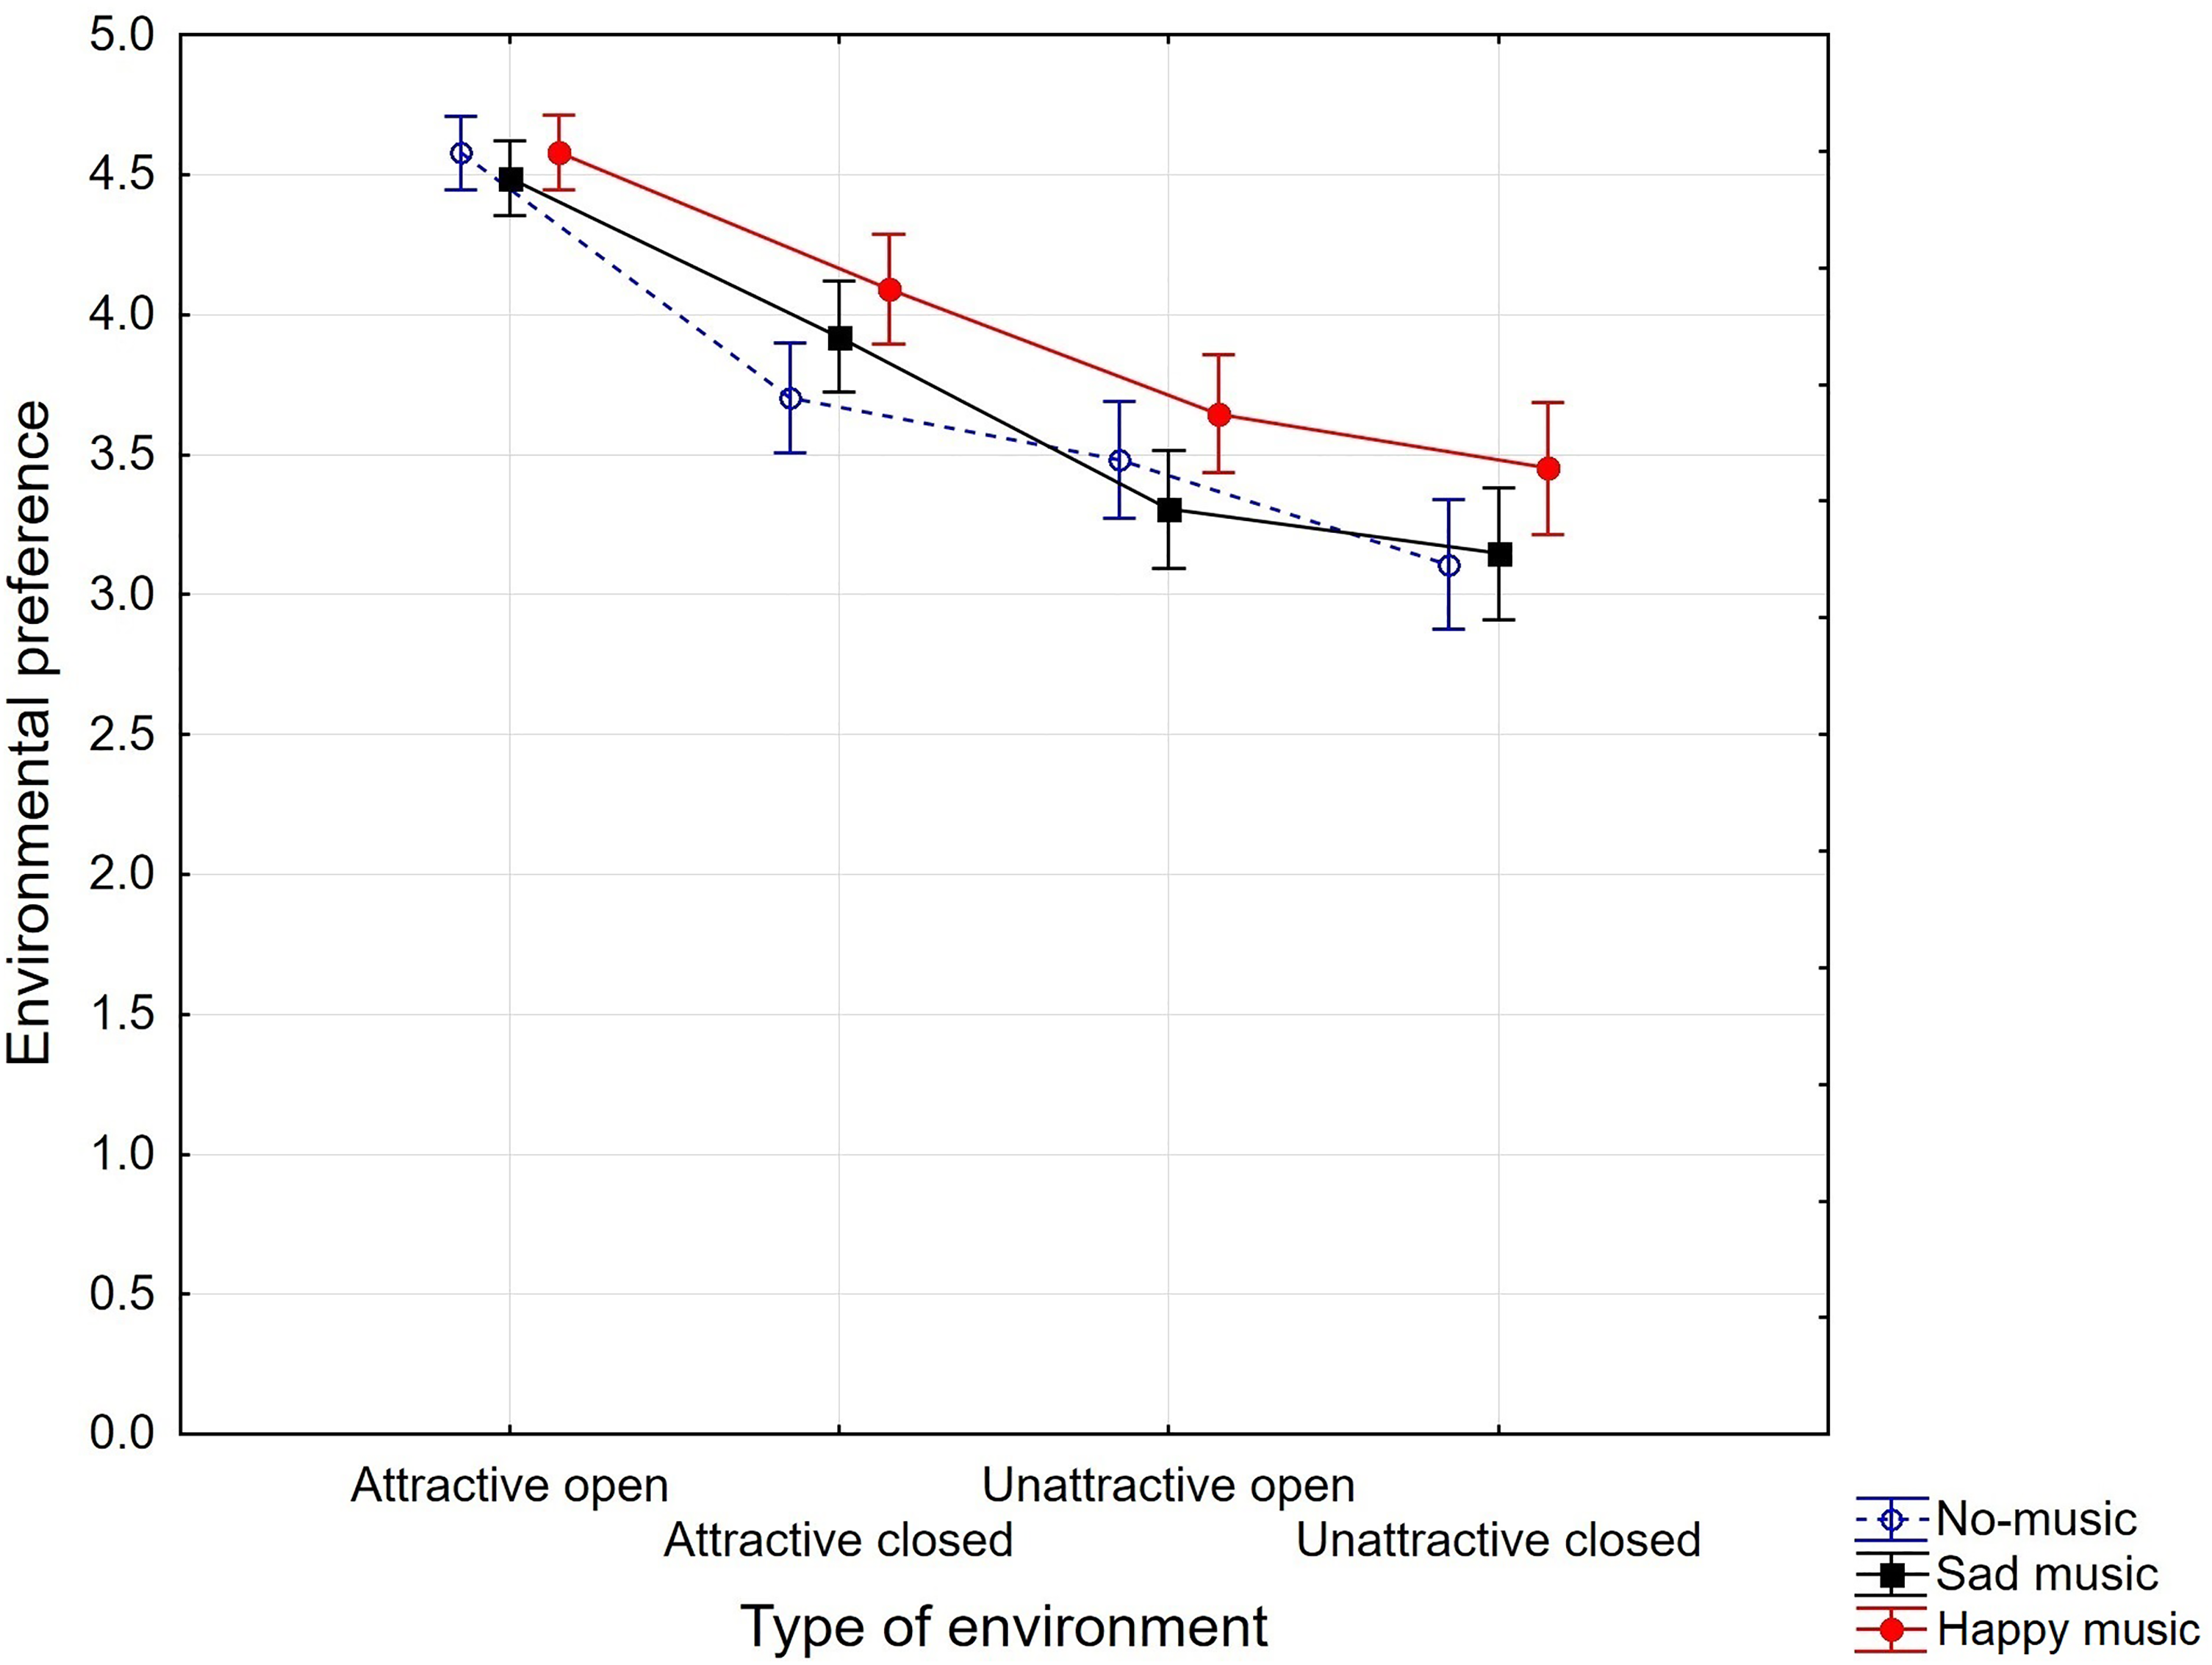
Mean ratings with confidence intervals of environmental preferences for four environments and control no-music condition and two music conditions. The scale ranged from 1 to 5 (1 = not at all, 5 = completely).
Mean ratings and standard deviations of environmental preference and mean ratings of pleasant feelings for four environments and control no-music condition and two music conditions.

The scale ranged from 1 to 5 (1 = not at all, 5 = completely).
Self-Reported Assessment of Pleasant Feelings
The average pleasant feelings scores are shown in Table 2 and Figure 3. A mixed ANOVA revealed an almost significant main effect of music condition (F(2,121) = 2.815, p = 0.064, partial η2 = 0.044) and a significant main effect of the environment (F(3,363) = 87.865, p < 0.001, partial η2 = 0.420), but not a significant interaction between music condition and environment (F(6,363) = 1.070, p = 0.380). A post-hoc Tukey test showed that the pleasant feelings score was almost significantly higher for happy music than for sad music (p = 0.064). Furthermore, a post-hoc Tukey test showed significant differences between the pleasant feelings scores for all environments except the attractive closed and unattractive open environments in the following direction: attractive open, which was the highest, attractive closed, unattractive open, and unattractive closed, which was the lowest.

Mean ratings with confidence intervals of pleasant feelings in the four environments and the control no-music condition and two music conditions. The scale ranged from 1 to 5 (1 = not at all, 5 = completely).
Facial Expressions of Engagement
The average levels of engagement are shown in Table 3 and Figure 4. A mixed ANOVA revealed a significant interaction effect between music condition and environment (F(6,363) = 2.366, p = 0.023, partial η2 = 0.04). A post-hoc Tukey test showed that the level of engagement in the attractive open environment in the sad music condition was significantly lower than in the unattractive open environment in the no-music condition, and significantly lower than in the unattractive closed environment in the no-music condition. The main effect of music condition was also significant (F(2,121) = 4.038, p = 0.020, partial η2 = 0.065). Furthermore, a post-hoc Tukey test showed that engagement was significantly lower in the sad music condition than in the no-music condition. The main effect of environment (F(3,363) = 1.663, p = 0.175) was not significant.

Mean magnitudes with confidence intervals of engagement for four environments and control no-music condition and two music conditions. The scale represents the probability of having detected the emotional reaction (0—the emotional reaction is absent, 100—a 100% probability of having detected emotional reaction).
Means and standard deviations of the engagement for the four environments and the control without music and with two music conditions.

The scale represents the probability of detecting the emotional reaction (0 = the emotional reaction is absent, 100 = a 100% probability of having detected emotional reaction).
The Effect of Music Condition and Environment on Music Liking
The effects of music conditions and the environment on music liking were explored. A mixed ANOVA showed that none of the following were significant: the main effect of music condition on music liking (F(1,80) = 2.387, p = 0.126), the main effect of the environment on music liking (F(3,240) = 1.441, p = 0.236), and the interaction between music condition and environment (F(3,240) = 0.552, p = 0.647).
Discussion
The present study explored the audio-visual interaction between music and the perception of natural environments, the effect of two types of music, sad or happy, on environmental preference, and emotional reactions while observing diverse natural images. The crucial question was whether Happy music can increase environmental preference and evoke more positive emotions than exposure to sad music or the no-music condition.
Clearly, listening to music that is pleasant, happy, and liked usually results in positive emotional responses (e.g., Juslin & Sloboda, 2012). It is therefore not surprising that pairing happy music with natural images resulted, according to self-reported assessments, in a significant increase in environmental preference and an almost significant increase in pleasant feelings in all environments compared with listening to sad music and to the control no-music condition. This finding is consistent with Yamasaki et al.’s (2015) study, in which highly positive music increased the positivity ratings of the evaluated environments. Although it might be expected that sad music would impair the evaluation of an environment by inducing sadness and subsequent negative emotions, which could negatively affect the perception of the environment, our data showed that sad music did not significantly reduce environmental preference or pleasant feelings compared to the no-music control condition. Thus, in this case, sad music probably did not elicit negative emotions, which may be explained by the “pleasurable sadness” paradox (Sachs et al., 2015). This is the most likely explanation for why the sad music in this experiment did not reduce environmental preferences or pleasant feelings compared to the no-music condition. Moreover, our results showed that different emotional valences of both types of music did not influence music liking.
Yamasaki et al. (2015) offered several possible explanations for how a listener may transfer emotional valence from the experience of listening to music to the evaluation of a physical environment. Some of these explanations may be relevant for this study. First, music evokes emotional responses and induces moods in the listener. Thus music-induced positive affect may have led to more positive evaluations of the physical environments. Second, the evaluation of a physical environment may be due to music's effect on arousal; the music may have modulated the listeners’ arousal level, which in turn may influence their environmental evaluations (e.g., higher arousal leading to a higher degree of perceived activity). Third, attentional processes may play a role. Active or inactive music may have directed attention to specific aspects of the physical environment congruent with these musical qualities. Furthermore, music with positive perceived qualities may have directed attention more towards positive aspects of the physical environment than towards negative features of the physical environment.
However, these explanations are from the point of view of music psychology and assume that listening to music can affect how we perceive a particular physical environment, but do not assume that the physical characteristics of an environment might also influence the evaluation of the music heard in that environment. Therefore, the next research question was whether there is an effect of the type of environment on music liking. We could speculate that a positively evaluated environment might lead to a positive evaluation of the music listened to in that environment, and conversely, a negatively evaluated environment might lead to a negative evaluation of the music listened to in that environment. However, our data did not show that differences in environmental preferences influence music liking.
It is worth noting that some evidence for the effects of the physical characteristics of an environment on the evaluation of acoustic stimuli has been provided by recent soundscape research, which shows that co-occurring visual settings, namely vegetation and natural surroundings, can result in lower noise annoyance (e.g., Bodin et al., 2015; Lee et al., 2014; Van Renterghem & Botteldooren, 2016). However, these studies compared differences between urbanized environments and environments with natural elements but not the influence of different types of natural environments, as in our study. Moreover, they explored the effect of an environment on noise perception, not the effect on music evaluation and liking. This is probably the reason why our data did not show that the type of natural environment influences music liking. Furthermore, while it has been repeatedly observed that the openness of a landscape is a factor that positively influences its preference (Liu et al., 2021; Sahraoui et al., 2016; Wartmann et al., 2021), this does not necessarily mean that the closedness of an environment has a negative effect on the evaluation and liking of the music to which people listen in that environment. It should be noted, however, that the interaction between music and the environment has mostly been studied from a music-psychological point of view; therefore, the influence of the environment on music perception has not yet been systematically investigated and deserves further research.
The next question was whether sad and happy music listened to in different types of environments had different effects on environmental preference and pleasant feelings. For example, one might expect that the combined effect of listening to happy music and viewing preferred attractive and open environments would lead to a more positive evaluation of the given environment than listening to sad music or in the no-music condition, but this was not the case.
The data showed that according to self-reported assessments, there were no interactions between types of music and types of environments defined by their attractiveness and openness. Neither sad nor happy music had a different effect on environmental preference or pleasant feelings in different types of environments. It was observed that exposure to both types of music preserved the same pattern of environmental preferences and pleasant feelings in the direction observed in the study by Franěk (2023) in the four environments: in the attractive open environment, both variables had the largest magnitude, followed by the attractive closed environment, the unattractive open environment, and the unattractive closed environment, which had the lowest magnitude of both variables. Thus, although happy music increased ratings of all environments, it did not suppress the influence of environmental features, environmental attractiveness, or spatial openness/closedness.
We also combined self-report measures with measures of emotional facial expressions by registering emotional engagement. Automated software analysis of facial expressions is a relatively new technique, and there is limited experience with this method in some areas of research, including environmental and music psychology. Previous environmental psychology studies using similar visual stimuli (Franěk & Petružálek, 2021; Franěk et al., 2022) have shown that facial movement responses that can be identified by software as individual basic emotions (e.g., joy, sadness) do not occur distinctively in response to images of the natural environment under laboratory conditions. Recently, Cross et al. (2023) discussed the limitations of automated approaches to coding facial expressions. The software is usually based on Paul Ekman's hypothesis that there are six basic emotions: happiness, surprise, sadness, anger, disgust, and fear (Ekman et al., 1969). The problem is that these concepts of emotion may limit the number of facial expressions that can be identified, as well as the association of emotion with facial expressions. The authors suggest that the output of the software should describe which facial action units are activated and how intensely they are activated. Thus, instead of automated software recognition of individual basic emotions, this study used the measure of engagement provided by the iMotions AFFDEX software. The measure of engagement reflects the emotional responsiveness with positive valence in the facial expressions elicited by the stimuli.
However, a comparison of the data obtained via self-reports and registered facial emotional reactions revealed some differences, as we did not find correlations between engagement and the corresponding values of environmental preferences and pleasant feelings. First, according to self-reported assessments, sad music did not decrease the ratings of environmental preference or pleasant feelings; however, the analysis of changes in engagement in facial emotional expressions revealed that sad music decreased engagement compared to no-music condition.
Second, while the self-assessments of environmental preference and pleasant feelings did not reveal any interaction between musical conditions and the type of environment, such interaction appeared in facial emotional expressions. Although sad music induces lower facial engagement when observing all types of environments, in listening to happy music, engagement was lower in unattractive environments but not in attractive environments compared to the no-music condition. Thus, while self-reported assessments of environmental preference and pleasant feelings were not differentially influenced by the attractiveness/unattractiveness of the environment under exposure to happy music, the attractiveness/unattractiveness of the environment influenced the magnitude of engagement under exposure to happy music. In conclusion, the differences between the results obtained by self-reporting and those obtained by measuring facial expressions indicate the usefulness of supplementing subjective assessment with various physiological methods, including analysis of emotional facial expressions.
Several previous studies that have analyzed facial expressions while listening to music have shown differences in facial expressions while listening to happy and sad music, manifested by differences in zygomatic facial muscle activity (e.g., Bullack et al., 2018; Lundqvist et al., 2009). For example, Fuentes-Sánchez and colleagues (2021) gave participants extracts of unpleasant, pleasant, and neutral music. Using facial electromyography to analyze facial expressions while listening to pleasant music, they showed that listening to pleasant music produced greater zygomatic responses than listening to neutral and unpleasant music. However, discussion of these findings is limited by insufficient knowledge of facial emotional responses to music, namely those recorded by automated software. Weth et al. (2015) investigated emotional responses to self-selected sad music via self-reports and automated facial analysis with the software FaceReader (Noldus, the Netherlands). They found that self-selected sad music evoked significantly more sad facial expressions than happy excerpts. Kayser et al. (2022) filmed participants during a concert and subsequently analyzed facial expressions with the automated facial analysis software FaceReader. The results showed that music expressing sadness led to more facial expressions of sadness, and music expressing happiness led to more facial expressions of happiness. In contrast to our study, these data were only obtained in response to music alone; moreover, the importance of music as a stimulus in the Kayser et al.’s (2022) study was enhanced by exposure to self-selected music or the presentation of music in a live concert.
This study has several limitations. There are many types of natural environments that can be classified according to different criteria. In this study, the classification was based on two specific characteristics: attractiveness/unattractiveness and visual openness/closedness. In particular, the perception of the attractiveness of the environment may be individual and culture specific; therefore, the results cannot be generalized across cultures. Furthermore, the selection of only two types of music and their possible interaction with individual music preferences may be limited, even if we used commonly accepted easy listening music. Some studies have shown that self-selected music can lead to stronger emotional responses than music selected by an experimenter (e.g., Liljeström et al., 2013). It is therefore possible that when participants listened to their favorite music, to which they usually tend to respond strongly, we could register more expressive facial expressions and identify facial expressions typical of certain emotions, especially joys. A further question is whether the observed effects can be attributed solely to the emotional valence of the music, specifically the contrast between happiness and sadness, or whether the results may also be influenced by the arousing qualities of the selected music. Typically, happy music is associated with increased arousal, whereas sad music is associated with decreased arousal. This is consistent with the human experience of emotions and behaviors commonly associated with happy and sad moods. Although there are exceptions, the association between happy music and high arousal, and sad music and low arousal, is ubiquitous. Ideally, future work would collect arousal alongside valence ratings to address this issue. It should be noted, however, that it is not easy to separate the effects of valence and arousal in music. Finally, compared to Yamasaki et al.’s (2015) study, which was conducted outdoors, participants in the present study evaluated static images in a laboratory, which may be far from outdoor conditions.
Conclusions
In this study, we used visual stimuli, photographs of natural scenes used in a recent study by Franěk (2023), and added acoustic stimuli, two types of music, to explore participants’ audio-visual interactions through self-report and analysis of facial emotional expressions. The results provided insights into an area that has not been sufficiently explored. As predicted, exposure to happy music led to an increase in environmental preference; however, sad music did not lead to a decrease in environmental preference, which may be explained by the “pleasurable sadness” paradox. In contrast, analysis of engagement with facial emotional expressions showed that sad music decreased engagement compared to no music in all types of environments.
It is also worth highlighting the influence of the environmental characteristics of attractiveness/unattractiveness and visual openness/closedness and music. Exposure to music did not alter the effects of these environmental characteristics on self-reported ratings of environmental preference and pleasant feelings, as reported in the study by Franěk (2023). Irrespective of music, both variables had the greatest magnitude in attractive open environments, followed by attractive closed environments, unattractive open environments, and unattractive closed environments, which had lower magnitudes of both variables.
However, analysis of emotional facial expressions of engagement revealed some association between music exposure and the attractiveness/unattractiveness of the environment. When participants were exposed to happy music, their engagement was lower in unattractive environments, but not in attractive environments, than in the no-music condition. This shows the importance of using physiological measures in addition to self-reports.
A better understanding of the audio-visual interactions between music and the natural environment has some relevance to music psychology, as well as to environmental psychology and soundscape research, which are mainly concerned with associations between noise or natural sounds and different environments. Understanding these audio-visual interactions is not only important for scientific theory, but also has practical implications. Since some people combine the relaxing effect of walking in nature with listening to music, it is useful to know how these stimuli can interact. In addition, whenever music and the natural environment are combined, such as in relaxation videos, virtual reality that includes the natural environment and music, natural history films, or natural design combined with musical stimuli, the findings from research on audio-visual interactions can be useful.
Supplemental Material
sj-xls-1-mns-10.1177_20592043241291757 - Supplemental material for Audio-Visual Interactions Between Music and the Natural Environment: Self-Reported Assessments and Measures of Facial Expressions
Supplemental material, sj-xls-1-mns-10.1177_20592043241291757 for Audio-Visual Interactions Between Music and the Natural Environment: Self-Reported Assessments and Measures of Facial Expressions by Marek Franěk and Jan Petružálek in Music & Science
Footnotes
Acknowledgements
We thank Jan Nálevka, Tadeáš Němec, Tomáš Havlíček, Michal Voda, and Josef Srpek for their help in organizing and conducting the experiments.
Action Editor
Diana Omigie, Goldsmiths University of London, Department of Psychology.
Peer Review
Two anonymous reviewers
Declaration of Conflicting Interests
The authors declared no potential conflicts of interest with respect to the research, authorship, and/or publication of this article.
Ethical Approval
Ethical approval for the experiments was obtained from the Committee for Research Ethics at the University of Hradec Králové, No. 8/2019.
Funding
The authors disclosed receipt of the following financial support for the research, authorship, and/or publication of this article: This work was supported by the Faculty of Informatics and Management, University of Hradec Králové, (grant number Student Specific Research Grants 1/2024.).
Data Availability Statement
Data sharing not applicable to this article as no datasets were generated or analyzed during the current study.
Supplemental Material
Supplemental material for this article is available online.
Notes
References
Supplementary Material
Please find the following supplemental material available below.
For Open Access articles published under a Creative Commons License, all supplemental material carries the same license as the article it is associated with.
For non-Open Access articles published, all supplemental material carries a non-exclusive license, and permission requests for re-use of supplemental material or any part of supplemental material shall be sent directly to the copyright owner as specified in the copyright notice associated with the article.