
Abstract
Mixing popular music is a complex task requiring the consideration of artistic goals, as well as preferences of both the mixing engineer and potential listeners. Vocals are of particular importance in the mixing process. Here, we tested whether listeners possess stable preferences for the mixing level of vocals, whether these preferences are subject to order effects, and the extent to which individual differences between listeners play a role. In Experiments 1 and 2 participants rated which of two mixes in a pair of song excerpts (unchanged reference versus comparison mix with adjusted vocal level) they preferred. Each excerpt pair was presented in two orders – reference first and comparison first. Generally, listeners preferred increased vocal levels and showed pronounced primacy effects, yielding higher ratings for the mix that was presented first. To circumvent order effects, Experiment 3 presented and asked for a rating of only one excerpt at a time and showed ratings similar to reference-first excerpt pairs in Experiments 1 and 2. No systematic influences of demographic variables were observed. However, we found two clusters of participants that differed in their overall preferences, with one group showing stronger preferences for higher vocal levels. The present findings underscore the role of listening history of the immediate past in complex auditory tasks such as evaluating the level of a salient sound source in a musical mixture.
Introduction
Popular music comprises a variety of distinct sound sources that together constitute complex auditory scenes with multiple perceptual affordances (McAdams & Bregman, 1979; Pressnitzer et al., 2011). In particular the vocals play a salient role in popular music (Bürgel et al., 2021). Moreover, they tend to strongly play into musical preferences and taste (Ackermann et al., 2022; Demetriou et al., 2018). Often, vocals carry the main melody while the lyrics convey much of the meaning and message of a song. Some listeners might primarily care about the semantic meaning conveyed by the lyrics of a song; for them, it might be preferable to understand the sung words clearly. Other listeners might care less about a song's lyrics and instead be more interested in clearly hearing the lead guitar part, for instance, thus preferring the mixing level of the vocals to be lower. In fact, given the same song, different mixing engineers are likely to produce different mixes based on their experience and personal preferences (De Man et al., 2015; King et al., 2010) and possible considerations of listeners’ expected preferences. This means that mixing music is a complex process of orchestrating different perceptual affordances according to a specific set of artistic goals. Some researchers have framed mixing more technically as an optimisation problem (Ma et al., 2015). However, from a perceptual viewpoint one may ask whether an optimal mix actually exists or to which extent individual differences between listeners as well as the context of listening shape preferences for mixing parameters.
Here, we focus on one essential aspect of music mixing and listeners’ preferences for it, specifically, the level-ratio of vocals and accompanying instruments. We test whether listeners possess stable preferences for the mixing level of vocals, whether these preferences are subject to order effects, and the extent to which individual differences between listeners play a role. Conceivably, a range of factors could affect vocal-to-accompaniment level ratios preferences; preferences may be highly idiosyncratic and difficult to explain with any third type of variable (Hogan, 2015). Yet, it could also be possible that there are common patterns of preferences based on, for example, demographic variables, such as musical experience, age, and hearing status.
Listeners with cochlear implants (CI), for instance, have previously been found to prefer the vocals to be mixed at a higher level than normal-hearing listeners (Buyens et al., 2014; Pons et al., 2016). Both of these studies suggested that normal-hearing (NH) listeners preferred vocals and instruments mixed at similar levels, whereas CI users preferred either the versions in which the individual levels of instruments had been lowered by 6 dB (Buyens et al., 2014) or showed no significant preferences for any of the conditions (Pons et al., 2016). Studies of musical scene analysis found older hearing-impaired listeners to have more difficulties in hearing out individual instruments from musical mixtures compared to younger normal-hearing listeners (Siedenburg et al., 2020), an effect that was not observed to be mitigated by hearing aids (Siedenburg et al., 2021b). Musical experience may also affect preferences. For instance, more experienced mixing engineers were found to show different preference patterns compared to less experienced participants (King et al., 2010). The same study found that mixing engineers exhibit individual differences in preferences for vocal level in different genres.
Evaluation conditions are critical for assessing the subtle ways in which mixing affects music listening (Zacharov, 2018). Common test paradigms in audio engineering rely on direct comparisons such that listeners do not need to draw from a potentially vague internal reference but can directly compare different exemplars. The popular MUSHRA paradigm (multiple stimuli with hidden reference and anchor) thus relies on comparisons among multiple different renderings of the same audio material. A-B comparisons in which one stimulus serves as a reference and another as the comparison stimulus are also common. We are not aware of reports of pronounced context effects, for instance, related to presentation order in such paradigms.
In the present study, our approach was to have listeners rate preferences in a direct A-B comparison. A diverse sample of listeners performed three online experiments to explore preferences for different level ratios between lead vocals and accompanying instruments in popular music. Additionally, we aimed to explore how such preferences are affected by demographic factors such as hearing ability (hearing-impaired and normal hearing), musical experience, and age. In Experiments 1 and 2, participants listened to pairs of song excerpts. Subsequently, participants were asked to provide a rating on whether they preferred a standard excerpt or a comparison excerpt with a changed vocal level. Experiment 1 additionally included a loudness discrimination task to check whether the difference between standard and comparison was discriminable. Experiment 3 attempted to avoid influences of presentation order by only presenting and asking for a rating of one song excerpt at a time.
Experiment 1
Methods
Participants
Eighty-three listeners participated in Experiment 1 (see Figure 1 for illustration of demographics). Among these, 28 participants (11 female, 17 male) reported hearing loss (12 mild, 14 moderate, and 2 severe), whereas the other 55 participants (32 female, 22 male, and 1 non-binary) reported having normal hearing. The mean age of hearing-impaired (M = 57.89 years, SD = 18.32, range = 22–86) participants was higher than that of normal-hearing participants (M = 29.58 years, SD = 12.50, range = 20–80). Musical experience was measured using the Goldsmiths Musical Sophistication Index (Musical Training subscale, Müllensiefen et al., 2014). For participants with hearing loss, this yielded a mean score of M = 23.21 (SD = 12.89), while for normal-hearing participants, the mean score was M = 21.56 (SD = 11.79). Thirty-one participants did not pass the headphone check (see “Procedure” below). These were not removed from the analysis since the overall pattern observed in the data remains similar with or without these participants (see Supplements 3: Excluding Participants who failed the Headphone Check). Participants gave informed consent at the start of the online experiment.

Experiment 1 overview of participants' age and musical experience. Colour indicates hearing status, shapes indicate gender.
Stimuli
Four-second excerpts were randomly selected and extracted from the “MedleyDB” database, which consists of multi-track recordings from different genres (Bittner et al., 2014). Afterwards all song excerpts were screened to check whether vocals had identifiable lyrics (e.g., no “lalala”). Only songs with English vocals were included in the final selection of song excerpts. Further, since all stimuli needed to comprise vocals, the genres Rock, Pop, and Singer/Songwriter were more frequently represented in our stimulus selection than genres with a larger share of instrumental pieces available in the database (e.g., Jazz).
Selected four-second excerpts were combined into 112 excerpt pairs, consisting of a reference excerpt (original mix) and a comparison excerpt (see Figure 2(a)) with a modified vocal to accompaniment ratio. Excerpts within a pair were separated by a 500 ms interval. Half of the excerpt pairs included the reference excerpt first, the other half included the comparison excerpt first.
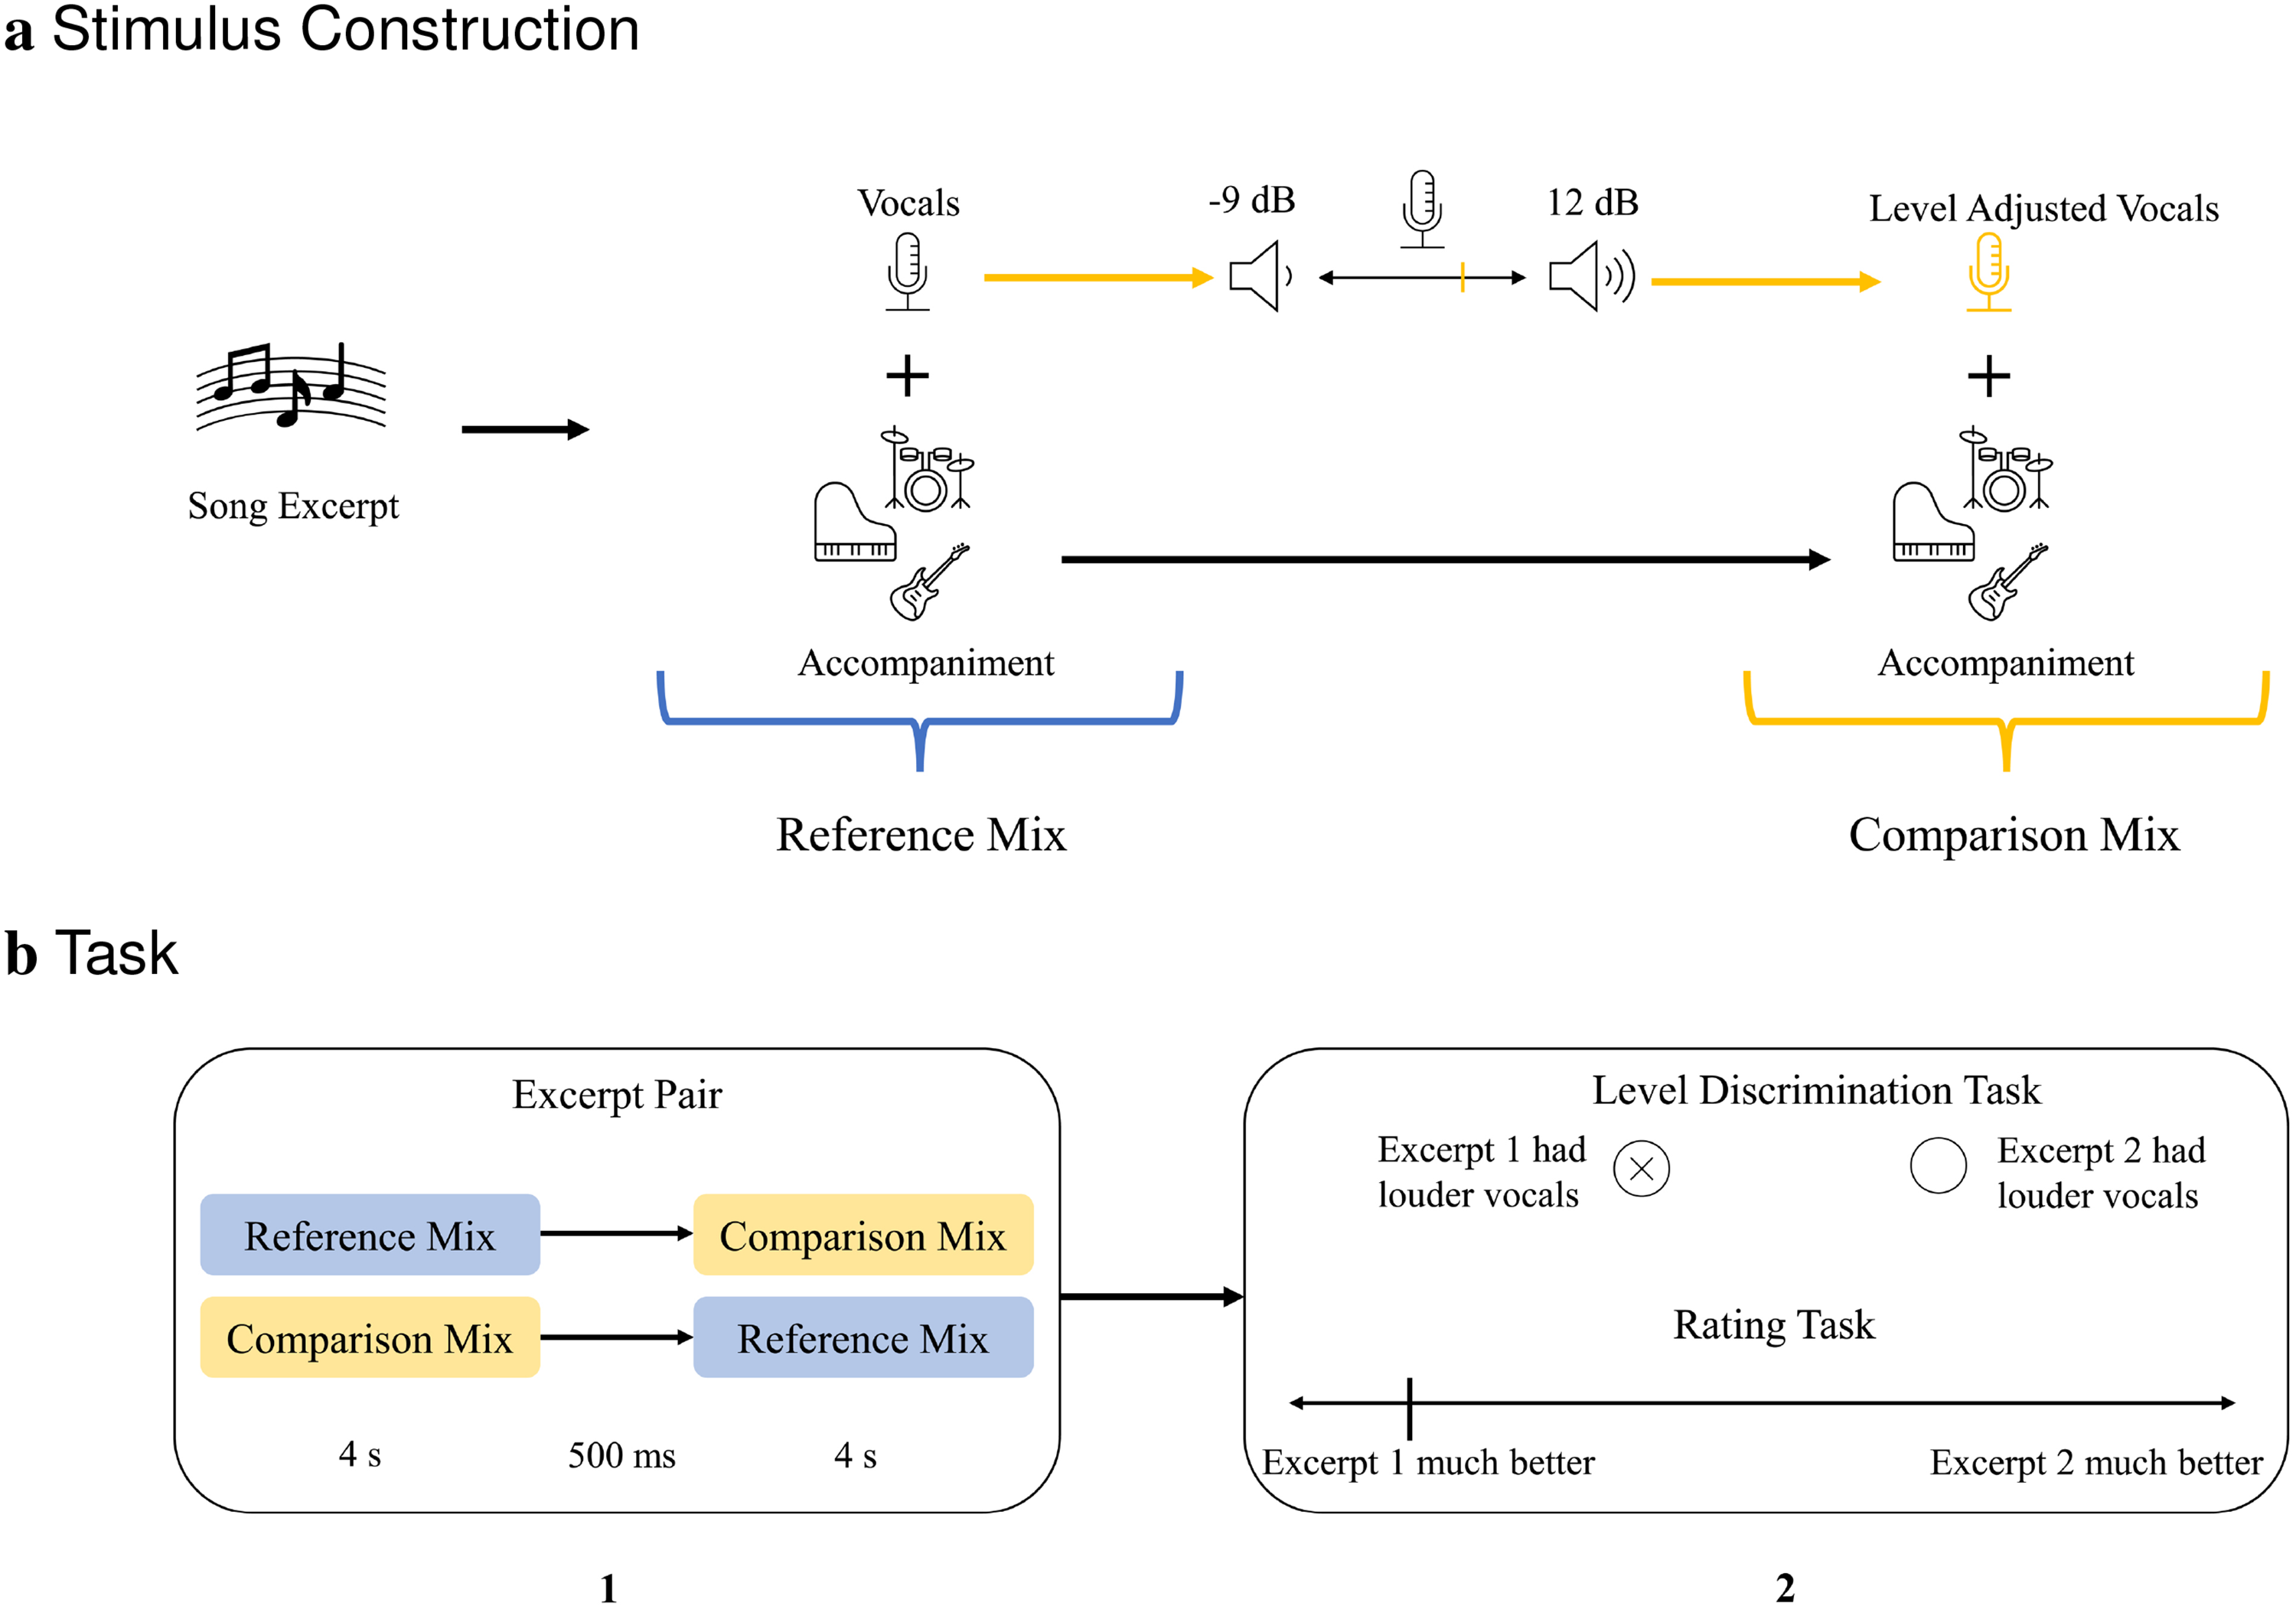
(a) Stimuli were constructed from 4-s song excerpts. From each excerpt an unchanged reference and a comparison mix was derived; the latter by varying the vocal level. Reference and comparison mixes were combined into pairs, in two orders: Comparison first and Reference first. (b) Participants were presented with excerpt pairs (1). Next, participants were asked to indicate which of the excerpts in a pair had louder vocals and rate which excerpt in a pair they preferred (2).
Comparison excerpts were created by adjusting the vocal to accompaniment ratio relative to vocal to accompaniment ratio of the original mix. The original vocal to accompaniment ratios were on average at −4.6 dB (SD = ±3.37, see Supplements 1: Stimuli, Table 1). Original levels were changed by −9 dB, −6 dB, −3 dB, +3 dB, +6 dB, +9 dB, or +12 dB, thus creating seven level ratio conditions. Each level ratio condition included eight distinct excerpts. Since each excerpt was presented in two orders (reference first and comparison first), 16 excerpt pairs were included for each level ratio category.
Procedure
We recruited participants through a number of online platforms (i.e., www.ebay-kleinanzeigen.de, www.schwerhoerigenforum.de, University of Oldenburg online job board). They received a link to access the online experiment, which was hosted on the online test platform Testable (www.testable.org). Before the main experiment, participants were instructed to wear headphones throughout the entire experiment. They were asked to adjust the volume of their headphones to a “comfortable but loud enough level” and then performed a short headphone screening based on Milne et al. (2020). This screening task consisted of white noise being presented to the participants. For one headphone channel the signal was partially phase-shifted, creating the sensation of an additional tone that can only be perceived when headphones are worn. During the main experiment, participants were asked to listen to 112 pairs of song excerpts (see Figure 2(b)). These pairs consisted of an unchanged reference version and a comparison version with an adjusted vocal-to-accompaniment level ratio. After each excerpt pair, participants answered two questions. First, participants indicated in which of the excerpts in a pair the vocals were louder. Second, they rated which of the two mixes they preferred (Excerpt 1 much better – Excerpt 1 better – Excerpt 1 slightly better – Excerpt 2 slightly better – Excerpt 2 better – Excerpt 2 much better). At the end of the experiment, participants completed a short questionnaire including a few demographic questions and the Musical Training subscale of the Goldsmiths Musical Sophistication Index (Müllensiefen et al., 2014). Participants were asked to complete the experiment, without interruption, in a quiet environment. The total time needed to finish the experiment was around 30–40 min.
Analysis
Data were prepared for analysis using MATLAB (MATLAB R2019b, The Math-Works, Inc., Natick, MA, United States) and subsequently analysed using Rstudio (R Core Team, 2020; R Studio Team, 2020) with the ggplot2 package (v 3.3.5, Wickham, 2016) and the lme4 package (v1.1-26, Bates et al., 2015). Linear Mixed Effects (LME) models were set up to analyse the preference and loudness discrimination data. For the preference data, the preference rating acted as the dependent variable. We used the comparison level ratio condition as a numeric fixed effects factor, including both first-order and second-order polynomial terms to account for potentially non-linear rating profiles. Additionally, presentation order was used as fixed effects factor. Participant and stimulus indices were used as random effects factors. For the loudness discrimination data, we used a generalised LME (GLME), including accuracy as the dependent variable. Fixed and random effects factors were the same as in the preference data LME.
Results and Discussion
The left side of Figure 3 shows the mean preference ratings in Experiment 1 for each comparison level ratio condition (−9 to 12 dB), separated by the presentation order. Overall, participants appeared to prefer louder vocals in all conditions, albeit only slightly. Specifically, in positive comparison level ratio conditions (3, 6, 9, 12 dB) participants tended to slightly prefer the comparison excerpts over the reference excerpts. Conversely, in negative comparison level ratio conditions (−3, −6, −9 dB) the reference was slightly preferred over the comparison. The presentation order of the excerpt pairs played a role as well. Particularly in the 6 to 12 dB conditions, the preference for the comparison tended to be markedly stronger when the comparison excerpt appeared first.

Experiment 1 mean preference ratings (left) and mean accuracy (right) in each comparison level ratio condition and order of excerpts. Error bars indicate 95% confidence intervals.
The right side of Figure 3 shows the mean accuracy in the loudness discrimination task. For all conditions, the mean accuracy was above 80%, showing that all loudness differences used in the present experiment were well discriminable. There was a drop in accuracy between conditions with larger level ratios and those with smaller level ratios, with the −3 and 3 dB conditions having the lowest accuracy scores, as expected. Surprisingly, presentation order seemed to play a role not only in the preference rating task but also in the loudness discrimination task. Specifically, the mean accuracy was slightly higher when the reference excerpt appeared first (M = 89.5%) compared to comparison-first pairs (M = 87.1%), see below for the results of the statistical analysis. An exception is the 3 dB condition, in which the reverse was the case.
The LME (see Supplements 2: LME Results for the detailed table of results) with preference as dependent variable showed significant effects for comparison level ratio condition (β = 51.94, CI: [42.92–61.00], p < 0.01) and order (β = −0.26, CI: [ − 0.39–−0.13], p < 0.01). There were two interaction effects: one interaction occurred between the first-order polynomial term of the comparison level ratio condition and order (β = −15.16, CI: [ − 27.50–−1.86], p = 0.02) and another occurred between the second-order polynomial term of the comparison level ratio condition and order (β = −19.58, CI: [−32.94–−9.25], p < 0.01). Thus, ratings appeared to be influenced by both the presentation order and how large the level ratio of the comparison excerpt was. This is in line with what we can observe visually in Figure 3.
The GLME model with accuracy as dependent variable showed significant effects for both the first (β = 29.14, CI: [14.52–46.83], p < 0.01) and second (β = 37.15, CI: [22.26–56.03], p < 0.01) order polynomial terms of the comparison level ratio condition. Surprisingly, the model also showed significant effects for order (β = 0.31, CI: [0.097–0.54], p < 0.01), as well as a significant interaction between comparison level ratio condition and order (β = −30.19, CI: [−56.02–−4.62], p < 0.01). Similar to preference ratings, accuracy in the loudness discrimination task appeared to be influenced by both the presentation order and the level ratio of the comparison excerpt.
Note that our primary reason for including the level discrimination task was to check that listeners were able to discriminate the different level conditions, which clearly was the case. However, the observed effect of presentation order was unexpected. Because we had asked listeners for two judgements per trial, discrimination and preference, it is conceivable that responses in the two tasks became coupled and potentially affected each other. To exclude a potential effect on the measured preference profile, Experiment 2 repeated the same experiment with a smaller sample of listeners without asking listeners to discriminate level differences.
Experiment 2
Methods
Participants
Twenty-one listeners (19 female, two male, see Figure 4) participated in the experiment. They were between the ages of 19 and 28 (M = 22.67, SD = 2.59) and all reported normal hearing. As in Experiment 1, musical experience was measured using the Musical Training subscale of the Goldsmiths Musical Sophistication Index (Müllensiefen et al., 2014). This yielded a mean score of M = 23.71 (SD = 10.91). None of the participants had previously participated in Experiment 1. Three participants did not pass the headphone check but were not removed from the analysis since the overall pattern seen in the data remains similar with or without these participants (see Supplements 3: Excluding Participants who failed the Headphone Check).

Experiment 2 overview of participants' age and musical experience. Shapes indicate gender.
Stimuli, Procedure, and Analysis
The stimuli and data analysis used in Experiment 2 were identical to the ones used in Experiment 1. Participants were recruited through the online job board of the University of Oldenburg. The experimental procedure was identical to that of Experiment 1 with one exception. Specifically, the level discrimination task was no longer included.
Results and Discussion
Figure 5 shows the mean preference ratings in Experiment 2, for each comparison level ratio condition (−9 to 12 dB), separated by the presentation order of the two excerpts in a pair. Results for Experiment 2 showed a similar pattern compared to Experiment 1: excerpts in which the vocals would be experienced as louder were slightly preferred in all conditions. Specifically, in positive comparison level ratio conditions (3, 6, 9, 12 dB), participants tended to prefer the comparison excerpts over the reference excerpts. Conversely, in negative comparison level ratio conditions (−3, −6, −9 dB), the reference was slightly preferred over the comparison. As in Experiment 1, the presentation order of excerpt pairs seemed to play a role. Particularly in the 6–12 dB conditions, the preference for the comparison tended to be stronger when the comparison excerpt appeared first.

Experiment 2 mean preference comparison level ratio condition and order of excerpts. Error bars indicate 95% confidence intervals.
In Experiment 1, participants additionally indicated in which of the excerpts in a pair the vocals were louder before giving their preference rating. We removed this task in experiment Experiment 2 to see whether this question may have influenced the preference rating task. Since the preference ratings in experiment Experiment 2 closely resembled those in experiment Experiment 1, the loudness discrimination task did not seem to strongly affect preference judgements. On the one hand, this can be observed visually (see Figures 3 and 5). On the other hand, this observation is supported by a strong correlation (r = 0.9886, p < 0.01) between mean preference profiles of Experiments 1 and 2.
The LME confirmed significant effects for comparison level ratio condition (β = 33.88, CI: [28.74–40.14], p < 0.01) and order (β = −0.29, CI: [−0.45–−0.14], p < 0.01). Additionally, there was an interaction between the second-order term of the comparison level ratio condition and order (β = −10.39, CI: [−17.56–−2.08], p = 0.0198).
Experiments 1 and 2 were based on a pairwise comparison and, as reported, yielded strong and robust effects of presentation order. However, preference is a construct that is not necessarily based on a comparison of stimulus alternatives but may also be considered without an external reference such that participants need to rely on an internal reference. In Experiment 3, we thus explored which of the two distinct reference profiles of the two presentation order conditions most closely matched with preference judgements obtained from direct ratings without external reference.
Experiment 3
Methods
Participants
Forty-two listeners (22 female, 18 male, and two non-binary, see Figure 6 for illustration of demographics) participated in the experiment. They were between 19 and 50 years old (M = 24.74, SD = 5.07); all reported normal hearing. As in Experiments 1 and 2, musical experience was measured using the Musical Training subscale of the Goldsmiths Musical Sophistication Index (Müllensiefen et al., 2014). This yielded a mean score of M = 24.62 (SD = 11.70). A few participants also participated in either Experiments 1 or 2. Six participants did not pass the headphone check. Their data remained in the analysis since the overall pattern seen in the data remains similar with or without these participants (see Supplements 3: Excluding Participants who failed the Headphone Check).

Experiment 3 overview of participants' age and musical experience. Shapes indicate gender.
Stimuli
Each stimulus was a four-second song excerpt in which the level ratio between lead vocals and accompanying instruments had been changed by differing amounts (−9, −6, −3, 3, 6, 9, or 12 dB) relative to vocal to accompaniment ratio of the original mix. Since these were the same excerpts as the comparison excerpts in Experiments 1 and 2, the original vocal to accompaniment ratios were also the same (see Supplements 1: Stimuli, Tables 1 and 2). Additionally, a new condition was added in which will be referred to as 0 dB condition. Here, 0 dB refers to how much the vocal to accompaniment ratio was modified, meaning it was unchanged from the original level which on average was −4.56 (SD = ±3.56). This condition included new excerpts, which were chosen from the same database used for Experiments 1 and 2. Each ratio condition contained eight different excerpts, resulting in 64 excerpts in total.
Procedure
Recruitment of participants, the headphone check, and the post-experimental questionnaire were identical to Experiment 2. During the main experiment, participants listened to excerpts and rated their liking for the mix on a scale of 1 (Not at all) to 6 (Very much).
Analysis
We used an LME with preference rating as the dependent variable and level ratio condition (first- and second-order polynomials) as fixed effects factor. Participant, as well as stimulus, acted as random effects factors.
Results and Discussion
Figure 7 shows the mean preference ratings in each level ratio condition on the rating scale from 1 to 6. It can be observed that in the negative level ratio (−3, −6, −9 dB), excerpts were rated lower than in non-negative level ratio conditions (0, 3, 6, 9, 12 dB). Ratings in Experiment 3 appear to be more comparable to reference-first pairs in Experiments 1 and 2, rather than comparison-first pairs. This is supported by correlations between Experiment 3 ratings and reference-first pairs in Experiment 1 (r = 0.9853, p < 0.01) and Experiment 2 (r = 0.989, p < 0.01) being larger than those of comparison-first pairs in Experiment 1 (r = 0.917, p = 0.0037) and in Experiment 2 (r = 0.891, p = 0.007). Further, results of Experiment 3 most closely resemble reference-first pairs in the two conditions with the largest positive level ratio (9 and 12 dB). As in the previous experiments, it is notable that preference ratings exhibited pronounced asymmetry in the sense that negative level ratios were much less preferred compared to positive level ratios, even if both deviated by the same decibel amount from the reference.

Experiment 3 mean preference ratings in each level ratio condition. Error bars indicate 95% confidence intervals.
The LME showed a significant effect for both the first (β = 24.49, CI: [18.27–30.41], p < 0.01) and second (β = −14.67, CI: [−21.40–−8.91], p < 0.01) polynomial order term for the level ratio factor. Thus, after removing the effect of order by using a different test paradigm, the level ratio remained a significant predictor of preference ratings.
Analysis of Individual Differences
Two additional analyses were performed to investigate potential individual differences in mixing preferences. First, to further explore whether demographic factors were related to preference ratings, preference data from Experiments 1 and 2 were combined. Then, correlations between preference ratings in each comparison level ratio and presentation order condition with the demographic variables age, hearing, and musical experience were computed. The input for the calculation of correlations was a matrix containing each participant's mean preference rating per comparison level ratio and presentation order condition, their age, hearing status (coded as 1 for NH, 2, 3, and 4 for mild, moderate, and severe HI, respectively), and musical experience score. Results were then corrected for multiple comparisons using Bonferroni–Holm correction (Holm, 1979). Subsequently, they were plotted using an adapted version of schemaball 1 which plots each variable in a circle and draws connecting lines between variables, with line colour and thickness corresponding to direction and strength of the correlation. For Experiment 3 the same procedure was used for correlations between preference ratings in each comparison level ratio condition with the demographic variables (age and musical experience).
Second, a cluster analysis was performed on combined preference data of Experiments 1 and 2, as well as on the data of Experiment 3, using k-means clustering. The most suitable number of cluster was determined using the NbClust R package (Charrad et al., 2014), which allows comparing multiple clustering indices as well as multiple numbers of clusters to suggest an optimal number of clusters based on a majority rule.
Relation Between Preference and Demographic Variables
Figure 8(a) visualises the correlations between each level ratio and presentation order conditions with each other and with the demographic variables age, hearing status and musical experience in Experiments 1 and 2. The order effect (described in the respective Results and Discussion sections) was reflected in the correlations between conditions. Specifically, the level ratio conditions were somewhat more correlated to other level ratio conditions belonging to the same presentation order than to the same level ratio condition belonging to the opposite order condition. There was no strong relation between any demographic variables and any of the ratio and presentation order conditions. The largest correlation occurred between age and the 3 dB reference first condition (r = −.2975, p = .35) but this correlation was insignificant after correction for multiple comparisons. However, there was a significant correlation between age and hearing status (r = .70, p < .01), which is unsurprising given that our hearing-impaired participants tended to be older than normal hearing participants.

Correlations between each ratio (all Experiments) and order (Experiments 1 and 2) condition and demographic variables. The thickness of the connecting lines corresponds to the (absolute) strength of the correlation (a) Experiment 1 and 2: min = 0.0038, max = 0.8221; b) Experiment 3: min = 0.0133, max = 0.6796).
Additional LMEs (see Supplements 2: LME Results) of preference data from Experiments 1 and 2, including the demographic variables hearing status (only Experiment 1), musical experience, and age as fixed effects factors, confirm that none of the demographic variables on their own had significant influences on listeners preferences ratings.
Figure 8(b) shows the correlations between all ratio conditions and the demographic variables age and musical experience in Experiment 3. The majority of level ratio conditions correlated with the 0 dB condition, with the exceptions of +12, +9, and −9 dB. Further, positive ratio conditions correlated more with other positive ratios than with negative ones and vice versa. The 6 dB and 3 dB conditions appear to be slightly more correlated with age and musical experience, respectively. However, none of these correlation was significant after correcting for multiple comparisons. Similar to Experiments 1 and 2, an additional LME (see Supplements 2: LME Results) including the demographic variables age and musical experience confirms that neither demographic factor on its own strongly influenced listeners preference ratings. However, a significant interaction (β = −3.14, CI: [−5.44–−0.84], p < 0.01) between the musical experience and level ratio condition (second-order) was present.
Participant Clusters
Demographic variables did not appear to affect preferences, although there may still exist groups of participants with similar preferences. To investigate this, k-means clustering was performed. For the combined preference data of Experiments 1 and 2, a two-cluster solution (see Figure 9) was found, with one group having stronger preferences for higher vocal levels (i.e., comparison preferred in positive ratio conditions and reference preferred in negative ratio conditions). The other group of participants seems to have no strong preference in either direction. Order effects appear to be slightly stronger in the latter group.
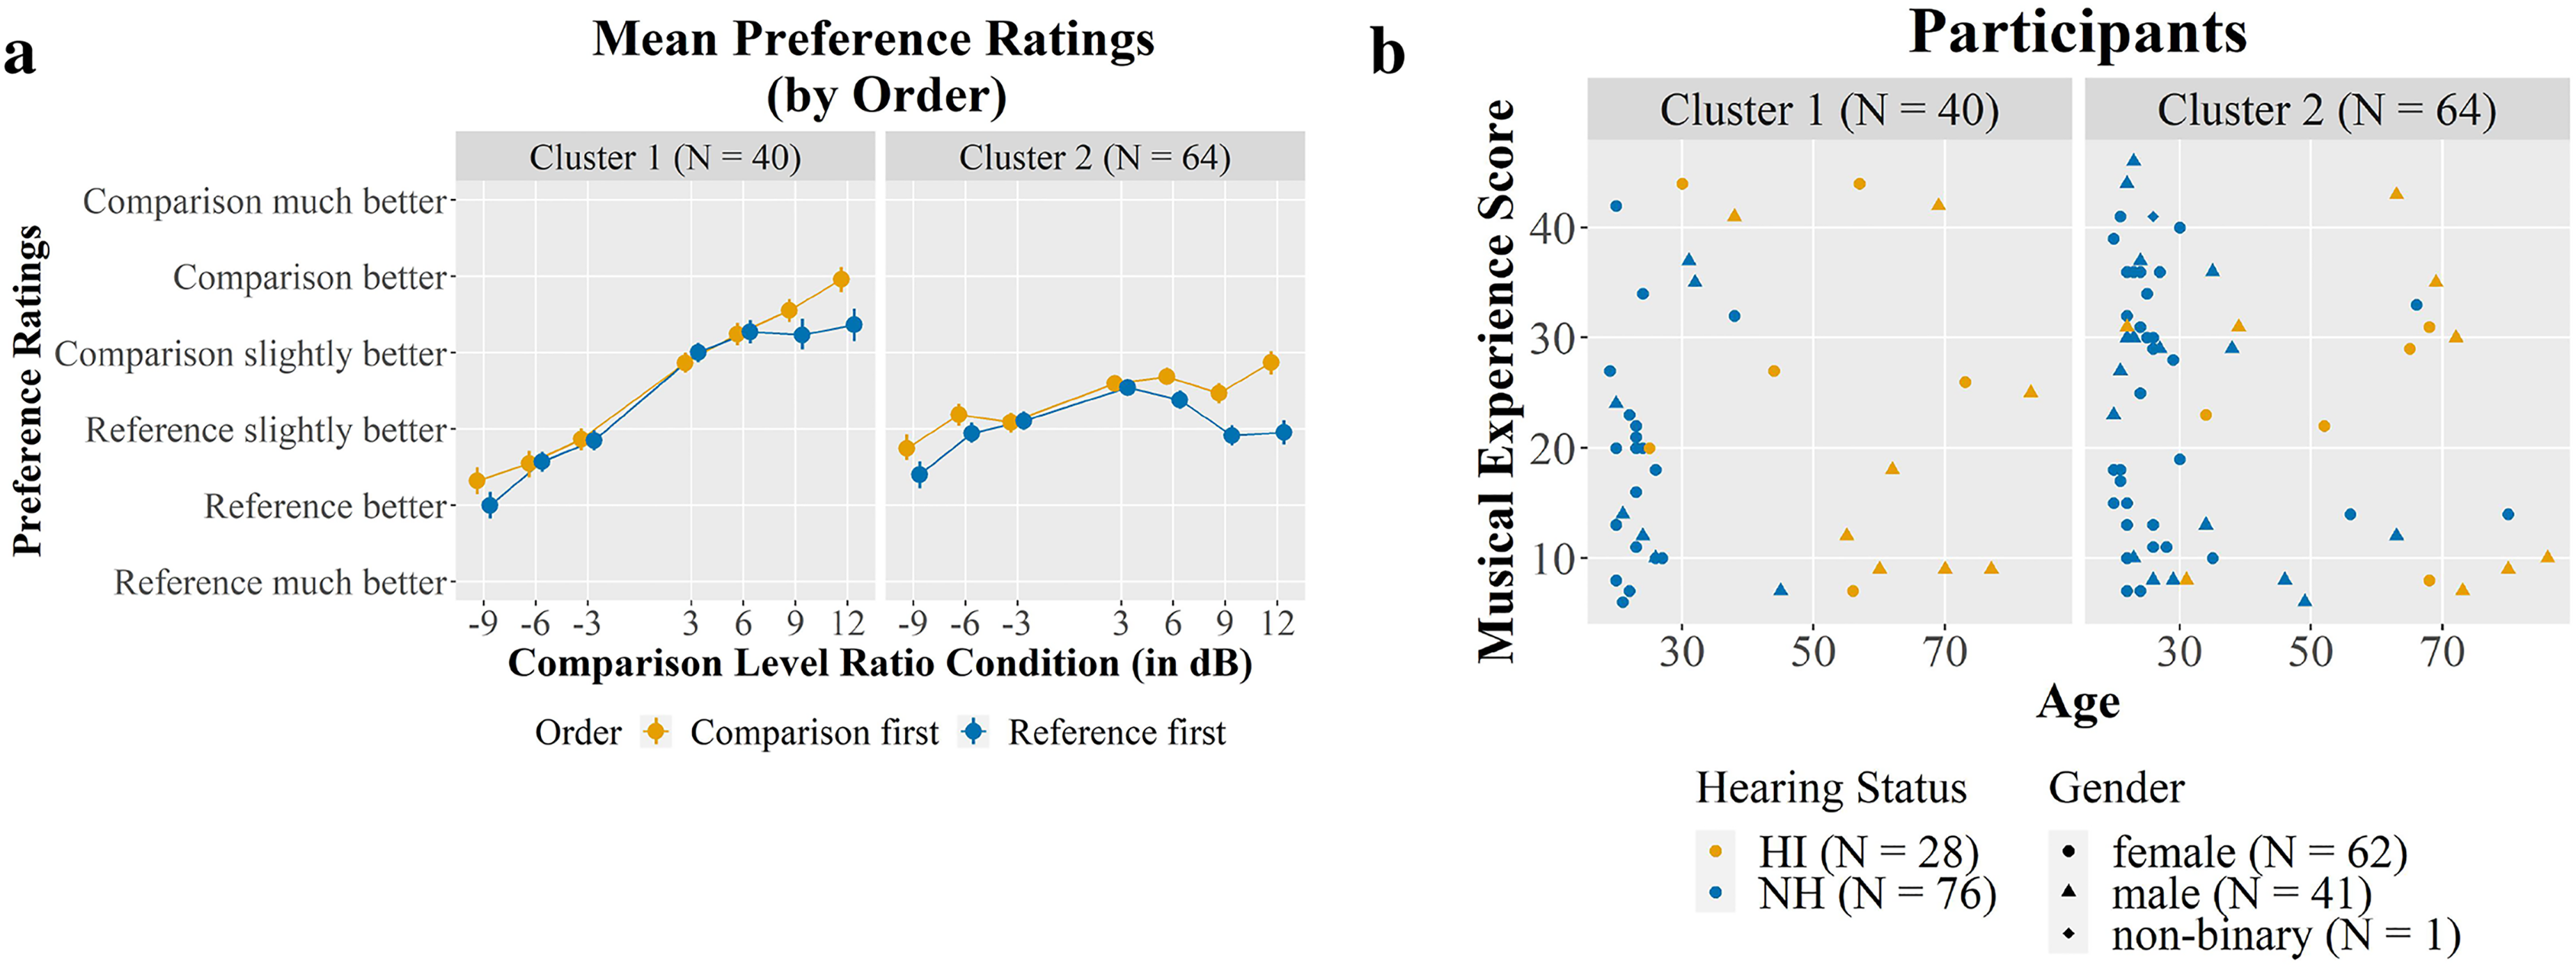
Experiment 1 and 2 combined: (a) Mean preference within each cluster of participants. (b) Overview of participants’ age and musical experience within each cluster. Colour indicates hearing status, shapes indicate gender.
Similarly, two clusters of participants were revealed in Experiment 3 (see Figure 10). Here, one group seemed to prefer higher level vocals, with ratings increasing with the level ratio (i.e., −9dB lowest ratings, 12 dB highest ratings). The other group seemed to prefer the 0–6 dB conditions most, yielding lower ratings to excerpts in the 9–12 dB and all negative ratio conditions. Notably, both groups showed comparable effects of presentation order.

Experiment 3: (a) Mean preference within each cluster of participants. (b) Overview of participants age and musical experience within each cluster. Shapes indicate gender.
General Discussion
We explored preferences for varying lead vocal-to-accompaniment level ratios in three experiments with a diverse group of participants. In Experiment 1, participants listened to pairs of excerpts consisting of a reference excerpt with unchanged level ratios and a comparison excerpt with an adjusted level of lead vocals. Subsequently, they were asked to identify which excerpt in a pair had louder vocals and to rate which excerpt they preferred and by how much. We found that participants were able to discriminate the level manipulations in all conditions. With regard to the preference ratings, both the size of the level ratio and the presentation order within excerpt pairs influenced participants preference ratings. A higher positive level ratio appeared to be preferred slightly, especially in comparison-first trials. Experiment 2 aimed to investigate whether the loudness discrimination task in Experiment 1 influenced preference ratings. To this end, we removed the loudness discrimination task and only included the preference rating task. Results are compatible with Experiment 1, showing similar effects of both level ratio condition and presentation order. This suggests that the loudness discrimination task did not influence preference ratings. To contextualise the influence of presentation order, Experiment 3 was conducted. Here, the stimuli were no longer pairs of stimuli comprised of a reference and a comparison excerpt. Instead, participants directly rated one excerpt at a time. In each excerpt, the level ratio between lead vocals and accompanying instruments had been changed by differing amounts. Our results suggest that the level ratio alone influenced preference ratings. Specifically, positive level ratios received somewhat higher ratings than negative level ratios, with the most preferred conditions being 3 and 6 dB. This resembled the ratings of the condition reference first in Experiments 1 and 2.
Presentation Order Affects Preference
We observed effects of presentation order in both Experiments 1 and 2. Specifically, when the comparison excerpt was typically rated higher when presented first in positive level ratio conditions compared to when it was presented second. Conversely, the reference excerpt was more preferred in the negative ratio conditions when it was presented first than when it was presented second. An exception to this were the −3 and 3 dB level ratio conditions, where the order did not lead to strong rating differences. Notably, Experiment 1 even showed an order effect for the level discrimination task. Here, accuracy was lower in the comparison-first condition.
Effects of presentation order are not an uncommon observation in tasks requiring a choice between multiple sequentially presented stimuli (Mantonakis et al., 2009). Different types of effects of previous context or serial order exist. Here, the most applicable type is likely to be an effect of primacy, in which information presented first leaves a stronger impression compared to information presented subsequently. In turn, the first information has a higher weight in choices or judgements. Here, primacy effects are likely to be one contributor to the observed effects of order, as ratings tended to be slightly more in favour of the first presented excerpt in an excerpt pair. This fits in well with primacy effects observed for a range of auditory material, such as judgements of timbre similarity (Siedenburg et al., 2016) and short-term memory for timbre (Siedenburg & McAdams, 2017). Further, the literature on auditory adaptation has revealed consistent effects of previous context on auditory processing. This ranges from adaptation to speech sounds (Holt, 2005; Schweinberger et al., 2008) to the spectral slope of music excerpts (Siedenburg et al., 2021a). Thus, our report of context effects in level-related preference judgements in popular music extends the literature on context effects by a new type of ecologically relevant task. Additional factors are likely involved in our finding that the order effect increased with the size of the level ratio and no order effects being present in the −3 and 3 dB conditions.
One possible explanation for the increasing order effect with increasing level ratios could be related to a more general preference for higher levels. Settings of headphone volume tend to be at relatively high levels (Muchnik et al., 2012; Torre, 2008; Torre & Reed, 2019). Further, preferred volume may depend on whether or not the music itself is liked (Hoover & Cullari, 1992). Such preferences for higher levels may be partly driven by expectations within the music industry. Specifically, it is often conceived that louder records sound better (Taylor, 2017). While this is questionable (e.g., loud recordings do not sell better, Taylor, 2017), listeners may still be influenced by a higher familiarity with loud recordings. This may be the case, in particular, for the smaller group of participants found in the cluster analysis (see Participant Clusters), which consistently preferred higher level vocals.
Considering this observation from the perspective of prominence effects regarding the level of the vocals may help explain the increasing order effect with increasing level ratios. Prominent features tend to stand out more. In turn, listeners may anchor their preferences based on this prominent feature (Slovic, 1995), with the prominent feature having a large weight on the potential choice. In this case, the prominent feature would be the vocal level, with prominence increasing as level ratios increase. Such a strategy may then create a tendency to choose excerpts in which vocals were perceived to be louder, meaning the comparison excerpt in the positive ratio conditions and the reference excerpt in the negative ratio conditions. Together with the context effects described above, this could plausibly underlie the observation, that higher vocal levels were preferred by our participants, particularly when presented before excerpts with lower level vocals.
Individual Differences in Preference
To explore individual differences in preferences, we checked whether clusters of participants with similar response profiles exist and whether demographic factors (i.e., hearing status, age, and musical experience) affected preference ratings. Two groups of participants were found in the cluster analysis for both the combined data of Experiments 1 and 2 and the data of Experiment 3. One group had a consistent preference for higher level vocals while the other groups preferences tended to be less strong in either direction. One potential explanation for the emergence of these two clusters may stem from the limited control over where and how participants complete online experiments (as compared to in experiments in the lab). The main issue that may have had an influence on our results is that we did not control the overall presentation volume of the sound material. Participants were asked to adjust their headphone volume to a comfortable and loud enough level. However, the exact level likely differed between participants as they may have chosen a volume that resembles how they would typically listen to music in everyday life. One may speculate that the group consistently preferring higher level vocals may have used a lower overall presentation level and may thus have needed the larger ratios to properly make out the vocals.
To explore the relation of demographic variables and preference, correlations between each of demographic variable with each level ratio (all experiments) and order condition (Experiments 1 and 2) were calculated. None of the demographic variables showed significant correlation with preference ratings in any of the level ratio and presentation order conditions. Unsurprisingly, demographic variables correlated with each other, particularly age and hearing status. The inclusion of interaction terms in these models led to inconclusive results.
This pattern of results is somewhat different from what was expected based on previous comparable studies investigating preferences in cochlear implant users compared to normal hearing listeners. In comparison to Buyens et al. (2014) and Pons et al. (2016), our results more closely resemble those of CI users than those of NH participants of both Buyens et al. (2014) and Pons et al. (2016). However, whereas we used the vocals-to-accompaniment level ratio (without changing level relations within the accompaniment), the mentioned previous studies used an instruments-to-level ratio, where the level was measured individually for each instrument. Therefore, our results are only comparable in a qualitative but not quantitative sense.
There may further be the possibility that these differences are due to differences in study design. Buyens et al. (2014) and Pons et al. (2016) used longer but fewer song excerpts. Further, while we changed the level of the vocals, they changed the level of the accompaniment. This could make a difference to participants, since increasing the level ratio would mean to decrease the level of the accompaniment, which could be perceived more negatively by listeners. To the contrary, increasing the level of the vocals while retaining the same level of the accompaniment as in the present study might be an easier choice for listeners.
Another important factor that may play a role in the current results concerns the experimental task. Here, we used rating tasks, whereas in Experiment 1 of Buyens et al. (2014) and Pons et al. (2016) production tasks were used. When given the opportunity to adjust the music mixes themselves, listeners tend to like their own mixes more than those of others, when subsequently asked to rate their own and the mixes of others (De Man et al., 2015; Dobrowohl et al., 2019). Further, preferences resulting from self-adjusting given mixes may not match with preferences reported verbally (Killian, 1985), which further points towards the possibility that preferences differ depending on how they were collected. The latter phenomenon has been described as the construction of preference (Slovic, 1995), wherein preferences are not read off from a stable internal reference, but rather constructed on the spot by adaptive decision makers.
Conclusion
Three online experiments investigated listeners preferences for level ratios between vocals and accompaniment in popular music. Our results suggest that listeners generally prefer increased vocal levels in popular music of around 3–6 dB, corroborating the critical role of vocals in popular music. Furthermore, we observed and replicated pronounced context effects for preference ratings in the sense that stimuli presented first yielded higher preference ratings. Similar order effects were observed for a vocal level discrimination task, where reference-first trials (0 dB) yielded higher accuracy compared to comparison-first trials. Finally, we did not observe any systematic effect of variables related to demographic differences such as hearing status, age, or musical training. However, inter-individual differences exist in the form of two clusters of participants with different preference profiles, one more strongly favouring higher level vocals than the other. The present effects of presentation order underscore the critical role of prior context for complex auditory tasks such as evaluating the level of a salient sound source in a musical mixture. We interpret the current data as indications that any type of optimality of mixes strongly depends on listening history of the immediate past.
Supplemental Material
sj-pdf-1-mns-10.1177_20592043221142712 - Supplemental material for The Optimal Mix? Presentation Order Affects Preference Ratings of Vocal Amplitude Levels in Popular Music
Supplemental material, sj-pdf-1-mns-10.1177_20592043221142712 for The Optimal Mix? Presentation Order Affects Preference Ratings of Vocal Amplitude Levels in Popular Music by Anna Lena Knoll and Kai Siedenburg in Music & Science
Footnotes
Acknowledgements
We thank Michel Bürgel for help with the stimuli.
Action Editor
Yoshitaka Nakajima, Kyushu University, Department of Human Science.
Peer Review
Marek Franěk, University of Hradec Králové, Faculty of Informatics and Management.
Emi Hasuo, Taisho University, Department of Human Sciences.
Contributorship
AK and KS conceived the study. AK collected and analysed the data and wrote the first draft of the manuscript. All authors reviewed and edited the manuscript.
Declaration of Conflicting Interests
The author(s) declared no potential conflicts of interest with respect to the research, authorship, and/or publication of this article.
Funding
The author(s) disclosed receipt of the following financial support for the research, authorship, and/or publication of this article: This work was supported by a Freigeist Fellowship from the Volkswagen Foundation.
Ethics Statement
The ethics committee of the University of Oldenburg approved this study (REC number: Drs.EK/2019/092-01).
Supplemental Material
Supplemental material for this article is available online.
Notes
References
Supplementary Material
Please find the following supplemental material available below.
For Open Access articles published under a Creative Commons License, all supplemental material carries the same license as the article it is associated with.
For non-Open Access articles published, all supplemental material carries a non-exclusive license, and permission requests for re-use of supplemental material or any part of supplemental material shall be sent directly to the copyright owner as specified in the copyright notice associated with the article.