
Abstract
Convenience sampling is often used in music psychology research, leading to an overrepresentation of young participants with high socio-economic status and potentially compromising the generalizability of empirical findings to the broader population. Fortunately, analysis techniques enable matching biased samples to known population characteristics, for example, age, gender, and employment status. This study’s aim is twofold. First, we validate the Danish version of the Goldsmiths Musical Sophistication Index (Gold-MSI-da), a self-report inventory assessing various aspects of musical sophistication on continuous scales in the general population. Then, we demonstrate the use of stratification techniques and quantify the influence of sample composition by comparing results from analyses performed on our biased sample to similar analyses performed using stratified subsampling and poststratification weights to increase representativeness. The bifactor structure of the Gold-MSI-da was consistently replicated, showing similar subscale percentiles in three sample variants. Psychometric benchmarks of internal consistency aligned with benchmarks from other language versions, and although model fits were weaker in the most representative sample, they were still acceptable. Interestingly, the sizes of the effect of self-reported musical training and expertise on musical listening abilities diminished with increasing sample representativeness, indicating potential overestimation when relying on non-representative samples. We conclude that the Gold-MSI-da is a valid tool for assessing musical sophistication in the Danish general population.
In most studies within the psychology of music, researchers face the challenge of obtaining research samples that accurately reflect the general population. When access to the internet is widespread in the target population, online recruitment of participants has a number of advantages, including that it may facilitate sample representativeness by reaching a wider audience (Correia et al., 2022; Eerola et al., 2021; Woods et al., 2015). Conversely, because researchers have little control over the distribution of the online experiment, online recruitment most often leads to samples that do not accurately represent the general population, despite researchers’ attempts to target broadly. For instance, self-selection effects may be present, leading to a potential bias toward people with an interest in the topic under study and/or toward individuals who tend to have a more substantial online presence compared to other groups (Birnbaum, 2004). Therefore, the critical evaluation of demographic and socioeconomic characteristics of an online sample and a comparison of these characteristics to the target population is essential to ensure the validity and generalizability of the research findings.
The Goldsmiths Musical Sophistication Index (Gold-MSI) is a self-report inventory designed to assess musical sophistication on a continuous scale in the general population of Western societies (Müllensiefen et al., 2014). The inventory captures different aspects of musical sophistication on five different subscales: Active Engagement with music (AE), self-reported Perceptual Abilities (PA), Musical Training (MT), self-reported Singing Abilities (SA), and Emotional Engagement with music (EM). A general factor termed General Musical Sophistication (G) incorporates elements from all subscales. Rather than relying on the number of years of formal musical training as a proxy for musical skills and expertise, or comparisons between the often arbitrarily selected groups of musicians and non-musicians, the Gold-MSI allows researchers to assess the multifaceted nature of musicality on continuous scales in the general population.
The initial Gold-MSI publication (Müllensiefen et al., 2014) included a validation study based on a sample of 148,037 English responses collected online. Since then, validated versions of the original inventory have been published in German (Schaal et al., 2014), Portuguese (Lima et al., 2020), French (Degrave & Dedonder, 2019), Traditional Chinese (Lin et al., 2021), Simplified Chinese (Li et al., 2024), Japanese (Sadakata et al., 2023), and Italian (Santangelo et al., 2024), many of which were based on online data collection. A Danish version (Gold-MSI-da) has been publicly available on the Gold-MSI webpage since 2014, and it has been used in a number of studies (Bro et al., 2019; Fernández-Rubio et al., 2024; Hansen et al., 2022; Møller et al., 2021). Yet, the Danish translation has never been formally validated.
Hence, the first aim of this online study was to evaluate whether the Gold-MSI-da is a valid tool for assessing the multifaceted nature of musical expertise in the Danish general population. We also assessed changes in subscale scores across the lifespan, motivated by reports of inconsistent associations with age in previous studies (Lima et al., 2020; Sadakata et al., 2023; Santangelo et al., 2024). The second aim was to assess the influence of sample representativeness on the outcomes of various analyses. This involved applying statistical techniques to data obtained from the online sample and included computation of data norms for the Gold-MSI-da subscales based on three variants of the sample with different degrees of representativeness with respect to the Danish population as well as an examination of typical regression outcomes derived from raw and weighted analyses.
In many empirical sciences, samples are drawn at random from a population with the aim of inferring characteristics of the population just based on the data of the sample. This data collection approach is generally known as probability sampling. Stratified sampling is a specific probability sampling technique widely used in fields like political science, economics, public opinion research, and epidemiology (Alsalti et al., 2023; Mercer et al., 2017; Wang et al., 2015). When implemented into the data collection process, it ensures sample representativeness with respect to specific known characteristics of a population, such as age, gender, and socioeconomic status (SES). The method involves dividing the target population into strata, for instance, “unemployed females aged 20–24” or “retired males aged 65–69,” and then collecting responses from individuals representing each stratum in proportions reflecting their occurrence in the population. Collecting data via true probability sampling or stratified sampling can be expensive and time-consuming, though, and in cases where non-representative data has already been collected, techniques such as post-stratification and stratified subsampling can help researchers mitigate existing sampling biases and increase the generalizability of research findings to the broader population (Lax & Phillips, 2009; Wang et al., 2015).
While the two techniques serve the same purpose, they achieve their goal through different approaches. In post-stratification, all observations are maintained in the dataset as this technique entails weighting the observations with respect to the population proportions. Post-stratification can easily be applied to common statistical analyses such as regressions and t-tests, for example by means of designated functions in the survey package in R (Lumley, 2020). Stratified subsampling, on the other hand, entails drawing random samples proportionate to the target population from each stratum in the full dataset and discarding the remaining observations. This technique mimics the stratified sampling technique used in the data collection phase of a study. As such, it is an intuitive approach that allows researchers to apply any subsequent statistical analyses without the need for specific analysis functions that can handle weighted data. When employing stratified subsampling, the researcher chooses between the methods simple random sampling without or with replacement (Cochran, 1977). With simple random sampling without replacement, every observation in each stratum of the original sample has an equal chance of becoming part of the representative subsample and can be drawn only once. This method is suitable when the original sample is large enough such that acceptable sample sizes for the representative sample can be obtained. In contrast, simple random sampling with replacement can be necessary when the ratio of strata to observations increases and the sampling procedure fails because there are too few observations in individual strata. Note that sampling with replacement usually generates duplicate observations in the resulting sample.
Despite their clear advantages and straightforward applications once data collection is completed, these stratification techniques have not been widely adopted by researchers within the music sciences. Thus, the extent to which the application of these techniques changes the outcomes of typical studies within the field is not yet clear. Here, we approached this question by investigating the degree to which (a) stratified subsampling impacts on the validation of the Gold-MSI-da and (b) post-stratification impacts on the results of typical analyses assessing links between perceptual skills, musical training, and general musical expertise. Establishing such links is key in psychometric studies examining an instrument's criterion validity, that is, its correlation with an external variable known to measure a related construct. Associations between musical skills and training have been consistently reported in the literature (e.g., Kunert et al., 2016; Law & Zentner, 2012). For instance, mistuning perception abilities, that is, the ability to detect when a musician is singing/playing out of tune, is known to correlate at around r = .4 with musical training as assessed by the original English version of the Gold-MSI (Larrouy-Maestri et al., 2019).
In this study, we recruited a large sample of participants residing in Denmark (Sample 1), which formed the basis for the main validation study presented here. Using stratified subsampling, we additionally created two different subsamples by adjusting Sample 1 to match the proportions of known characteristics of the Danish population with respect to age and gender (resulting in Sample 2) and with respect to age, gender, and employment (resulting in Sample 3). We ran identical confirmatory factor analyses on these three samples, including assessments of language and gender invariance, which is a prerequisite for comparing group means (Putnick & Bornstein, 2016). To further assess the degree to which sample composition affects the results of typical music studies, we used as an example investigations of associations of the Gold-MSI-da subscales PA, SA, MT, and G with performance on the Mistuning Perception Test (MPT) (Larrouy-Maestri et al., 2019). Here, we used post-stratification weights according to the variables age and gender and, in a separate analysis, age, gender, and employment. We compared effect sizes from the three regression analyses with and without the post-stratification weights. Ultimately, this approach serves to quantify and evaluate the importance of correcting sample bias in future music science studies.
Method
Development of the Danish Version of the Gold-MSI
The Gold-MSI-da inventory was adapted from English to Danish as follows: An initial translation performed by a Danish native speaker was utilized in a previous study (Haumann et al., 2018). This version was subsequently back-translated by a member of the project group, who is also a native Danish speaker. Inconsistencies with the original English version were resolved and the second version updated accordingly. This version was then back-translated by five new independent translators, all native Danish academics naïve to the inventory. Inconsistencies were discussed between the original translators, and adaptations were integrated into a third version. To ensure the use of language suitable for the general population, this version was revised by a native Danish speaker with a university degree in Danish language. This version, entitled version 1.0, was uploaded to the Gold-MSI webpage in June, 2014. Before data collection for the present study, version 1.0 underwent minor typesetting corrections and was then tested on five pilot participants who provided feedback. The resulting version 1.1 was used in the current online study.
Participants
Participants were recruited through an online research participation pool (SONA systems) and through the Twitter and Facebook social media platforms. A Danish advertising company (Heyday A/S) was hired to target recruitment toward a representative sample of the Danish general population. To this aim, demographic details of the incoming data were assessed regularly by the researchers, and Facebook ads were targeted toward filling the gaps using gender, age, income, and postal code. Additionally, a higher proportion of participants in the age range 18–26 years was recruited because a separate goal of the project was to collect reaction time measures for several cognitive tests from a large sample of younger participants. Results of reaction time analyses will be reported elsewhere.
A total of 1,410 participants initially provided informed consent to participate in the study. The following observations were excluded: participants younger than 18 (n = 12) and older than 120 (n = 1) years of age, non-residents of Denmark (n = 21), incomplete Gold-MSI-da responses (n = 138), observations exhibiting intra-individual response variability (IRV) scores below 0.5 (i.e., reflecting straightlining responses) (Dunn et al., 2018). After exclusion, the final full sample consisted of 1,235 participants (575 female, 644 male, 16 other/prefer not to say). Their mean age was 34.28 years (SD = 15.19 years, range = 18–79) (see Supplementary Materials, Figure S1 for distribution of age, gender, and demographic variables and Figure S2 for distribution of musicianship across age and gender). The participants were given the opportunity to enter a prize draw for 12 Ticketmaster gift cards worth DKK 500 each as compensation for their time.
Materials
In the Gold-MSI questionnaire, 31 out of 38 statements are rated on a 7-point scale ranging from 1 = Completely disagree to 7 = Completely agree. The seven remaining statements are rated using ordered response categories. The items were presented in random order. To assess criterion validity, we used two variables: 1) the musician rank item (“Which title best describes you?”) from Ollen's Musical Sophistication Index (OMSI) (Ollen, 2006), which has been established as the best single-item measure for predicting musical sophistication as measured by the Gold-MSI and the OMSI (Zhang & Schubert, 2019), and 2) scores on a 15-item version of the MPT (Larrouy-Maestri et al., 2019), an adaptive test that is freely available (doi: 10.5281/zenodo.1415363) and that measures participants’ ability to detect pitch shifting in vocal tracks of pop music excerpts. We expected MPT scores to be related to the PA, MT, SA, and G subscales as Pearson correlation coefficients for these subscales exceeded .40 in the MPT validation study.
Procedure
Participants clicked on a link that directed them to a webpage containing a Shiny web application, which was developed using the R packages shiny (Chang et al., 2022) and psychTestR (Harrison, 2020). First, they completed a demographics questionnaire and the Gold-MSI-da followed by the musician rank item from the OMSI (Ollen, 2006). Then, a reaction time paradigm (analyses not reported here) and the MPT (Larrouy-Maestri et al., 2019) were presented in random order. Finally, participants received feedback, and Twitter and Facebook share buttons encouraged sharing the experiment on social media for further snowball sampling.
Data Analyses
We report results of parallel sets of analyses using varying sample compositions. The confirmatory factor analyses (CFAs) were based on three samples. Sample 1 consisted of the full sample (n = 1,235, 52.1% females, mean age = 34.28 years, SD = 15.19, range = 18–79). Sample 2 and Sample 3 were aligned to population characteristics by means of stratified subsampling: Sample 2 was aligned with the Danish general population with respect to age (with six eight-year age bins covering the range 18–65 years – see Figure S2 in Supplementary Materials) and gender (male, female) (n = 541, 49.4% females, mean age = 41.28 years, SD = 13.85, range = 18–65). Sample 3 was aligned with respect to employment (four levels: in education, unemployed, employed, retired) in addition to age and gender (n = 542, 49.6% females, mean age = 41.58 years, SD = 13.84, range = 18–65). Sample 2 was created using simple random sampling without replacement, while Sample 3 used simple random sampling with replacement (Cochran, 1977). In Sample 1, the gender variable was dichotomized, that is, missing values (NAs) were entered for 16 participants who chose “Other/prefer not to tell” in the gender item. In Sample 2 and Sample 3, these participants’ responses were excluded before post-stratification to match the existing categories in the official population data available from StatBank Denmark (https://www.statbank.dk/). See Supplementary Materials for further details on the stratified subsampling, including relevant demographic distributions for the Danish general population (Figure S3b and Figure S4b).
Subsequently, parallel regression analyses without (n = 1,068) and with post-stratification weights (age and gender: n = 1,027; age, gender, and employment: n = 1,002) served to emulate a situation where a typical music science study investigates the extent to which MPT scores depend on different aspects of musical sophistication. Our purpose here was to assess the effect of sample representativeness by comparing adjusted R² values that were interpreted as effect size indicators. We compared the results from three parallel regression analyses using General Musical Sophistication (G) as independent variable. The PA, MT, and SA subscales were used together as a set of independent variables in additional multiple regression analyses that served the same purpose.
All analyses were performed using R (R Core Team, 2022). Reliability estimates were calculated using the psych package (Revelle, 2022). For the Gold-MSI General factor, these estimates were calculated based on the 18 items with the highest factor loadings in the original English study. Confirmatory factor analyses (CFAs) were performed using the lavaan package, v. 0.6–12 (Rosseel, 2012). The aim of the CFAs was to assess the extent to which the Danish data fit the bifactor model structure (Schmid & Leiman, 1957) of the Gold-MSI instrument. For this, the fit indices comparative fit index (CFI), Tucker–Lewis index (TLI), root mean square error of approximation (RMSEA), and standardized root mean square residual (SRMR) were evaluated. Measurement invariance was assessed as part of the CFA and indicated whether latent variables (configural invariance), factor loadings (weak invariance), and item intercepts (strong invariance) were comparable across groups. To assess the structural validity of the Danish version compared to the English version (language invariance), we used the covariance matrices as provided in the original study (Müllensiefen et al., 2014). Measurement invariance for language and gender was assessed and compared to other language versions’ invariance levels as reported in the configurator app available on the Gold-MSI webpage (https://shiny.gold-msi.org/gmsiconfigurator/). We used the R packages sampling (Tillé & Matei, 2021) for stratified subsampling and survey (Lumley, 2020) for post-stratification and subsequent regression analyses.
Results
Validation
Descriptive Statistics, Reliability, and Validity
Table 1 lists descriptive statistics (means and standard deviations) from the analysis based on Sample 1 (n = 1,235), that is, the full sample. Measures of internal consistency and correlations with the validity variables for each of the five subscales, that is, Active Engagement (AE), Perceptual Abilities (PA), Musical Training (MT), Singing Abilities (SA), and Emotions (EM), as well as for the General Musical Sophistication factor (G) are also included. In general, the mean sum scores were highly similar to the ones obtained from the original English sample (Müllensiefen et al., 2014), and internal consistency measures showed good to excellent reliability for all subscales apart from EM. Cronbach's α for EM was just below the commonly used guideline of .7 for acceptable reliability. All correlations with the validity variables were statistically significant. Specifically, correlations with MPT score were small for AE and EM and moderate for the remaining subscales, following Cohen's rules of thumb for the interpretation of effect sizes (Cohen, 1988). Correlations with Ollen's musician rank item (Ollen, 2006) were small for EM; moderate for AE, PA, and SA; and large for MT and G. For Sample 2 and Sample 3, reliability estimates were generally similar, whereas the correlation coefficients with the validity variable MPT were generally lower than in Sample 1. See Table S1 (Supplementary Materials) for details. Subscale percentiles were similar in the three samples, see Figure S5 (Supplementary Materials).
Summary statistics, reliability estimates, and correlation coefficients with validity variables for Sample 1 (n = 1,235).

Note. All estimates of the factor General Musical Sophistication were computed based on the 18 items with the highest loading in the original English study (Müllensiefen et al., 2014). en: For comparison, summary statistics and reliability estimates from the English study are included in italics. *** p < .001.
Confirmatory Factor Analysis
The three CFAs revealed that the Danish data show a satisfactory-to-good fit (Hu & Bentler, 1999) with the bifactor model. Table 2 indicates how the model fit indices of Sample 1 and Sample 2 are comparable or better than those of the English version and other available language versions.
Results of confirmatory factor analyses of the three Danish samples and other published language versions of the Gold-MSI.

Note. CFI = comparative fit index; TLI = Tucker–Lewis index; RMSEA = root mean square error of approximation; SRMR = standardized root mean square residual; da = Danish; en = English; de = German; pt = Portuguese; fr = French; zh-tw = Traditional Chinese; sc = Simplified Chinese; ja = Japanese; it = Italian. Because we expected the data to depart from multivariate normality, we calculated robust versions of the fit indices CFI, TLI, and RMSEA in the Danish samples. Robust estimates were also reported in the Simplified Chinese and Italian studies, whereas this was not the case for the other language versions presented.
Measurement Invariance
The investigation of measurement invariance between the English and Danish versions of the Gold-MSI showed that the factor structure of the instrument was consistent across languages in all three samples, indicating strong invariance (see Table 3). Measurement invariance between males and females, by contrast, showed larger variability across subscales and samples. Specifically, only SA showed strong invariance, indicating that any evidence of mean differences between males’ and females’ scores on all subscales other than SA may be a property of the inventory. Table 3 demonstrates how these patterns of results are in line with those found in other language versions, as reported in the online configurator app on the Gold-MSI webpage (https://shiny.gold-msi.org/gmsiconfigurator/).
Measurement invariance between the English and the non-English versions of the Gold-MSI (language invariance) and between males and females (gender invariance) within each of the three Danish samples and samples obtained using the other language versions.

Note. Measurement invariance refers to the extent to which the underlying factor structure remains unchanged when comparing groups. Configural invariance: measurement structure is similar across groups but specific parameter values may differ; weak invariance: factor loadings are also equal across groups but intercepts and residuals may differ, so only correlation and regression coefficients can meaningfully be compared across groups; strong invariance: item intercepts are also equal across groups, so mean/sum scores obtained from the English Gold-MSI and other language versions (language invariance) or from males and females within the same language version (gender invariance) can be compared as any differences found are not merely a property of the measurement instrument itself.
Age and Subscale Scores
Figure 1 shows subscale scores across Sample 1 (Figure 1a) and averaged by age and gender (Figure 1b) (in four-year age bins for visualization only). A noticeable drop in all subscales is evident in young adulthood and particularly so for females. This drop is followed by an age-related increase in mean subscale scores that appear to continue into the late 30s, somewhat later for males. After this age, scores appear to slightly decrease again. See Supplementary Materials for the results of cubic regression models assessing this apparent non-linear relationship between age and subscale scores.
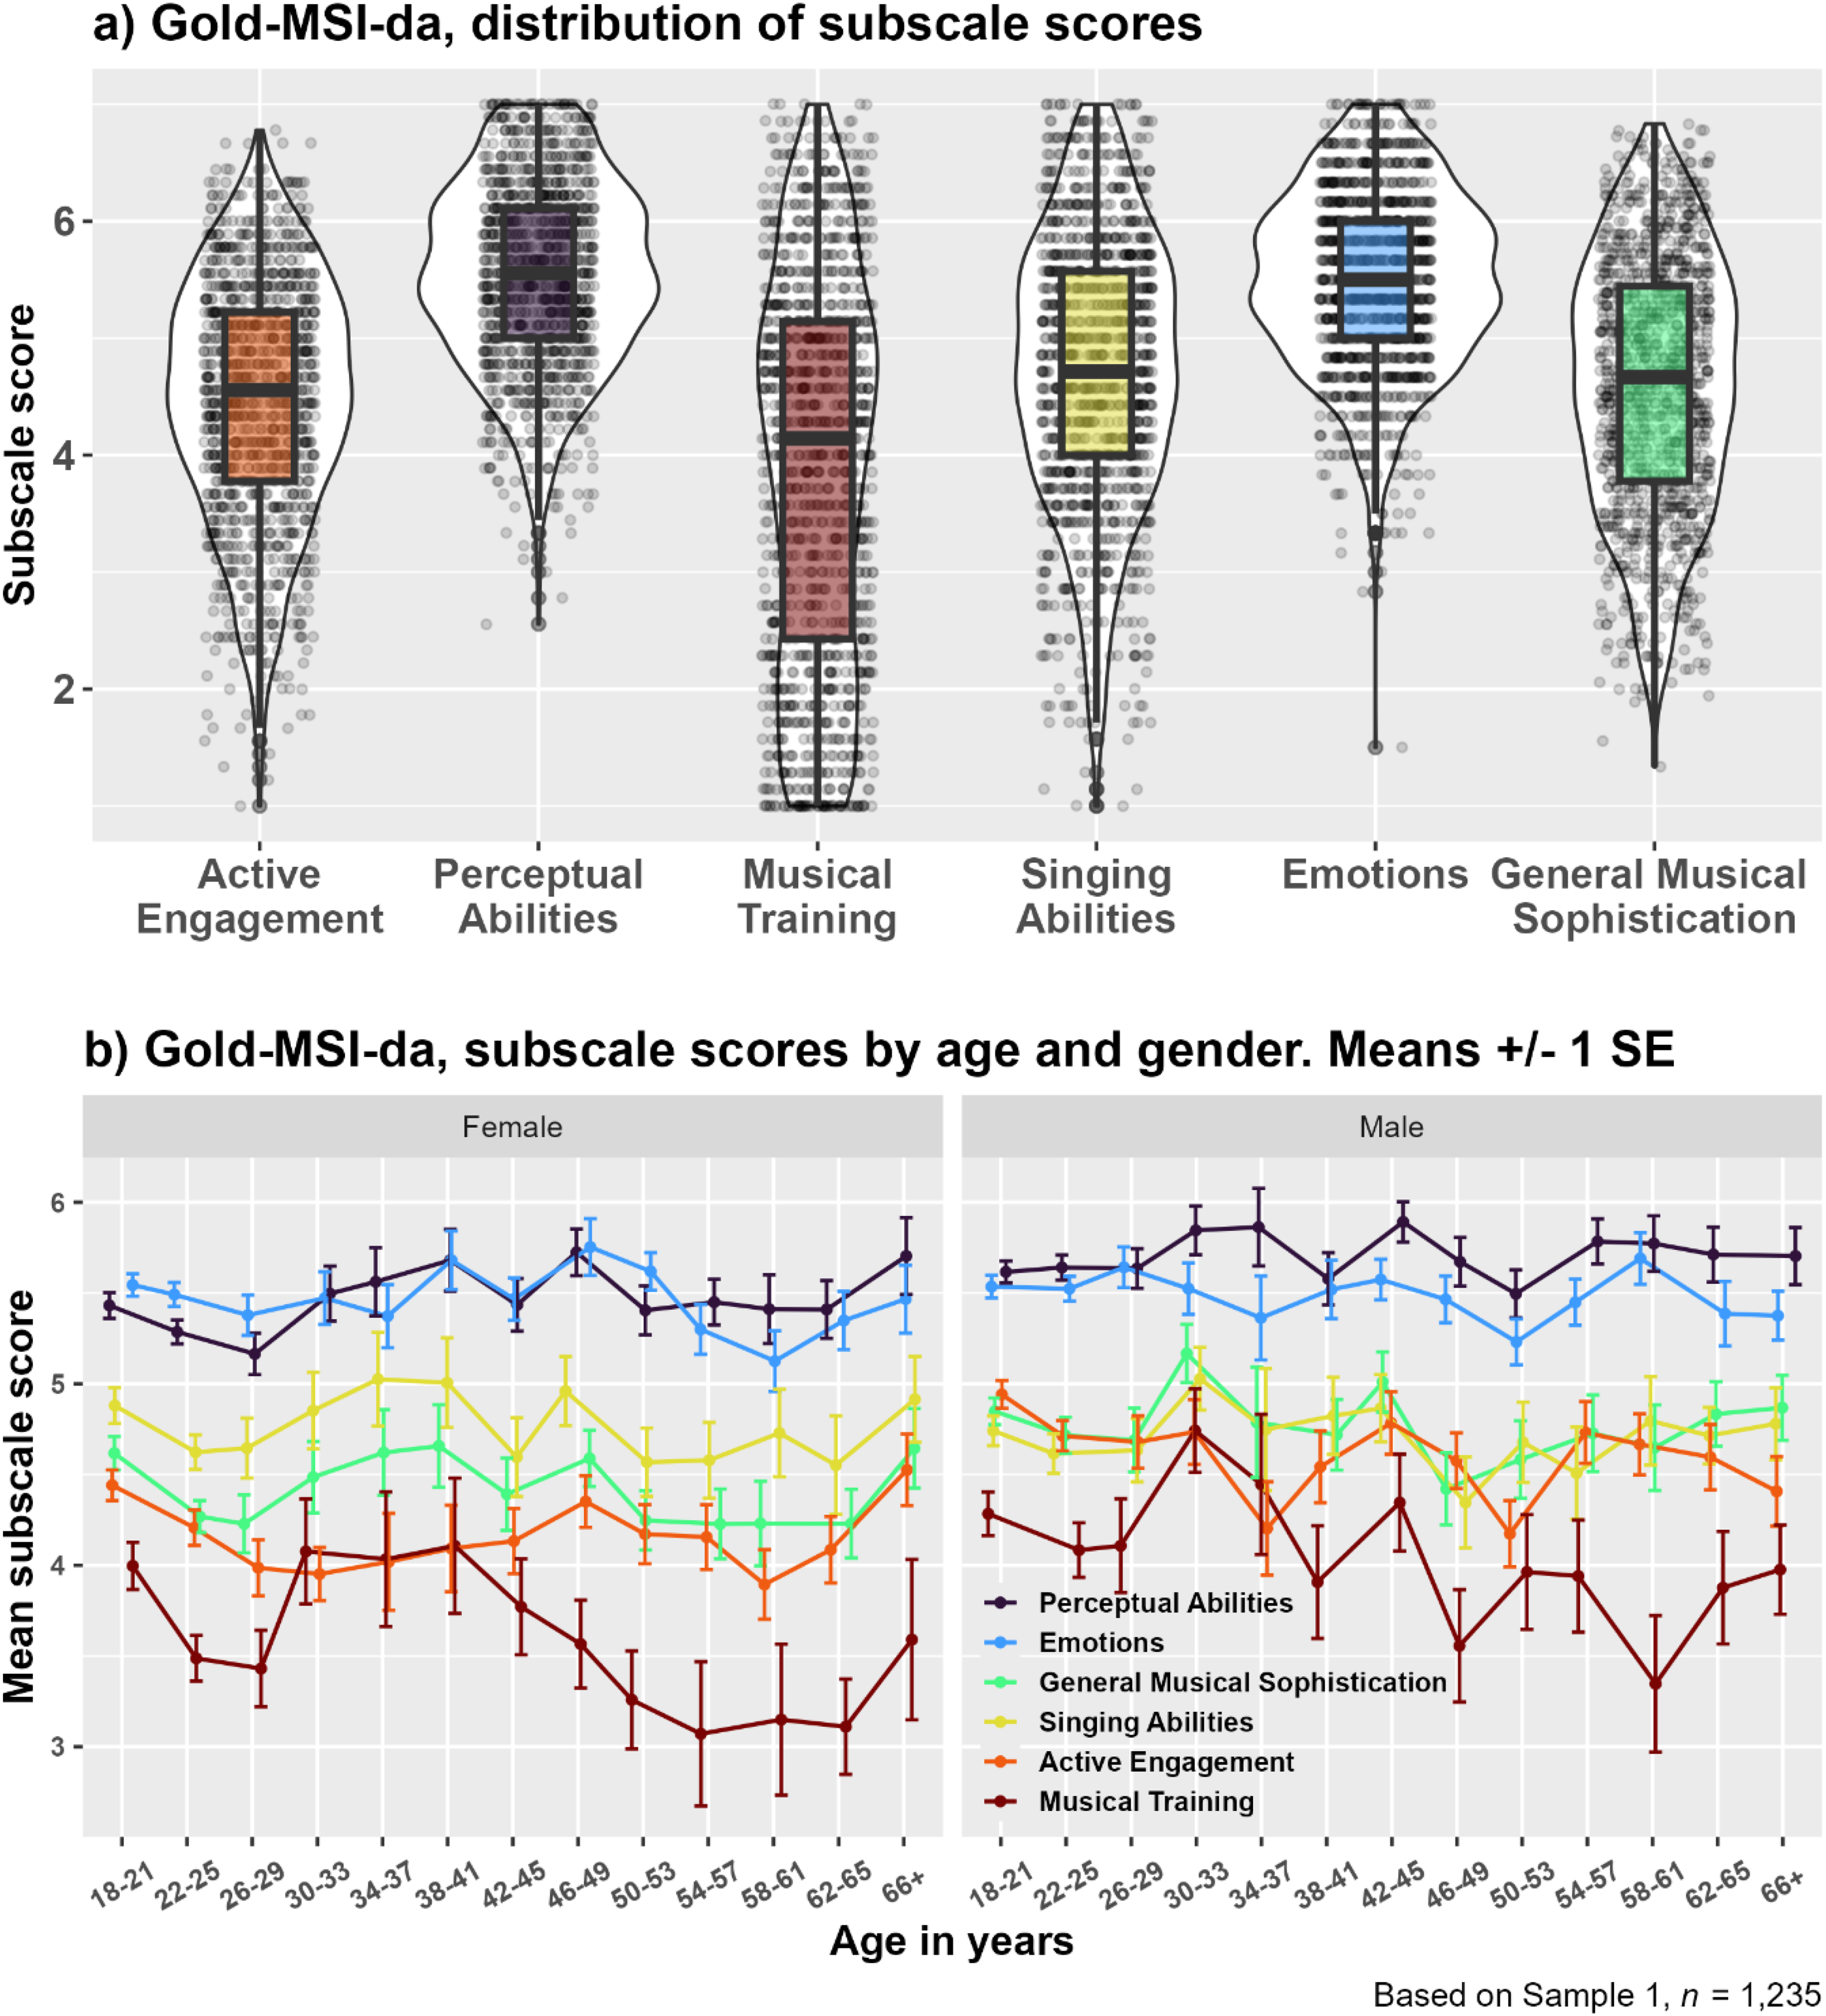
Distribution of subscale scores a) across participants and b) averaged by age and gender. Note. Estimates of the factor General Musical Sophistication were computed based on the 18 items with the highest loading in the original English study (Müllensiefen et al., 2014).
To allow comparisons with other Gold-MSI language versions, Spearman correlation analyses were run to assess associations between age and each of the subscales. Table 4 indicates that negligible-to-small negative correlations were observed between age and all subscales except for PA, which showed a negligible positive relationship with age. This pattern was consistent across all three samples, but coefficients were only statistically significant in Sample 1 for AE and MT subscales.
Spearman correlations between Gold-MSI-da and age.
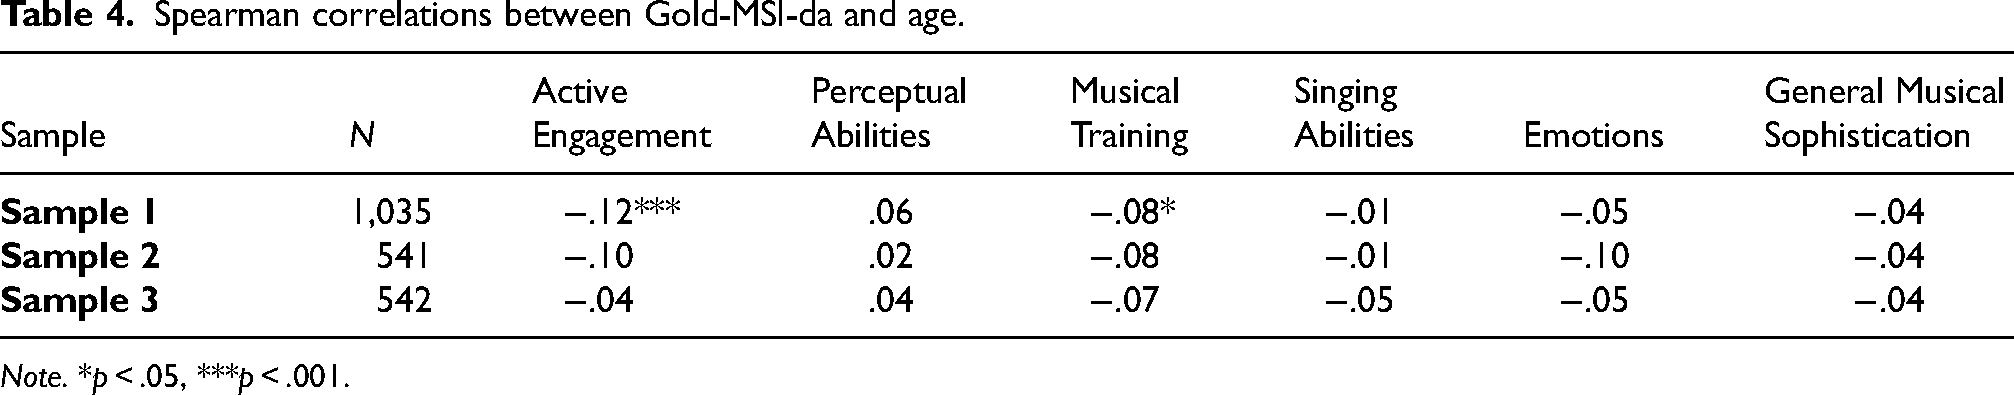
Note. *p < .05, ***p < .001.
Regression Analyses with and without Post-Stratification Weights
The effect of sample representativeness in typical music studies was assessed by comparing adjusted R² values from three parallel regression analyses investigating the extent to which MPT scores depend on different aspects of musical sophistication. General Musical Sophistication (G) on one hand and the PA, MT, and SA subscales on the other hand were treated as two different sets of independent variables in each of three (multiple) regression analyses. In both cases, the effect of the independent variables on MPT scores decreased with increasing sample representativeness, as evidenced by decreasing adjusted R² values (Table 5).
Regression coefficients and associated statistics derived from analyses modelling MPT score as a function of G and of PA + MT + SA subscales of the Gold-MSI. Analyses were performed with and without post-stratification weights.

Note. MPT = Mistuning Perception Test; G = General Musical Sophistication; MT = Musical Training; PA = Perceptual Abilities; SA = Singing Abilities.
Discussion
In this study, we validated the Danish version of the Goldsmiths Musical Sophistication Index (Gold-MSI-da) using a sample of 1,235 participants residing in Denmark (Sample 1). By means of stratified subsampling (Sample 2 (n = 541) stratified by age and gender; Sample 3 (n = 542) stratified by age, gender, and employment) we assessed how sample representativeness affected the results of our confirmatory factor analysis (CFA). The original bifactor structure was replicated in all three Danish samples, and subscale percentiles were similar across the three samples. Internal consistency measures were comparable to those obtained in relation to previously published language versions, albeit model fits were poorer for Sample 3. The internal consistency coefficients of the Emotions (EM) subscale were below the rule-of-thumb threshold of 0.70 for satisfactory reliability; yet we consider them acceptable due to the lower number of items in this subscale compared to the others. Taken together, the Gold-MSI-da is a valid tool for assessing musical sophistication in the Danish general population.
Further, sample composition has only limited impact on the factor structure of the questionnaire and on the distribution of absolute scores obtained from it. To assess the degree to which sample composition might affect the results of typical analyses within music research, we also emulated a case where regression analyses are used to investigate the influence of General Musical Sophistication (G) and of the Musical Training (MT), Singing Abilities (SA), and Perceptual Abilities (PA) subscales on performance on the MIstuning Perception Test (MPT) (Larrouy-Maestri et al., 2019). When adding post-stratification weights to the regression analyses, the model R2 values decreased, suggesting that the different subscales of self-reported musical sophistication explained less variance in the MPT scores. This indicates that by basing the analyses on the least representative sample, which in the current study was positively skewed with respect to age, researchers may potentially overestimate the true size of effects in the general population.
Focusing on the Gold-MSI-da validation, our finding that the Danish data revealed strong language invariance indicates that mean scores can be compared across the English and Danish versions. Strong gender invariance was only found for the SA subscale, however. As is apparent from the Gold-MSI webpage (https://shiny.gold-msi.org/gmsiconfigurator/), similar patterns of results were found in other previously published Gold-MSI language versions (Table 3). Measurement invariance refers to the extent to which the underlying factor structure of the instrument remains unchanged when comparing scores between groups (Putnick & Bornstein, 2016). It is relevant in cases where researchers wish to compare scores, for example, from different language versions of a questionnaire or between males and females. Particularly the latter is sometimes reported and discussed in music psychology research (Correia et al., 2022; Lima et al., 2020; Sadakata et al., 2023; Santangelo et al., 2024). Crucially, when gender invariance is weak, meaningful comparisons can be drawn between males’ and females’ scores in terms of their relationship with other variables, for example, the sizes of regression and correlation coefficients. However, comparisons between males and females may not hold when considering group means (Widaman & Reise, 1997) as any difference is likely to be a property of the inventory itself. Note that gender invariance can sometimes be improved by removing items from the subscale, although this procedure also comes with a tradeoff concerning validity and reliability estimates. Short Scales for several language versions including the Gold-MSI-da are available in the configurator app on the Gold-MSI webpage (https://shiny.gold-msi.org/gmsiconfigurator/). These should be used within one language only, as Short Scale versions will be comprised of different sets of items in different language versions.
The results of the Spearman correlation analyses assessing associations between age and subscale scores add to the diverging results reported in existing Gold-MSI language versions in relation to this association. Specifically, in Sample 1, the Active Engagement (ρ = .12) and Musical Training (ρ = .08) subscales were significantly related with age but with small effect sizes. Age did not have any significant effects when basing the analyses on Sample 2 and on Sample 3. Significant negative associations were found for all subscales in the studies using the English (Müllensiefen et al., 2014), German (Schaal et al., 2014), and Simplified Chinese (Li et al., 2024) versions of the Gold-MSI. Even stronger effects of age were reported in the Portuguese validation study (Lima et al., 2020), with statistically significant coefficients ranging from −.27 to −.45. By contrast, the Italian study reported a negligible negative correlation with the Emotion scale only (Santangelo et al., 2024), no significant associations were found in the Chinese study (Lin et al., 2021), and the Japanese study showed a significant positive relationship with age and only for Perceptual Abilities (Sadakata et al., 2023). It has been suggested that inconsistent results in the literature concerning associations between age and musical sophistication could be rooted in cultural differences (Lin et al., 2021). We show here that sample composition may play a role as well. Indeed, in the present study, the associations only reached significance for Active Engagement and Musical Training in Sample 1, which exhibited overrepresentations of young people in line with samples used in the previous publications. Figure 1 suggests that the effect of age on Gold-MSI scores exhibits a non-linear pattern (see also Cubic regression models of subscale scores on age in Supplementary Materials). For instance, very young adults score higher than those in their late 20s, who score lower on most subscales than participants in their 30s. This is in line with the interpretation presented in the English version that sophisticated engagement with music peaks at an early stage of life, where many people are able to invest more time in music-related activities (Müllensiefen et al., 2014). It also suggests that linear regression and correlation analyses may not be suitable for capturing developmental aspects of musical sophistication. Together, interpreting mean scores in past and future studies will necessitate consideration of the sample's age composition for accurate contextualization. Note that no distinction is made between different age groups in the norm data presented in Supplementary Material, Figure S5.
In this study, we explored two different techniques to remedy an unbalanced sample: stratified subsampling and calculation of post-stratification weights. Stratified subsampling was used for the psychometric validation analysis because we aimed to use the same analysis functions as were used in previous Gold-MSI validation studies. Post-stratification was used for the regression analyses because we sought to demonstrate how all data can be maintained using pre-existing functions from the R package survey (Lumley, 2020) when researchers wish to use less complex common analyses such as linear regressions in their studies. The difference in sample size between Sample 1 (n = 1,435) and Sample 2 (n = 541) is evidence of the difficulty of turning an online sample into a representative sample by stratified subsampling, even when one is only constrained by basic stratification variables such as age and gender. Indeed, when including employment level as a stratification variable, the largest sample size that could be obtained using random sampling without replacement was n = 309. With more than 309 observations, the stratum representing females aged 34–41 failed to reach the number of observations required to maintain population proportions in the sample. Despite explicit attempts to target this group of participants, recruitment was less successful, possibly because many women in that age group prioritize their main job and/or caregiving responsibilities for young children over participating in research surveys. Clearly, discarding 75% of a dataset is not ideal. For the third analysis, we therefore chose to perform random sampling with replacement and to set the sample size as equal as possible to Sample 2 to allow equal comparisons across the two. That said, it is possible that this decision comes at the expense of other limitations, namely that the poorer fit of the CFA model in Sample 3 could be caused by duplicate observations in the sample (see the section Stratified Subsampling in Supplementary Materials). The key point here is that unless one is willing to accept that some participants influence analyses twice or even five times as much as other participants, the final n is proportionate to the size of the stratum where recruitment was least successful. Therefore, a major disadvantage of this technique is the risk of considerable data loss. In comparison, post-stratification techniques have the clear advantage that they maintain all data and simply weight the relative contribution of each observation. Furthermore, the survey package contains useful functions for performing simple statistical analyses in R. Applying post-stratification weights to already collected data is a simple and flexible technique that can be used to increase the precision of the estimates of analyses by correcting for under- or overrepresentation of certain groups in the sample.
While post-stratification increased representativeness with respect to age, gender, and employment, musicianship was not accounted for, as official data describing the distribution of musicianship status in the Danish population is not currently available. Because musicians may be more likely to participate in studies about musicality, it is likely that even the samples that were here characterized as representative exhibit sampling bias with respect to musicianship. This could lead to inflated norms in at least the MT, SA, and PA subscales and the General scale. This sampling bias limitation should be taken into account when interpreting scores obtained from studies that do not pertain to musical ability but that use the Gold-MSI, for example, to control for confounds of musical expertise.
Conclusion
The Gold-MSI-da is a valid tool for assessing musical sophistication in the general Danish-speaking population. Owing to the strong language invariance, it can even be utilized in combination with the English version of the Gold-MSI, for example, when including Danish and international participants in the same study. By using post-stratification weights to align the sample with the Danish population and to improve the accuracy and precision of statistical estimates, we showed that more and less representative samples can yield quite different results, affecting both correlations and multiple regression analyses. This underscores the importance of carefully considering sample composition in music psychology research and promotes researchers’ use of simple post-stratification techniques whenever feasible in future studies.
Supplemental Material
sj-pdf-1-mns-10.1177_20592043241289087 - Supplemental material for The Danish Goldsmiths Musical Sophistication Index: Validation in Samples with Different Degrees of Representativeness
Supplemental material, sj-pdf-1-mns-10.1177_20592043241289087 for The Danish Goldsmiths Musical Sophistication Index: Validation in Samples with Different Degrees of Representativeness by Cecilie Møller, Niels Chr. Hansen, Peter Vuust and Daniel Müllensiefen in Music & Science
Footnotes
Acknowledgments
We thank Niels Trusbak Haumann, Naomi Monika Brandt, and Mikkel Kristensen for assistance during development of the Danish version of the questionnaire and the online experiment, and Viola Pausch and Hsin-Rui Lin for assistance with data analyses.
Action Editor
Elaine King, School of Arts, University of Hull.
Peer Review
E. Glenn Schellenberg, Centro de Investigação e Intervenção Social, Instituto Universitário de Lisboa.
Nicholas J. Shea, School of Music Dance and Theatre, Arizona State University.
Author Contributions
CM, NCH, and DM conceived the study and its methodology; DM provided data analysis resources; and CM performed the formal analyses, collected the data, and wrote the first draft of the manuscript. CM, NCH, and PV contributed to funding acquisition. All authors contributed to the interpretation of the results, reviewed and edited the manuscript, and approved the final version of it.
Declaration of Conflicting Interests
The authors declared no potential conflicts of interest with respect to the research, authorship, and/or publication of this article.
Ethical Approval
The study was approved by the Institutional Review Board at the Danish Neuroscience Center, Aarhus University Hospital (case no. IRB-2019-005).
Funding
The authors disclosed receipt of the following financial support for the research, authorship, and/or publication of this article: This work was supported by seed funding 2019 from the Interacting Minds Centre, Aarhus University. DM was supported by the Humboldt’s foundation’s Anneliese-Maier researcher prize. NCH received funding from the European Union’s Horizon 2020 research and innovation programme under the Marie Skłodowska-Curie grant agreement No 754513 and The Aarhus University Research Foundation. Center for Music in the Brain is funded by the Danish National Research Foundation (DNRF117).
Data Availability Statement
The conditions of our ethics approval do not permit public archiving of anonymized study data. Participants provided consent for sharing their anonymized data within the project group but not with third parties. Analysis code for the different sampling approaches is available upon request from the corresponding author.
Supplemental Material
Supplemental material for this article is available online.
References
Supplementary Material
Please find the following supplemental material available below.
For Open Access articles published under a Creative Commons License, all supplemental material carries the same license as the article it is associated with.
For non-Open Access articles published, all supplemental material carries a non-exclusive license, and permission requests for re-use of supplemental material or any part of supplemental material shall be sent directly to the copyright owner as specified in the copyright notice associated with the article.