
Abstract
Music psychology has grown drastically since being established in the middle of the 19th century. However, until now, no large-scale computational bibliometric analysis of the scientific literature in music psychology has been carried out. This study aims to analyze all published literature from the journals Psychology of Music, Music Perception, and Musicae Scientiae. The retrieved literature comprised a total of 2,089 peer-reviewed articles, 2,632 authors, and 49 countries. Visualization and bibliometric techniques were used to investigate the growth of publications, citation analysis, author and country productivity, collaborations, and research trends. From 1973 to 2017, with a total growth rate of 11%, there is a clear increase in music psychology research (i.e., number of publications, authors, and collaborations), consistent with the general growth observed in science. The retrieved documents received a total of 33,771 citations (M = 16.17, SD = 26.93), with a median (Q1—Q3) of 7 (2—20). Different bibliometric indicators defined the most relevant authors, countries, and keywords as well as how they relate and collaborate with each other. Differences between the three journals are also discussed. This type of analysis, not without its limitations, can help understand music psychology and identify future directions within the field.
Introduction
The beginnings of what we now regard as music psychology started in the middle of the 19th century as a branch of both psychology and musicology (Thaut, 2011). But music psychology has evolved and grown drastically since then. From a focus on psychoacoustics, perception, and the cognitive sciences, to health applications and the use of music in everyday life, music psychology has shifted and blossomed, establishing programs, labs and journals covering different research interests, geographical areas, and research groups.
Music psychology can be defined as the scientific study of the psychological processes through which music is perceived, created, responded to, and incorporated into everyday life (Tan, Pfordresher, & Harré, 2017; Thompson, 2009). The field of music psychology therefore embraces an incredibly diverse and wide variety of topics, including the origins of music, music perception and cognition, responses to music (e.g., bodily, emotional, and aesthetical), the neuroscience of music, music development, music education, music performance, composition and improvisation, the use of music in everyday life, and music therapy and wellbeing (Hallam, Cross, & Thaut, 2011). But the psychology of music can also contribute to broader fields, such as social psychology, behavioral science, aesthetics, computer science, medicine and health, consumer psychology, marketing, and advertising. Researchers from all over the globe investigate these topics empirically, with more than 80 music cognition and science labs around the world (www.musicperception.org/smpc-resources.html). Psychology of music conferences have been held in the UK since 1972 under the umbrella of SEMPRE (formerly SRPMME). Since then, various music-psychology-specific conference series have also begun to develop, such as the International Conference on Music Perception and Cognition (ICMPC), founded in 1989, and the European Society for the Cognitive Sciences of Music (ESCOM), founded in 1991. In 2008, the International Conference of Students of Systematic Musicology (SysMus) was founded for students of systematic musicology, a broader field which encompasses music psychology.
The first research journal specifically dedicated to music psychology is Psychology of Music, established in 1973. This multidisciplinary journal’s aim is to “increase scientific understanding of all psychological aspects of music and music education” (journals.sagepub.com/home/pom). Music Perception, established in 1983, was developed with a primary focus on cognitive-psychological research with broader and multidisciplinary draw, including work from “psychology, psychophysics, neuroscience, music theory, acoustics, artificial intelligence, linguistics, philosophy, anthropology and cognitive science” (mp.ucpress.edu). In 1997, the European Society for the Cognitive Sciences of Music (ESCOM) was developed along with its journal Musicae Scientiae, which aims to include “empirical, theoretical and critical articles directed at increasing understanding of how music is perceived, represented and generated” (journals.sagepub.com/home/msx). As a truly multidisciplinary subject, music psychology research is published in many other journals, including other APA journals and journals from related disciplines, such as musicology, music theory, music therapy, music education, aesthetics, marketing, and neuroscience. This includes, for example, the Journal of Research in Music Education, International Journal of Music Education, Journal of Music Therapy, Empirical Musicology Review, and Psychomusicology: Music, Mind, and Brain.
The current research focuses on the three most prominent scientific journals in music psychology, namely Psychology of Music, Music Perception, and Musicae Scientiae. We used two criteria to select these journals: content and impact. Regarding content, the focus was on journals covering specifically the psychology of music. Impact was determined by the SJR ranking provided in SCImago (www.scimagojr.com). This measure indicates the average number of weighted citations per document received within the selected journal during the previous three years. In June 2018, searching in the category “music,” Psychology of Music was ranked fourth, Musicae Scientiae sixth, and Music Perception seventh. The first (IEE Signal Processing Magazine), second (Journal of Research in Music Education), third (Music Education Research), and fifth (International Journal of Music Education) journals did not meet the first criterion of content, focusing on other topics rather than on music psychology (i.e., signal processing or music education).
With the surge of interest in music psychology research, it is important as a discipline to reflect systematically on what research has been published and what gaps can still be filled. Bibliometrics and scientometrics allow for the measurement and analysis of published scientific literature, giving objective and measurable data to help us understand the discipline’s trajectory thus far. By using computational, mathematical and statistical techniques, bibliometrics analyses the quantity and quality of published scientific literature, including citation analysis, authorship and country productivity and collaborations, impact of publications, and research trends (e.g., Blázquez-Ruiz, Guerrero-Bote, & Moya-Anegón, 2016; Blažun, Kokol, & Vošner, 2015; Chen, Arsenault, Gingras, & Larivière, 2015; De Bellis, 2009; Laengle et al., 2017; Mryglod, Holovatch, Kenna, & Berche, 2016; Naukkarinen & Bragge, 2016; Sweileh, 2017; Sweileh et al., 2016, 2017; Sweileh, Al-Jabi, Sawalha, & Zyoud, 2016).
Bibliometric analyses have rarely been applied to music psychology literature. We have found two articles that used a bibliometric approach to study perception and cognition research (Tirovolas & Levitin, 2011) and music and affect research (Diaz & Silveria, 2014). In Triovolas & Levitin’s (2011) study, the authors looked at publications within one journal (Music Perception), covering a total of 578 articles. The retrieved literature was coded to look at the most frequent topics, populations, stimuli, materials, outcome measures, and music styles, indicating their trends between 1984 and 2009. They also provided a list of the top 20 most highly cited articles published in Music Perception and the top 20 articles published outside Music Perception that were most cited in the journal. Finally, the authors showed the most productive countries publishing in Music Perception. In the paper by Diaz and Silveria (2014), the authors looked specifically at music and affective phenomena. They focused on three journals: the Journal of Research in Music Education, Psychology of Music, and Music Perception. The authors used strict inclusion criteria to select articles related to topics relevant to affective aspects of music, resulting in a total of 286 articles.
A recent paper by Sloboda and Ginsborg (2018) investigated the country and discipline spread of the contributors and members of Musicae Scientiae as well as compared the topics of early meetings and publications with current meetings. Although a strict bibliometric approach was not used, the paper is the only publication to specifically examine the international spread of music psychology researchers. While the studies by Triovolas & Levitin (2011) and Sloboda and Ginsburg (2018) only focused on one scientific journal, the study by Diaz and Silveria (2014) had a very narrow topical focus (i.e., music and affect research). Thus, these studies cannot give insight into trends throughout music psychology as a whole. Moreover, the studies used very few bibliometric indicators. For instance, they did not provide information about the growth of publications, more elaborated citation analysis, or author productivity and collaborations. Other important limitations in these studies are the relatively small datasets and the use of human coders to analyze the content of the articles.
The present study aims to produce a large-scale computational bibliometric analysis of the scientific literature published in music psychology from 1973 to 2017. Using this method of analysis we aim to better understand research trends, citations, authorships, collaborations, as well as global contributions. This is important in identifying future directions within the field. To reduce potential sources of bias and analyze systematically a large amount of documents, the present study used the R package bibliometrix (Aria & Cuccurullo, 2017), a tool for quantitative research in bibliometrics that provides various functions to perform citation, coupling, and scientific collaboration analysis. To visualize the data, we used VOSviewer (Van Eck & Waltman, 2010), a software tool that applies advanced clustering and natural language processing techniques for generating and visualizing maps based on network data. VOSviewer software has been used in a large body of published literature (www.vosviewer.com/publications), generating over 500 publications since 2006. To the best of our knowledge, the software has not yet been applied to music psychology literature.
In the present study we analyze, through visualization and bibliometric techniques, all published literature from Psychology of Music, Music Perception, and Musicae Scientiae, while focusing on five key aspects of the retrieved literature: (1) growth of publications (i.e., annual growth rate, relative growth rate, and whether there are significant temporal changes in the number of publications over time), (2) citation analysis (i.e., number of citations per journal and year, top cited authors and papers, and whether there are significant temporal changes in the number of citations over time), (3) authorship analysis (i.e., productivity, dominance, collaboration index, visualizations of authorship collaboration, and Lotka’s law coefficient for scientific productivity), (4) country analysis (i.e., productivity, visualization of country collaboration, and geographical distribution of the publications), and (5) the main conceptual language used in the retrieved literature.
Methods
Data collection and search strategy
The data used in this study was retrieved from Scopus, a bibliographic database that covers over 20,000 journals, including technical, medical, and social sciences titles. Scopus is larger than PubMed and Web of Science (Falagas, Pitsouni, Malietzis, & Pappas, 2008) and offers many relevant features that facilitate bibliometric analysis (e.g., author, country, and affiliation contributions, citation analysis, and the “source type” function).
We searched all available literature, by “source title”, in Psychology of Music, Music Perception, and Musicae Scientiae. Using the Scopus “source type” function, we limited the search to empirical and review articles only, excluding book chapters, conference papers, and editorial notes. We also excluded any document from 2018 because it was the year in which this study was conducted. All available results were then exported to text files, including citation information (i.e., authors, document title, year, source title, volume, issue, pages, citation count, source and document type, and DOI), bibliographical information (i.e., affiliations, serial identifiers, publisher, editor, language of original document, correspondence address, and abbreviated source title), abstracts, as well as keywords. All data was retrieved on April 20, 2018 (see supplementary materials for the two main datasets used in this study).
In some situations, the same author might have more than one name, use different initials in different publications (e.g., Sloboda, J. vs. Sloboda, J. A.), or have different name spellings. This might generate inaccuracy and inconsistencies in the computational analysis of authorship. There is not a general solution to this problem. Researchers can decide between two imperfect approaches: (a) to analyze the data without any previous processing, which would count the same authors as different authors when their names were spelled using different initials; or (b) to remove the initials of the second (and third) names from all authors, which would count two different authors as the same when they had the same surname and first initial. We chose the latter approach because it was considered to have a smaller negative impact on the analysis. Moreover, we did not find any case in which two different authors shared the same surname and first initial names in our dataset. Thus, we removed the second and third initial in all authors, including only the first surname and first initial.
In addition, it is important to note that our data has a gap in the literature retrieved from Music Perception between 2002 and 2004, as Scopus does not contain any documents from this source during these three years. Although Music Perception published articles during this period of time, we do not have a clear reason to explain this gap.
Data analysis and visualization
Descriptive statistics and standard bibliometric indicators, including citation analysis, annual growth of publications, authorship productivity, dominance, collaboration index, and country productivity were used to produce an overview of the retrieved data. The application and presentation of some of these indicators was based on the analysis reported in Sweileh et al. (2017). In addition, we used the R package bibliometrix (Aria & Cuccurullo, 2017) to analyze the most productive authors, countries, keywords, top cited articles and authors, author dominance, index-h, and Lotka’s law coefficient for scientific productivity (1926).
Visualization and bibliometric maps were created using VOSviewer (Van Eck & Waltman, 2010), which uses a unified framework for mapping and clustering (Waltman, Van Eck, & Noyos, 2010). The software is mainly intended for analysis of bibliometric networks and can create three types of visualizations: network visualizations, overlay visualizations, and density visualizations. In the network visualizations, items are represented by their label and by a circle. The size of the circles is determined by the weight of the item. The place of the items in the map and their colors are used to cluster the items. The color of an item is determined by the cluster to which the item belongs. Lines between items represent links and the stronger the link is, the wider the line. The distance between items in the map indicates the degree of relatedness between them. Furthermore, we used the R package rworldmap (South, 2011) to generate visualizations of the geographical distribution of countries’ productivity.
Results
Retrieved literature
A total of 2,089 documents were retrieved, covering a time period of 44 years (1973–2017) beginning from the first publication of Psychology of Music in 1973. Table 1 shows the total number and type of articles retrieved per journal and in total. The majority of documents were research articles (1,987; 95.12%), whereas review articles only represented a minimal portion (102; 4.88%). Psychology of Music was the journal with the largest number of retrieved articles (934; 44.71%), followed by Music Perception (746; 35.71%), and Musicae Scientiae (409; 19.58%). However, when taking into account the years that each journal has been active, the average number of publications per year is comparable across the three journals (20.76, 23.31, and 19.48, respectively). Table 2 shows the top 20 contributions made by author, keywords, and countries. See Appendix A for the tables of the top 20 contributions made by author, keyword, and country by decade, and Appendix B for the top 10 contributions by each journal.
Number and type of articles retrieved.

Note. PoM: Psychology of Music; MP: Music Perception; MS: Musicae Scientiae.
Top 20 contributions of authors, keywords, and countries.
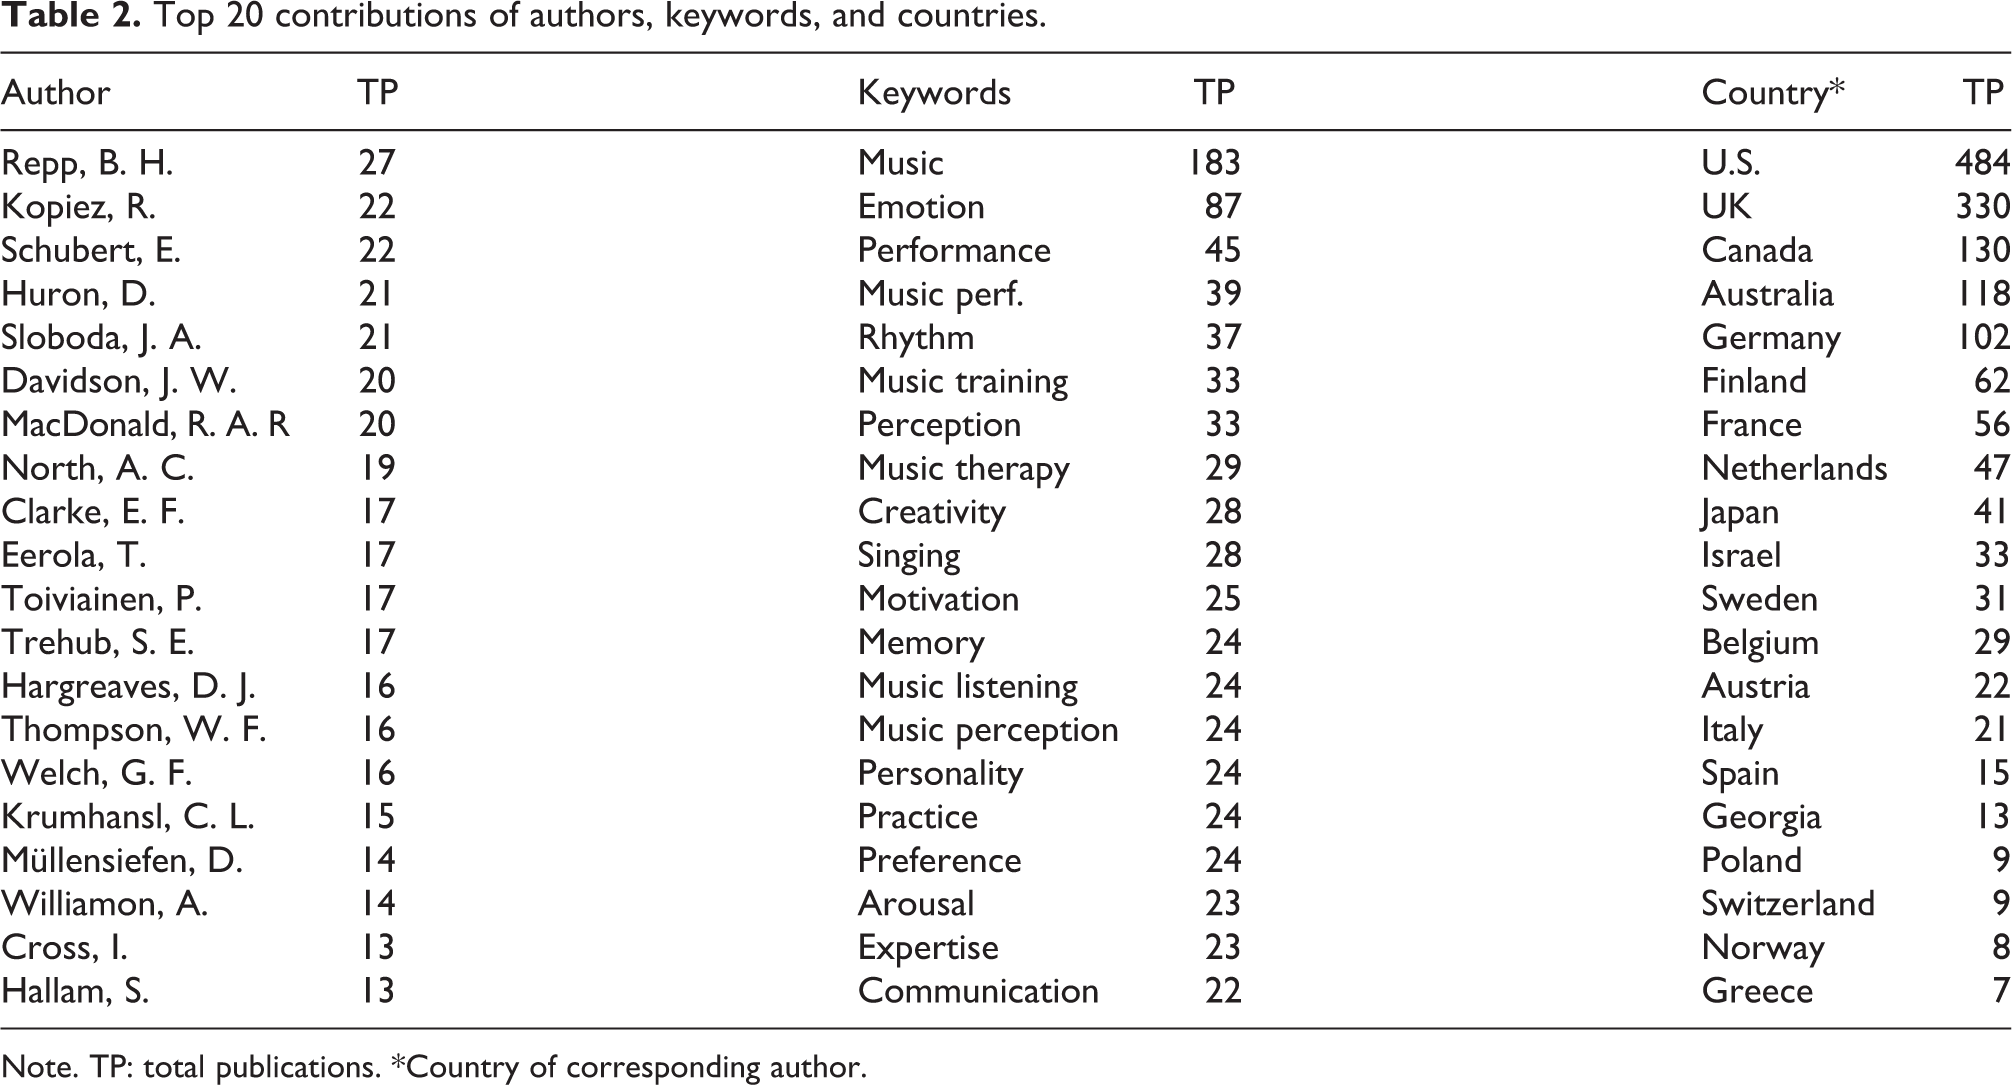
Note. TP: total publications. *Country of corresponding author.
Growth in number of publications
The mean number of publications from 1973 to 2017 was 46.42 (SD = 35.56). The total percentage of relative growth was 11%. The highest productivity was observed in 2016 with a total of 135 publications (6.46%) and the lowest productivity was observed in 1975 with a total of nine publications (.43%). Figure 1 shows the total number of publications in the three journals over time. The total number of publications increased significantly over time, as indicated by a simple linear regression, F(1,43) = 141.1, p < .001, with an R2 of .766.

Total number of publications per journal over time. Note: PoM: Psychology of Music; MP: Music Perception; MS: Musicae Scientiae.
Table 3 shows the annual number of publications, annual growth rate (AGR), and relative growth rate (RGR). The AGR indicates the percentage of change in the number of publications over one year. The AGR is calculated using the following equation: AGR = [(TP ending value - TP beginning value)/TP beginning value] *100, where TP is total number of publications. The RGR indicates the growth rate relative to the total number of publications per year. The RGR was calculated based on the following equation: RGR= [logeW2 – logeW1]/(T2 - T1), where logeW2 is the log of the final number of publications after a specific period of interval; logeW1 is the log of the initial number of publications; and T1 - T2 is the unit difference between the initial time and the final time.
Annual number of publications, AGR, and RGR.
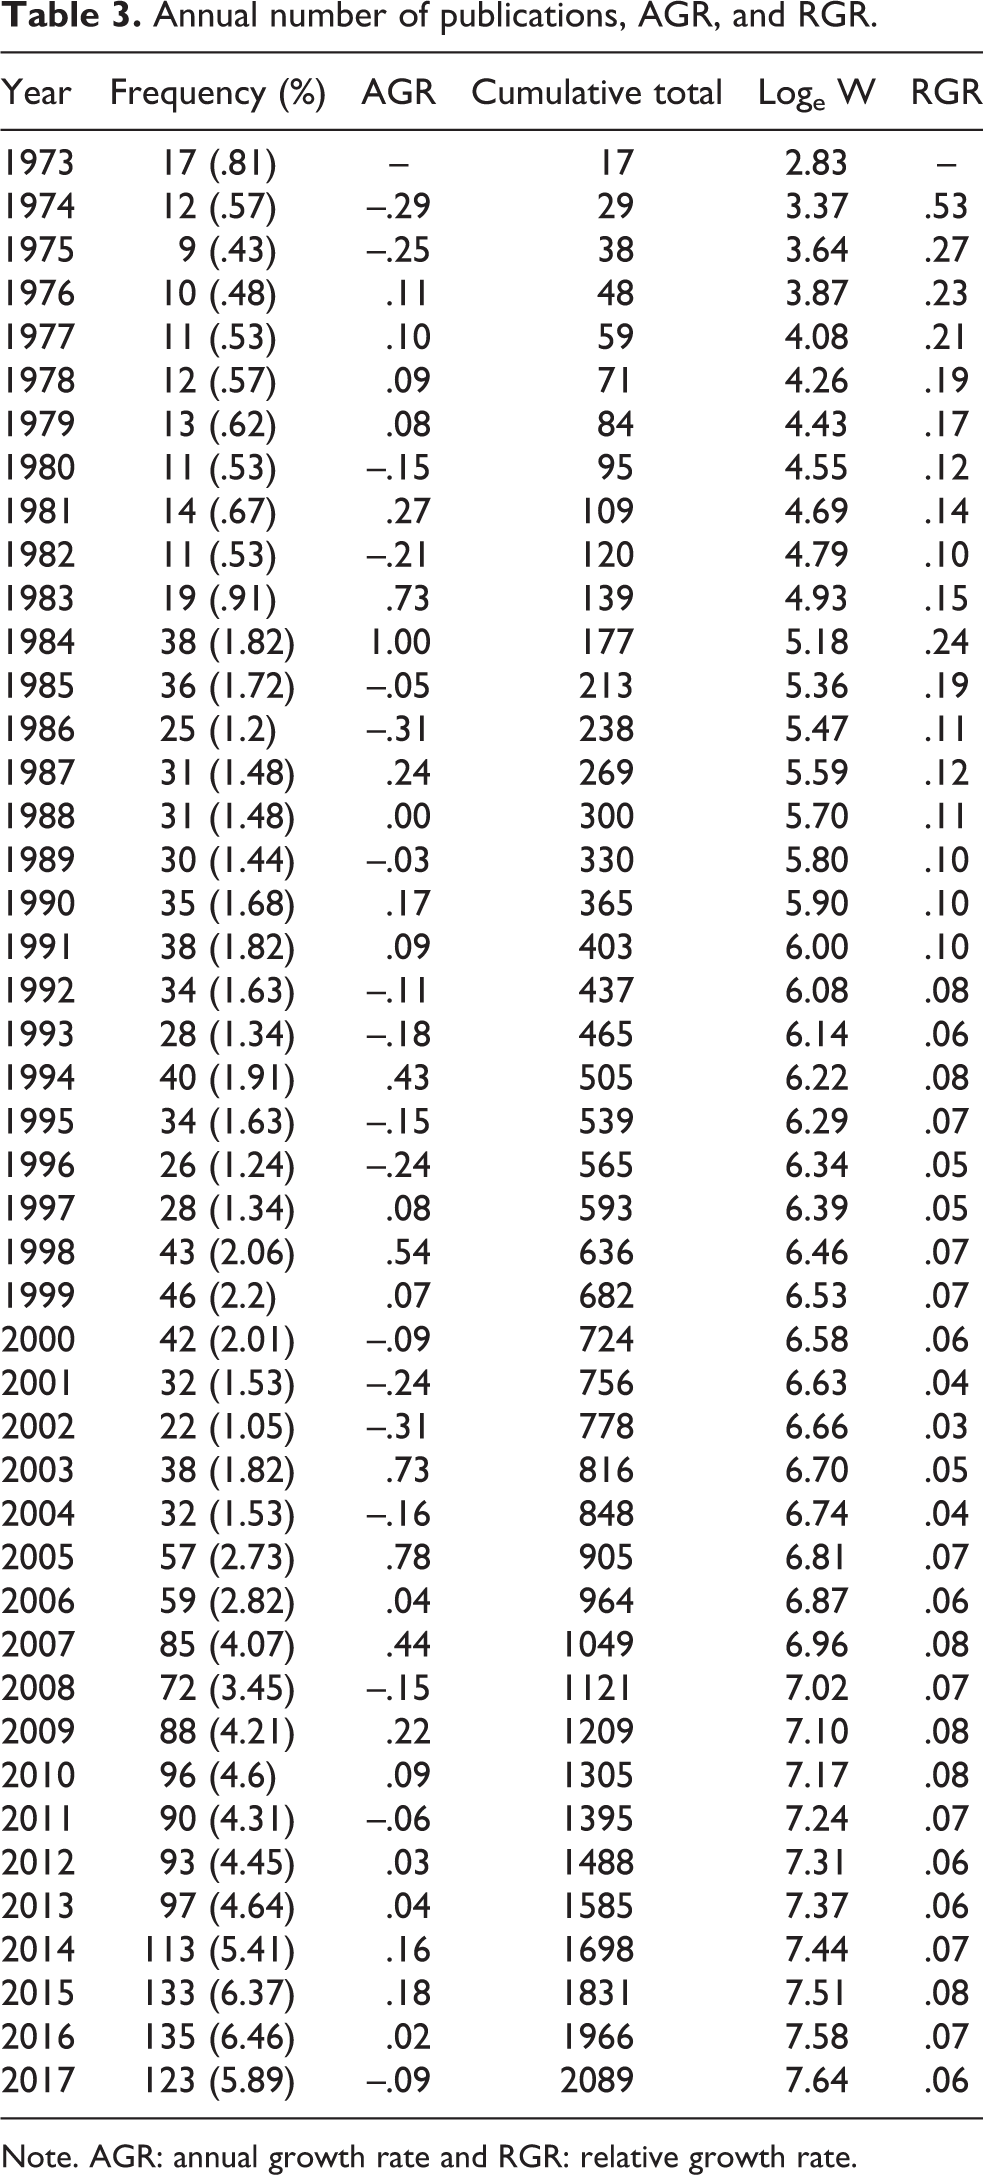
Note. AGR: annual growth rate and RGR: relative growth rate.
Appendix C shows the annual number of publications, AGR, and RGR in the three journals separately. In Psychology of Music, the average number of publications from 1973 to 2017 was 20.76 (SD = 16.48), with a total relative growth rate of 9%. In Music Perception the mean number of publications from 1983 to 2017 was 23.31 (SD = 8.31), with a total relative growth rate of 15%. In Musicae Scientiae, the average number of publications from 1997 to 2017 was 19.48 (SD = 10.38), with a total relative growth rate of 18%.
Citation analysis
Table 4 shows the summary of the citation analysis of all three journals combined. Retrieved documents received a total of 33,771 citations, a mean of 16.17 (SD = 26.93) citations per document, and median (Q1—Q3) of 7 (2—20). While the highest number of total citations was in 2007, with 1,978 (M = 23.3, SD = 30.1) citations, the lowest was in 1975, with 25 citations (M = 2.8, SD = 2.9). Figure 2 shows the average total number of citations over time. Across the entire time period, the average number of citations did not increase significantly, as indicated by a simple linear regression, F(1,43) = .21, p = .65, R2 = .005. However, the relationship between the average citations and year followed an inverted-U shape, as indicated by a statistically significant quadratic regression, F(2,42) = 52.65, p < .001, R2 = .715.
Summary of the citation analysis.

Note. TC: total citations.

Average total citations per year over time.
Appendix D shows the summary of citation analysis in the three journals separately. In Psychology of Music, the retrieved documents received a total of 13,344 citations, a mean of 16.98 (SD = 26.12) citations per document, and median (Q1–Q3) of 8 (3–21). In Music Perception, the documents received a total of 17,069 citations, a mean of 24.38 (SD = 33.25) citations per document, and median (Q1–Q3) of 14 (5–29). In Musicae Scientiae, the documents received a total of 3,358 citations, a mean of 10.17 (SD = 15.04) citations per document, and median (Q1–Q3) of 5 (2–12).
The top 10 cited articles and authors in the retrieved literature are shown in Table 5a and Table 5b respectively. The publication that received the highest amount of citations was “Perception of Temporal Patterns” by Povel and Essens (1985), with a total of 364 citations and an average of 11.03 citations per year. The author with the highest number of citations was John Sloboda, who received a total of 1,070 citations.
(a) Top 10 cited articles in the retrieved literature. (b) Top 10 cited authors in the retrieved literature.

Note. PoM: Psychology of Music; MP: Music Perception; MS: Musicae Scientiae. TC: total citations; TP: total publications.
Authorship analysis: Productivity, dominance, collaboration, and Lotka’s law
A total of 2,632 authors were covered in the retrieved literature, with a mean of 1.26 authors per article and a mean of .79 articles per author. The mean number of co-authors per article was 2.08. Table 6 shows the average authors per document, author productivity, and collaboration index (CI). The mean number of authors per document increased significantly over time, from a mean of 1.2 in the first period of 10 years (1973–1982) to a mean of 2.48 in the last period of 10 years (2008–2017), F(1,43) = 221.19, p < .001, R2 = .837. The collaboration index (CI) for multi-authored papers (CI = number of authors in multi-authored publications/number of multi-authored papers) increased significantly over time from 2.00 in 1974 (the first year with a multi-authored paper) to 2.98 in 2017, F(1,43) = 78.91, p < .001, R2 = .653.
Average authors per document, author productivity, and collaboration index.

Note. Percentages in brackets. TA: total number of authors and CI: collaboration index.
Figure 3 shows the number of single-authored and multi-authored publications over time. While a total of 828 documents (39.67%) were single-authored publications, a total of 1,262 publications (60.41%) were multi-authored. Both the number of single-authored papers, F(1,43) = 27.92, p < .001, R2 = .394, and multi-authored papers, F(1,43) = 123.97, p < .001, R2 = .742, increased significantly over time, although this increase had a larger magnitude in publications with multiple authors.

Number of single-authored and multi-authored publications over time.
Figure 4 shows a network visualization map of author collaborations. The relatedness of authors is determined based on their number of co-authored publications. Authors with a minimum of five co-authorship publications and a minimum of 100 total citations are visualized, resulting in a total of 49 authors.

Network visualization map of author collaborations. Note: The width of the line shows the strength of the collaboration. The size of the circle indicates the total number of publications per author. The color of the circle indicates the cluster to which the author belongs.
Table 7 shows the authors with a minimum dominance factor of > .1. The dominance factor was proposed by Kumar and Kumar (2008), indicating a ratio of the fraction of multi-authored publications in which an author appears as first author (dominance factor 1 means that an author is the first author in all of his or her multi-authored papers). The author with the highest dominance factor (.47) was Tuomas Eerola, being the first author in 8 publications out of 17 multi-authored publications.
Authors with a minimum dominance factor of > .1.

Figure 5 depicts Lotka’s law coefficient for scientific productivity (Lotka, 1926), indicating the theoretical distribution (red) and the estimated distribution based on the retrieved literature (blue). Lotka’s law describes the frequency of publication by authors in any given field. It assumes an inverse square law in which the number of authors making a certain number of contributions is a fixed ratio to the number of authors publishing a single article, implying that the theoretical Beta coefficient of Lotka’s law nearly always equals 2. Using the function lotka from the R package bibliometrix (Aria & Cuccurullo, 2017), we estimated the Beta coefficient of the retrieved literature, which was 2.3 and had a goodness of fit equal to .94. A Kolmogorov–Smirnoff two-sample test indicated that there were no significant differences between the observed and the theoretical Lotka distribution, p = .22.

Lotka’s law coefficient for scientific productivity (theoretical and estimated distributions).
Country analysis: Productivity, collaborations, and geographical distribution
The number of countries contributing to the retrieved literature was 49. Table 8 displays the countries with a minimum production of five publications, including their frequency, total number of citations, and the number of single-country publications as well as multiple-country publications. The U.S. and the UK had the highest total citations, with 8,669 (25.67%) and 5,954 (17.63%) and a mean of 17.99 and 18.04 citations per publication, respectively. Nevertheless, this analysis did not take the population of each country into account. Thus, we ran a second analysis considering the average population for each country. The average population from 1973 to 2017 per country was calculated using the World Bank population data (https://data.worldbank.org). The total number of publications was divided by the average population for each country (rounded to the nearest million) to find the total number of publications per million people. Once population was accounted for, Finland and Australia had the highest total publications, with 15 and 8.1 publications per million, respectively.
Countries with a minimum productivity of five publications (country of corresponding author).

Note. TP: total publications, TC: total citations, SCP: single-country publication, MCP: multiple-country publication.
Figure 6 shows two geographical distributions of publications, a version without correcting for country population (map on the top) and a version correcting for country population (map on the bottom). The maps were created using the R package rworldmap. The map on the top is color-coded using six categories (1 = 0–100, 2 = 101–200, 3 = 201–300, 4 = 301–400, 5 = 401–500, and 6 = 501–600 publications), whereas the map on the bottom used eight categories (1 = 0–2, 2 = 3–4, 3 = 5–6, 4 = 7–8, 5 = 9–10, 6 = 11–12, 7 = 13–14, and 8 = 15–16 publications per million). In the two maps, countries colored in dark blue indicate the highest number of publications, and light yellow colored countries the lowest. Countries with no color indicate that there was no retrieved data from these areas.

Geographical distribution of publications without correcting for country population (top) and with the correction (bottom). Note: Countries colored dark blue had the highest productivity and countries colored light yellow had the lowest. Countries with no color indicate that there was no retrieved data from these areas.
Figure 7 depicts a network visualization map of international collaborations. The relatedness of countries is determined based on their number of co-authored publications. Countries with a minimum of 10 international co-authorship publications and a minimum of 100 total citations are visualized. As a result, 19 countries are visualized, clustering in four groups.
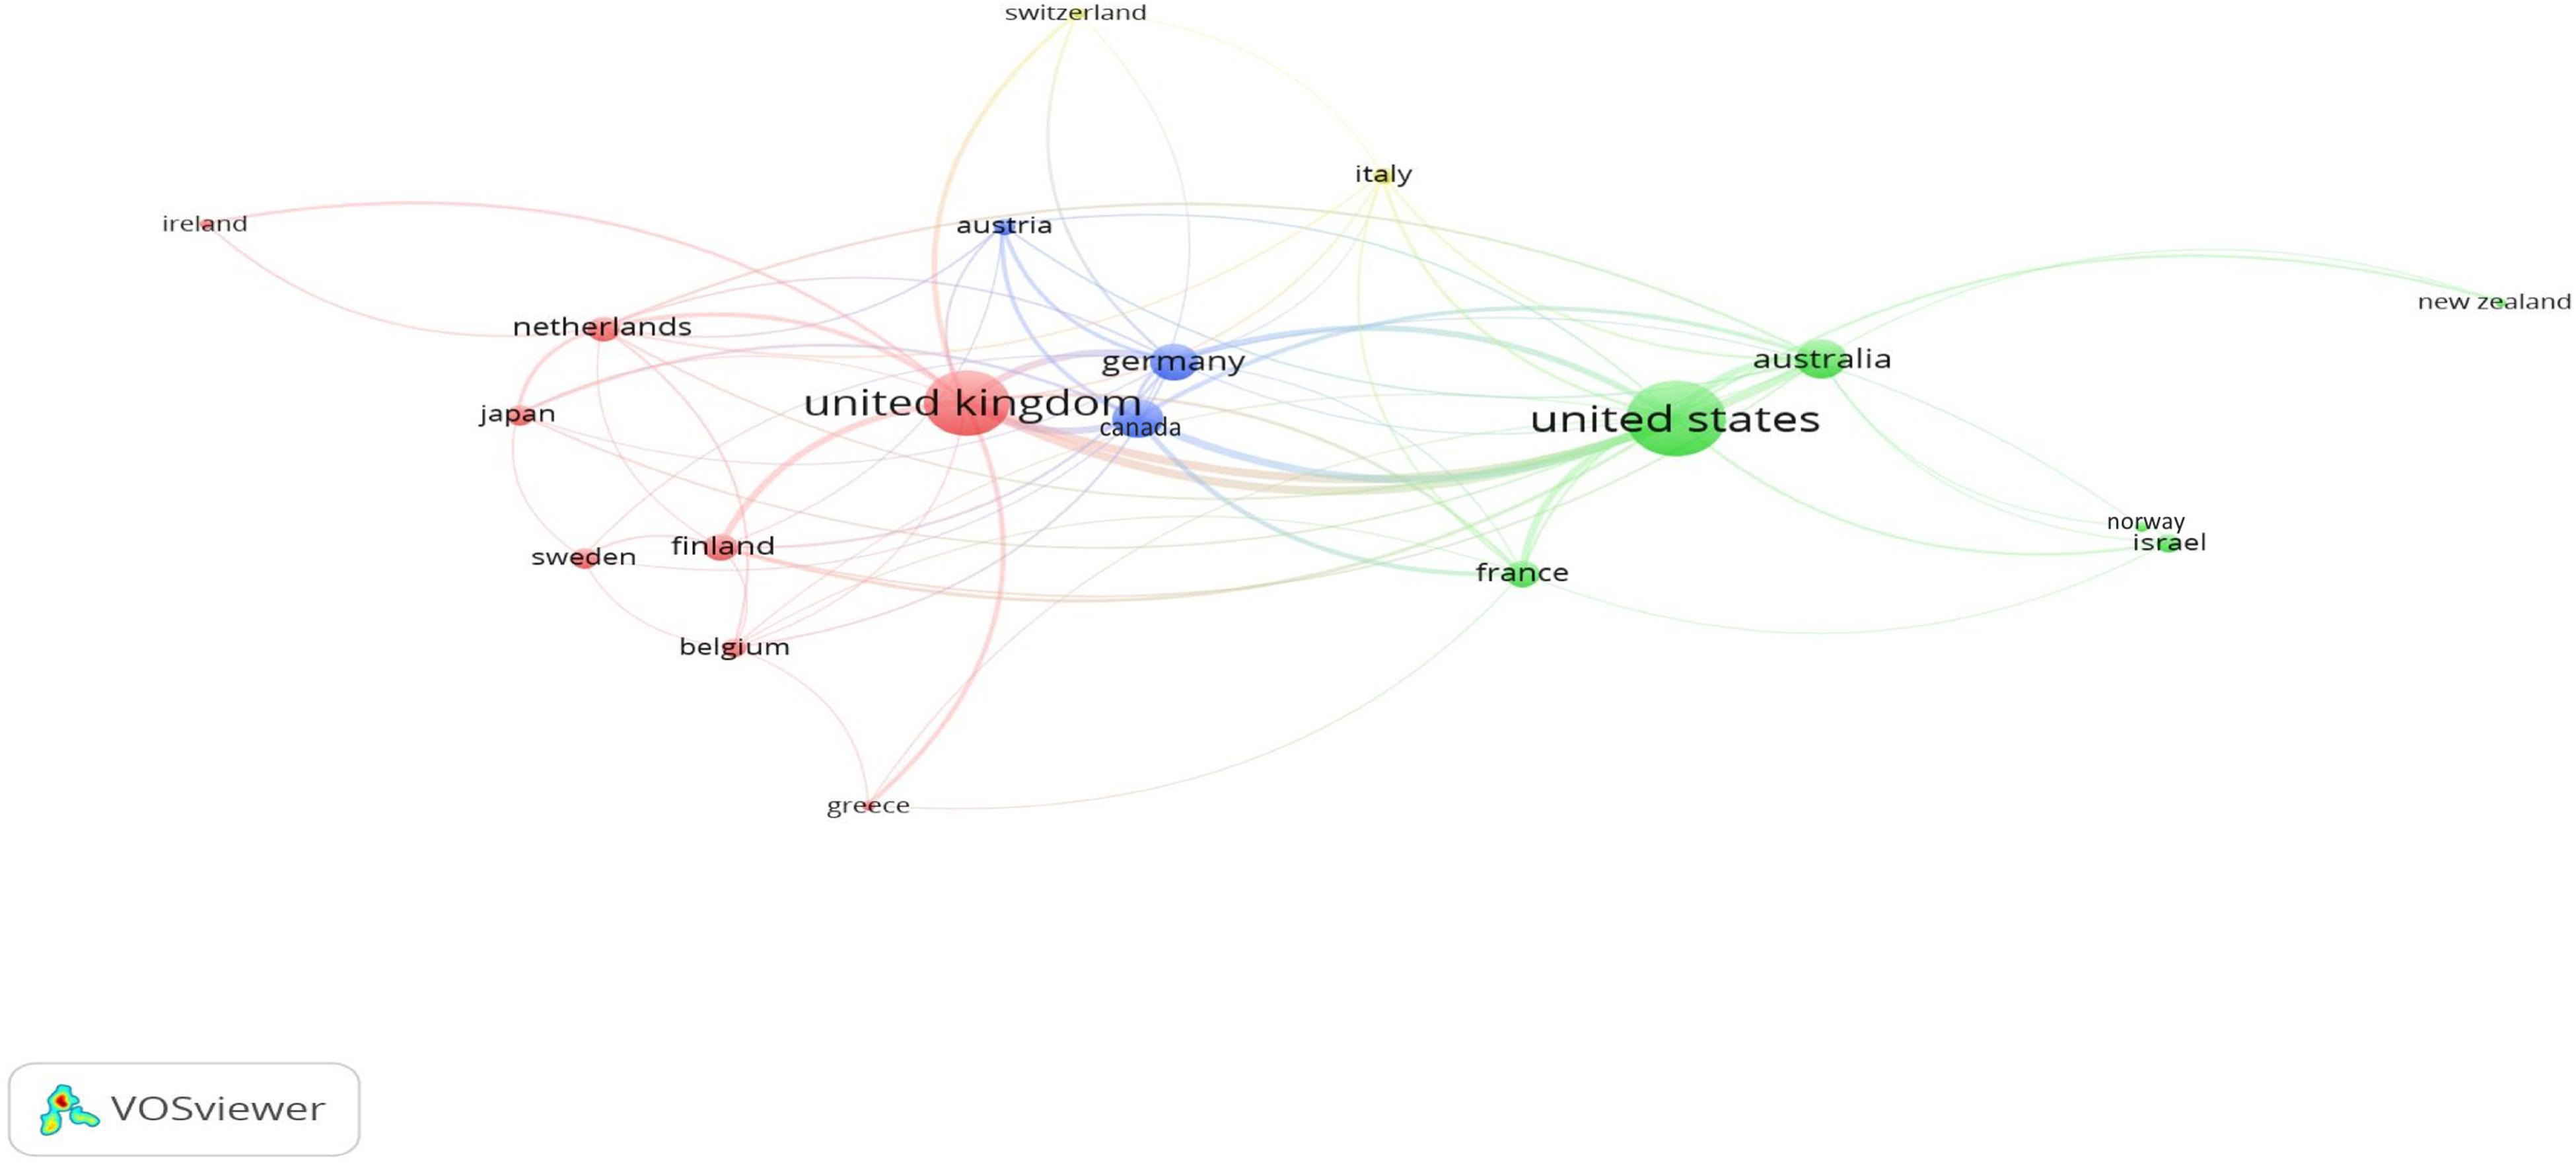
Network visualization map of international collaborations. Note: The width of the line shows the strength of the collaboration. The size of the circle indicates the total number of publications per country. The color of the circle indicates the cluster to which the country belongs.
Conceptual language
Figure 8 shows an overlay visualization map of author keywords occurrences (i.e., keywords listed by the authors on each publication). Only keywords that occurred a minimum of 10 times were included, resulting in a total of 75 keywords. Note, however, that Scopus only provides author keywords data from 2005 onwards. Thus, the overlay map only displays keywords from 2005 to 2017. Overlay maps are similar to network maps but they are colored based on a given score. The scores used in Figure 8 are based on the average publication year of each keyword. Dark blue represents the oldest average year of publications and red the most recent. The interpretation of the maps is the same as in the network visualization maps.

Network visualization map of keyword occurrences. Note: The width of the line shows the strength of the co-occurrence between keywords. The size of the circle indicates the total number of occurrences. The color of the circle indicates average year of publications.
Discussion
This study aimed to analyze, through visualization and bibliometric techniques, all published literature from Psychology of Music, Music Perception, and Musicae Scientiae. Using all available literature in Scopus, a total of 2,089 publications constituted the retrieved literature, covering a time span of 44 years (1973–2017). Overall, there is a clear increase in music psychology research (i.e., number of publications, authors, and collaborations), with a total growth rate of 11%. The retrieved documents received a total of 33,771 citations (M = 16.17, SD = 26.93), with a median (Q1—Q3) of 7 (2—20). A total of 2,632 authors were covered in the retrieved literature, with a mean of 1.26 authors per article and a mean of .79 articles per author. While a total of 828 documents (39.67%) were single-authored publications, a total of 1,262 publications (60.41%) were multi-authored. Both the number of single-authored papers and multi-authored papers increased significantly over time. However, the magnitude of this increase was higher in the publications with multiple authors. The collaboration index (CI) for multi-authored papers (i.e., CI = number of authors in multi-authored publications/number of multi-authored papers) also increased significantly over time, from 2.00 in 1974 (the first year with a multi-authored paper) to 2.98 in 2017. Moreover, the retrieved literature covered a total of 49 countries. The U.S. and the UK were the most productive countries, defined as having the highest number of publications (U.S. = 23% and UK= 16%) and citations (U.S. = 26% and UK= 18%), but when corrected for population Finland and Australia had the highest total number of publications per million (Finland = 15 per million and Australia = 8.1 per million). Finally, the keywords “music” and “emotion” had the highest number of co-occurrences as well as connections with other keywords.
The results of this study present objective and measurable patterns and trajectories seen across the development of music psychology research included within these three journals. We hope these spark discussion and questions as to why these patterns might exist, what gaps they leave, and how they fit within a wider context. Compared to the above summary of the results, below we discuss these questions for each of our main findings.
Comparing the three journals
Psychology of Music was the first journal to begin publishing, in 1973. Second was Music Perception in 1983 and third Musicae Scientiae in 1997. These differences in the active time span of each journal explain why Psychology of Music has the largest number of retrieved articles (44%), followed by Music Perception (36%), and Musicae Scientiae (20%). However, the average number of publications per year in the three journals is very similar (20.76, 23.31, and 19.48, respectively). Figure 1 suggests that one potential main driver in the general increase in publications over time was Psychology of Music, which moved to a greater number of publications per year. However, statistical tests should be used to examine to what extent this difference is meaningful. Interestingly, Musicae Scientiae has the highest relative growth rate of 18%, whereas Music Perception has a relative growth rate of 15% and Psychology of Music of 9%. When looking at the average citations per document, Music Perception has the highest mean citations per document (M = 24.38, SD = 33.25), followed by Psychology of Music (M =16.98, SD = 26.12) and Musicae Scientiae (M = 10.17, SD = 15.04). Nevertheless, this pattern changes if we look at the average citations in the three most recent years (from 2015 to 2017), as calculated by SCImago’s SJR ranking. In this case, Psychology of Music remains in first place, but Musicae Scientiae moves forward to the second position and Music Perception to the last. These results could inspire future research to investigate reasons for such differences. One example could be to examine how funding, publication costs, access, and editorial teams might influence or predict productivity and citation outcomes.
Growth of publications
Our results show that from 1973 to 2017 there was an overall growth in the number of publications across all three journals. This may not be surprising as research article publications have seen an overall 3% growth every year across all disciplines and there is some indication that this growth has accelerated even more in recent years (Ware & Mabe, 2015). This growth may also be due to an increase in the number of researchers overall (Ware & Mabe, 2015) and an increase in the number of journals publishing music psychology research. From our retrieved literature we found an overall growth rate of 11%, which is slightly higher than the overall average of 3% (Ware & Mabe, 2015).
The growth of music psychology is not only represented by our results but might also be evident in the amount of pop science articles published in recent years. For example, articles have been written for Psychology Today such as “Musical Preferences and the Brain” (Greenburg, 2017), op-eds in the New York Times such as “Why Music Makes Our Brain Sing” (Zatorre & Salimporr, 2013), and popular books such as This Is Your Brain On Music (Levitin, 2006) and Musicophilia: Tales of Music and the Brain (Sacks, 2007). Growth of interest in music psychology and its research, more specifically music and health research, may also be seen in the formation of the UK All-Party Parliamentary Group on Arts, Health and Wellbeing (APPGAHW) in 2014, which aims to improve awareness of the benefits that the arts can bring to health and wellbeing. This UK group uses the research findings from music psychology, and other related arts disciplines, to help inform policies. Future research could be done to investigate the subsequent effects of increases in publications on the number of popular science publications and on governmental policies. Understanding this could give better insight into the impact of music psychology research outside an academic audience.
Citation analysis
The retrieved documents received a total of 33,771 citations, with a mean of 16.17 (SD = 26.93) citations per document. This is relatively small compared to other related disciplines such as neuroscience, with 187 average citations per article, experimental psychology with 67, and clinical psychology with 68 (Patience, Patience, Blais, & Bertrand, 2017). However, compared to music research publications, which have an average of about seven citations per article, it is relatively higher (Patience et al., 2017).
Across the entire time period, the average number of citations did not increase significantly. However, we identified a significant inverted-U-shaped relationship between year of publication and average number of citations, with its highest peak in 2007, which received 1,978 citations. It is likely that the decrease in the average total citations observed in the last decade is due to the following two factors: an increase in the total number of publications emerging each year and in particular in this last decade; and a natural gap between the year of publication and year of first citation. Hancock and Price (2016) provided some evidence of this gap by examining the first citation speed for articles in Psychology of Music from 1973 and 2012. The authors found that the probability of an article receiving a first citation was .25 after 2 years, .50 after 4 years, and .75 after 7 years (Hancock & Price, 2016).
The publication that received the highest amount of citations was “Perception of Temporal Patterns” by Povel and Essens (1985), with a total of 364 citations and an average of 11.03 citations per year. When looking at the top 10 most-cited articles (Table 5a), we see that four out of the ten are about music and emotion and three are about investigating the temporal aspect of music. This may speak to the most-cited areas or sub-disciplines in the field of music psychology within these three journals. The author with the highest number of citations was John Sloboda, who received a total of 1,070 citations. John Sloboda is also known for his research in music and emotion, again emphasizing a key area of music psychology research over the years.
However, note that these results only cover articles published within three music-psychology-specific journals. For instance, we are not capturing articles published in neuroscience or general psychology journals that represent other sub-disciplines within music psychology. It is also important to mention that we only used the citation analysis provided in Scopus on April 20, 2018. The content of this database is frequently updated, therefore, the numbers reported here will likely change over time. Moreover, there are significant differences between the number of citations indexed in Scopus and other databases, such as Web of Knowledge and Google Scholar (Meho & Yang, 2007). While both Scopus and Web of Knowledge index mostly refereed journal articles, Google Scholar indexes refereed and non-refereed types of documents. In addition, citation counts in different databases rely strongly on the subject matter of the researcher (Meho & Yang, 2007), some subjects being more represented in one database than in another.
Although it was beyond the scope of this study, it would be interesting to carry out an analysis to understand different factors which may predict the number of citations a publication might receive. As predictors, one could use the total number of authors per document, gender of the author, affiliation, country, funding body, research area, and/or journal of publication. For instance, Patience, Patience, Blais, and Bertrand (2017) found that the citation rate correlates positively with the number of funding agencies that finance the research. This is a thought-provoking element we did not account for in the present study. The effect funding has on the dissemination and impact of certain research is known, but not within the field of music psychology specifically.
Authorship analysis
As noted, the magnitude of the increase in publications was higher in the publications with multiple authors and the collaboration index (CI) for multi-authored papers increased significantly over time.
This growth in the total number of authors and collaboration are not just a significant trend in music psychology but are observed in general scientific literature. The Economist (2016) found that in 34 million research papers published in peer-reviewed journals and conference proceedings between 1996 and 2015, the average number of authors per paper grew from 3.2 to 4.4. Many factors could be responsible for this growth. One reason could be the fact that research is becoming more multi- and interdisciplinary in general, which is particularly true in the case of music psychology. There is also a growing need for research teams to have different types of expertise and represent a variety of specialist perspectives. This is evident within the field of neuroscience, where the need for inter- and multidisciplinary research has been discussed (e.g., Quagilo et al., 2017, Waldman, 2013). Another reason may be due to authors wanting to “pad their publication lists” and the increasing institutional pressure to “publish or perish” (The Economist, 2016). Multi-authored papers help cut down the workload, resulting in more publications per author per year. Future research could investigate more systematically the reason for this increase and try to understand how this might affect the impact or rigor of published scientific research.
The visualization map also gives a good indication of the spread of collaboration happening both internationally and within specific domains. For example, the blue cluster in the network visualization (Figure 5) includes individuals from a range of sub-disciplines such as everyday uses of music, music perception and music and memory and is mostly comprised of UK researchers. This visualization helps to track how collaborations across different domains and areas may be carried or created by certain dominant individuals within the field.
Finally, when comparing our data set to Lotka’s theoretical distribution (Lotka, 1926), we found no significant differences between the observed and the theoretical distributions. Although expected, this is a clear indicator that the literature in music psychology conforms to Lotka’s law. That is, the distribution of the number of authors and their scientific productivity (i.e., number of publications) is highly asymmetric: While very few authors publish many articles, the remaining authors publish very few.
Country analysis
When looking specifically at the international collaborations and distributions of publications, we found that out of the total 49 countries contributing to the retrieved literature, the U.S. and the UK were the most productive countries, defined as having the highest number of publications (U.S. = 23% and UK = 16%) and citations (U.S. = 26% and UK = 18%). However, when country population is taken into account, it is Finland (15 per million persons) and Australia (8.1 per million persons) that have the highest publication productivity. By comparing the two maps side by side (Figure 6), the difference can be seen in countries such as the U.S., which, after accounting for population, seems less productive, and countries like Australia and Finland, become the most productive. The large differences in these two scenarios (when not considering country population and when considering it) bring to light the potential of misusing and misinterpreting bibliometric indicators.
The collaboration network map shows this predominance of the UK and the U.S. as well, but also shows how more countries collaborate with the UK, creating more international collaborations than with the U.S. This may have to do with the UK being within the wider EU and thus fostering more collaboration between countries. This prominence of research coming from the U.S. and the UK is not specific to music psychology. However, the full picture of nation productivity in music psychology looks different compared to the general picture. The world’s most research-intensive nations, measured by field-weighted citation impact are the UK, U.S., China, Japan, Germany, Italy, Canada and France (Kisjes, 2013). However, in our study the top eight most productive countries were the U.S., UK, Australia, Canada, Germany, Finland, France, and the Netherlands. The productivity of these countries may be related to certain funding opportunities, number of labs and number of teaching programs based in these countries. Future research could investigate how funding affects the geographical distribution of music psychology. It is important to think about which nation’s voices are being heard and which are the loudest within music psychology research. There is a limitation in knowledge if only a few nations are represented. Working towards creating opportunities in other countries for music psychology research and providing places for people to train could help disperse the distribution beyond Europe and the U.S.
Main conceptual language
The keywords that researchers used to describe their articles and how often they co-occur with others indicate the research trends and themes in music psychology. By selecting those keywords that occurred a minimum of 10 times we obtained a total of 75 keywords (Figure 8). The keywords “music” and “emotion” have the highest number of co-occurrences as well as connections with other keywords. This finding is in line with the general interest and significant increase in research on music and emotion (Eerola & Vuoskoski, 2013; Gabrielsson & Lindstrom, 2001; Juslin & Laukka, 2003; Västfjäll, 2001). While some keywords connect very well with others (e.g., memory, performance, preference), others are more disconnected (e.g., flow, cross-cultural, musical expertise). It is also interesting to see how a close group of keywords represent research areas. For instance, a clear research area is constituted by “timing”, “synchronization”, “rhythm”, and “meter”; another by “music therapy”, “stress”, “depression”, “individual differences”, and “personality”. In addition, the overlay map shows how keyword use changes over time. We can see that keywords such as “synchronization” and “timing” both co-occur and are prominently used in the early 2000s, whereas keywords such as “self-regulation”, “flow”, and “emotion regulation” appear more in recent publications. Overall, this network map allows us to summarize and better understand the complex field of music psychology in a single picture, but the applications of this visualization technique are far-reaching. We encourage researchers to use this tool to define unexplored research areas within music psychology as well as complement their literature reviews. Although this is the first published article that uses VOSviewer (Van Eck & Waltman, 2010) to create visualization network maps within music psychology, the software has been used in more than 500 publications since 2006 (www.vosviewer.com/publications).
Limitations of the study
The present study has two main limitations. First, we only included three journals in our analysis. This choice was based on the journals’ content and impact. The aim was to select the most prominent journals that specifically look at music psychology research. Moreover, we needed to use journals indexed in Scopus, as we used this database to retrieve the literature (e.g., the journals of Psychomusicology: Music, Mind, and Brain and Music & Science are not indexed in Scopus). This is an important limitation for two reasons. Firstly, these journals are all predominantly English language journals, creating automatically a bias in the types of publications included and researchers represented. Secondly, high-quality research on music psychology is published in a wide range of journals from a wide variety of disciplines, including experimental psychology, social psychology, clinical psychology, computer science, marketing and advertising, personality, and neuroscience. Thus, our study only examines a fraction of the total number of music psychology research publications and our conclusions can then only be drawn from this fraction of literature. It also means that some authors that do not appear as relevant in this dataset might actually be very influential in general.
Furthermore, it is likely that authors working in psychology departments or medical and neuroscience contexts often prefer to publish in mainstream generic journals (e.g., Journal of Experimental Psychology, Journal of Cognitive Neuroscience) rather than specialist music psychology journals. These generic journals have a higher impact compared to the specialist journals covered in the current study. Therefore, when researchers aim to disseminate their work in the most influential and prestigious journals, they might be encouraged to choose generic over specialist journals. Future research could broaden the scope of the present study by conducting a bibliometric analysis covering music psychology literature in other journals, including generic journals in general psychology, behavioral sciences, medicine, and neuroscience.
The second main limitation relies on the use of Scopus to retrieve the literature, including the citation analysis. This limitation is inherent to any bibliometric study using similar search strategies. Even though Scopus is the largest existing database (Falagas et al., 2008), it is not a complete record of all published literature, due to licensing. For example, articles from Music Perception between 2002 and 2004 are missing in Scopus. In addition, when performing databases searches, there is a potential for false positive and false negative results; and the number of citations differ depending on the database (Meho & Yang, 2007). Finally, some authors might have more than one name or different name spelling, which might have caused inaccuracies in the result. Although no ideal solution exists to this problem, we reduced its potential negative impact at the minimal level by deleting the second initials from all authors’ names in the retrieved dataset, including only the first surname and the first initial. We hope that the limitations of the current study are justified by the benefits of using large-scale computational bibliometric analysis.
Conclusion
The study reported here begins to investigate the general research trends, reach, and gaps within the published literature in three prominent music psychology journals. Using bibliometric techniques to visualize and understanding the past and present of research in music psychology leads us to critical observations and conclusions, opening many interesting avenues for future collaborations and research in the field.
More international collaboration outside of Europe and the U.S. should be pursued, allowing for different types of questions, methods and potential findings, steering our field away from WEIRD (Westernized, educated, industrialized, rich, and democratic) populations (Henrich, Heine, & Norenzayan, 2010). Future studies should be done to investigate potential predictors of music psychology research citations. Understanding how the system around music psychology research, its funding schemes, organizations and institutions, and the influence of certain individuals and countries impact the dissemination and academic impact of music psychology research could shed light on how the system is working and potential ways to improve it. Finally, future research should continue investigating the wider impact of music psychology research on the general public and policies. The need for efficient measurements of scientific collaboration and research impact is becoming more important. Using similar large-scale computational analysis allows for these questions to be more objectively addressed.
Music psychology is still a relatively young field. Taking the time to systematically look back and reflect on how the field has progressed, which this study has only just begun to do, helps push the field forward in new and exciting directions. More research, using similar methods, should be done giving insight into the past, present and future of music psychology research.
Supplemental material
Supplemental Material, Data.Scopus_3.journals - Visualizing Music Psychology: A Bibliometric Analysis of Psychology of Music, Music Perception, and Musicae Scientiae from 1973 to 2017
Supplemental Material, Data.Scopus_3.journals for Visualizing Music Psychology: A Bibliometric Analysis of Psychology of Music, Music Perception, and Musicae Scientiae from 1973 to 2017 by Manuel Anglada-Tort and Katie Rose M. Sanfilippo in Music & Science
Supplemental material
Supplemental_Material_APPENDIX - Visualizing Music Psychology: A Bibliometric Analysis of Psychology of Music, Music Perception, and Musicae Scientiae from 1973 to 2017
Supplemental_Material_APPENDIX for Visualizing Music Psychology: A Bibliometric Analysis of Psychology of Music, Music Perception, and Musicae Scientiae from 1973 to 2017 by Manuel Anglada-Tort and Katie Rose M. Sanfilippo in Music & Science
Footnotes
Acknowledgement
The authors would like to thank Professor Lauren Stewart, Peter Harrison, Tabitha Trahan, Haia Ironside, and Kai Mueller for constructive criticism of the manuscript.
Author contribution
MAT conceived of the idea and the analysis strategy for the study. All other aspects of the research were done collaboratively by MAT and KRMS.
Declaration of conflicting interests
The author declared no potential conflicts of interest with respect to the research, authorship, and/or publication of this article.
Funding
The author disclosed receipt of the following financial support for the research, authorship, and/or publication of this article: This work was supported by a PhD studentship from the “Studienstiftung des Deutschen Volkes” (Bonn, Germany), awarded to Manuel Anglada-Tort.
Peer review
Graham Welch, University College London, Institute of Education.
John Sloboda, Guildhall School of Music and Drama. One anonymous reviewer.
Supplemental material
Supplemental material for this article is available online.
References
Supplementary Material
Please find the following supplemental material available below.
For Open Access articles published under a Creative Commons License, all supplemental material carries the same license as the article it is associated with.
For non-Open Access articles published, all supplemental material carries a non-exclusive license, and permission requests for re-use of supplemental material or any part of supplemental material shall be sent directly to the copyright owner as specified in the copyright notice associated with the article.