
Abstract
Tempo of music performance is often accelerated irrespective of players’ intention. Though the characteristics of the tempo deviation phenomenon have been investigated using a finger-tapping task, most such studies dealt with tapping with a fixed interval and intensity; few studies considered the effects of rhythm and accent, both important factors of music performance. Here, we asked how different rhythm and accent patterns affected the tempo-keeping property using a synchronization-continuation task paradigm: Participants were asked to keep tapping with reproducing the given rhythm/accent patterns designated by the target tones. Tapping tempo was significantly deviated depending on rhythm/accent patterns, but their magnitudes were only several percent in 150 s, much smaller than those in real music performance. We also ran experiments in the conditions that participants need not reproduce the accent patterns but only response tones were accented. These auditory modulations affected the tempo deviation, implying that perceptual processes induced by the auditory feedback also influence the tempo maintenance. Inter-tap intervals (ITIs) were modulated by the accent pattern, but no clear relationship was observed between ITI fluctuations and long-term tempo deviation, suggesting that different mechanisms are involved. In sum, the present finding shows that non-uniform motor actions required for music articulation can disturb the long-term tempo maintenance but their effect is rather small. We also reported the tempo deviation when the response tone was modulated by loudness (crescendo vs. diminuendo) or pitch (ascending vs. descending).
Background
Tempo of music performance can vary within a single piece of music: Musicians may voluntarily change the tempo as music expression (“artistic deviation”) (Drake, 1968; Gabrielsson, 1974; Povel, 1977; Seashore, 1938). On the other hand, tempo also deviates against the musicians’ intention: the tempo is often accelerated even if the players want to maintain tempo, especially for untrained musicians.
Such tempo acceleration (called “rushing”) has been long pointed out in the field of the music pedagogy (Allingham & Wöllner, 2022; Killian, 1985; Kuhn, 1977; Kuhn & Gates, 1975; Mito & Murao, 2000; Okano et al., 2017). For example, Mito and Murao (2000) investigated this phenomenon in a piano performance. They made 16 school-child pianists (age: 9–11 years old) play a short piece (Bayly's “Long Long Ago”) at three tempos and found that average bar length monotonically decreased (i.e., the tempo was accelerated) during the performance. In the 70-bpm (beat-per-minute) condition, especially, the average bar length in the 15th bar reached 85% of the original duration though the tempo was only slightly accelerated in the 130-bpm condition.
The characteristics of tempo deviation have been investigated in the laboratory experiment using a finger-tapping task (Collyer et al., 1992, 1994; Repp, 2005a, 2005b; Repp & Su, 2013; Stevens, 1886). In most of these studies, participants were asked to push a key switch in sync with a metronome for a while and to continue the key push with keeping the designated tempo after the metronome was stopped (synchronization-continuation paradigm; see Figure 1(a)). For example, Collyer and his colleagues (Collyer et al., 1992) examined the tempo-keeping ability in 27 tempo conditions (tapping interval 175–825 ms; 73–343 bpm), and reported that there were regions in which the tempo was apt to be accelerated and those in which the tempo was apt to be slowed. Specifically, tapping tended to be accelerated if the inter-tap interval (ITI) was in the range of 250–413 ms (145–240 bpm) but to be slowed in the range of 513–748 ms (80−117 bpm). In a subsequent study (Collyer et al., 1994), they replicated the result and also showed that preferred tapping tempo was distributed around 272 ms and 450 ms. Based on these results, they argued the existence of some discrete mechanism in the interval generation process in human brain (“oscillator signature”).
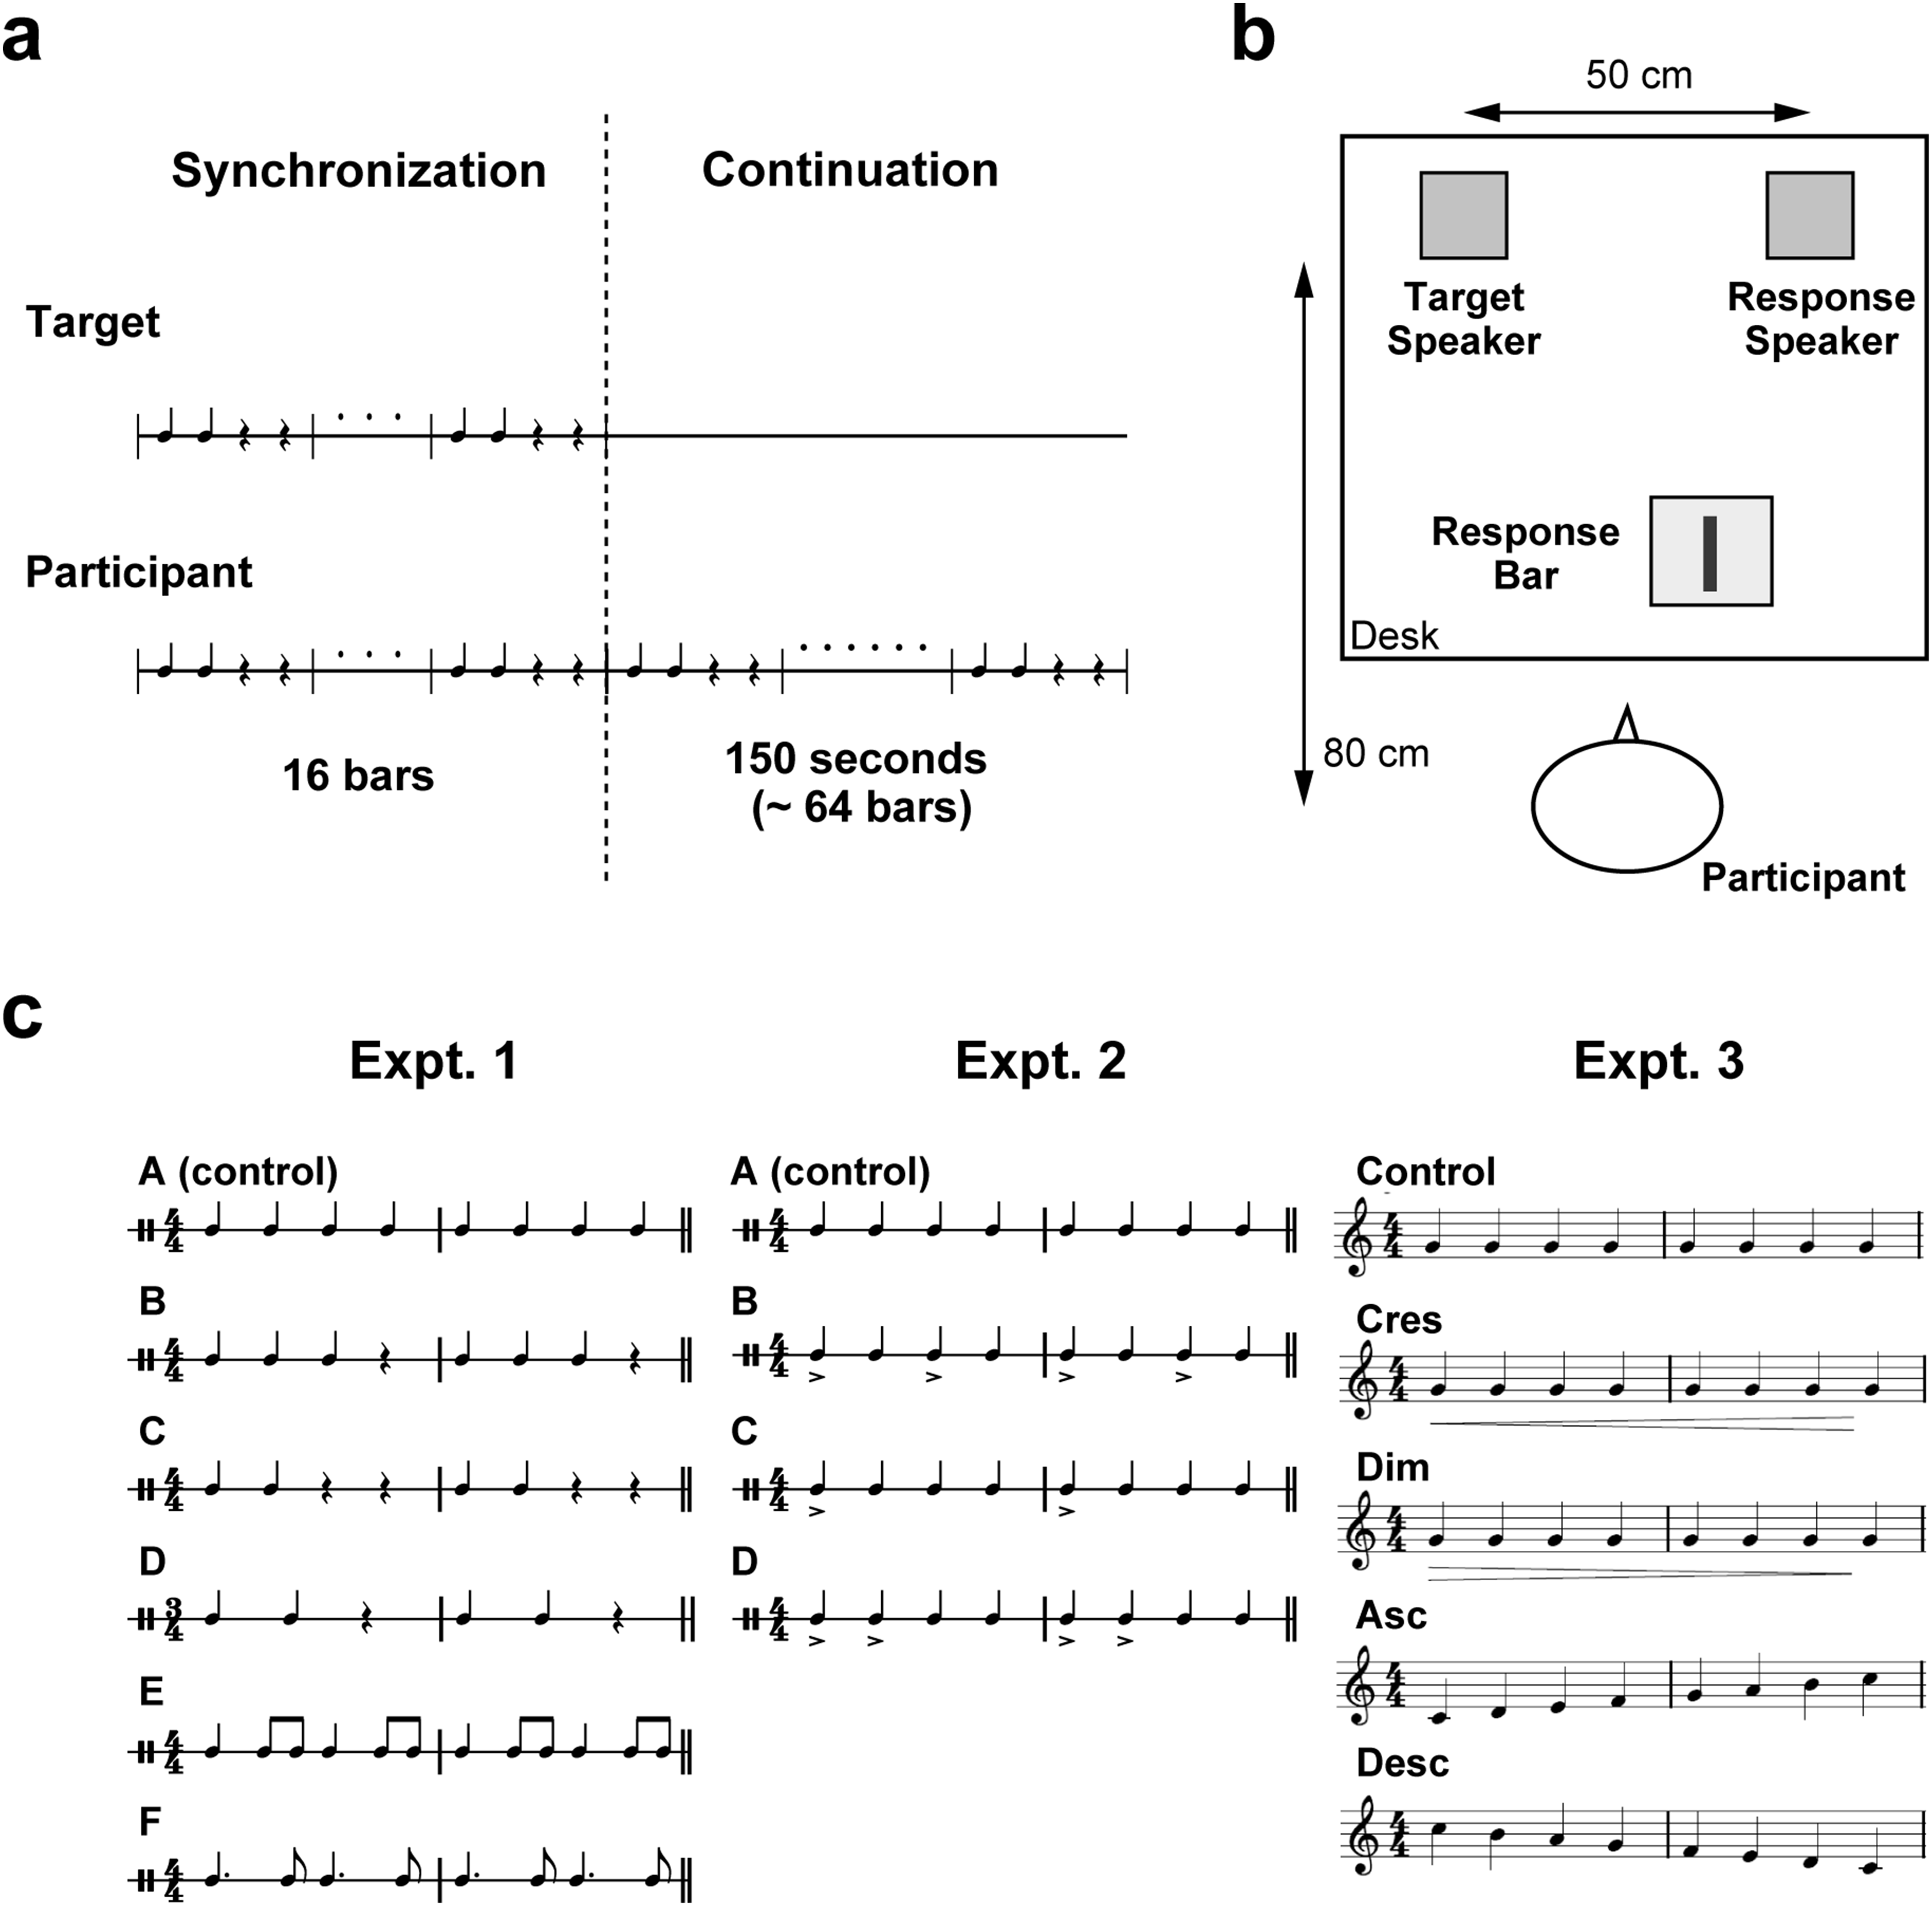
Experimental settings. (a) Participants performed a finger-tapping in sync with the target tones for a while and continued the tapping with the same tempo and rhythm/accent pattern after the target tones were terminated (synchronization-continuation paradigm). (b) Experimental setup. Participants were seated in front of a desk on which a response bar and two loudspeakers were placed and asked to tap on the front portion of the response bar with their right index finger. One of the speakers (“target speaker”) presented target tones while the other speaker (“response speaker”) presented response tones which was generated by the finger tap. The speakers were placed symmetrically 80 cm in front of the participants, 50 cm apart from each other. (c) In Experiment 1, the target tones with six different rhythms (A–F) were presented and participants were asked to reproduce these rhythms by finger tapping. In Experiment 2, three accent patterns (B–D), besides the non-accent pattern (A), were presented. There were two conditions for the response tone: In one condition (“automatic”), the sound intensities of the response tones were automatically determined by the experiment program irrespective of the participant's actual tapping strength. In the other condition (“manual”), the intensities of the response tones reflected the tapping strength and participants should reproduce the accent pattern by themselves. In Experiment 3, the target and response tones were modulated either in loudness (Cres and Dim) or in pitch (Asc and Desc), where the response tones were determined by the experiment program as in the automatic condition of Experiment 2.
Therefore, the tempo of long-term tapping tends to approach one's preferred tempo even when the original tempo is externally determined. Preferred tempo is closely related to the spontaneous motor tempo (SMT), which is determined by the most comfortable and natural rate of tapping (Drake & Palmer, 2000; Fraisse, 1982), and the spontaneous production rate (SPR) of music performance (Pfordresher et al., 2021; Zamm et al., 2018). Tempo of continued tapping shifted to one's SMT (McAuley et al., 2006), and pianists’ tempo drifted during trials at other rates showed bias toward their SPR (Zamm et al., 2018). Fraisse (1982) wrote that typical SMT was 600 ms (100 bpm) but there was considerable individual variation ranging from 200 ms to 1400 ms. Moreover, recent studies have shown that SMT depends on various individual parameters, such as age (McAuley et al., 2006), time of the day (Hammerschmidt et al., 2021; Moussay et al., 2002), musical experience (Drake et al., 2000; Hammerschmidt et al., 2021), and the physical property of the body parts (Peckel et al., 2014) (but see a negative result in Rose et al., 2021). On the other hand, within-individual variation in SMT is rather small; SMT changes about 3–5% within an experimental trial (Fraisse, 1982).
Although the neural mechanism of this tempo deviation is still unclear, several researchers proposed its theoretical models, whose basic assumption is that some internal clock exists in the brain and its period fluctuates stochastically with drifting slowly (Collier & Ogden, 2004; Ogden & Collier, 2002). Conventionally, it was postulated that the source of tempo variation is the fluctuations of the central clock and/or those of motor command production triggered by the central clock (Wing & Kristofferson, 1973a, 1973b). However, these models cannot explain the trended acceleration observed in music performance, and a different mathematical model was proposed that introduced an explicit trend property to the central clock (Ogden & Collier, 2002). Most these models are based on the interval timer view, where periodic pulses generated by a pacemaker is the basis of timing process, but another model based on the entrainment view has been proposed which assumes the existence of a self-sustaining oscillator or set of such oscillators (McAuley & Jones, 2003). The former model realizes various time-related functions by counting and manipulating the number of periodic pulses while the latter model functions by adjusting the cycle and phase of the oscillator. McAuley and Jones (2003) proposed a theoretical framework for explaining empirical findings referring to these models. Moreover, dynamic attending theory (Jones, 1976, 1987), which was based on the entrainment view, explained the cognitive process for temporal processing by the mechanism of shifting focal attention between different period levels, and Drake et al. (2000) applied this theory to explain the effect of age to SMT. In sum, it has been broadly accepted that the central clock is the basis of SMT/SPR and the interaction between the central clock and physical dynamics is also involved (Loehr & Palmer, 2007; Peckel et al., 2014). A recent study showed that a network model with Hebbian plasticity can explain the process how the tempo of music performance drifts toward the musician's SMT (Roman et al., 2023). Moreover, various computational models based on Bayesian inference (e.g., Cannon, 2021), predictive coding (e.g., Vuust & Witek, 2014), and neural resonance (e.g., Kim & Large, 2015) have been proposed to explain human rhythm and temporal perception (see Large et al., 2023 for review).
Therefore, the tempo deviation characteristics of tapping have been examined from both experimental and theoretical viewpoints. Most these studies dealt with a tapping task with a fixed interval except for a few studies (Drake, 1968; Kuhn, 1977). It is sure that periodical (i.e., regular-interval) motor action is one of human fundamental activities such as walking and sucking of new-born babies (Fraisse, 1982). However, musicians scarcely make sounds at a fixed interval and intensity; they usually produce sounds with rhythms, accents, and other articulations (Boltz, 1998; Krampe et al., 2000) even though the timing frame (or meter structure) is maintained, and this inhomogeneity in motor actions may be a factor in the long-term tempo deviation.
There are some findings on the relationship between the tempo and articulation. Musicians often spontaneously lengthen the intense sound presumably due to functional/perceptual equivalence between the duration and the strength (Fraisse, 1982). Moreover, a tapping interval preceding the accent was shortened but lengthened immediately after the accent, regardless of whether the target metronome tones were present or absent (Billon et al., 1996; Billon & Semjen, 1995; Keele et al., 1987; Semjen & Garcia-Colera, 1986). It was also argued that the internal clock did not trigger motor initiation but rather provide the target time point at which finger movement brought its behavioral goal (endpoint programming model; see also Shaffer (1982)) and that the timing distortions were likely to reflect both central (i.e., internal clock) and peripheral (i.e., motor execution) components (Billon et al., 1996). This suggests a possibility that sensorimotor process for generating non-uniform motor actions may facilitate the drift of internal clock, resulting in trended tempo deviation.
In addition, we should not forget a possibility that the auditory perceptual factors may be related to the tempo deviation. Generally, there is correlation between the tempo, loudness, and pitch in music performance (Eitan & Granot, 2006; Eitan & Timmers, 2010; Friberg et al., 2006; Granot & Eitan, 2011), and tempo perception is affected by musical articulations. For example, tempo judgement was affected by articulation (staccato and legato) (Geringer et al., 2006, 2007). Judgement of temporal intervals was disturbed by accents (Tekman, 1997), and time required for perceiving tempo change was affected by the rhythm pattern and beat location (Wang, 1984). It was also shown that tempo sensitivity was impaired with irregular rhythms compared to regular rhythm (Drake & Botte, 1993). When the tone intervals were shortened by half (e.g., change from four quarter notes to eight 8th notes) people perceived as if the tempo was slowed (“divided time illusion”) (Repp, 2008; Repp & Bruttomesso, 2009; Repp & Ladiges, 2012). Therefore, if trying to maintain the tempo at such changes, people would accelerate the tapping so as to maintain the perceptual tempo. This transient tempo change effect was actually observed both in a laboratory experiment (Repp, 2008) and in actual piano performance (Repp & Bruttomesso, 2009). Moreover, pitch (tone height) change also affects tempo perception. Tones with a higher pitch were rated faster than those with a lower pitch, and ascending tone sequences were rated faster and as speeding up more than descending sequences (Collier & Hubbard, 1998). Tone sequences containing a larger number of changes in pitch direction and a greater magnitude of pitch skips were judged to unfold more slowly (Boltz, 1998). Boltz (2011) also showed that the tempo was judged faster when displaying a higher pitch and/or a brighter timbre, and when the melody increased in pitch and/or loudness over time. Similarly, perception of a duration was altered by pitch variations as small as a quarter of a semitone (Pfeuty & Peretz, 2010) and different pitch levels of flanker tones influenced the perceived duration (Lake et al., 2014). As mentioned above, the tapping tempo was adjusted to maintain the perceived tempo under such a modulation of time perception. Actually, pitch contour modulated the tempo of the finger tapping (Ammirante et al., 2011). In an air-tapping task, the tapping frequency (i.e., tempo) was affected by accent patterns of feedback tones (Bouvet et al., 2020). Therefore, auditory factors surely affect the tapping tempo. On the other hand, above findings mainly demonstrated transient or local effects and did not show their effects on the long-term tempo change.
To clarify whether the uneven motor actions required for musical articulation are a significant factor in the unintentional tempo deviation, here we examine the effect of rhythm and accent patterns on the long-term tempo-keeping property of a finger-tapping task. We also ask the effect of accents, dynamics (i.e., crescendo and diminuendo), and pitch contour (i.e., ascending scale and descending scale) of the response tones where participants need not reproduce these patterns but only response tones were modulated, to reveal perceptual factors in the long-term tempo deviation. Unintentional tempo deviation is mainly observed with untrained musicians, whereas skilled musicians can freely control tempo as a means of musical expression. Therefore, we conducted experiments with participants who had not received professional music education.
Methods
Participants
We ran three experiments, and 28 (age: 19–60, 18 males and 10 females), 18 (age: 19–60, 10 males and 8 females), and 15 (age: 19–60, 9 males and 6 females) graduate/undergraduate students and members of staff of the University of Electro-Communications took part in Experiments 1, 2, and 3, respectively. They were paid 1,200 Japanese Yen for each experimental session.
Apparatus
The experiment was conducted in a quiet laboratory room. Participants were seated at a desk on which a response bar and two loudspeakers (“target speaker” and “response speaker”) were placed (Figure 1(b)). The speakers were located symmetrically 80 cm in front of the participant. Note that the interaural temporal difference is negligible in this setting. The experimental system was originally designed and built with Arduino-based micro-controllers (Arduino MKR Zero) to minimize the delays of data acquisition and signal processing. We adopted a force sensor bar to monitor the force imposed by the finger tapping. This sensor had a rod shape with a size of 12 × 12 × 80 mm and was equipped with a strain gauge that measured the force applied to the front portion of the rod. Note that the response bar was rigid and did not move down when it was tapped on: It monitored the temporal force pattern, unlike a standard response key which monitors the key stroke motion. The output of the sensor was amplified and collected by the micro-controller with a sampling rate of 320 Hz (i.e., sampling interval was 3.125 ms). When the force signal exceeded a given threshold, the system treated it as a tapping event and generated a tone (sinusoidal wave of the pitch G5 (783 Hz) in most conditions; duration 50 ms, tapered) from the response speaker. Specifically, the micro-controller generated a signal for the sound to the speaker through a digital amplifier at a sampling rate of 8 KHz. The amplitude of the signal waveform was fixed in Experiment 1 but was linearly amplified as a function of force amplitude in Experiments 2 and 3 (see Design and Procedure for details). Delay from the force onset to the tone onset was 13–17 ms as the micro-controller judged the tapping event and force strength using four consecutive samples. This delay is short enough that the response tone was perceived as integral to the tapping (i.e., response tone was perceived at the same time of tapping action). Raw force data and tone timing/amplitude data were transferred from the micro-controller to a PC (operated by Windows 10 Pro) through a USB interface. The target tones (sinusoidal wave of the pitch C5 (523 Hz); duration 50 ms, tapered) were generated by another micro-controller and presented by the target speaker. Although the sound pressure levels of the target/response tones were not measured, the experimenter adjusted their loudness so that both tones and their changes in intensity could be easily perceived. Some may suspect that the target and response tones (C5 vs. G5) are hard to separate due to their consonance, but participants could dissociate them without difficulty because the response tones were synchronized with their own responses and because they were generated by different speakers.
Design
Figure 1(c) summarizes the experimental conditions in three experiments. In all experiments, we included the control condition where the participants were asked to perform finger tapping with regular intervals (no explicit instruction was given on the tapping strength). Experiment 1 focused on the effect of the rhythm: Six rhythm conditions were examined. Condition A is the control condition which requires regular tapping. Condition B is the repetition of the set of three taps and one rest, and we examined the effect of a rest (i.e., inhibiting the tapping action) within a 4-beat meter. Condition C is the repetition of the set of two taps and two rests, asking about the effect of two consecutive rests. Condition D is the repetition of the set of two taps and one rest, again asking about the effect of a rest but within a 3-beat metric structure. Conditions E and F include half-length intervals and dotted rhythm and ask about their effects. Two points should be noted here. First, participants did not hold the bar press over the note length indicated in Figure 1(c) but moved the finger up immediately after tapping the bar. Second, Conditions E and F can be regarded as the double-speed version of conditions B and C, respectively, if we ignore the metric structure. We do not know how individual participants perceived the metric structure during the task, but we think that most participants treated them as different rhythm patterns without noticing the double-speed relationship.
Experiment 2 focused on the effect of accent. We prepared three accent patterns B, C, and D (except for the control condition A). In condition B, participants performed accented and unaccented taps, alternately (this can be regarded as either accenting the first beat of a 2-beat meter (i.e., front beat), accenting the second beat (i.e., back beat), or some others). In condition C, on the other hand, accents were placed once every four taps, which could be presumably interpreted as accenting the first beat of a 4-beat meter (other interpretations are also possible). These conditions were designed to examine the effect of different metric structure in addition to the effect of non-uniform tapping actions. In condition D, two accents and two non-accents were placed alternately, which asked the effect of two consecutive accents (This pattern can be interpreted as either “accent, accent, non-accent, non-accent” or “accent, non-accent, non-accent, accent”). The participants performed these accented tapping in two conditions (“automatic” and “manual”). In the automatic condition, the intensity of the response tones was modulated automatically by the pre-determined ratio irrespective of the actual tapping strength. Specifically, the ratio of the waveform amplitudes of the non-accented and accented tones was 1:4, and this was the same for the target tones. In the manual condition, to the contrary, the participants were asked to reproduce the accent pattern of the response tones manually by controlling the tapping strength by themselves: The amplitude of the response tone waveform increased linearly with the tapping force, as mentioned above.
Experiment 3 focused on the effect of dynamics and pitch pattern. We prepared the crescendo and diminuendo patterns for dynamics and the ascending and descending scales (1 octave) for the pitch contour. Some may suspect that repetition of these simple loudness/pitch patterns are artificial and rarely used in real music. Actually, some researchers used more sophisticated tone sequences for experiments (e.g., Granot & Eitan, 2011). However, we adopted them because they were simple and repeatable for a long time, and at least, they were not unpleasant tone sequences. Dynamics and pitch were given by the pre-determined pattern as in the automatic condition of Experiment 2 (no manual condition in Experiment 3). The ratio of the waveform amplitudes of eight tones in the crescendo condition was 2:3:5:7:10:13:16:20 (and the reverse order in the diminuendo condition). In the pitch conditions, the pitch of the target and response tones were identical (from C5 to C6), different from the other conditions (C5 vs. G5).
Procedure
We adopted a synchronization-continuation paradigm as in the conventional studies. Participants performed finger tapping in sync with the target tones for a while and continued the tapping with the same tempo and rhythm/accent pattern after the target beats were terminated (Figure 1(a)). In the experiment, the tempo was fixed to 132 bpm (beat interval was 455 ms) because it was reported that tempo was almost maintained in the range of 117 and 145 bpm (Collyer et al., 1992) and the target tempo was within the typical range of SMT/SPR (400–600 ms). The length of the synchronization phase was 16 bars (64 taps in the regular tapping condition; about 29 s), and that of the continuation phase was 150 s (about 300 taps for regular tapping).
For every condition, participants performed familiarization trials after receiving the explanation on the task. No musical score (as in Figure 1(c)) was shown so that the participants would not have preconceived notions on the grouping of the taps. They repeated familiarization trials until they felt familiarized enough to the task. Then, they performed formal trials twice. Typically, it took about 7–8 min for each condition (including familiarization and formal trials). They repeated the same procedure for 6, 7, and 5 conditions in Experiments 1, 2, and 3, respectively. We left some rest period between successive trials. All participants performed the task in all conditions in each experiment. The order of the experimental conditions was not counterbalanced but the same for all participants (according to the order shown in Figure 1). Each experiment took about one hour to complete.
Although the primary requirement of the task was to maintain the tempo of the finger tapping in all three experiments, some minor points were different between them. In Experiment 1, participants were simply asked to keep the tempo and rhythm, and this was the same in the control conditions of Experiments 2 and 3. In the automatic condition of Experiment 2, the participants were told that they should keep the tapping tempo and need not care about the tapping strength because the response tones were automatically accented by the experimental program. In the manual condition of Experiment 2, on the other hand, they were instructed to keep the tempo while also reproducing the accent pattern by adjusting the tapping strength by themselves. All participants performed the trials in the automatic condition prior to the manual condition (i.e., not counterbalanced) so that the influence of force adjustment in the manual condition did not interfere with the tapping in the automatic condition. The instructions for Experiment 3 were the same as the automatic condition of Experiment 2 since the intensity and pitch of the response tones were automatically determined.
After finishing all tasks, participants were given a short questionnaire asking their musical experience and subjective impressions in performing the experimental tasks.
Data Analysis
Data from all participants were pooled for statistical analysis unless otherwise noted. Data processing and statistical analysis were performed using Matlab software (Mathworks, U.S.A.).
We first extracted ITIs from the raw data and segmented them to a bar unit to calculate the bar length. We manually corrected the bar length or treated as missing data when expected tapping events were missed. We then calculated the percent change in bar length for each bar using the following formula:

Results
Experiment 1
Only 15 out of 28 participants accomplished the task in all conditions. The remaining participants could not maintain the correct rhythm in conditions D, E, and/or F (especially in condition D). We will discuss this point in Discussion section. In addition, one of the 15 participants who accomplished the task showed a quite large variability (standard deviation (SD) was 65.5 ms) of the difference between successive ITIs in the control condition, compared to the other participants (SDs were 24.7–41.8 ms). Thus, we discarded data from these participants and adopted the data from 14 participants (i.e., 28 trials) for further analysis.
Figure 2 shows two examples (conditions A and C) of temporal change in the bar length. The vertical axis shows percent change in the bar length relative to the original bar length, where a bar is defined as in Figure 1(c). In each panel, thin gray curves show the results of individual trials, and a thick red curve shows the moving average (over 7 bars) of their average. Two thin red curves indicate the range of standard error.

Temporal change in bar length in Experiment 1. This figure shows two examples (conditions A and C) of temporal change in the relative bar length (i.e., the sum of ITIs of a group of taps within a bar relative to that of the target tones), where 0% means that the tapping tempo was the same as the target tempo. The origin of the horizontal axis is the onset of the continuation phase. Thin gray curves: individual trials; thick red curve: moving average (over 7 bars) of inter-trial average; thin red curve: region of mean ± standard error. Note that in condition C, plots disappear around the 60th bar because some trials did not reach the 60th bar during the 150-s continuation phase as their tempos were greatly decelerated.
Two characteristic points can be found in these plots. First, the average bar length showed different long-term trends between two conditions though the bar length of individual trials fluctuated every bar. Specifically, the average bar length decreased uniformly (i.e., accelerating trend) over the continuation phase in condition A, but was almost flat in condition C. Second, the average bar length increased transiently just after switching from the synchronization phase to the continuation phase in condition C, but not in condition A.
To quantify the magnitude of the tempo deviation in the continuation phase, we performed a regression analysis on the temporal change of relative bar length. Concretely, we estimated the slope and intercept of a regression line for percent change data (Figure 2) for each trial, where the slope represents the long-term trend and the intercept represents the transient change just after the phase switch. Figure 3 summarizes the estimated slopes and intercepts in six conditions. Here, the bars represent inter-trial median values while dots represent the values in individual trials. Note that the estimated slope in condition D was multiplied by 4/3 (because there were only three taps in a bar in this condition, but four taps in the other conditions) so that the estimated slopes can be compared across conditions. There are three points to note. First, slopes of individual trials were spread over a wide range, meaning that there were substantial individual differences: No rhythm condition seemingly had a consistent accelerating/decelerating effect common to all participants. Second, however, the median slopes were apparently negative in conditions A, D, and E, indicating that as an ensemble, the tapping tempo tended to be faster in these conditions. Third, the median intercepts were positive in conditions B, C, and F, but not in the other conditions. This means that the effect of the phase switch (or target tone removal) was observed in limited conditions.
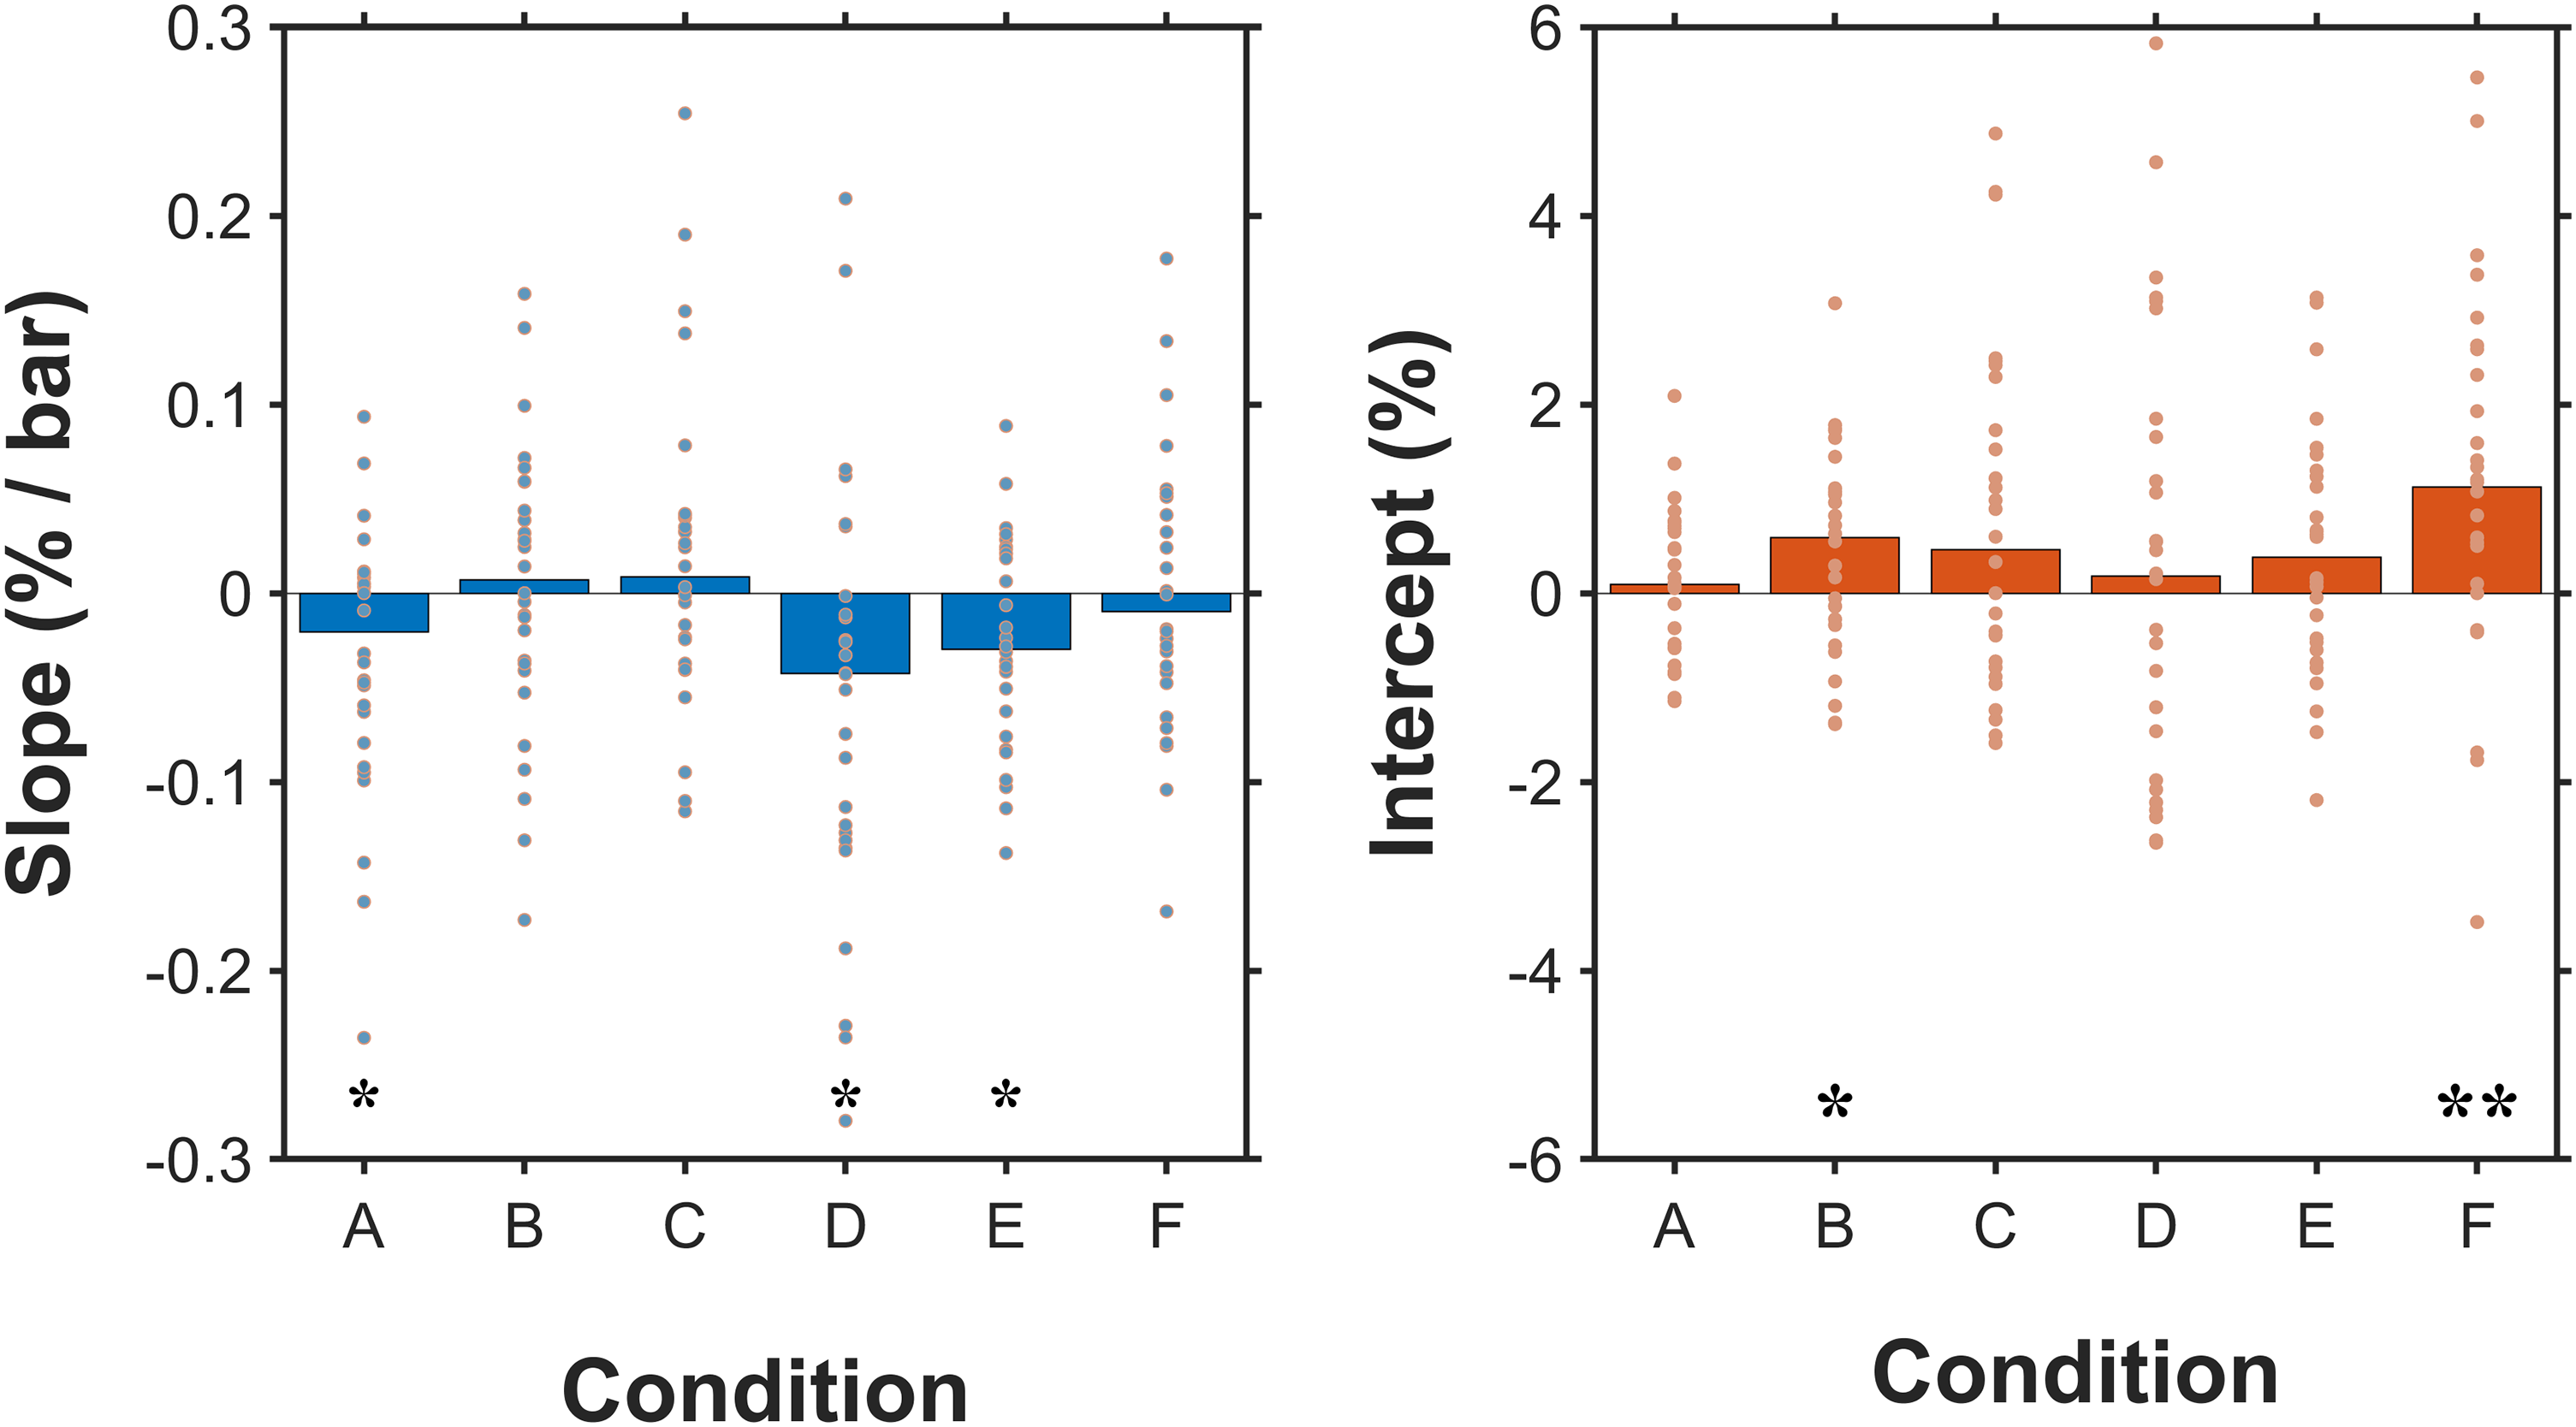
Result of regression analysis of temporal change in bar length. This figure summarizes the slopes and intercepts of the regression lines for the relative bar length during the continuation phase (see Figure 2). The slope reflects the long-term tempo deviation while the intercept represents the transient tempo change after the onset of the continuation phase. Dots and bars represent the values of individual trials and their medians, respectively. Asterisks indicate the statistical significance.
We ran statistical tests on above observations. We adopted non-parametric tests because the data did not apparently obey normal distributions as in Figure 3. A Wilcoxon signed-rank test showed that the slope was significantly different from zero in conditions A (
We have pointed out substantial inter-trial variabilities in Figures 2 and 3. As mentioned in the Background section, the tempo-keeping ability varies from person to person due to various factors including music experience. Given that skilled musicians are plausibly less affected by rhythm patterns, the effect of rhythm may be more pronounced and consistent for the participants who showed greater variance between different rhythm conditions. To further examine this point, and without a measure of the participants’ musical experience, we divided the participants into two groups, “stable” and “variable”, according to the SD of the slopes in different trials. Figure 4(a) shows the slopes for individual participants, where the horizontal axis indicates the participants in order of increase in the SD across trials. Each dot indicates the slope of one trial (note that there are two dots for one rhythm condition because two trials were performed for one condition). We classified half of the participants with smaller SDs into the stable group (SD: 0.032–0.070%/bar) and the remaining participants into the variable group (SD: 0.070–0.131%/bar). Note that stable participants did not necessarily maintain the tempo: The estimated slopes were distributed symmetrically around zero for Participants #1 and #2, but those of Participants #4 and #8 were distributed mainly over zero, meaning that they generally tended to decelerate the tempo. Similarly, other participants also showed their own acceleration/deceleration tendencies. Therefore, the ability to maintain long-term tempo depended on individual participants.

Long-term tempo deviation in Experiment 1. (a) This panel shows the slopes in different trials for each participant. The horizontal axis indicates the participants in order of increase of the standard deviation of slopes in different trials. Some participants showed similar slopes regardless of different trials (or conditions) while other participants showed large variability across trials. We divided the participants into two groups, “stable” and “variable,” according to the size of standard deviation. (b) Relative slopes in conditions B–E (i.e., difference between the slopes in a specific condition and control condition A) are shown separately for the sable and variable groups. The bars represent the median slopes across participants and the dots represent the slopes of individual participants. Data show a mostly similar tendency between the two groups, and thus, we ran statistical tests on the pooled data. Asterisks indicate the statistical significance for the pooled data.
Our primary question is the effect of rhythm patterns on the long-term tempo deviation, and thus we should examine the relative tempo deviation to the control condition. We calculated the relative slope in conditions B–F, that is, the difference between the slopes in conditions B–F and that in the control condition A. Figure 4(b) summarizes the relative slopes separately for the stable and variable groups, where the bars represent the median slopes across participants and the dots represent the slopes of individual participants. It is difficult to point out any clear features because of a small number of data and their large variability, but there seems to be little difference between the distributions of two groups’ data except for their variabilities. If anything, the relative slope was generally close to zero for the stable group whilst the median slope was positive in conditions B and C for the variable group.
We tested these observations using a signed-rank test. For the variable group, the relative slope was only close to significant in condition C (p = 0.0781). For the stable group, on the other hand, the relative slope was significant in conditions B (p < 0.05) and D (p < 0.05). Therefore, contrary to our expectation, we failed to find a more significant effect of rhythm patterns in the variable group. Low statistical significance of the variable group may be partly due to its high variability between participants, but it is also true that no clear difference can be found between different conditions: Presumably, large inter-trial variability of the variable group is simply due to individual differences rather than effects of different rhythms. Therefore, we will no longer treat the data separately for the two groups, but will treat all the data together. A signed-rank test for the pooled data showed that the relative slope was significant in condition B (p < 0.05) and borderline significant in condition C (p = 0.0580) (note that asterisks in Figure 4(b) indicates the statistical significance for the pooled data). This means that one or two rests within a 4-beat meter had a significant effect on causing long-term acceleration, but half-length intervals and dotted rhythms had little effect.
Experiment 2
Three out of 18 participants did not perform the task properly: Two did not follow the accent pattern instructions faithfully, and one tended to keep touching (or pressing) the response bar after tapping it. Another participant gave large variance of difference of successive ITIs (SD was 51.4 ms).Thus, we discarded their data and used the data from 14 participants for further analysis.
Figure 5(a) summarizes the slopes and intercepts estimated by a regression analysis of percent change in bar length as in Figure 3: Bars represent inter-trial medians and dots represent the individual values. The horizontal axis represents the experiment conditions, where “A” through “D” indicate the accent patterns and the suffixes “a” and “m” indicate the automatic and manual conditions, respectively. The median slope was negative in all conditions though it was close to zero in condition Dm, meaning that the tempo was generally accelerated in this experiment. The intercept was negative in all conditions except for control condition A, indicating that switching from the synchronization phase to the continuation phase had an accelerating effect. Again, we observed large individual differences (Figure 5(b)), but the inter-trial SD was generally smaller than in Experiment 1 (SD range was 0.024–0.082%/bar whilst it was 0.032–0.131%/bar in Expt. 1). Figure 5(c) shows the relative slopes in condition B–D, where the bars represent the median slopes across participants and the dots represent the slopes of individuals, as in Figure 4(b). Here, we treated all participants together. The relative slope was positive in condition Dm but was almost zero in the other conditions, which means that the accented tapping was slowed when the participants repeated the set of two accents and two non-accents. In addition, the dot distribution seemed skewed towards positive in conditions Da, suggesting the possibility that this accent pattern had a slowing effect regardless of the automatic or manual conditions.

Result of Experiment 2. (a) Two panels summarize the slopes and intercepts of the regression lines of the relative bar length during the continuation phase, as in Figure 3. Dots and bars represent the values of individual trials and their medians, respectively. Asterisks indicate the statistical significance. (b) The slopes in different trials are plotted for each participant, as in Figure 4 (a). Participants are sorted in order of increasing standard deviation of slopes. Again, large individual differences are observed between the participants. (c) Relative slopes of conditions B-D are summarized for the pooled data.
These observations were tested by Wilcoxon signed-rank tests. The slope was significantly different from zero in all conditions except for condition Dm (A:
Some suspect a possibility that participants autonomously changed the tapping strength according to response tones even if they did not consciously try to reproduce the accents. To check this, we examined the tapping force during the continuation phase. Figure 6(a) depicts the median force ratio of each tap to the first tap within a bar, where black dots represent the median ratios of individual participants and red circles represent their medians (blue triangles indicate the accent positions). Note that the ratio is always one for the first tap. This figure shows all participants faithfully reproduced the accent pattern in the manual condition (note that amplitude ratio of unaccented and accented tones was 1:4 as described in the Method section), but also shows that most participants changed the tapping strength according to the given accent patterns in the automatic condition. Kruskal–Wallis tests detected significant inter-tap differences in all automatic conditions: Ba (
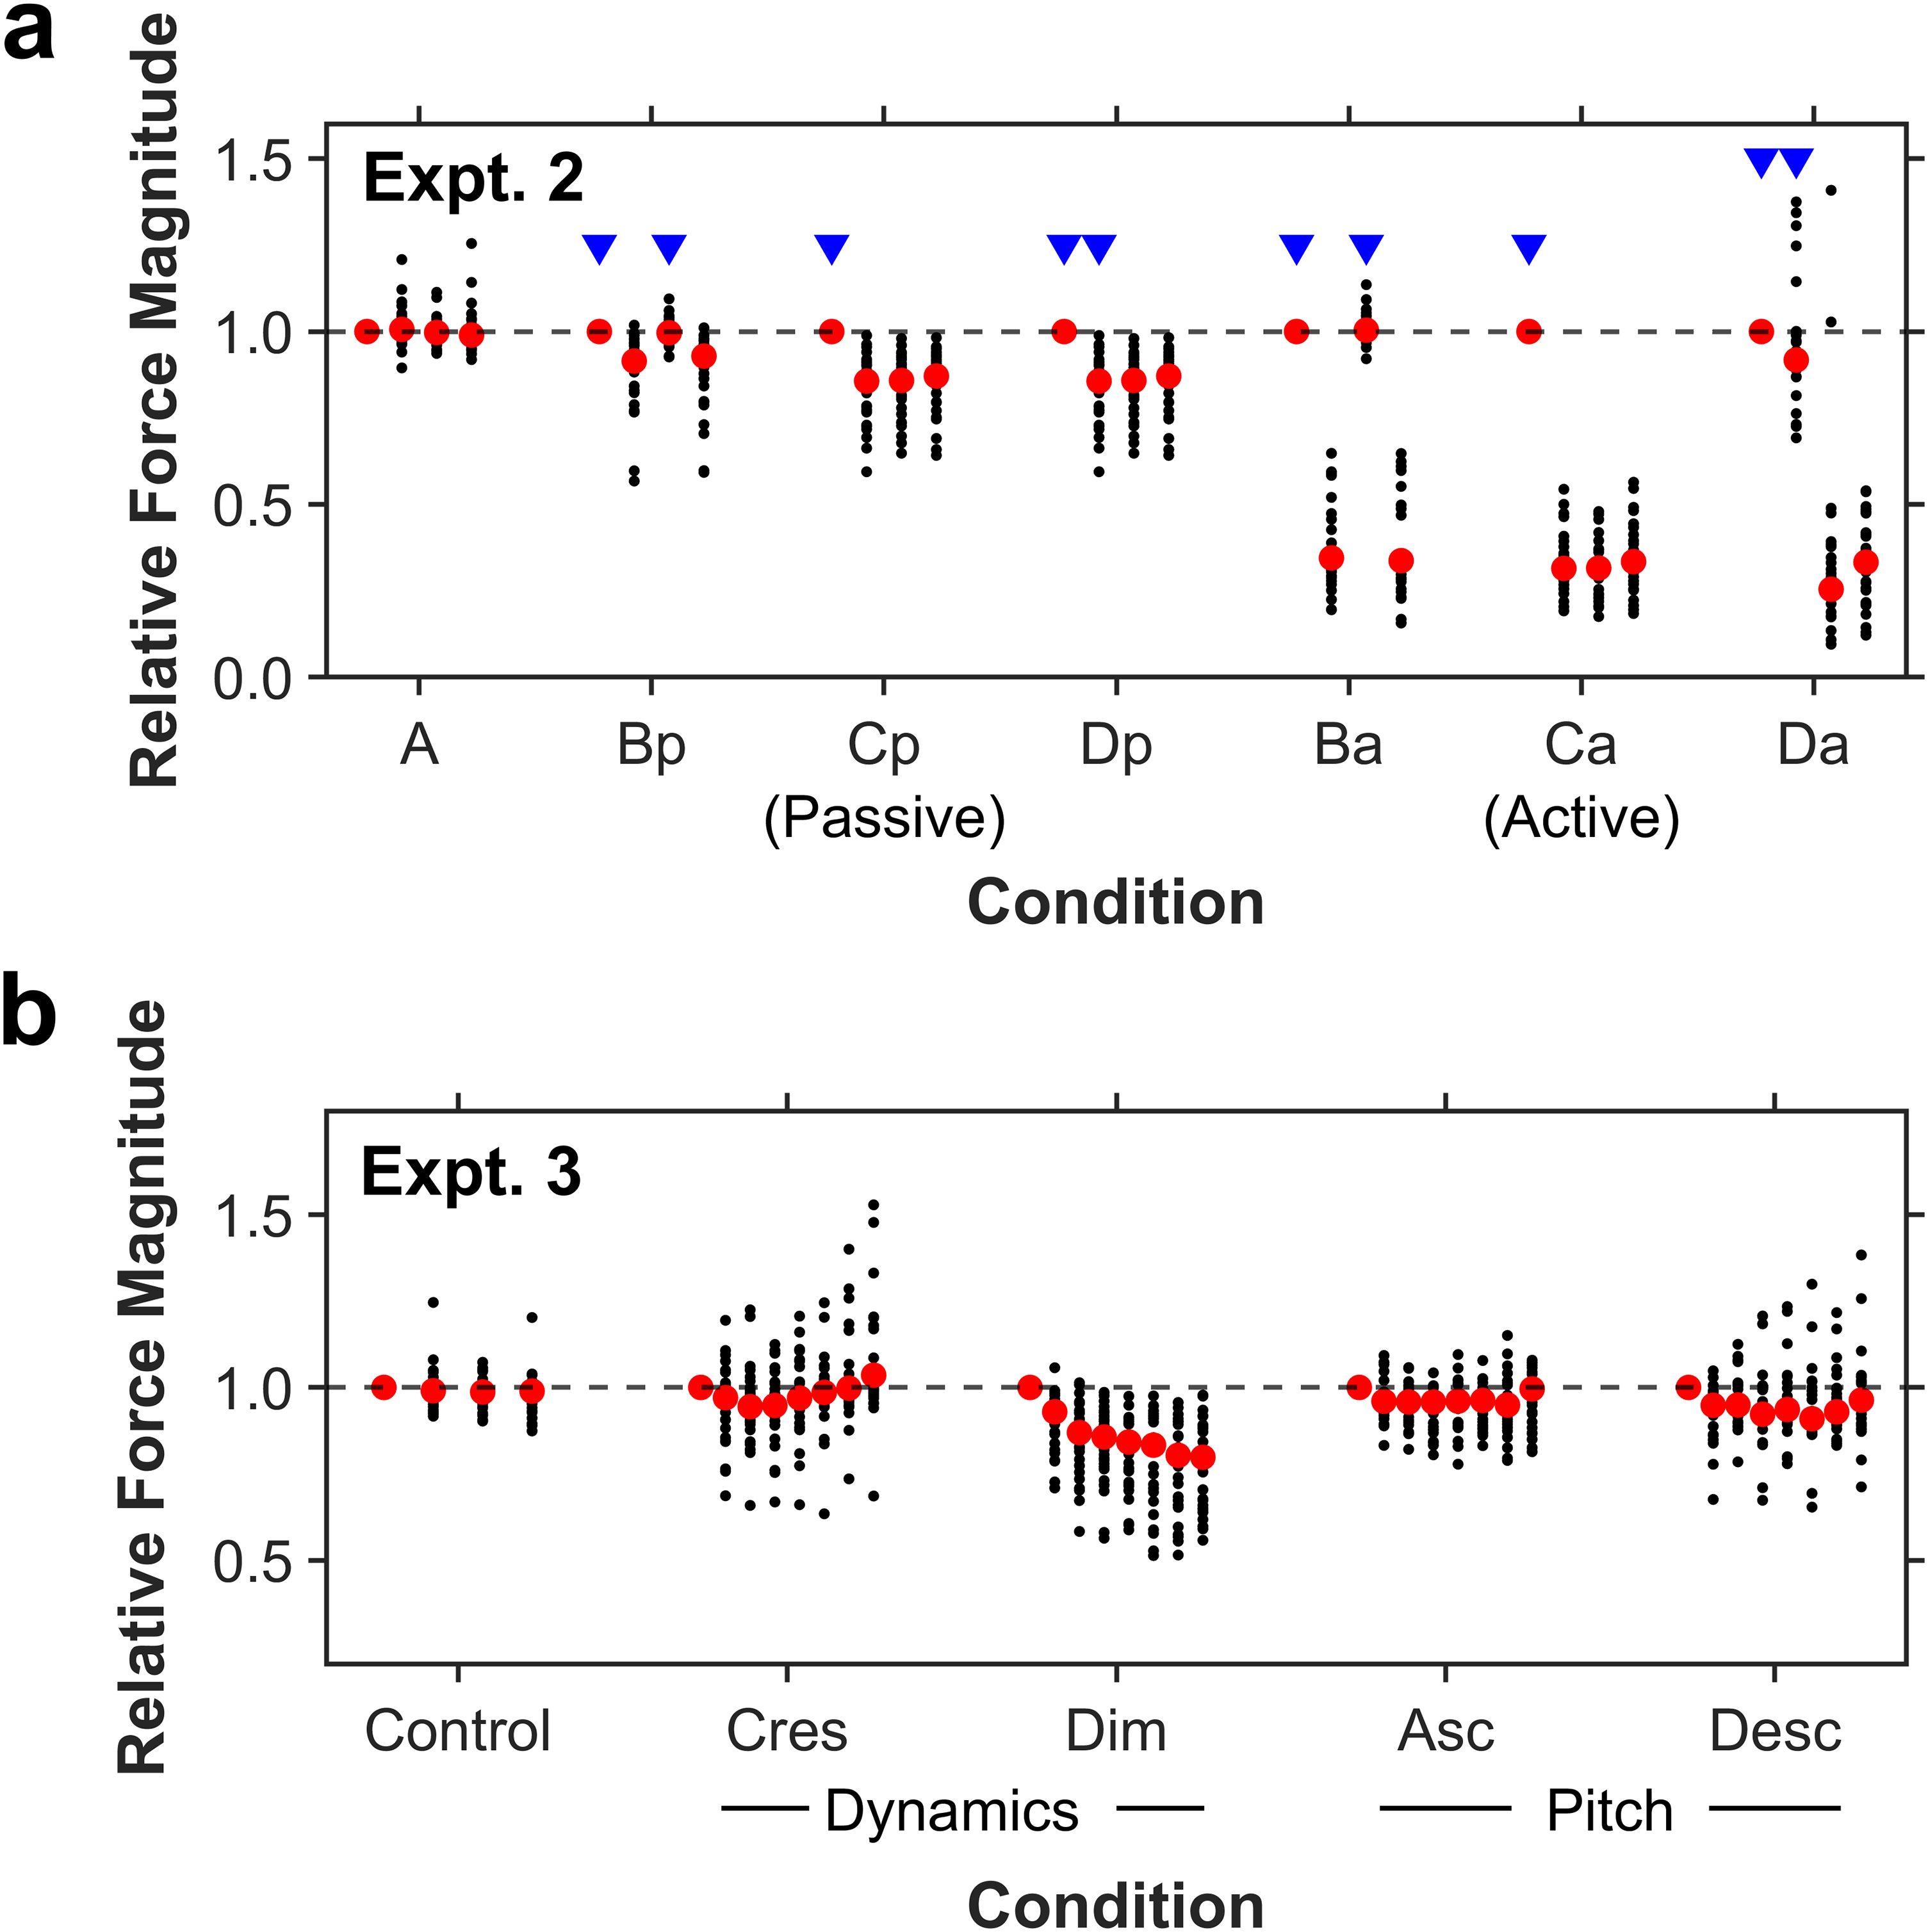
Tapping strength in Experiments 2 and 3. (a) and (b) show the results of Experiments 2 and 3, respectively. These panels depict the median force ratio of each tap to the first tap within a bar (i.e., four taps in Expt. 2) or within a tone sequence (i.e., eight taps in Expt. 3). Black dots represent the medians of individual participants and red circles represent their medians, where blue triangles indicate the accent positions in Expt. 2. Note that the ratio is always one for the first tap within a bar or sequence.
We also examined the relative ITIs within a bar to observe how accent patterns modulated individual ITIs. In Figure 7(a), the horizontal axis shows the tap position within a bar where the triangles indicate the accent positions, and the vertical axis shows the median ratios of ITIs of individual taps to the bar length. Note that position 1 on the horizontal axis means the ITI between positions 1 and 2, and so on. Since the target ITIs are identical, the ratios should be ideally 0.25 (=1/4) for all positions. Small black dots mean the medians (for all bars in the continuation phase) of individual participants and red circles mean their medians. The ratios were modulated by the tap positions in conditions C and D in both automatic and manual conditions. The ITI at the accent position was lengthened in condition C, but not in condition D: the ITI was the longest at the third position in condition Da, but at the second in condition Dm. Interestingly, the modulation of accents was not observed in condition B. Therefore, the accent patterns disrupted the uniformity of ITIs, but the accent itself did not necessarily prolong the ITI.

Fluctuation of ITI in Experiments 2 and 3. (a) and (b) show the results of Experiments 2 and 3, respectively. The horizontal axis shows the tap position within a bar (Expt. 2) or within a tone sequence (Expt. 3), where the triangles indicate the accented positions in Experiment 2. Note that tap position 1 means the ITI between positions 1 and 2, and so on. The vertical axis shows the median ratios of ITIs of individual taps to the bar length (Expt. 2) or sequence length (Expt. 3). Since the original ITIs are identical, the ratios should be ideally 0.25 (=1/4) in Expt. 2 and 0.125 (=1/8) in Expt. 3 for all positions (indicated by the broken lines in the figure). Black dots mean the medians values over all bars in the continuation phase for individual participants and red circles indicate their medians. Asterisks indicate the statistical significance of the effect of tap position.
The non-uniformity of ITI ratios was supported by statistical tests. The results of the Kruskal–Wallis test showed that the ratio of ITIs were significantly different between positions in conditions Ca (
In sum, we found that a particular accent pattern brought a significant long-term tempo deviation though there seems to be no correlation between long-term tempo deviation and local ITI/force fluctuations.
Experiment 3
A total of 14 out of 15 participants successfully performed the task, and we used their data for further analysis.
Figure 8(a) summarizes the estimated slopes and intercepts as in Figure 5(a): Bars represent inter-trial medians and dots represent the individual values. The median slope took negative values in all conditions, meaning that the tempo was generally accelerated. As for the intercept, the median values took negative values in the crescendo and ascending conditions while they were almost zero in the other conditions. Large individual differences were observed, and each participant seemed to have their own acceleration/deceleration tendencies as in Experiments 1 and 2 (Figure 8(b)). The inter-trial SD were generally small (below 0.05%/bar) except for the two most variable participants (0.116 and 0.081%/bar): To examine the difference from the control condition, Figure 8(c) shows the relative slopes in four conditions, where bars represent the median across participants and dots represent the individual data. The median relative slopes were slightly negative in all conditions, indicating a weak acceleration tendency in all dynamics/pitch conditions.

Result of Experiment 3. (a) Slopes and intercepts of the regression lines of the relative bar length are shown as in Figure 5. Dots and bars represent the values of individual trials and their medians, respectively. Asterisks indicate the statistical significance. (b) Slopes in different trials are plotted for each participant. (c) Relative slopes of two dynamics conditions and two pitch conditions are shown for the pooled data.
Wilcoxon signed-rank tests showed that the slope was significantly different from zero in conditions Cres (
We analyzed the relative tapping strength (Figure 6(b)) and ITI ratios (Figure 7(b)) as in Experiment 2. We found significant changes in tapping strength in all conditions (except for control condition): Cres (
Finally, we performed a regression analysis within a tone sequence to examine the local acceleration/deceleration tendency. We estimated a slope from median ITI ratios of eight taps within a sequence for each trial and calculated their inter-trial median. The median slopes were −1.9 × 10⁻⁴, 7.8 × 10⁻⁴, −3.2 × 10⁻⁴, and 8.2 × 10⁻⁴ (these values indicate how much ITI ratios (not raw ITIs) increased in one cycle) in the crescendo, diminuendo, ascending and descending conditions, respectively, and not significantly different from zero (signed-rank test). However, the slope difference was not significant between the crescendo and diminuendo conditions (p = 0.2348, z = −1.1881) but borderline significant between the ascending and descending conditions (p = 0.0521, z = −1.9419) (rank-sum test), suggesting that the tempo was locally more accelerated for the ascending tone sequence compared to the descending one. However, the long-term tempo trend did not show any difference between these conditions (Figure 8(c)).
Discussion
The present study asked whether rhythm and accent patterns affected the tempo-keeping ability in a finger-tapping task, aiming to examine whether sensorimotor process accompanied by music articulation cause the long-term tempo variation. The result showed that both rhythm and accent patterns could affect the long-term tempo-keeping ability, but their effects were rather small. The tempo deviations were within several percent in 150 s for most trials, which is in the range of normal within-individual variation of SMT (i.e., about 3–5%) (Fraisse, 1982). Nevertheless, we observed significant long-term acceleration/deceleration in some rhythmic and accented tapping, compared to the regular tapping. Specifically, one or two rests within a 4-beat meter caused long-term acceleration (Expt. 1) and a pattern of two consecutive accents and two consecutive non-accents caused long-term deceleration (Expt. 2). Next, we observed large individual differences in all three experiments. Each participant showed their own acceleration/deceleration tendency. On the other hand, some participants showed little variability between different rhythm/accent conditions whilst other showed large variability. Small but significant effects despite this large individual difference implies that the effects of rhythm and accent on the long-term tempo deviation are steady. We also found that accented modulation of response tones could affect the long-term tempo even when participants did not try to reproduce the accent pattern. In such cases, the tapping strength was modulated by the response tones (Figure 6), suggesting that both perceptual and motor factors may be involved in this effect. Local ITIs were also modulated by accent patterns (Figure 7), but there was no clear relationship between such local force/ITI modulation and long-term tempo deviation, suggesting that they are different phenomena. We further examined the effect of response tones by using tone sequences modulated by loudness (crescendo vs. diminuendo) or by pitch (ascending vs. descending), and found significant long-term acceleration (i.e., relative slope) in the crescendo condition (Expt. 3). Furthermore, we observed a transient tempo change just after the target tones were extinguished (i.e., switch from the synchronization phase to the continuation phase). This change was not observed in the control condition but was observed in most other conditions, common to three experiments. In sum, the present results suggest the sensorimotor process producing non-regular motor actions and monitoring their outcomes can interfere with the internal mechanism for keeping regular time intervals though its effect is relatively small. Music performance is a complex sensorimotor and cognitive task achieved by the integration of various functions, and thus many potential factors can affect the tempo maintenance process. The present finding showed that the non-uniformity of motor actions can be one of such factors.
Effect of Tapping Articulation on Long-Term Tempo Deviation
In the present experiment, we generally observed an accelerating trend common to many conditions including the control condition: Slopes of the regression lines of percent change in bar length were negative in most conditions (Figures 3, 5 and 8). We chose the target tempo of 132 bpm based on the report that tapping tempo was almost maintained in the range of 117 and 145 bpm (Collyer et al., 1992). One possible reason for this general accelerating tendency is sampling bias: We recruited university students as participants and their SMT/SPR may be biased in the faster direction, compared to those recruited in the previous study. Another reason is difference in the response key mechanism: We used a rigid response bar instead of a movable response key used in the previous study. This change may cause a difference in SMT/SPR given that the motor process is involved in determining SMT/SPR (Loehr & Palmer, 2007; Peckel et al., 2014).
Tempo deviation observed in our experiments was much smaller than that observed in the real piano performance by Mito and Murao (2000) (i.e., 15% acceleration in 15-bar performance). There are two possible reasons for this discrepancy. One is that the target tempo of our experiment was close to SMT/SPR while that of their experiments was much slower (i.e., 70 bpm): The remarkable acceleration observed in their experiment may be due, at least in part, to the drift to SMT/SPR (McAuley et al., 2006). The other reason is individual differences. In our experiments, the effect of rhythmic patterns greatly differed between participants; tempo deviation reached 10–15% for some participants whilst other participants almost kept tempo for every condition (see Figures 3 and 4). These large individual differences are partly due to those in STM/SPR, considering that STM/SPR depends on individual factors including age (McAuley et al., 2006) and musical experience (Drake et al., 2000; Hammerschmidt et al., 2021).
As we summarized in the previous section, significant acceleration/deceleration was observed in some specific rhythm, accent, dynamics, and pitch conditions, compared to the control condition. For example, the relative slope was significantly different from zero when one or two consecutive rests were contained within a 4-beat meter (conditions B and C in Expt. 1). We do not know why only these rhythms had a significant effect on the long-term tempo. To be honest, we were expecting that a more complex rhythm would produce a greater acceleration because we hypothesized that the non-uniformity of tapping action was the point. Thus it was rather surprising that more significant effect was observed for these simpler rhythm patterns (compared to dotted rhythm).
Similarly, we have no clear reason for the long-term tempo trend observed in Experiments 2 and 3. As mentioned in the Background section, some musical factors, including accent (Bouvet et al., 2020; Tekman, 1997), rhythm pattern (Drake & Botte, 1993; Wang, 1984), and pitch (Lake et al., 2014; Pfeuty & Peretz, 2010), have systematic effects on time perception, but our results did not show such systematic effects on the long-term tempo deviation. Plausibly, such factors affect the local tempo and ITI but have little effect on long-term tempo maintenance. This point will be discussed below.
In sum, therefore, the underlying mechanism of how specific musical articulation affects long-term tempo maintenance is an open question.
Local ITI Deviation and Long-Term Tempo Deviation
We examined the tapping strengths and ITIs to analyze the relationship between local force/ITI change and global tempo deviation. It was reported that an ITI preceding an accent was shortened but one after the accent was lengthened (Billon et al., 1996; Billon & Semjen, 1995; Keele et al., 1987; Semjen & Garcia-Colera, 1986). The result shown in Figure 7 does not necessarily agree with this previous finding. Specifically, ITIs were almost the same for all positions in condition B though the accent was imposed on the first and third beats. Presumably, therefore, ITI fluctuation does not directly reflect the strength of motor actions; it may depend also on the perceived metric structure. More importantly, the magnitude of ITI fluctuation was not correlated with that of long-term tempo deviation. This means that the long-term tempo-keeping property is independent of local ITI changes.
We observed that the participants modulated the tapping strength according to the accent patterns of response tones even when they were not required to reproduce the accent patterns. This seems plausible considering the causal relationship between the motor action and its perceptual outcome. Presumably, participants (even unconsciously) modulated their actions so that their perceptual outcome would agree with the response tones. In this sense, we have to say that we failed complete dissociation between perceptual and motor components in this experiment. The fact that similar patterns of long-term tempo deviation were observed between the automatic and manual conditions (Figure 5(a)) suggests that at least some essential part of the perceptual/motor process may be common between the two conditions.
Effect of Time Perception
We observed the effects of loudness and pitch contour of response tones to the long-term tempo deviation in Experiment 3 (Figure 8). Previous findings showed that time perception was modulated various music factors, such as accent (Bouvet et al., 2020; Tekman, 1997), staccato vs. legato (Geringer et al., 2006, 2007), rhythm pattern (Drake & Botte, 1993; Wang, 1984), pitch (Lake et al., 2014; Pfeuty & Peretz, 2010), and pitch contour (Boltz, 2011; Collier & Hubbard, 1998). If we try to maintain the perceived tone interval under these modulations, the physical tapping interval would change depending on the stimulus condition. On the other hand, the long-term tempo deviation cannot be explained simply based on the effect of these factors. The estimated slopes were negative for all conditions (Figure 8(a)), and the relative slopes (from the control condition) were also negative irrespective of loudness and pitch conditions (Figure 8(c)). This consistent long-term accelerating effect is in contrast that local ITIs and their within-sequence trend depended on the loudness and pitch conditions (Figure 7(b)). Therefore, we conclude that loudness and pitch contour can affect the long-term tempo, but its mechanism is presumably different from that of local ITI modulation.
Transient Tempo Change After the Onset of Continuation Phase
We observed a step-like tempo change after the target tones were extinguished (Figure 2), and extracted it as the intercept of the regression line of relative bar length. The direction of this tempo change was not necessarily consistent, but the tempo was more likely to be slowed in Experiment 1 (Figure 3) and to be faster in Experiments 2 and 3 (Figures 5 and 8). As shown in Figure 2 (condition C), tapping tempo was often maintained during the continuation phase even if this initial transient change was observed; these two types of tempo deviation seem independent of each other. To our knowledge, this transient tempo change has not been reported elsewhere. It is only speculation, but this tempo change is perhaps due to some cognitive processing (i.e., task switch or attentional switch) or emotional impact (i.e., astonishment) caused by the sudden loss of target tones. It is often said that rushing is likely to occur when a musician feels nervous in playing specific parts of a piece (personal communications with amateur musicians). Thus the present experiment unintentionally captured such cognitive/emotional effects on the tempo deviation. This point could be further investigated by systematically testing the environmental change on the tapping tempo. This may give a new clue to pursuing the cause of rushing in real music performance.
Failure in Three-Beat Condition
In Experiment 1, more than one-third of the participants failed to keep the rhythm of condition D (“two taps, one rest”); they prolonged the duration of the rest period (i.e., their rhythm became close to “two taps, two rests”). This was totally unexpected for the authors because the authors and other lab members could readily accomplish the task in this condition. One possible reason for this failure is lack of experience of playing musical instruments, especially keyboards and percussions. However, this conjecture seems incorrect because some of the unsuccessful participants had received some training of playing piano (acoustic or electric) whilst some of the successful participants had no experience of playing instruments. Another reason is participants’ attention or focus on the current task: Perhaps, they had become accustomed to the 4-beat metric structure during the previous sessions, and were drawn to this structure even in the session of condition D due to a lack of concentration on the current task. A third possible reason is that these participants have few opportunities to be exposed to three-beat music: Three-beat (e.g., Waltz and Menuet) is common for people familiar with classical music but may not for people listening/playing popular music. It is an open question why many participants failed to keep this rhythm.
Footnotes
Author Contributions
HM and YS researched literature and conceived the study. YS was involved in study design, gaining funds, gaining ethical approval, and data analysis. HM built up experimental environment, recruited participants, performed experiments/data analysis, and wrote the first draft of the manuscript. Both authors reviewed and edited the manuscript and approved the final version of the manuscript.
Action Editor
Trevor Agus, Queen’s University Belfast, School of Arts, English and Languages
Peer Review
Iran Roman, New York University Steinhardt; one anonymous reviewer
Declaration of Conflicting Interests
The authors declared no potential conflicts of interest with respect to the research, authorship, and/or publication of this article.
Ethical Approval
The present study was approved by the Institutional Review Board for Human Subjects Research (#18004) of the University of Electro-Communications and was in accordance with the ethical standards in the Declaration of Helsinki. We obtained written informed consent from all participants.
Funding
The authors disclosed receipt of the following financial support for the research, authorship, and/or publication of this article: This work was supported by the Japan Society for the Promotion of Science, (grant number KAKENHI/JP22K18648).