
Abstract
Pitch spaces allow pitch relations to be expressed through geometrical representations for many different purposes. The Tonnetz is a well-known pitch space in the field of music theory; equivalent representations have been described in the field of cognitive science, especially Krumhansl's model of perceived triadic distance. Despite her empirical approach, we know very little about the way people interact, cognitively speaking, with Tonnetz-based computational platforms involving multimodal stimuli. Our study has approached this issue by means of empirical experimentation for the first time. A total of 88 participants, with varying backgrounds in music and mathematics, were asked to interact with a Tonnetz interface; they did not have prior knowledge of this pitch space. Results of our experiment confirmed our main hypotheses. On the one hand, strong skills in music theory are needed to partially grasp the overall structure of the Tonnetz at first sight; this aspect is mainly related to the quality recognition of triads and the detection of shared pitch classes in harmonic motions. On the other hand, the particular geometry of the Tonnetz may bias this understanding when non-functional harmonic sequences are displayed on it.
The gradual development of notational elements, especially concerning pitch, has marked—although not exclusively—the history of Western music (Grier, 2021). At first, neumatic notation facilitated oral transmission of religious monodies; subsequent Western notations crystalized a sophisticated symbolic abstraction that today facilitates the encoding of a broad number of musical repertoires on staves. Beyond the standard staff notation, a number of people involved in musical practices have developed many spatial configurations to annotate pitch-related information with diverse purposes such as composition, music theory and analysis, the psychology of music, or music information retrieval—to name a few. Depending on this variety of purposes, different spatial representations may overlap or strongly differ.
This article aims to inspect a spatial representation of pitch coming from the field of music theory through the lense of cognitive science. Although the psychology of music and systematic musicology have explicitly approached neo-Riemannian theories a few times (e.g., Brower, 2008; Krumhansl, 1998; Moss, 2014), this study stands—to our knowledge—as the first psychological investigation on the Tonnetz with quantitative methods from the perspective of human–computer interaction. Prior to the presentation of the study, we contextualize our approach within the underlying theoretical scenario and the existing literature.
Approaching the Tonnetz Empirically
Tonal Pitch Spaces
Fred Lerdahl is a scholar at the crossroads of several fields mentioned above: composition, music theory, and the psychology of music. In the late 1980s, he implicitly defined pitch spaces as “topological models” expressing pitch relations; particularly, tonal pitch spaces are, from his perspective, “intended to capture the sense of proximity and distance among pitch configurations that listeners bring to bear when hearing tonal pieces” (Lerdahl, 1988, p. 315).
The first pitch space reproduced by Lerdahl was the double helical model developed by Roger Shepard (1982a): it vertically unfolds the dimension of pitch height while orthogonally projecting a circle corresponding to pitch chroma. For Western musicians, the notion of pitch height is trivial as the staff notation strongly manifests this dimension.
1
Traces of the conceptual metaphor
Lerdahl (1988) raised a criticism against the helical model due to its homogeneity, as it gathers “two strands of whole-tone scales” which do not account for the “less symmetrical” distribution of the diatonic system (p. 318). 2 His criticism also applied to another highly “symmetric” tonal pitch space, proposed by Christopher Longuet-Higgins (1962) and Gerald Balzano (1982), wherein pitch height unfolds in two independent directions: horizontal—perfect fifths—and vertical—major thirds. Lerdahl equally acknowledged that, long before these pitch spaces were introduced in music psychology, analogous rectangular lattices and schemes were adopted by music theorists to depict proximities of tonal keys (Schoenberg 1954/1969; Weber 1824/1842).
The Tonnetz: An Overview
In spite of Lerdahl's accurate mention of Gottfried Weber's and Arnold Schoenberg's representations, his overview does not mention similar earlier schemes, such as the one dating from the 18th century by mathematician Leonhard Euler (1739). 3 On this path, further pitch spaces by German theorists in the 19th century, such as those presented by Arthur von Oettingen (1866) and by Hugo Riemann (1873/1992)—for a historical review of these schemes and similar ones, see Cohn (1998; 2011) 4 —paved the way at the end of the 20th century for the modern 12-TET Tonnetz. This pitch space is the most widespread schematic representation among the neo-Riemannian theories—or Riemann systems (Lewin, 1982)—a particular branch of transformational music theory.
The modern Tonnetz is a geometrical lattice made of equilateral triangles (Figure 1), 5 where the vertices—here marked with circles—stand for pitch classes instead of pitches, that is, regardless of octave registers. The triangular tiling defines three axes: The vertical axis unfolds perfect fifths—for instance C-G-D-A and so on—while the two diagonal ones respectively unfold major thirds—C-E-G♯-C and so on—and minor thirds—C-D♯-F♯-A and so on. Notice the equivalence of the axes related to perfect fifths and major thirds with the pitch space by Longuet-Higgins (1962); the third axis, in contrast, depends on the other two. Additionally, relevant properties of this pitch space—like the morphology of its elementary triangles and their relationships (explained below)—are invariant under axial rotation and symmetries. This axial configuration induces the interval content of the Tonnetz elementary triangles: There are only two layouts—both invariant under translation—respectively corresponding to major and minor triads. Due to the particular cyclicity of the perfect-fifth axis, which generates the aggregate, the Tonnetz gathers all the 24 possible major and minor triads within the 12-TET system. Such a pitch space periodically replicates itself; thus, its planar structure can be wrapped—which gives rise to a torus.

Partial screenshot of the Tonnetz webpage in which the C major chord is highlighted on the Tonnetz.
Any triangle of the lattice is surrounded by three others with opposite layout, each sharing two vertices with the former. Musically speaking, this means that any major (minor) triad is related to three minor (major) triads by sharing two pitch classes with each of them. These relationships depend on three possible transformations that non-trivially maximize pitch-class intersections (Figure 2): the Parallel operation—henceforth P—preserves the root of both triads and the shared perfect fifth while swapping the order of the harmonic minor and major thirds; the Relative operation—henceforth R—relates a pair of triads with a common major third while their roots are separated by a minor third; the Leading-Tone operation—Leitonwechsel, henceforth L—relates a pair of triads with a common minor third while their roots are separated by a major third. As the modern Tonnetz is structured in terms of pitch classes (Cohn, 1997), none of these operations entails any particular motion. However, as shown in Figure 2, pitches can be arranged to produce parsimonious voice leadings with these operations: One voice smoothly moves up or down—a chromatic semitone for P, a diatonic semitone for L, and a tone for R—while the other two voices remain sustained.

Possible parsimonious transformations for major and minor triads.
The PRL family of elementary operations outlined above generates the entire space of major and minor triads—although R and L alone suffice as generators because P can be derived from them. Any pair of perfect triads can be therefore connected through a limited chain of elementary operators—in fact not more than five. These neo-Riemannian tools have proven to be useful for analyzing many tonal passages that would be hard to explain by means of only functional tonal models, since tonal functionality mainly accounts for proximity through the cycle of fifths instead of parameters like pitch-class intersection or voice-leading smoothness. The model and further neo-Riemannian extensions fit particularly well with the requirements for the analysis of the chromatic music of the late-Romantic period (e.g., Childs, 1998; Cohn, 1996; 2012) and is also appropriate for approaching varied musical repertoires in the extended common practice, such as jazz and bossa nova (e.g., Briginshaw, 2012; Capuzzo, 2006; de Lemos Almada, 2020), pop and rock (e.g., Bigo & Andreatta, 2014; Capuzzo, 2004), or minimalist music (e.g., Cohn, 2019).
Further research in music psychology has also dealt with pitch spaces similar to those proposed by Longuet-Higgins and Balzano—for an account, see Shepard (1982b). A significant contribution was provided by Krumhansl and Kessler (1982), who introduced a pitch space derived from an empirical study on perceived triadic proximity. Years later, Carol Krumhansl (1998) explicitly discussed the resemblances of her model with the dual representation of the Tonnetz—mathematically speaking, the so-called chicken-wire torus (Douthett & Steinbach, 1998)—by trying to find a compromise between tonal functionality and pitch-class intersections, which led later to some neuroscientific speculation about mental key maps (Zatorre & Krumhansl, 2002). More recent empirical research on the Tonnetz and further neo-Riemannian concepts are mainly based on computational inspection, encompassing perspectives from psychoacoustic models (e.g., Bernardes et al., 2016; Milne & Holland, 2016) to music information retrieval (e.g., Aminian et al., 2020; Chuan & Herremans, 2018; Lieck et al., 2020).
Considering Transformational Music Theory Through Human–Computer Interaction
Although the previous literature review attests to the importance of pitch spaces in both music theory and cognition, some spatial implications of these geometric representations have been largely disregarded. They are, however, important from the point of view of embodied cognition and multimodal interaction. For instance, some authors have started exploring bodily and gestural responses to Tonnetz-based environments (Cannas, 2018; Hedges & McPherson, 2013; Holland et al., 2009; Mandanici et al., 2016), but without a systematic discussion of their cognitive implications. This issue is also relevant for the so-called isomorphic musical instruments, as several of them depend on Tonnetz-like real or virtual keyboards (Graf & Barthet, 2023; Maupin et al., 2011; Milne et al., 2007; Park & Gerhard, 2013).
From the perspective of embodied experience, a comprehensive discussion on cognitive paradoxes in the presentation of several pitch spaces has been proposed by Candace Brower (2008). In particular, she suggested a modification of the modern Tonnetz, retaking actual pitches—instead of pitch-classes—and slightly distorting the axes to make them, visually speaking, more consistent—and therefore more comprehensible—with an underlying vertical pitch schema. Although Brower's criticism is purely theoretical—as she does not rest on any empirical research—her formulations opened the door for the main hypotheses of our study:
Despite the apparent geometrical simplicity of the Tonnetz, its deep structural implications are very complex. Only people with high skills in music theory are able to partially grasp its overall structure at first sight. This partial grasp should not be understood as a threshold of accuracy in the recognition of the structure but as a direct or implicit understanding of fragmentary properties of the Tonnetz. The geometry of the Tonnetz is not consistent with the widely spread vertical schema for pitches as it unfolds differently in its three axial directions; nor does it provide self-evident patterned representations of tonal functionality—even the implicit circle of fifths, unfolding in one of its axes, may go unnoticed at first sight. Both facts may bias the comprehension of the Tonnetz, particularly when non-functional harmonic sequences are represented on it.
The formulation of these hypotheses also comes from our scholarly experience with human–computer interaction in the field of music theory. The SMIR project
6
led us to develop a robust audiovisual web platform for the Tonnetz (Guichaoua et al., 2021); our observation of varied people interacting with it raised some intuitions around the mentioned hypotheses that we are formalizing in this study, through a controlled multimodal experiment by means of an adaptation of our web platform. Among the plethora of digital musical-learning resources (Mandanici et al., 2023), a growing number of software applications has been devoted to multimodal interaction with the Tonnetz and Tonnetz-related pitch spaces (e.g., Bergstrom et al., 2007; Bigo et al., 2015; Holland, 1992). The pitch relations enabled by software approaches visually suggest the metaphor of motion that stands at the core of transformational music theory (Attas, 2009).
Method
Participants
A total of 88 participants (44.32% female, 55.68% male) took part in the study. In order to have 4 different groups of 22 people each, participants were recruited according to the following criteria: Music professionals—henceforth MusPro participants—held a conservatory diploma and developed their careers as singers, instrumental performers, composers, conductors, music teachers, and/or musical radio broadcasters (age: M = 38.32, SD = 8.07); science professionals—henceforth SciPro participants—held a master’s degree or a PhD in a scientific or technological field and developed their careers as mathematicians, physicists, computer scientists, engineers, or architects (age: M = 43.68, SD = 12.10); music students—henceforth MusStu participants—were bachelor students in musicology with formal music training not yet professionalized (age: M = 22.82, SD = 2.89); science students—henceforth SciStu participants—were bachelor’s or master’s students in mathematics, physics, or engineering (age: M = 20.31, SD = 1.77). For a clearer differentiation of the groups, MusPro and MusStu participants—henceforth, when pooled, Mus participants—were chosen from people with no mathematical education at university; conversely, SciPro and SciStu participants—henceforth, when pooled, Sci participants—were chosen from people with 0–4 years’ musical training—whether formal or informal. Although all Mus participants reported significant knowledge in music theory—in some cases they were relatively proficient—none of them were familiar with neo-Riemannian theories prior to the participation in our study. Color blindness was also a criterion for exclusion.
The choice of the groups was guided by the hypotheses mentioned above. On the one hand, Sci participants are more than a mere control group in terms of musical training; these participants have received or were receiving scholarly education in which geometrical abstraction was a pivotal feature. On the other hand, the difference between groups MusPro and MusStu is aimed at measuring the impact of the proficiency in terms of music theory skills.
Audiovisual Stimuli
The aural stimuli consisted of 12 harmonic sequences of 7 major and minor block triads. Each chord lasted 1 s, except for the last one of each sequence, which was sustained for 8 s. Sequences were presented with synthesized organ-like sounds—with a piano-like decay for the last sustained chord—and were dynamically balanced to avoid any chord or particular voice becoming more salient in terms of volume.
The 6 first chords of every sequence unfolded progressions by using only 2 of the 3 possible parsimonious relationships: 4 sequences were built on LR- or RL-progressions, 4 on LP- or PL-progressions, and 4 on RP- or PR-progressions. Besides, half of the sequences opened with a major triad and the other half with a minor triad. Each sequence started with a different pitch class as the root of its first chord, in order to minimize potential biases of persistent openings. The last chord of each sequence was chosen according to six possible options (see Table 1). Therefore, there were 2 representatives of each option in the total pool of 12 sequences: Typologies 1 and 2 keep parsimony, respectively prolonging or not the harmonic direction of the sequence; Typologies 3 and 4 are tonally stable as they close the sequence with a perfect-fourth or perfect-fifth motion in the bass layer; Typologies 5 and 6 produce the most unattended cadential endings, tonally speaking, of the harmonic sequences. The choice of six such options homogenizes the set of stimuli, so facilitating statistical data analysis, in particular the estimation of expected values—as shown in the Results section.
Description of the typologies for the last chords of the sequences in function of their relationship with the preceding triad.

All the triads were displayed in 4 voices—the lowest one always presenting the root, whereas the upper ones always contained the 3 pitch classes of each triad in a closed position. The choice of root positions—fixed by the lowest voice—was aimed at avoiding chord inversions, which could be perceived as more unstable from a tonal viewpoint, due to less spectral harmonicity (McDermott et al., 2010). Layers moved within the average voice range in a SATB choir, ranging from E3 to G6, to avoid register biases (Biasutti, 1997). The voice leading was smooth, that is, the bass layer never unfolded a melodic motion of intervals in the same direction that exceeded a perfect octave; upper voices always moved parsimoniously until the last chord, which was reached by the smallest interval steps and avoided some forbidden voice-leading during common-practice period—mainly parallel and direct octaves or fifths. A comprehensive list of pitches for the 12 sequences in MIDI values is provided in Appendix A.
Every sequence was aligned with its visual counterpart on the Tonnetz. The lattice was presented with gray lines on a black background, and the triangle vertices were emphasized with small circles. When the first chord in a sequence started sounding, a triangle of the lattice was lit up—in red if the triad was major; in blue if it was minor. At the same time, its surrounding small circles—standing for pitch classes—were lit up in white. This was repeated for every chord of each sequence, excluding the last one and keeping the previous lit items on screen. Because of the parsimonious harmonic organization of the sequences, the aural chord progression was synchronized with a visual unfolding of aligned triangles with alternating colors. The visual counterpart of the last chord was different: 6 yellow chords appeared at the same time, four of which following the abovementioned Typologies 1–4 and two of which followed Typology 5 or Typologies 5–6. No white circle was simultaneously illuminated accompanying the yellow layouts. One and only one of the 6 yellow triangles matched with the visual representation of the actual sounding triad. For the choice of each yellow triangle on screen, we opted for the closest representative, geometrically speaking, of the triangle corresponding to the penultimate chord (Figure 3).

Sequence Major-RP (see Appendix A) used in the experiment. Top: transcription according to the standard music notation. Bottom: visual interface for the participants—of the proposed 6 yellow triangles, the correct one here is the furthest left. The white overlapping arrow—which was not shown during the experiment—highlights the visual unfolding of the sequence.
From one sequence to the next, the visualization of the lattice did not change; the referential pitch classes were adapted to have the 12 highlighted triangles centered as much as possible. The reason for this choice was twofold: to mitigate the potential match between circles and pitch classes by participants with perfect pitch and to avoid potential biases caused by uncentered geometrical representations.
Procedure
Participants were provided with a tablet and headphones for visualizing the Tonnetz and hearing the chords. For each sequence, participants were asked to choose, among the 6 yellow triangles mentioned above, the one which, in their opinion, best fitted with the last chord they heard; to input their choice, they were provided with an electronic pen. This choice was captured on the tablet, along with the time taken to make the decision; the latter was measured from the start of the last chord—and the illumination of the yellow triangles—to the instant at which the pen touched the tablet surface. Participants were not given feedback on whether they picked the correct triangle.
For all the 12 sequences—whose order was always randomized—the task was performed twice. Before the first trial, participants did not receive any information about the Tonnetz structure. At its end, they watched a short video tutorial
7
in which the following explanations—in this sequence—were provided by means of mathematical terminology and aural examples:
Pitch classes are represented by small circles. Each one of the three geometrical directions stands, respectively, for a series of perfect fifths, major thirds, and minor thirds. Red triangles pointing to the right correspond to major triads. Blue triangles pointing to the left correspond minor triads. Any chord among the 24 possible major and minor triads can be represented by a triangle on the plane. Each triad-related triangle is surrounded by three other triangles, each of which share two pitch classes with the former. Two triads with no shared pitch classes are represented by distant triangles.
After the video tutorial, participants repeated the task. Before doing this, they were allowed a quick clarification about the tutorial; they were given less than 30 s to restart the experiment to avoid deep reflection. After the second trial, a questionnaire was provided to explore the strategies adopted by the participants to do the tasks. This was also the context in which they could communicate further introspection.
Data Analysis
We analyzed the significance of the following results using several robust methods. We generally chose non-parametric tests, as normal distributions of the data could not be assumed a priori. Consequently, p-values for significance were calculated through the Mann–Whitney test when the samples were independent—when comparing different groups—and through the Wilcoxon signed-rank test otherwise—when comparing two attempts, that is, before and after the tutorial within a same group. In addition, we used the Shapiro–Wilk test to flag potential non-normal distributions.
In this study, groups were defined a priori based on the quality and the level of formal music and/or science training. We assumed that such a classification might significantly impact the responses, depending on different reasoning mechanisms related to individual expertise. To check the reliability of this hypothesis, after a close qualitative inspection of the data, we performed a discriminant analysis based on the test of the evenness of eigenvalues of similarity matrices (Feoli & Ganis, 2019). This non-parametric analysis technique is constructed to determine if at least 2 of the 4 groups differ significantly from each other by considering all the variables—both responses recorded on the tablet and from the questionnaire. The test provides statistical significance of group separation based on the fact that separate groups tend to have independent sets of eigenvalues of their similarity matrices—calculated by means of a similarity index. For example, if a matrix contains 4 completely separated groups—as supposed in our case—one would expect that the maximal entropy of the eigenvalues is ln 4 and the evenness is 1 (Shannon, 1948). However, this would be a very extreme case. To test differences in the similarities between groups, the total similarity matrix was rearranged into 4 groups, and the test of eigenvalues was calculated by means of a permutation technique estimating how many times the evenness was higher than the starting classification. Evenness is defined as follows, k being the group number and λi the eigenvalues:

For all the variables, we finally extracted a fuzzy set by averaging similarities, as suggested by Feoli and Zuccarello (1986). Fuzzy sets, according to Zadeh (1978), are defined as sets each element—in our case, each participant—of which is associated with a value indicating the relationship with the set itself—within groups—and a value indicating the relationship with other sets—between groups. Such values are called degrees of belonging: high values indicate strong appurtenance to the set; low values indicate weak appurtenance to the set. For each variable, we calculated the average value within the 4 groups and normalized such values so that the sum was equal to 1. The interpretation of this calculation is that the variable with the high value has the highest degree of belonging to the set in question and can be therefore used as a discriminant between sets.
Results
Accuracy of the Tablet Answers
The most straightforward approach for measuring the accuracy of the participants’ performance comes from the estimation of the correctness in their answers when interacting with the tablet (Table 2). Due to our experimental design, the expected value for the number of correct answers when randomly picking the yellow triangles is 2. Groups SciPro, SciStu, and MusStu obtained average results very close to this expected value in their first attempt. Only the MusPro participants clearly exceeded this value, being significantly different when compared with groups SciPro (p = .012), MusStu (p = .005), and SciStu (p = .005). All participants slightly improved their average score during the second attempt after the tutorial. As a result, the difference from the MusPro participants remained significant—barely, though—when compared with groups MusStu (p = .050) and SciStu (p = .032); however, the comparison between first and second attempts per group did not lead to significant differences in any group.
Mean and standard deviation for correct answers in the four different groups, before (attempt 1) and after (attempt 2) the video tutorial. The total statistics are also split into three equally sized categories of stimuli depending on the number of shared pitch classes (s.pc.) between the two last chords of the sequences.
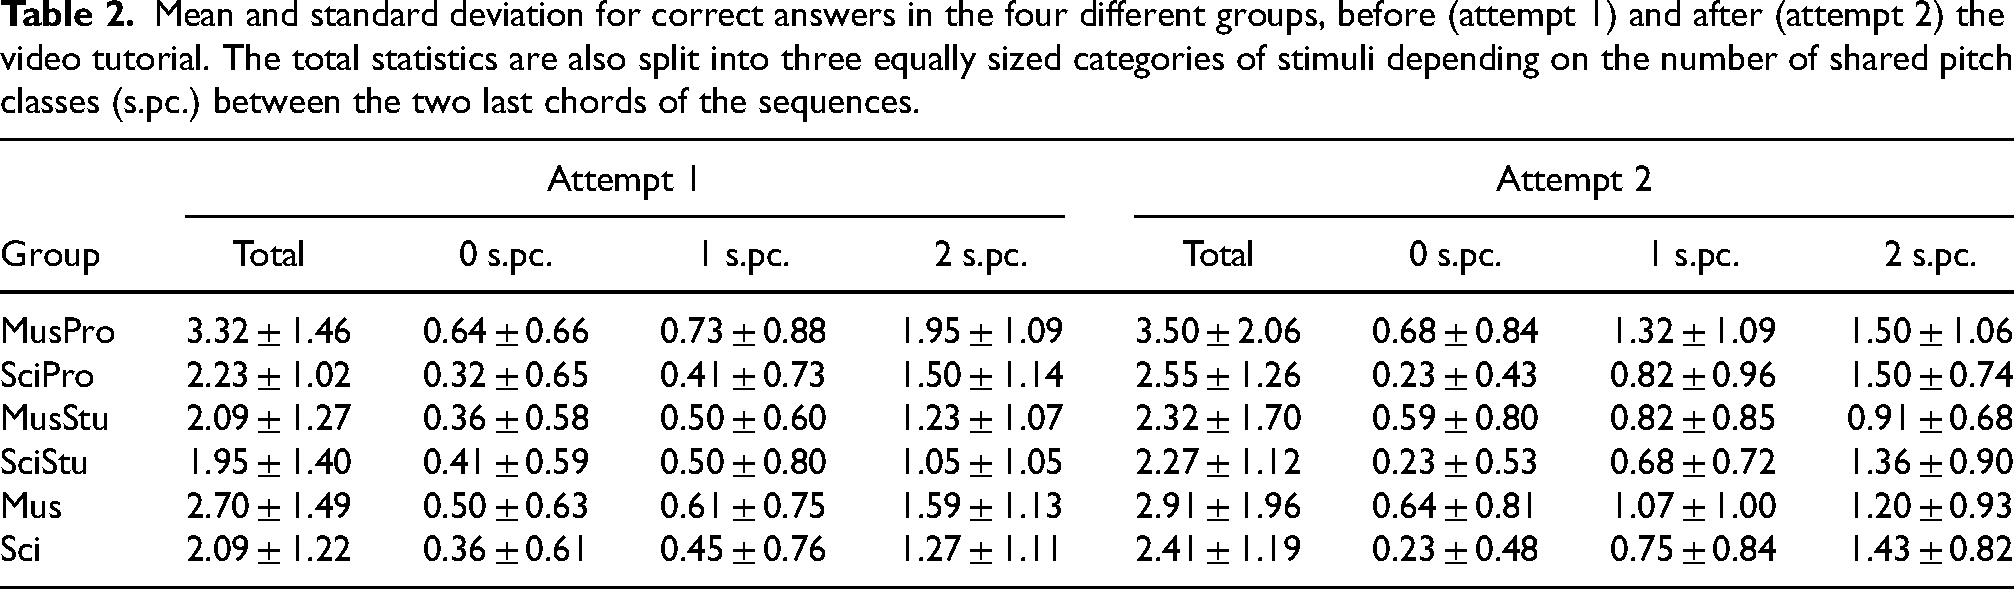
Further patterns concerning correct answers emerge when we take into account the number of shared pitch classes between the two last chords of the sequences. For all the groups, the greater the number of shared pitch classes, the higher the average amount of correct answers in both the first and the second attempts. In particular, correct answers for two pitch classes in common—that is, when the last movement is parsimonious—are greater than the sum of those with fewer notes in common in the first attempt. However, the second attempt only led to better scores for parsimonious closures of the sequence for the SciStu participants; in this case, group SciPro scored a similar mean, and, unexpectedly, both MusPro and MusStu participants got worse average results. As the visual bias discussed below may have had an important impact on these results, we did not incorporate them into the overall discussion.
Further Geometric Features of the Tablet Answers
The accuracy of the answers is perhaps an overly rigid—and evidently poor—approach, as it only measures the exactness of the participants’ responses in terms of true or false. Among the false possible responses for each stimulus in the experiment, there were, however, important differences: some of them were closer to the true one; others were very far. Consequently, the inspection of further aspects of the answers—beyond strict accuracy—may shed better light on the evaluation of our first hypothesis. With this objective, our study design made room for partial or indirect inspections on the answers in terms of their spatial distribution, which may help to reveal patterns or tendencies beyond the previous data analysis.
As major and minor chords match with different layouts of the triangles within the Tonnetz, the orientation of the selected triangle can be regarded as an indicator of the recognition of the quality of the correct answer. Besides, among the 6 possible yellow triangles per sequence, the one continuing the direction traced by the blue and red ones was always an option. This fact led us to consider that it could be, visually speaking, the most biased option among the possibilities offered. This does not mean that such a biased answer was automatically wrong, as it represented the accurate answer for 2 of the 12 sequences we provided. However, its stronger visual connection with the previous visually unfolded pattern for all the stimuli should not be neglected.
Table 3 summarizes the analysis of quality recognition and biased answers. Due to our experimental design, the expected value for the number of answers matching the correct quality when randomly picking the yellow triangles is 6. Again, groups SciPro, SciStu, and MusStu obtained average results very close to this expected value in their first attempt before the tutorial; the MusPro participants reached a slightly higher value—although not statistically significant—when compared with the other groups. This feature clearly changed in the second attempt. All groups except for the SciStu participants clearly improved their scores, and the MusPro participants became a significantly differentiated population when compared with groups SciPro (p = .013) and SciStu (p = .003). In addition, the improved results in the second attempt were statistically significant—barely, though—when compared with the ones obtained in the first attempt for groups MusPro (p = .045), SciPro (p = .033), MusStu (p = .038).
Mean and standard deviation for quality recognition of the last chord of the sequences and for the responses matching with the induced visual bias of the experiment. Outcomes are presented for the four different groups, before (attempt 1) and after (attempt 2) the video tutorial.

Our analysis confirmed the presence of the privileged patterned answer mentioned above, in terms of visual bias. Again, due to the experimental design, the expected value for the number of spatially biased answers when randomly picking the yellow triangles is 2. All groups doubled such a value in their first attempt, and the SciPro participants even tripled it; the latter were significantly different when compared with the MusStu participants (p = .017). All groups except for the MusStu participants lowered their biased answers—not greatly, though—in the second attempt, but no statistically significant difference was found here. A closer look at the information on induced visual bias shows a singular distribution of the data (Figure 4). There is a number of participants within every group that always opted for choosing the visually biased response—value 12—during their first attempt. Such extreme values—and also close ones—vanished during the second attempt for all groups with the exception of the SciPro participants; this group even featured a higher number of people who always opted for the biased triangles. Indeed, this distribution is the only one that returned a significant value (p = .029) when testing its non-normality by means of the Shapiro–Wilk test. In other words, the subgroup of extremely biased SciPro participants behaved beyond the norm, which translated into a bimodal distribution—maximum values for the SciPro distribution occur at both 3 and 12.

Histograms for the four groups of participants concerning responses that matched with the induced visual bias.
A second indirect method for measuring the correctness of the answers considers the notion of distance. Considering previously defined geometric distances on the Tonnetz (e.g., Krumhansl, 1998; Milne & Holland, 2016; Tymoczko, 2009), we opted for observing the error in the recognition of the number of shared notes between two chords. Consider the number of shared pitch classes between the penultimate sounding chord of each sequence and the one matching with the picked yellow triangle (sp); consider also the number of actually shared pitch classes between the two last sounding chords of each sequence (sa). We define the perceived distance error (d)—which is not a mathematical distance but a measure of error—between the correct triangle and the picked one as follows:
Here, the expected value for the perceived distance error, when randomly picking any yellow one, is 0.89. 8 The mean for all of the groups was slightly lower than this in their first attempt, and only Mus participants—especially MusPro ones—strongly lowered their mean after the video tutorial (Figure 5). In the second attempt, MusPro participants were significantly different when compared with groups SciPro (p = .008) and SciStu (p = .003); the comparison between the two attempts by MusPro participants was also significant (p = .011).
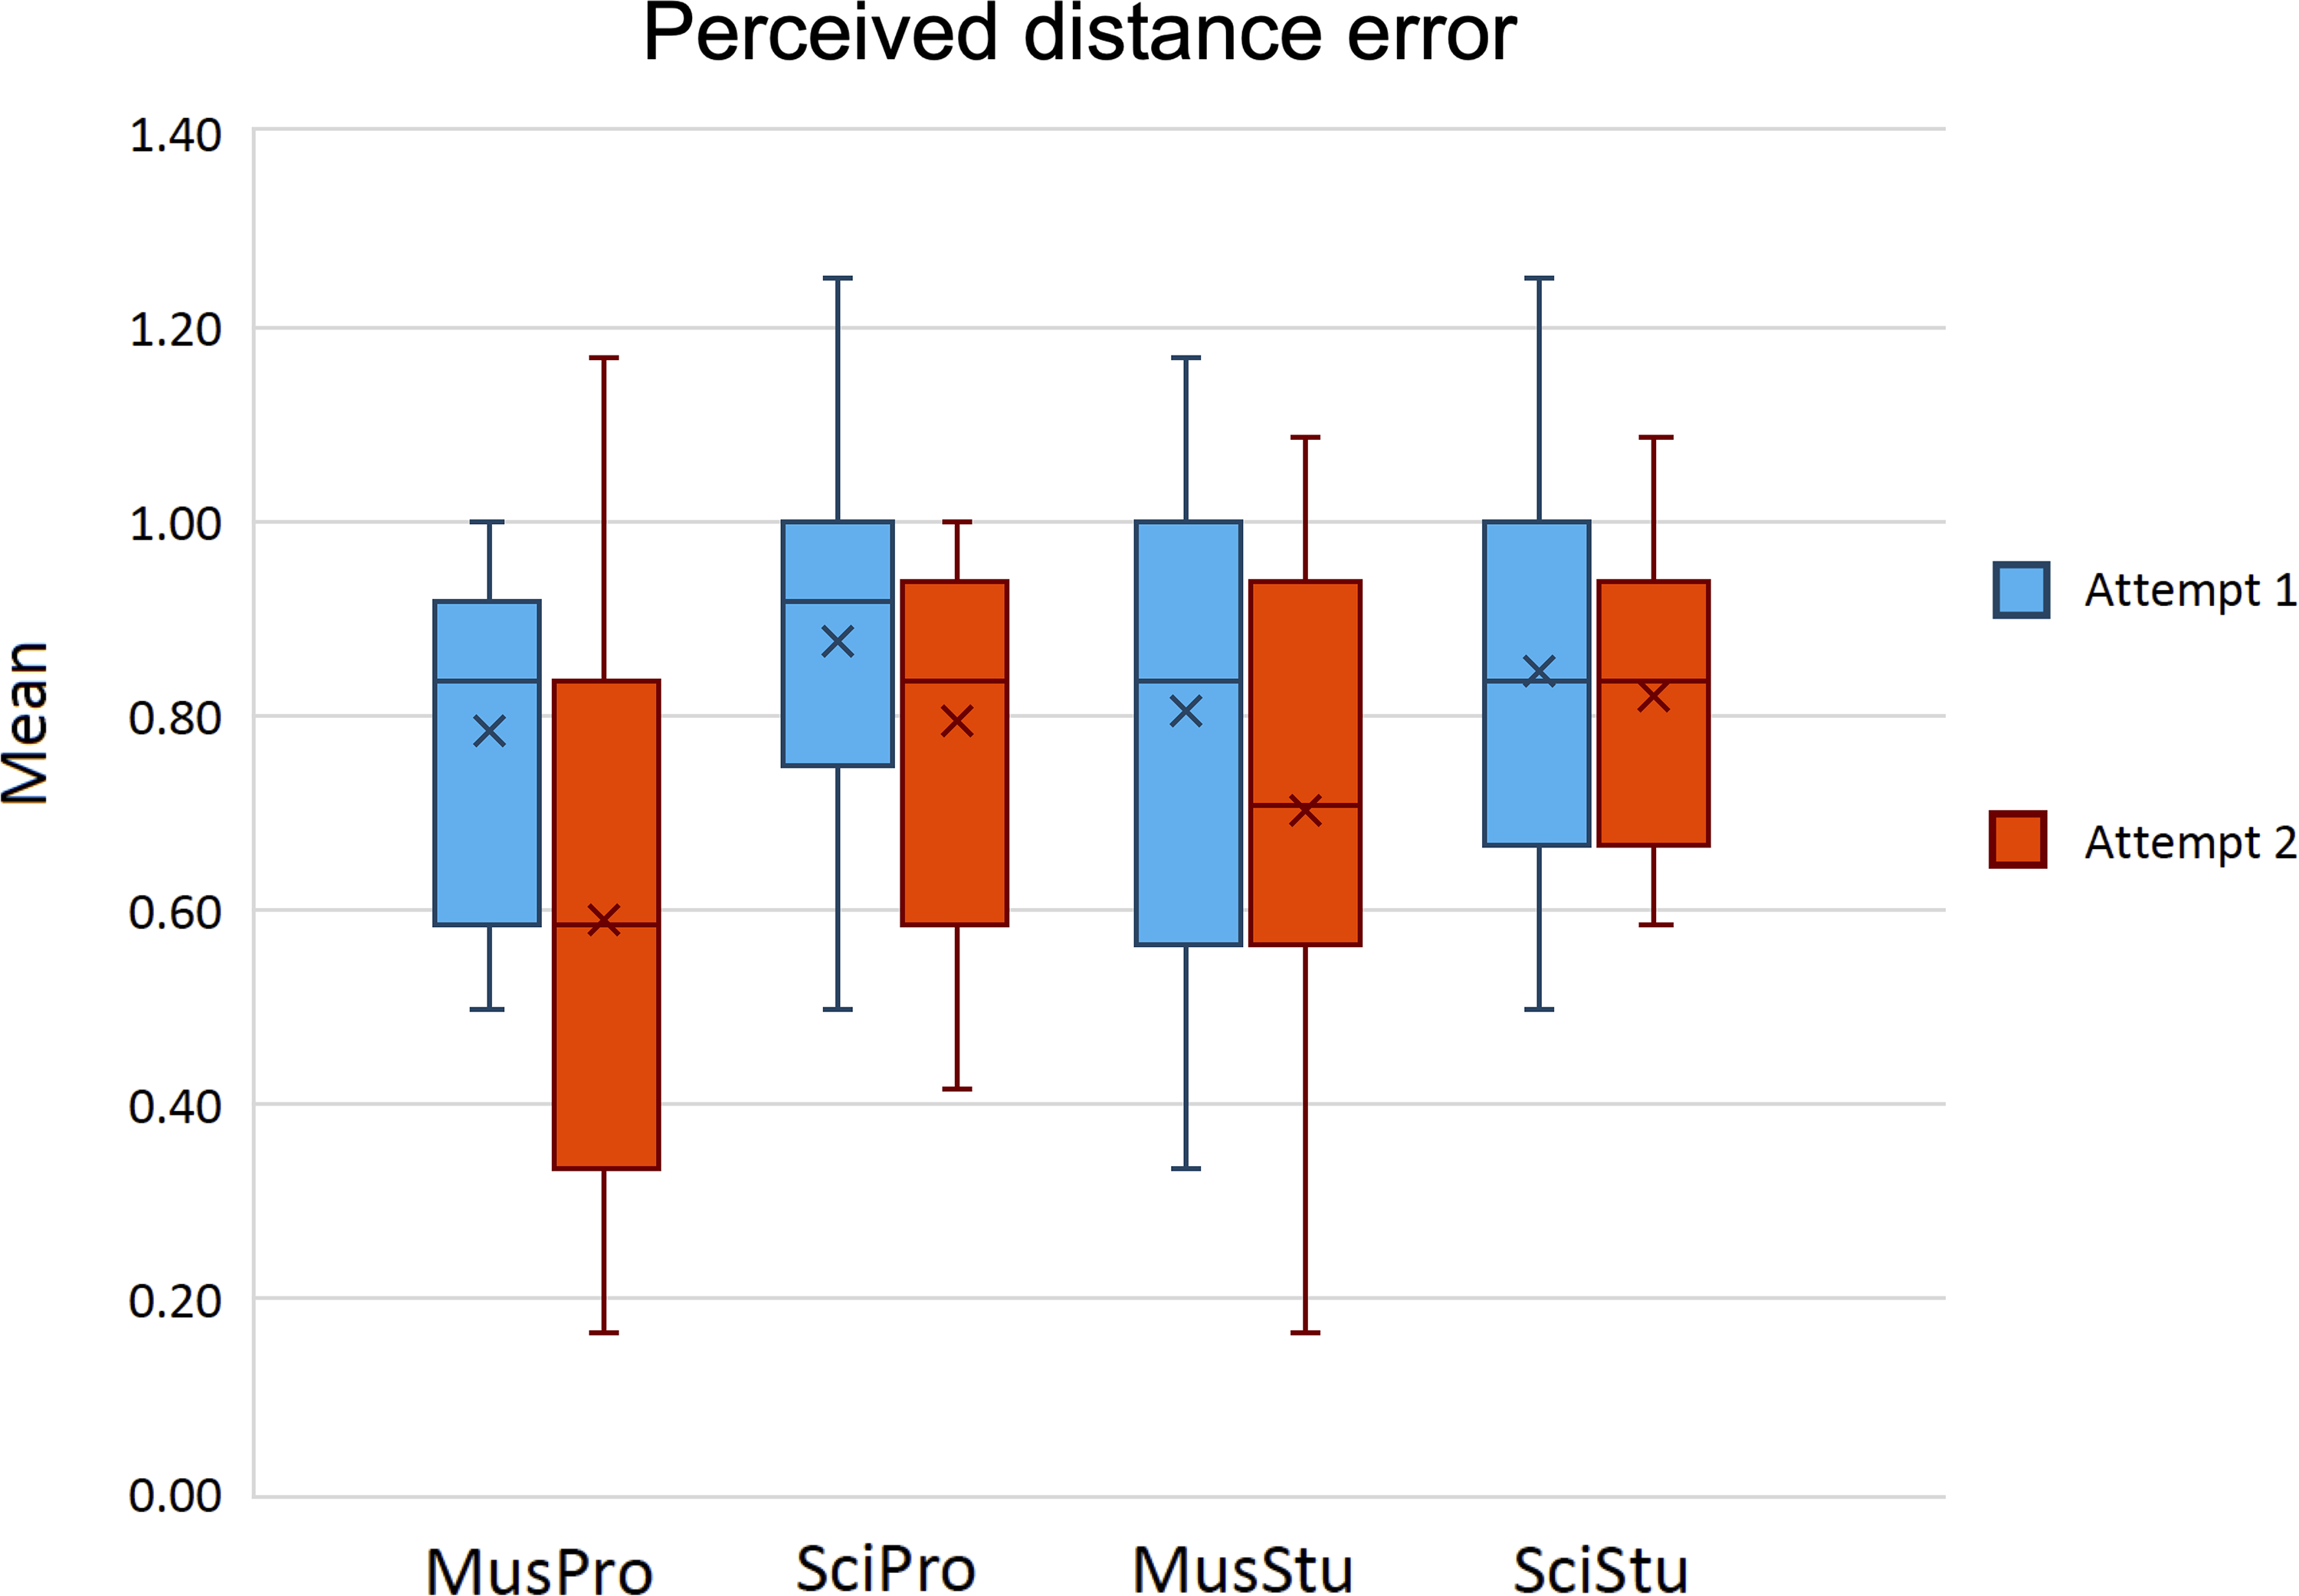
Means of the perceived distance error, before (attempt 1) and after (attempt 2) the video tutorial. Crosses in the boxplots stand for the means of the individual means.
Response Time
The previous results were based on data that were easy to compare through participants. Dealing with their response time is, conversely, more complex as each person could have had particular needs and adopted individual strategies when choosing their responses; this may have affected their timing in absolute terms. However, as the response time was measured in both attempts, we were able to compare the two responses for a given participant. We define the time ratio as the quotient between the response time for any sequence after and before watching the video tutorial. For a clearer analysis, we have adopted a logarithmic scale, so that positive values indicate a longer response time in the second attempt and negative values indicate the opposite.
Once the time ratios—one for each sequence—were averaged, we used the means per participant as values for comparing different groups (Figure 6). The median and the mean of these time-ratio individual means were positive—not higher than 0.50, though—for all the groups, which implies that the response time was, on average, longer for the second attempt independent of the group. Although these medians and means were slightly higher for groups MusPro and MusStu, the differences were not statistically significant when compared with groups SciPro and SciMus. The same analysis was carried out by splitting the data according to the number of shared pitch classes between the penultimate and the last chords of the sequences. Again, the median and mean of the time-ratio individual means were always positive, but in the case of two pitch classes in common, scores were lower independent of the group. Within each group, differences depending on the number of shared pitch classes were not statistically significant except for the MusPro participants; here, the comparison of the time ratio—after removing an outlier—between harmonic sequences ending with 1 and 2 pitch classes in common was significant (p = .037). In addition, 28.41% of all the participants provided on average faster responses during the second attempt when the harmonic endings included 2 shared pitch classes, a greater percentage compared with harmonic endings when only 1 pitch class was shared (22.73%) or none (17.01%).

Means of the time ratios, for overall responses and split into three categories of stimuli depending on the number of shared pitch classes (s.pc.). Crosses in the boxplots stand for the means of the individual means.
Response Strategies
As stated above, participants completed a questionnaire in which they were asked to detail their strategies for choosing the yellow triangles after watching the tutorial. Although we did not provide aprioristic response options, it was possible to detect 5 main tendencies—not necessarily exclusive—in the participants’ answers:
An explicit reference to the quality of the chords and/or the orientation of the triangles. An explicit reference to the number of shared pitches between chords and/or the number of shared vertices between triangles. A reference to concepts like “proximity” or “distance” in relation to musical harmony and/or visual display. Alternative strategies mentioning pitches. Alternative strategies mentioning spatial features.
Strategies 1 and 2 respectively match with information explicitly provided in the video tutorial; Strategy 3 can be regarded as a particular elaboration of the information relating shared pitches and vertices; Strategy 4 mainly captures misconceptions about the spatial representation of pitches or pitch classes on the Tonnetz; Strategy 5 gathers additional approaches that are mostly detached from the aural elements of the experiment.
The distribution of selected strategies (Figure 7) shows a clear preference of Strategies 1 and 2 among Mus participants; unexpectedly, a large number of SciStu participants also mentioned Strategy 2. When Mus participants adopted both Strategies 1 and 2, their report were always written in this order: a check of the quality followed by the analysis of the shared pitches. More than a 40% of the SciPro participants provided unclear information about their strategies or left the question unanswered.

Histograms of the participants’ strategies after the video tutorial (attempt 2).
All this information comes from introspections after the task, which limits the ability to directly monitor the impact of the tracking itself. However, we have explored potential correlations between the declared strategies and the outcomes in terms of some of the variables previously analyzed. We opted for estimating correlations between variables indicating strategies and outcomes for both attempts; although the strategies exclusively concern the second attempt, comparison of the degrees of correlation between the two attempts may help to endorse the hypothesis of a potential impact of a given strategy. Notice that correlations with correctness and quality-recognition means that are close to 1 (anticorrelations close to −1) indirectly indicate a favorable (unfavorable) impact of the strategy. Conversely, correlations with perceived-distance-error and visual-bias means that are close to 1 (anticorrelations close to −1) indirectly indicate an unfavorable (favorable) impact of the strategy.
A pooled analysis of the correlations for Mus and Sci participants (Table 4) did not provide strong values—whether positive or negative—for any strategy; however, some noticeable changes emerged when comparing the two attempts: we focus on variations of correlations greater than .25 in absolute value. Mus participants show increasing variations—interpretable as a favorable impact—in the correlations of Strategy 2 with correctness and perceived-distance-error means. For this group, a decreasing variation—interpretable as an unfavorable impact—is observed in the correlations of Strategy 5 with all the studied means. Concerning the Sci participants, the clearest variation in the correlations is the one between Strategy 1 and quality and perceived-distance-error means.
Pearson correlations between the standardized means of previously analyzed data (C: correct answer; Q: recognition of quality; D: perceived distance error; B: induced visual bias) and the strategies declared by the participants after the second trial. Values in italics indicate correlations whose absolute values are greater than .30. Bold numbers indicate variations between attempt 1 and attempt 2 whose absolute values are greater than .25.

Some answers corresponding to Strategies 4 and 5 warrant an additional comment. According to Mus participants’ answers, some of them believed that the vertices of the Tonnetz stood for actual pitches instead of pitch classes, thus facilitating the representation of voice leading. Finally, one of the SciPro participants provided a very insightful answer: “Although I am aware that I am wrong, the only logical answer for me is to follow the alignment of the triangles”; 9 not surprisingly, this person scored 12 for the induced visual bias in both attempts.
Group Similarity
Differences between groups in terms of the evenness of the eigenvalues are summarized in Table 5; the lower the indexes, the more dissimilar are the subgroups. MusPro participants do not differ significantly from MusStu ones, but they do differ significantly from both SciPro and SciStu participants; group SciPro differs significantly from both MusPro and MusStu participants but not from group SciStu.
Similarity between the a priori-defined groups of participants: Jaccard indices. p-values in italics correspond to significant cases.

The results of the correlation between the fuzzy sets of the groups—for details, see Appendix B—indicated that MusPro participants are characterized by the majority of the variables involved—both in number and in incidence rate. A more modest contribution was observed for groups SciPro and MusSci, while group SciStu is not characterized except by a few of the variables in play. Finally, Table 6 illustrates a complementary measure for group similarity–—the Jaccard similarity ratio between the fuzzy sets. Here, the higher the value, the greater the similarity between groups in terms of contribution of the variables. The two measures are consistent with each other, as the first one returns the similarity between groups in a probabilistic way, while the second provides relative weights of each variable within any group.
Similarity between the a priori-defined groups: Jaccard similarity ratios between the fuzzy sets.

Discussion
The analysis of group similarity confirmed that our criteria for distributing participants into the preconceived groups was worthwhile. In particular, this distribution is helpful for addressing the following discussion, mainly based in the participants’ previously acquired skills.
Influence of Skills in Music Theory
According to our first research hypothesis, the results confirmed a clear influence of previous knowledge in music theory on grasping the Tonnetz structure. Although the scores measuring the accurateness of the responses could suggest that group SciPro performed the task slightly better than group MusStu, outcomes on quality recognition and perceived distance error point in the opposite direction: Both MusPro and MusStu participants achieved better scores for these variables, compared to those in SciPro and SciStu groups, in both attempts; their improvement after the video tutorial was equally more evident. In particular, these results were mostly significant, statistically speaking, when the comparisons involved MusPro participants—especially when considering both attempts. Consequently, previous knowledge in music theory, in particularly good proficiency, led to better results.
It is, however, important to highlight some differences in the data concerning quality recognition and perceived distance error. As MusPro participants already scored significantly better results for quality recognition before the tutorial, and the influence of Strategy 1 was scarcely different in both attempts for this group, we believe that some of its members may have discovered by themselves, during the first attempt, the relationship between the quality of the triads and the triangular layouts of the Tonnetz. This hypothesis is consistent with the particularly high score on accuracy for MusPro participants from their first attempt: When randomly picking a yellow triangle with the restriction of correctly choosing the layout for half of the stimuli, the expected value of accuracy is 3 instead of 2, that is, much closer to the score provided by MusPro participants.
Some statistical data seem to also point to features of quality recognition affecting Sci participants’ responses. The statement of Strategy 1 is the most influential one regarding correlations of their results. It is, however, highly unlikely that, just by means of a short video tutorial, Sci participants were able to truly conceptualize the idea of major and minor chords from their qualia, as well as their geometrical correspondences within the Tonnetz. This statement apparently goes against the statistically significant improvement—barely, though—of SciPro participants when performing their second attempt, but we can provide arguments in support of this. Previous research with naive listeners has shown different responses to major and minor chords or tonal keys, like a preference for more harmonicity—i.e., major chords in our context (McDermott et al., 2010)—or different emotional meanings (Bakker & Martin, 2015). Our hypothesis is that, rather than being moved by a factual conceptualization and recognition of the quality of triads, those who improved their scores could have been guided by intuition, based on a sense of consonance or felt emotion while hearing the last chord.
Results from analysis of perceived distance error are more straightforward to interpret. Only the Mus participants clearly improved during the second attempt—with statistical significance in the case of group MusPro—and Strategy 2 appeared to be the most influential when looking at the correlations between different variables. In contrast, neither perceived distance error nor Strategy 2 played a meaningful role for Sci participants. Both aspects underline the need of prior knowledge in music theory, in combination with a short introductory explanation, for grasping—at least partially—the geometrical configuration of the Tonnetz beyond the very basic feature of its two elementary triangular layouts.
Induced Bias of the Tonnetz Geometry in Non-Functional Musical Contexts
In considering our second research hypothesis, we did not find the majority of the previous literature on multimodal features of music perception and cognition particularly meaningful. Although the effect of sound—especially music—accompanying moving images has raised some interest in the field of cognitive science—with a particular focus on affect (e.g., Boltz et al., 2009; Cohen, 2015) and multisensory integration (e.g., Lewald & Guski, 2003; Schmiedchen et al., 2012)—knowledge about consistent interactions of music with its visual counterpart representations is sparse.
As suspected, the geometrical directions induced by our stimuli on the Tonnetz had a stronger influence on the responses than any potential aprioristic image schema. Previous research confirms the predominance of the vertical schema of pitches in the evaluation of sound coordination with physical motion, whether imagined or visualized—for a review, consult Eitan (2017). Nevertheless, aural stimuli in these studies were often simpler—elementary melodic motions—than those we used—complex four-voice harmonic sequences. The most evident result in our study is the relationship between the visual alignment of the triangles and the participants’ skills in music theory. Results also showed the existence of a strong visual bias in the choice of the yellow triangle for all the participants in their first attempt, and also how it was mitigated after the video tutorial—mostly for the Mus participants. In addition, a subset of group SciPro behaved differently in the second attempt by always choosing the visually biased option. In the absence of formal knowledge of music theory, the use of geometrical logic, regardless of the aural features of the stimuli, was the best—and the only—option for a significant subset of participants proficient in visual abstraction. This seems to even reflect a lack of focus on—or failure to grasp anything from—the harmonic sequence being played. A subtler potential bias could be hidden in the answers by some Mus participants, this time involving, perhaps, the vertical schema for pitches: since several of those who adopted Strategy 5 mentioned pitch classes instead of pitches, and the correlation of this strategy was worse in the second attempt, we believe that such participants probably misunderstood the tutorial and tried to mentally project incongruent pitch schemata onto the Tonnetz.
Further Cognitive Issues around Non-Functional Musical Contexts
The use of sequences based on the PRL-family of neo-Riemannian operations deserves an additional comment. Musical passages based on a RL-progression are found, for instance, in Beethoven's oeuvre, LR-progressions are present in Chopin's work, and PL-progressions appear in Brahms’ music (Cohn, 2012). However, these kinds of progressions are proportionally scarce when compared with other passages of the common-practice period, which deal with more evident functional harmonic relationships.
Krumhansl's detection of the overlapping features in her model and in the Tonnetz (1998) works well in terms of contextual functional harmony. Relevant studies in the psychology of harmony—some of which were carried out by her—revealed the importance of the musical context for recognition of harmonic hierarchies and creation of expectation, without neglecting tonal modulation (e.g., Bharucha & Krumhansl, 1983; Bigand & Pineau, 1997; Krumhansl et al., 1982; Tillmann et al., 1998). Our stimuli were based on parsimonious harmonic relationships, instead of traditional tonal functions, and almost all of them—except for Major-RL and Minor-LR, see Appendix A—unfolded beyond diatonicism. All these facts, in combination with the visual counterpart of the experiment, demand a deeper consideration of the concepts of perceived proximity and expectation in the context of our study.
The scrutiny of the response time when performing a task may raise a controversial debate regarding the analysis of intuitive and reflective thinking (Isler & Yilmaz, 2023). However, in our study it points to clear evidence: larger response times in the second attempt revealed, on average and regardless of the group, a more thoughtful consideration for picking the yellow triangle. This depended neither on the reported reasoning strategies nor on the success in the choice of the triangle. Even those who barely understood the tutorial were aware of the existence of a robust logic behind the pitch space, and this could lead them to take more time, although their responses might have been basically intuitive. Other factors leading to this outcome may be related to the experimental conditions: feeling pressure to provide a correct answer, or the fact of being observed. Besides, the smaller time ratio when the last chord was reached parsimoniously—that is, with 2 pitch classes in common with the previous one—again regardless of the group, can be explained as due to contextual proximity. After the tutorial, participants responded faster if there was a strong resemblance between the two last chords in terms of common pitches through the voice leading. This does not mean, however, that their responses were necessarily correct; remember that groups MusPro and MusStu achieved worse scores in terms of accuracy during the second trial and in the case of parsimonious closures.
One might be tempted to say that, on average, the more pitch classes were in common, the lower the time ratio between the two attempts, but this statement fails in the case of group MusPro. Their higher proficiency in music theory probably explains why they required more time to perform the second trial when there was only 1 pitch class in common between the two last chords. This situation matches with Typologies 3 and 4, as explained in the Methods section, in which the roots of the last chords are separated by a perfect fourth or by a perfect fifth. Typologies 3 and 4 also differ in terms of quality, unlike what happens with Typologies 1 and 2, and with Typologies 5 and 6. During the experimental design, we predicted that such a difference would have facilitated the recognition of these cases for group MusPro after the tutorial—and this probably happened, given the clear improvement in the accuracy. We equally predicted—wrongly this time—faster responses in their second attempt. The best hypothesis to explain this divergence from our prediction arises from a collision between non-functional and functional harmony. Typologies 3 and 4 might create a functional cadential sensation, which clashes with the preceding parsimonious non-functional voice leading. Were MusPro participants perhaps trying to discover a rational cadential logic within the Tonnetz structure—probably without success, as that was not self-evident from the limited information of the video tutorial?
The following example may illustrate this hypothesis. Consider sequence Major-PL (Figure 8): the expected seventh triad, within the logic of the unfolded parsimonious progression, would be a B major chord, that is, a return to the first triad by keeping exactly the same pitches in the upper voices— therefore completing a hexatonic cycle (Cohn, 1996), as happens, for instance, in Brahms’ Double Concerto op. 102. Instead, the seventh triad is a semitone lower than expected, and this creates a strong contrast in the context of parsimonious voice leading. At the same time, the perfect-fourth motion of the root when reaching the last chord induces an accomplished cadential effect: By considering B♭[.18] major as the tonic chord, the last four triads unfold a vi-IV-iv-I progression, that is, the pronounced settling of a minor plagal cadence.

Transcription, according to standard music notation, of sequence Major-PL (see Appendix A).
Limitations of the Study and Future Research
A clear limitation in the design of our experiment comes from the presentation of the questionnaire only after having completed the tasks on the tablet, instead of having requested deep introspection after each attempt. Our choice was aimed at not interrupting the interaction with the audiovisual material, but clearly weakened the analysis of participants’ strategies. In addition, the information collected for this purpose has some gaps: The fact that Strategy 1 always preceded Strategy 2 when both were declared by the participants does not automatically entail this order while performing the task after the tutorial. Even if the order reported in the questionnaire reflects what participants truly did, we cannot know if such an order might have been induced by how data were presented in the tutorial—which was, however, more coherent for an appropriate understanding.
Coloring the Tonnetz may have also induced an undesired bias. We opted for a warm color matching with major-triad triangles and for a cold color matching with minor-triad triangles, followed by a third different color for the possible answers. Although no participant reported any issue concerning colors in their declared strategies, we cannot measure the potential influence of our choice—that is, colors might perhaps have been pivotal for some participants in the recognition of layouts. We are aware that the use of colors is not an optimal option for settling cross-modal correspondences involving pitch, harmony, or tonal keys, as research on synesthesia reports weak or arbitrary relationships in this sense (e.g., Isbilen & Krumhansl, 2016; Letailleur et al., 2020; Petrović et al., 2012); therefore, other options might have been more appropriate. 10 Moreover, auditory-visual synesthesia may have geometric counterparts (Chiou et al., 2013); this condition could have been taken into account, perhaps, as an additional criterion for participants’ exclusion.
We have purposely avoided the use of the term “learning” in the Methods and Discussion sections. Of course, watching the tutorial led many participants to learn something about the Tonnetz, and this had an impact on the results during the second attempt—especially for those skilled in music theory. Nevertheless, the whole experiment was conceived for inspecting a first-sight interaction. Based on our current results, we are able to plan long-term experimental protocols for a more detailed measurement of the learning process; they may include, for instance, methods for eye tracking (Fink et al., 2019) to better grasp the visual features of human–computer interaction with the Tonnetz. Improvements could also include a more varied cohort of professional musicians, as our group MusPro involved people who mainly focused on the common practice music period. For instance, octatonic systems are important in the context of jazz, as has recently been empirically tested (Cecchetti et al., 2023); such a different population might respond differently when dealing with Tonnetz-based software. It could be also interesting to use more varied stimuli in terms of extraharmonic features (Jimenez et al., 2020; Jimenez, 2023). Finally, the detected clash between functional and non-functional harmonic contexts may inspire further research. This could be particularly useful when considering the whole harmonic progression—instead of primarily focusing on the concluding harmonic motion, as we have done in this study.
Footnotes
Acknowledgments
We warmly thank África Castillo Morales (Faculty of Physics) and Raquel Díaz Sánchez (Faculty of Mathematics) of the Universidad Complutense de Madrid for helping us to recruit participants. We also thank Xavier Hascher for the English translation of the video tutorial, José O. Martins for his careful reading of the first version of our manuscript, and the reviewers for their valuable criticism.
Action Editor
Adam Ockelford, University of Roehampton, School of Education
Peer Review
Fabian Moss, Julius-Maximilians-Universitat Wurzburg, Institut für Musikforschung
Contributorship
José L. Besada: overall coordination, experimental design, collection of participants’ data, interpretation of statistical data, article writing (corresponding author). Erica Bisesi: experimental design, collection of participants’ data, statistical analysis of raw data, article writing. Corentin Guichaoua and Moreno Andreatta: software development, article writing.
Data Availability Statement
According to the consent of the Research Ethics Committee, raw data will be only available upon direct request to the corresponding author.
Declaration of Conflicting Interests
The authors declared no potential conflicts of interest with respect to the research, authorship, and/or publication of this article.
Ethics Statement
All participants provided informed consent, and the protocol for collecting and managing data was approved by the Research Ethics Committee of the Universidad Complutense de Madrid (ref. CE_20210415-04_HUM).
Funding
This research was carried on within the ProAppMaMu project, awarded to Moreno Andreatta, which received financial support from the French CNRS through the MITI interdisciplinary programs. We acknowledge the support by the Interdisciplinary Thematic Institute CREAA, as part of the ITI 2021-2028 program of the Université de Strasbourg, the CNRS, and the Inserm, funded by IdEx Unistra (ref. ANR-10-IDEX-0002) and by SFRI-STRAT’US (ref. ANR-20-SFRI-0012) under the French Investments for the Future Program. In addition, José L. Besada is funded by a “Ramón y Cajal” grant (ref. RYC2020-028670-I) by the Spanish MICIU/AEI/10.13039/501100011033 and the European Social Fund.
Notes
Appendix A
Harmonic sequences used in our study, expressed by MIDI values. Capital letters denote major chords, whereas small letters denote minor chords. The name of each sequence reflects the quality of its first triad and the parsimonious transformations involved in the chord progression. The 6 columns on the right side show the triads per sequence which were chosen for visual representatives of the 6 possible typologies (see Table 1); each grey cell matches with the true response.
Sequence
1st triad
2nd triad
3rd triad
4th triad
5th triad
6th triad
7th triad
T 1
T 2
T 3
T 4
T 5
T 5/6
Major
RPE♭
51, 63, 67, 70c
48, 63, 67, 72C
60, 64, 67, 72a
57, 64, 69, 72A
57, 64, 69, 73f♯
54, 66, 69, 73f
53, 68, 72, 77F♯
D
c♯
C♯
f
g
Minor
RPd
50, 65, 69, 74F
53, 65, 69, 72f
41, 65, 68, 72A♭
44, 63, 68, 72g♯
44, 63, 68, 71B
47, 63, 66, 71d♯
51, 63, 66, 70b
d♯
E
e
B♭
C
Major
PRF
53, 69, 72, 77f
53, 68, 72, 77A♭
56, 68, 72, 75g♯
44, 68, 71, 75B
47, 66, 71, 75b
47, 66, 71, 74D
50, 66, 69, 74D
G
f♯
E
c
a♯
Minor
PRg
43, 67, 70, 74G
55, 67, 71, 74e
52, 67, 71, 76E
52, 68, 71, 76c♯
49, 68, 73, 76C♯
49, 68, 73, 77g♯
49, 68, 73, 77a♯
f
F♯
g♯
C
D
Major
LRA
45, 64, 69, 73c♯
49, 64, 68, 73E
52, 64, 68, 71g♯
44, 63, 68, 71B
47, 63, 66, 71d♯
51, 63, 66, 70e
52, 59, 64, 67E♭
F♯
a♯
A♭
e
a
Minor
LRe
52, 67, 71, 76C
48, 67, 72, 76a
45, 69, 72, 76F
53, 69, 72, 77d
50, 69, 74, 77B♭
46, 70, 74, 77g
55, 70, 74, 79g
a♯
E♭
f
A
E
Major
RLB♭
46, 62, 65, 70g
55, 62, 67, 70E♭
51, 63, 67, 70c
48, 63, 67, 72A♭
56, 63, 68, 72f
53, 65, 68, 72a♯
58, 65, 70, 73C♯
F
a♯
C
e
b
Minor
RLf♯
54, 66, 69, 73A
57, 64, 69, 73c♯
49, 64, 68, 73E
52, 64, 68, 71g♯
56, 63, 68, 71B
47, 63, 66, 71F
53, 60, 65, 69e♭
b
F♯
e
C
F
Major
LPC
48, 67, 72, 76e
52, 67, 71, 76E
52, 68, 71, 76g♯
56, 68, 71, 75G♯
44, 68, 72, 75c
48, 67, 72, 75E♭
51, 67, 70, 75C
E♭
g
F
b
f♯
Minor
LPc♯
49, 64, 68, 73A
45, 64, 69, 73a
57, 64, 69, 72F
53, 65, 69, 72f
53, 65, 68, 72C♯
49, 65, 68, 73F♯
54, 66, 70, 73c♯
a♯
F♯
g♯
D
G
Major
PLB
47, 71, 75, 78b
59, 71, 74, 78G
55, 71, 74, 79g
55, 70, 74, 79E♭
51, 70, 75, 79e♭
63, 70, 75, 78B♭
58, 70, 74, 77B
F♯
g♯
B♭
e
a
Minor
PLg♯
56, 63, 68, 71G♯
44, 63, 68, 72c
48, 63, 67, 72C
48, 64, 67, 72e
52, 64, 67, 71E
40, 64, 68, 71B♭
46, 62, 65, 70g♯
c♯
B
a
E♭
B♭
Appendix B
Degree of belonging of different variables to each of the a priori-defined groups. Bold numbers indicate significant values—i.e. greater than 0.26, according to Fisher’s table for (88-2) degrees of freedom. Data depends on previously analyzed variables (Tr: Time ratio; C: correct answer; Q: recognition of quality; D: distance; B: induced visual bias; S
x
: strategy number x); sub-indices for Tr and C stand for the number of shared pitch classes between the two last chords of the stimuli. Different attempts are equally specified when necessary (A1: attempt 1; A2: attempt 2). M stands for mean; SD for standard deviation; Mdn for median.
0.25
0.25
0.26
0.25
0.23
0.23
0.24
0.23
0.23
0.23
0.25
0.24
0.24
0.23
0.24
0.25
0.18
0.24
0.20
0.19
0.26
0.23
0.26
0.19
0.24
0.25
0.25
0.24
0.26
0.25
0.24
0.24
0.24
0.24
0.25
0.25
0.21
0.25
0.00
0.13
0.10
0.14
0.14
0.10
0.25
0.18
0.23
0.19
0.17
0.18
0.10
0.21
0.02
0.17
0.22
0.13
0.16
0.18
0.00
0.21
0.24
0.10
0.21
0.18
0.22
0.12
0.17
0.09
0.21
0.22
0.00
0.06
0.10
0.00
0.19
0.20
0.14
0.18
0.20
0.03
0.20
0.21
0.16
0.11
0.20
0.02
0.18
0.24
0.00
0.06
0.07
0.03
0.13
0.21
0.04
0.26
0.25
0.24
0.19
0.23
0.23
0.16
0.20
0.13
0.21
0.26
0.18
0.21
0.29
0.23
0.23
0.25
0.20
0.23
0.23
0.20
0.23
0.23
0.25
0.25
0.25
0.19
0.17
0.26
0.26
0.25
0.22
0.12
0.18
0.02
0.22
0.24
0.19
0.08
0.03
0.06
0.20
0.16
0.16
0.21
0.09
0.21
0.06
0.15
0.15
0.20
0.26
0.16
0.20
0.14
0.05
0.00
0.00