
Abstract
Visual imagery has been proposed to be one of eight mechanisms by which music induces emotion in listeners. Initial research into aphantasia, a condition referring to individuals who do not (or only minimally) form visual imagery in their mind's eye, suggests that aphantasics may experience reduced emotional experiences in response to imagined stimuli. In this two-part online investigation, we sought to explore the emotional experiences of aphantasics within the context of music listening. In Survey 1, we compared 51 aphantasics to 51 control individuals in terms of their experiences of visual imagery, liking, and felt emotional intensity when listening to three film music excerpts. We found significant group differences in terms of visual imagery and felt emotional intensity, but not liking. In Survey 2, we examined aphantasics’ ability to recognize emotions conveyed by music, and their patterns of experience of, and engagement with, music in everyday life by comparing the responses of 29 aphantasics with 29 matched controls. We found no differences in terms of emotion discrimination ability. However, aphantasics generally experienced less Reminiscence (dimension from the Adaptive Functions of Music Listening scale) to music, as well as fewer Episodic Memories (dimension from the MecScale). Aphantasics and control listeners did not exhibit differences in terms of sensitivity to musical reward (measured using the BMRQ) or in terms of musical sophistication (measured using the Gold-MSI). Finally, our findings suggest nuanced differences between controls and those with pure and minimal aphantasia. In all, we reveal the influence that aphantasia can have on emotional responses to music and thus provide further evidence for the relationship between visual imagery and music-induced emotion.
Introduction
Many people use visual imagery to make sense of their surroundings. For instance, they create mental schemas of the environment to consolidate memories of past events and situations (Holmes et al., 2008). However, for a small percentage of the general population (2.1–2.7%, Faw, 2009; 2–5%, Galton, 1880), attempts to visualize an object lead to no sensorial experience of it. The term to denote this phenomenon, aphantasia, was originally coined by Zeman et al. (2015), who described the condition as being characterized by ‘reduced or absent voluntary imagery’ (p. 4).
Research into aphantasia so far has tended to rely on self-report questionnaires such as the Vividness of Visual Imagery Questionnaire (Marks, 1973) or the Plymouth Sensory Imagery Questionnaire (Andrade et al., 2014) as diagnostic tools. Based on this need to rely on self-report and subjective accounts from aphantasics, it has been debated whether aphantasia is characterized by a real absence of visual imagery or by poor metacognitive and introspective abilities (Keogh, Pearson et al., 2021; Keogh & Pearson, 2018). Recently, however, objective evidence of poor visual imagery ability has been suggested by neuroscientific and physiological data. For instance, when asked to imagine famous faces and buildings in an fMRI study, low visual imagers activated a widespread set of brain areas negatively associated with imagery vividness when compared to high visual imagers, who predominantly showed restricted brain activations in the posterior cortices (Fulford et al., 2018). Similarly, Kay et al. (2022) asked aphantasics and controls to compare the brightness of a grey square to a prime, and found that aphantasics did not display the typical pupillary light response (a reflex of the pupil to expand and constrict in response to changes in light) in response to illusory brightness that the control group did.
One experience that visual imagery is often associated with is that of emotion induction (Andrade et al., 1997; Holmes & Mathews, 2005; Taruffi et al., 2017) and it has been suggested that visual imagery enhances emotional response through the simulation of imagined situations (Holmes et al., 2008). While research into the emotional associations of aphantasics is still in its infancy, initial research has found that a lack of visual imagery ability can lead to attenuated emotional response, specifically minimized physiological effects accompanying fear-based visual imagery (Wicken et al., 2021). In fact, some studies show that about half of their aphantasic samples report significantly lower imagery across all other sensory modalities (Zeman et al., 2015, 2020), as well as reduced emotional experiences (Dawes et al., 2020). Still, findings in this regard are not always consistent; Zeman et al. (2020) did not find the same lack of emotional experience in aphantasics, instead showing that some aphantasics’ dreams comprise emotions, amongst other experiences such as textual and conceptual forms. Further, aphantasics have even been shown to be subject to similar levels of sensory reactions in response to trauma when compared to controls (Dawes et al., 2020). Thus, it is possible that one would find attenuated emotional reactions in response to the recollections of episodic events in the case of memories (suggesting a constructive role of visual imagery), but not in response to perceptual stimuli more generally (like music).
Links between visual imagery and emotional response are also important in the realm of music (see Taruffi & Küssner, 2019, 2022), and it has become clear that they interact (Balteș & Miu, 2014; Day & Thompson, 2019; Hashim et al., 2020). For example, a study by Cespedes-Guevara and Dibben (2022) found links between the narrative and content of listeners’ visual imagery reports and emotional descriptions that had been provided prior to music listening. In line with Juslin and Västfjäll's (2008) proposal that visual imagery is one of eight mechanisms (Juslin, 2013) potentially mediating the relationship between music and emotional response, a qualitative study into the content of visual imagery showed that emotional experiences occupied a second-order theme amongst other prevalent subthemes (e.g., abstract imagery, memories; Hashim et al., 2023). Further, Vuoskoski and Eerola (2015) argued that visual imagery evoked by narrative descriptions of a sad music track may have enhanced feelings of sadness indicated via a bias in word memory recall. Moreover, in a study by Hashim et al. (2020), which aimed to examine the effects of suppressed visual imagery on emotional response, it was found that listeners required to do an eye-movement task experienced significantly lower amounts of (and less vivid) visual imagery as well as minor reductions in emotional response when compared to a no-task control condition. In all, it would appear that visual imagery experience and emotional response are strongly connected, and that aphantasics may demonstrate a reduced ability to experience emotions from music.
Finally, a pressing question is how reduced visual imagery ability may affect the aesthetic judgment of music. The vividness of the visual imagery that music induces has previously been shown to be a strong predictor of the aesthetic pleasure of poetry: specifically, haikus and sonnets (Belfi et al., 2017). Examining the factors that might predict music's aesthetic appeal, Belfi (2019) similarly found that that the vividness of visual imagery followed only felt emotional valence in explaining the aesthetic appeal of music from classical, jazz, and electronica genres. One possibility, therefore, is that aphantasics, due to their reduced visual imagery ability, may show reduced aesthetic pleasure and reward from music listening, and accordingly, may show reduced engagement with it in everyday life.
The Present Research
Taken together, existing literature supports the idea that a lack of visual imagery could be associated with reduced, or dampened, emotional response and aesthetic appeal in relation to music. Where previous studies have approached the question of the relationship between music-induced visual imagery and emotion induction by measuring reaction times of visual imagery and emotion onset (Day & Thompson, 2019), by using emotive written descriptions with the potential to enhance visual imagery (Vuoskoski & Eerola, 2015), and by active suppression of visual imagery (Hashim et al., 2020) amongst the general population, our research sought to contribute to this question by comparing the experiences of aphantasics with the experience of a sample of typical listeners.
The aim of the current research was to understand the impact that having little-to-no visual imagery ability may have on the emotional experiencing of music (Survey 1). Further, we aimed to understand whether this may lead to distinct patterns in emotion recognition ability as well as in the experience and engagement with music in everyday life (Survey 2). Taken together, by providing a general impression of aphantasics’ affective and aesthetic experiences of music, we hoped to both guide further research into the understanding of aphantasia as a condition within the population, and to advance understanding of visual imagery during music listening.
Survey 1
Aphantasics have been proposed to show weaker affective experiences across a range of imagined contexts and situations (Dawes et al., 2020; Kay et al., 2022; Wicken et al., 2021; Zeman et al., 2015, 2020), but is this also true of music-related experiences? In Survey 1, we sought to gain a general understanding of the differences between aphantasic and control listeners’ affective and aesthetic responses to music. We recruited a sample of listeners with aphantasia and compared them to a subset of age- and gender-matched typical listeners previously recruited in a study by Hashim et al. (2023). Participants listened to the same three short film excerpts (Eerola & Vuoskoski, 2011) used by Hashim and colleagues and, after each excerpt, were asked to rate their experiences of visual imagery prevalence and vividness, music liking, and felt emotional intensity in response using individual continuous Likert scales.
We predicted that we would observe significantly lower reports of visual imagery prevalence (how much imagery was experienced) and visual imagery vividness (how clearly it was imagined) in aphantasics than in the control group (
Methods
Participants
76 complete submissions were initially received from a pool of self-proclaimed aphantasics. These aphantasics were recruited through dedicated Facebook groups.
From these, we set a criterion to include only pure (individuals that report seeing no image at all in their mind's eye in response to all VVIQ items, and therefore obtain the lowest summed VVIQ score of 16 out of 80) and minimal aphantasics (individuals that report seeing very few images in their mind's eye in response to VVIQ items, and therefore obtain a summed score of 17–30 out of 80). Consequently, 51 participants remained (pure = 33, minimal = 18) and were included in further analyses (aged 21–83, 39 females, 11 males, 1 prefer not to say, M = 53.6, SD = 14.8). In terms of location, 39.2% (n = 20) of respondents were residents of the UK, 33.3% (n = 17) of the USA, 11.8% (n = 6) of Canada, 5.9% (n = 3) of Australia, 2.0% (n = 1) of Germany, 2.0% (n = 1) of France, 2.0% (n = 1) of Luxembourg, 2.0% (n = 1) of Taiwan, and 2.0% (n = 1) of Indonesia.
For our control sample, we included a subset of the sample recruited using Prolific (an online platform that facilitates participant recruitment; www.prolific.com) in a study by Hashim et al. (2023; aged 18–66 years, 153 females, 198 males, 2 prefer not to say; M = 26.41, SD = 9.41), with the aim of matching them as closely as possible in terms of age and gender. Visual inspection of the original dataset collected by Hashim and colleagues showed a prominent positive skew in age. An initial attempt to match the control sample with our aphantasic sample as closely as possible led to the exclusion of 13 respondents from both groups at the 67–83 age range. Thus, to avoid these exclusions, we recruited a further 13 general respondents within that age range to facilitate age and gender matching, which resulted in 51 control respondents successfully closely matched in age and gender (aged 21–77 years, 39 females, 11 males, 1 prefer not to say, M = 50.0, SD = 15.5) that were included in further analyses. All individuals within our control sample possessed summed VVIQ scores of 30+, making them an appropriate non-aphantasic control group due to their sufficient general visual imagery abilities. In terms of location, 35.3% (n = 18) of respondents were residents of the UK, 15.7% (n = 8) of Canada, 7.8% (n = 4) of Germany, 5.9% (n = 3) of the USA, 5.9% (n = 3) of Portugal, 5.9% (n = 3) of Poland, 3.9% (n = 2) of Chile, 3.9% (n = 2) of Latvia, 3.9% (n = 2) of Spain, 2.0% (n = 1) of Italy, 2.0% (n = 1) of Greece, 2.0% (n = 1) of Israel, 2.0% (n = 1) of the Netherlands, 2.0% (n = 1) of Mexico, and 2.0% (n = 1) of Sweden.
Independent samples t-tests confirmed that there were no differences between our two participant groups in terms of age, t(99.7) = 1.21, p = .230, but that there was a significant difference between the aphantasic (M = 1.17, SD = 0.28) and control groups (M = 3.68, SD = 0.75) in terms of their VVIQ mean scores, t(63.6) = 22.29, p < .001.
Materials and Stimuli
Three film music stimuli conveying happy, tender, and fearful emotions were selected from Eerola and Vuoskoski's (2011) database. These excerpts were obtained from the catalogue of extended 1-min film excerpts (see Appendix of Vuoskoski et al., 2012), validated to be unfamiliar to most listeners. The excerpt conveying happy emotions was taken from The Untouchables soundtrack (track 6, number 071 from Eerola and Vuoskoski's set of 110 tracks). The tender excerpt is from the Shine soundtrack (track 10, number 042 from the 110 set). Finally, the fearful excerpt is from the Batman Returns soundtrack (track 5, number 011 from the 110 set). These excerpts were chosen in the original study by Hashim et al. (2023) to reflect only a subset of contrasting emotions that could induce a rich and varied range of visual imagery content. The main purpose of that study was not to explore music-induced emotions; thus, it did not include any other emotions from Eerola and Vuoskoski's database (namely, anger and sadness). To ensure uniformity amongst the musical excerpts, as well as to control the overall length of the survey, all excerpts were edited to last a duration of 45 s using Audacity (Version 2.3.2.0). We did not anticipate this to compromise the excerpts’ cited abilities to induce their intended emotions, given that the original set of 110 tracks from Eerola and Vuoskoski's collection had included even shorter segments of these same excerpts that maintained their validity. The excerpts were also edited to finish with a fade-out to avoid an abrupt ending.
Visual imagery ratings were obtained using two items from Pekala's (1991) Phenomenology of Consciousness Inventory (PCI), a 53-item questionnaire that measures a variety of personal perceptual experiences revolving around consciousness. Participants were asked about the prevalence of imagery in their experience (1 = I experienced no visual imagery at all, to 7 = I experienced a great deal of visual imagery [Q.12]), and the vividness of their imagery (1 = My visual imagery was so vague and diffuse, it was hard to get an image of anything, to 7 = My visual imagery was so vivid and three-dimensional, it seemed real [Q.18]).
Liking ratings in response to the music were measured using a 5-point Likert scale, from 1 = Dislike a great deal, to 5 = Like a great deal. Felt emotional intensity ratings were also measured using a 5-point Likert scale, from 1 = Not at all intense to 5 = Extremely intense.
Finally, the Vividness of Visual Imagery Questionnaire (VVIQ; Marks, 1973) was administered as an independent measurement of visual imagery ability. The VVIQ comprises 16 statements to which individuals are instructed to form a visual mental image in their minds (e.g., ‘Visualize a rising sun. Consider carefully the picture that comes before your mind's eye.’, ‘A rainbow appears’, etc.). The participants rated the vividness of their visual mental image of the statement along a 5-point Likert scale from 1 = No image at all, you only ‘know’ that you are thinking of an object to 5 = Perfectly clear and vivid as real seeing. VVIQ possesses a Cronbach's alpha reliability score of α = 0.74.
Procedure
Participants were first provided with the aims, instructions, and a definition of visual imagery as “the spontaneous formation of visual images or pictures in your mind's eye. Your imagery experience is completely subjective, and it is completely acceptable not to have experienced any imagery at all.” The online survey took approximately 12 mins to complete and was built and presented using Qualtrics. Aphantasic participants were invited to take part in the survey via email, whereas the control sample accessed the link through an advertisement distributed on Prolific. The presentation order of musical stimuli was randomized across participants.
Participants were advised to use good-quality, preferably noise-cancelling headphones (though it was not formally checked whether this advice was adhered to) and to have minimal outside disturbance throughout the study. For the three main trials, participants were first presented with the film music excerpt. They were instructed to listen to the whole excerpt before they would be presented with questions regarding their experience of the music on the following page. After listening, participants were asked to rate the amount and vividness of their visual imagery. Participants were also asked to rate how much they liked the music, and how intense any felt emotional response to the music was. At the end of the survey, participants completed the VVIQ.
Analysis
Statistical analyses were run in R (Version 4.2.3; R Core Team, 2018). To account for likely violations in normally distributed data in at least one of our sample groups, we opted to run linear mixed effects models to assess differences in the relationships between the aphantasic and control groups in terms of their experiences to the film music excerpts. To this end, four models were run, using the lme4 (Bates et al., 2015) and lmerTest (Kuznetsova et al., 2017) packages in R, with the four behavioral measures (prevalence and vividness of visual imagery, liking, and felt emotional intensity) as dependent variables, with Group (aphantasic and control) as fixed effect as well as participant and musical excerpt as random effects in each model.
In an additional set of analyses, we sought to check whether there were any qualitative differences between those within our aphantasia sample who were either pure aphantasics (individuals who provided the lowest VVIQ scores, i.e., experiencing no visual imagery at all) or minimal aphantasics (individuals who provided VVIQ scores of up to 30, i.e., experiencing minimal amounts of visual imagery) by rerunning the same models to assess these subgroups against controls separately. Independent samples t-tests maintained that there were negligible differences in age between the pure aphantasics (M = 53.88, SD = 14.11) and controls (M = 49.98, SD = 15.41), t(222.25) = 2.07, p = .040, and no differences between the minimal aphantasics (M = 53.11, SD = 15.83) and controls (M = 49.98, SD = 15.41), t(90.8) = 1.26, p = .212. Bonferroni correction was applied to these models to correct for multiple comparisons, leading to an adjusted alpha level of .013.
Further, we ran two additional linear mixed models to address our hypotheses regarding the relationship between the prevalence and vividness of visual imagery and the liking, felt emotional intensity, and VVIQ mean scores. Prevalence and vividness were entered as dependent variables in each of the two models, with liking, felt emotional intensity, and VVIQ entered as fixed effects, including participant, musical excerpts, and sample group as random effects. Bonferroni correction was also applied here, leading to an adjusted alpha level of .025.
Results
Prevalence
Out of all the ratings of the 51 pure and minimal aphantasic respondents collapsed across the three music excerpts, 5.9% (n = 3) reported experiencing at least mild levels (a rating of 2 and upwards) of visual imagery during listening, while 94.1% (n = 48) reported experiencing no visual imagery at all. Similarly, regarding visual imagery vividness, 5.9% (n = 3) participants also reported at least mild levels of vividness (a rating of 2 and upwards).
Out of all the ratings of the 51 control respondents collapsed across the three music excerpts, 94.1% (n = 48) reported experiencing at least mild levels (a rating of 2 and upwards) of visual imagery during listening, and 5.9% (n = 3) reported experiencing no visual imagery at all. Regarding visual imagery vividness, 90.2% (n = 46) participants also reported at least mild levels of vividness (a rating of 2 and upwards).
Differences in Behavioral Data Between Aphantasic and Control Groups
In the model predicting prevalence of visual imagery, results indicated significant differences between the aphantasic (M = 1.19, SD = 0.75) and control groups (M = 4.70, SD = 1.87), whereby control participants experienced more visual imagery than aphantasics (ß = 3.49, SE = 0.24, t = 14.57, p < .001, partial η2 = .68, 95% CI [0.60, 1.00]). The model predicting vividness of visual imagery also showed there to be significant differences between the aphantasic (M = 1.11, SD = 0.49) and control groups (M = 4.53, SD = 1.89), with controls reporting higher vividness (ß = 3.41, SE = 0.26, t = 13.21, p < .001, partial η2 = .65, 95% CI [0.56, 1.00]). The model predicting felt emotional intensity similarly showed the control group (M = 3.08, SD = 1.21) to report significantly higher felt emotional intensity in response to the music than aphantasics (M = 2.49, SD = 1.18; ß = 0.58, SE = 0.19, t = 3.04, p = .003, partial η2 = .09, 95% CI [0.02, 1.00]). However, the model predicting music liking did not exhibit any differences between the aphantasic (M = 3.27, SD = 1.09) and control (M = 3.36, SD = 1.22) groups (ß = 0.09, SE = 0.13, t = 0.69, p = .490). Assessment of model assumptions using graphical means (histograms and Q-Q plots) indicated that residuals and random effects for both models satisfy normality. See Figure 1 for a visualization of these results.
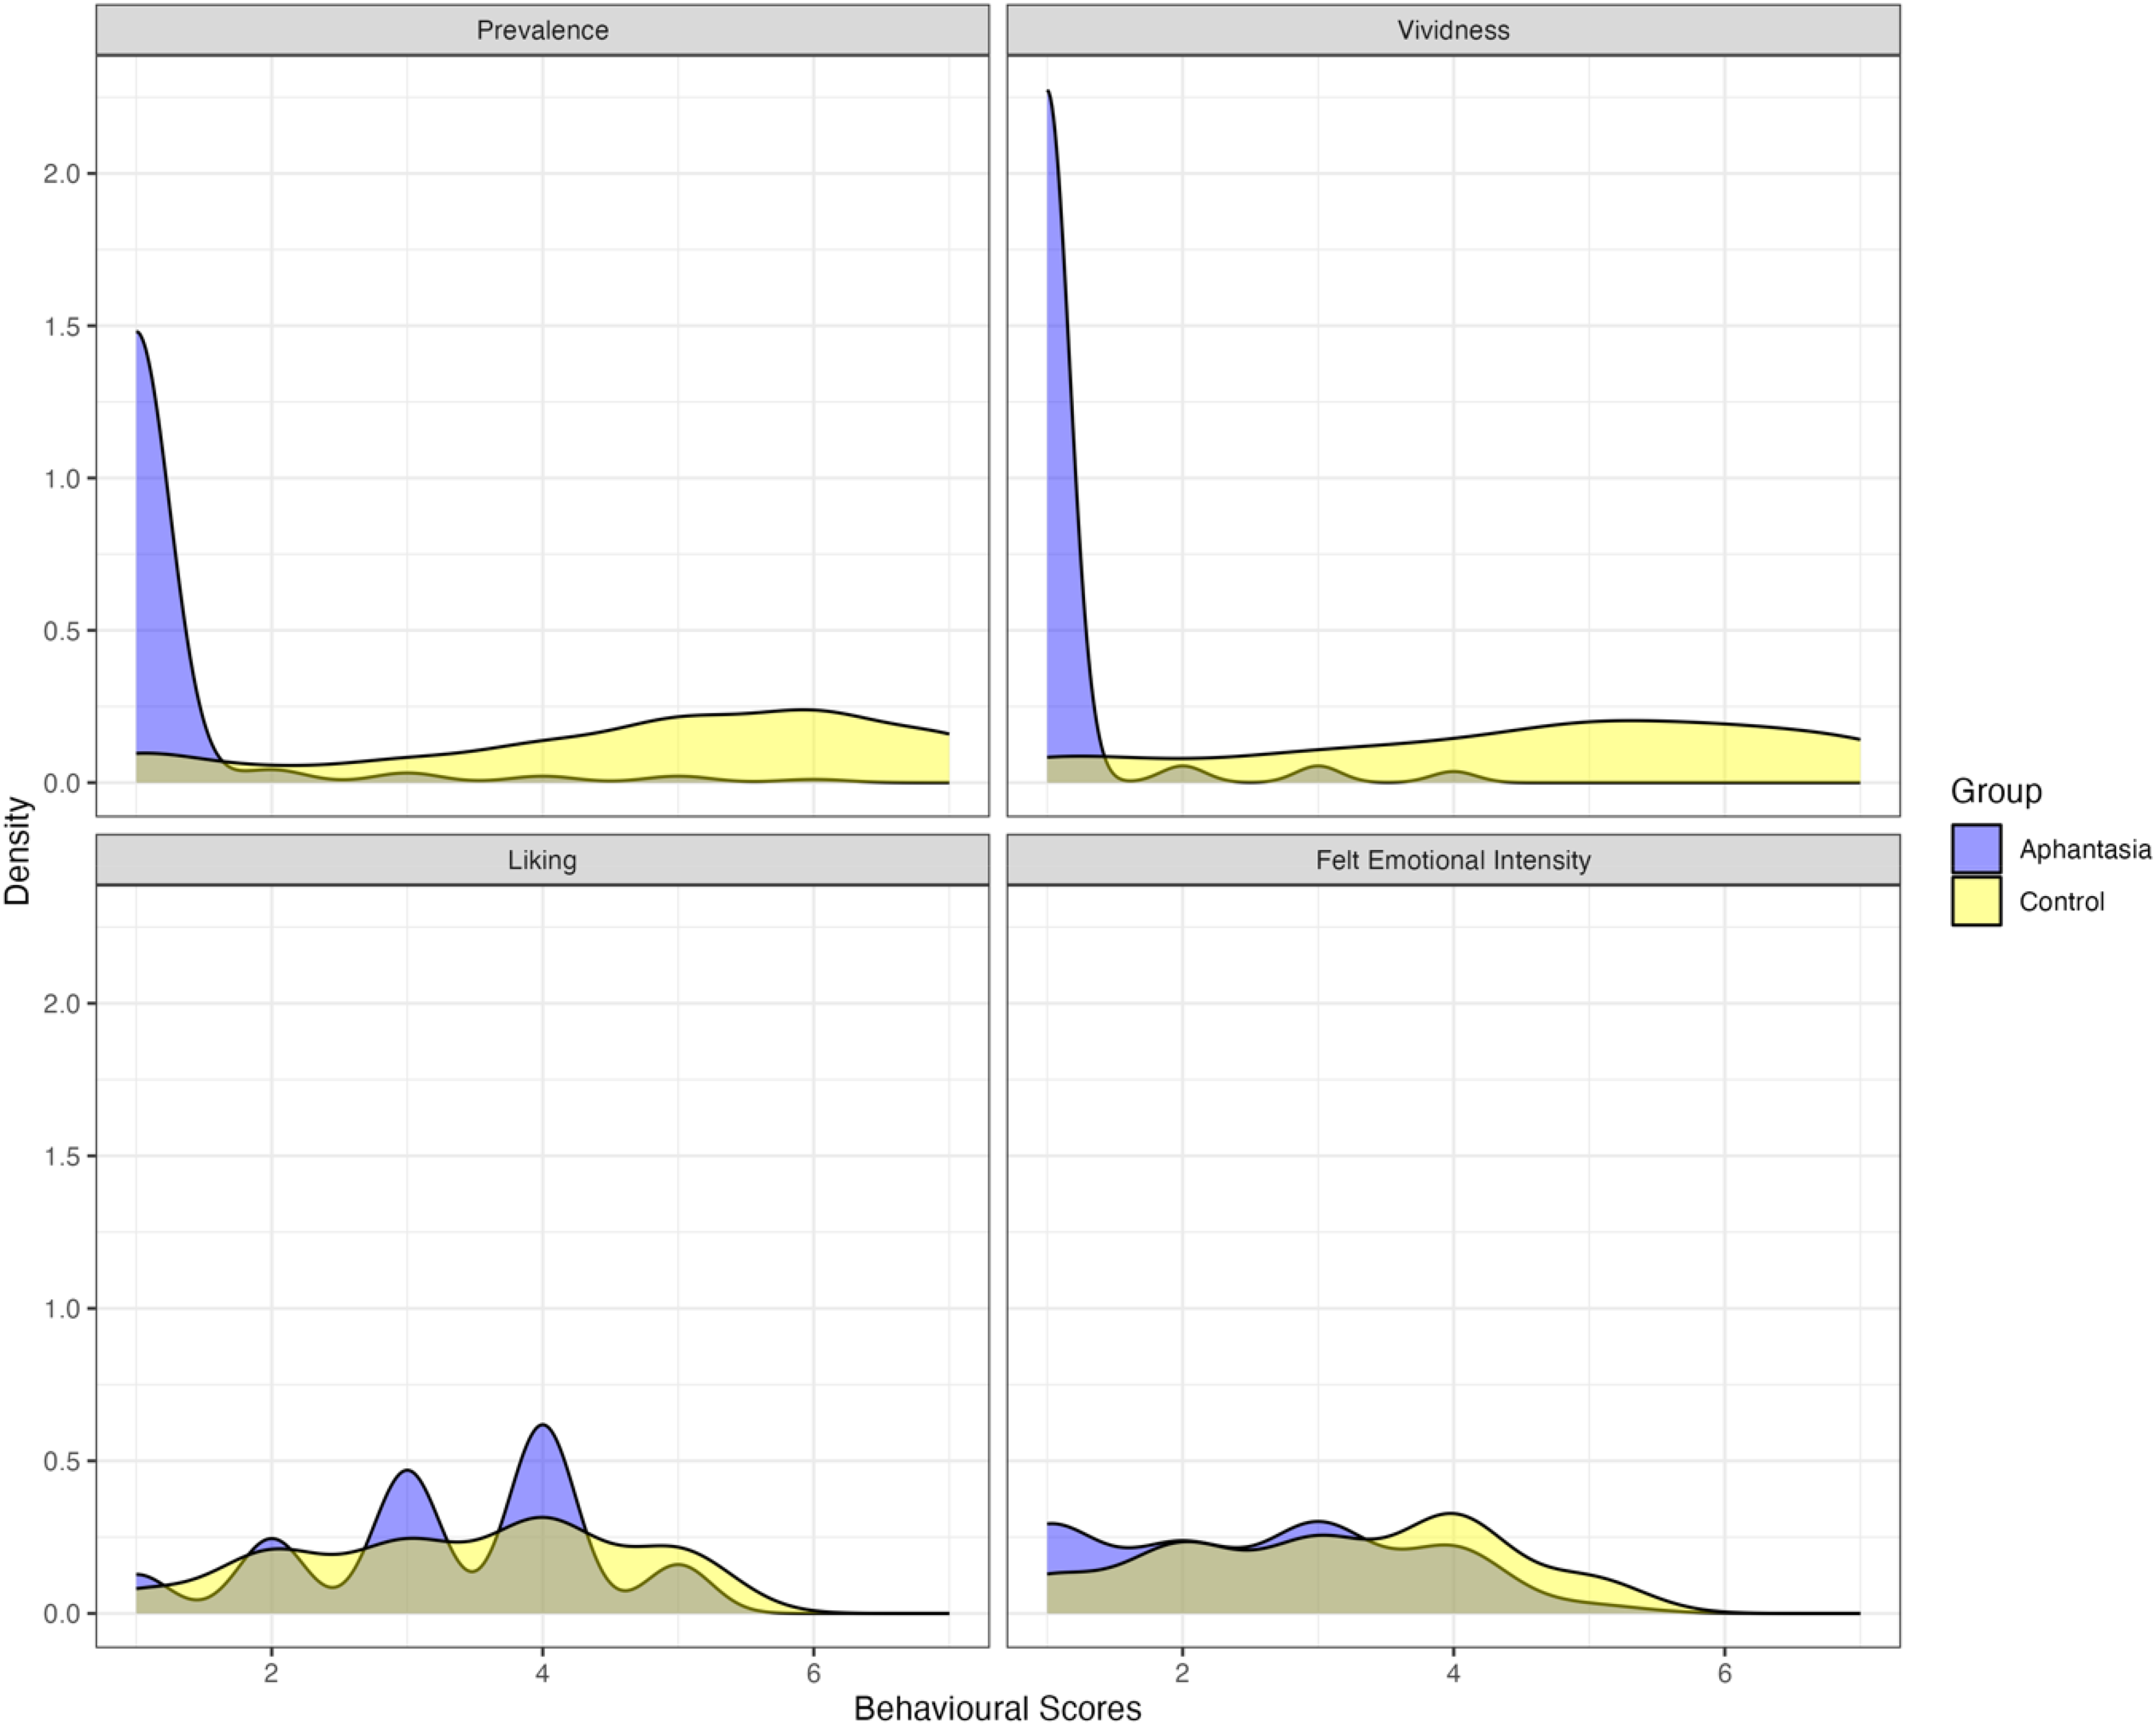
Density plots of the four behavioral measures (prevalence and vividness of visual imagery, music liking, and felt emotional intensity) for the aphantasic and control groups.
We reran these models to compare differences between controls and pure as well as minimal aphantasics. Please find detailed results and visualizations in the Supplementary Materials (Table S1 and Figures S1 and S2). In the model comparing prevalence of visual imagery between pure aphantasics and controls, results indicated significant differences between the pure aphantasics (M = 1.11, SD = 0.76) and control groups (M = 4.70, SD = 1.87), whereby control participants experienced more visual imagery than pure aphantasics. The model comparing prevalence of visual imagery between minimal aphantasics and controls also indicated significant differences between the minimal aphantasics (M = 1.33, SD = 0.87) and control groups (M = 4.70, SD = 1.87), whereby control participants experienced more visual imagery than minimal aphantasics.
The model predicting vividness further showed there to be significant differences between the pure aphantasics (M = 1.00, SD = 0.00) and control groups (M = 4.53, SD = 1.90), with controls reporting higher vividness. There were also differences in terms of vividness between minimal aphantasics (M = 1.27, SD = 0.74) and controls (M = 4.53, SD = 1.90), whereby controls reported higher vividness.
In terms of felt emotional intensity, the models similarly showed the control group (M = 3.08, SD = 1.21) to report significantly higher felt emotional intensity in response to the music than pure aphantasics (M = 2.61, SD = 1.20) as well as minimal aphantasics (M = 2.26, SD = 1.11).
However, the models predicting music liking did not exhibit any differences between controls (M = 3.36, SD = 1.22) and either the pure (M = 3.32, SD = 1.12) or minimal (M = 3.19, SD = 1.03) aphantasic groups.
Links Between Behavioral Measures
The model predicting prevalence of visual imagery revealed a significant positive association with felt emotional intensity (ß = 0.46, SE = 0.06, t = 7.96, p < .001, partial η2 = .37, 95% CI [0.25, 1.00]) and with VVIQ mean scores (ß = 1.10, SE = 0.15, t = 7.40, p = .005, partial η2 = .95, 95% CI [0.62, 1.00]), but no association with music liking (ß = 0.06, SE = 0.05, t = 1.19, p = .253).
Similarly, the model predicting vividness of visual imagery showed there to be significant positive relationships with felt emotional intensity (ß = 0.39, SE = 0.06, t = 7.01, p < .001, partial η2 = .16, 95% CI [0.10, 1.00]) and VVIQ (ß = 1.10, SE = 0.15, t = 7.40, p = .015, partial η2 = .96, 95% CI [0.52, 1.00]), but not with liking (ß = 0.09, SE = 0.05, t = 1.96, p = .052). Assessment of model assumptions using graphical means (histograms and Q-Q plots) indicated that residuals and random effects for both models satisfy normality. See Figure 2 for a visualization of these results.

Regression lines with shaded 95% confidence intervals reflecting the relationships between music liking, felt emotional intensity, and VVIQ mean scores and the prevalence (top row) and vividness (bottom row) of visual imagery ratings. Data points represent ratings in response to the individual music excerpts from the aphantasic and control groups.
Discussion
The aim of Survey 1 was to provide a general impression of aphantasic listeners’ affective and aesthetic experiences of music, in comparison with a subset of the general population group collected by Hashim et al. (2023).
Our findings showed partial support for
We were partially able to confirm
In an additional set of analyses looking specifically at differences between the pure and minimal aphantasics and controls, we were able to confirm that the differences found between all aphantasics and controls still held when assessing differences between controls and these subgroups separately. The findings suggest that there may be little difference between aphantasics who report experiencing no visual imagery at all versus those who can experience very minimal levels of visual imagery in their imagined and affective responses to film music stimuli.
Survey 2
The purpose of Survey 2 was to delve deeper into an exploratory assessment of how attenuated visual imagery abilities impact emotional engagement with music, as well as other key affective responses and functional uses of music more generally. If visual imagery is indeed important in the simulation of different emotional states, then one might expect this to affect an individual's ability to discriminate between different types of emotions that music can convey. Indeed, visual imagery has been thought to act as an ‘emotional amplifier’ (Holmes et al., 2008). Given these ideas, we explored whether reduced visual imagery ability in aphantasics would also be related to a reduced musical emotion discrimination score (
Intuitively, it is possible that mechanisms other than visual imagery take precedence in engagement with music in the absence of visual imagery ability. Visual imagery is one of eight proposed mechanisms associated with music-induced emotions, others including brain stem reflex, rhythmic entrainment, evaluative conditioning, emotional contagion, episodic memory, musical expectancy, and aesthetic judgment. Thus, we explored the predominance of the remaining mechanisms of the BRECVEMA framework by including an adaptation of the MecScale (Juslin et al., 2014), a scale assessing listeners’ experience of each emotion mechanism. As it is broadly unknown which particular mechanisms may facilitate emotional response to music in aphantasics, we aimed to explore the extent to which aphantasics exhibit interactions with music consistent with these mechanisms when compared to a control sample (
If aphantasics are less inclined to use visual imagination as a form of introspecting when listening to music, the uses that aphantasics have for music and how this contrasts with the general population would be a question of interest. A further aim of Survey 2 was thus to examine the different functions that music holds for listeners by including the Adaptive Functions of Music Listening Scale (AFML; Groarke & Hogan, 2018) (
Survey 2 additionally examined patterns of reward from music using the Barcelona Music Reward Questionnaire (BMRQ; Mas-Herrero et al., 2013). As Survey 1 demonstrated that aphantasics and controls showed no differences in music liking yet clear differences in terms of felt emotional intensity to music, we explored whether other rewarding aspects of listening to music would be affected by reduced visual imagery ability (
A final exploratory aim of Survey 2 was, as for Survey 1, to evaluate potential differences between pure and minimal aphantasics and controls separately. Our findings in Survey 1 suggest there to be no marked differences between subgroups compared to when assessing aphantasics’ responses to the musical excerpts as a whole. However, it remains a possibility that nuanced differences may be found when considering general functional and everyday uses of music.
Methods
Participants
In our aphantasic sample, 29 individuals were recruited from the same pool of participants invited in Survey 1 (who were recruited via dedicated Facebook groups; pure = 19, minimal = 10), and included in analyses (aged 33–80 years, 23 females, 5 males, 1 other, M = 57.6, SD = 13.7). This time, only pure and minimal aphantasics from the sample recruited in Survey 1 were directly invited via email to take part in this study. In terms of location, 48% (n = 14) of respondents were residents of the UK, 24% (n = 7) of the USA, 14% (n = 4) of Canada, 7% (n = 2) of Australia, 3% (n = 1) of Germany, and 3% (n = 1) of China.
We collected a sample of participants from the general population matched according to age and gender using Prolific (an online platform that facilitates participant recruitment; www.prolific.co). In this control sample, 29 individuals were recruited (aged 33–71 years, 24 females, 5 males, M = 52.0, SD = 11.3). We also targeted individuals from the UK and USA, as these were the two most predominant countries of residence in the aphantasic sample. Of these, 93% (n = 27) were residents of the UK, and 7% (n = 2) were residents of the USA. All individuals within our control sample possessed summed VVIQ scores of 30+, making them an appropriate non-aphantasic control group due to their sufficient general visual imagery abilities.
Independent samples t-tests confirmed that there were no differences between our two groups in terms of age, t(54.1) = 1.7, p = .096, musical training, t(54.6) = 0.7, p = .473, or general musical sophistication, t(53.9) = 0.0, p = .972.
Materials and Stimuli
The online survey comprised a series of six questionnaires:
Our adaptation of the MecScale (Juslin et al., 2014) assessed listeners’ experiences of music with regard to eight BRECVEMA mechanisms, including rhythmic entrainment which was added to the framework later on (Juslin, 2013; Juslin & Västfjäll, 2008) as well as cognitive appraisal which was included by Juslin et al. (2014) in their original adaptation of the scale. Items in the original scale were phrased to probe responses to individual listening trials; however, each question was rephrased here to inquire into music listening more generally (see Table S2 for the original and adapted items). As such, participants were provided with the following instruction to clarify that their ratings should be based on all past musical experiences: ‘Please indicate the extent to which each of the following statements best reflects your past experiences with music listening’. The scale was also converted from a dichotomous scale to a continuous 7-point Likert scale, from 1 (Strongly Disagree) to 7 (Strongly Agree), to allow for clearer comparison between the questionnaires used here. The Adaptive Function of Music Listening Scale (AFML; Groarke & Hogan, 2018) is a 46-item psychometric tool for measuring functions to music based on 11 broad factors: Stress Regulation, Anxiety Regulation, Anger Regulation, Loneliness Regulation, Rumination, Reminiscence, Strong Emotional Experiences, Awe and Appreciation, Cognitive Regulation, Identity, and Sleep (e.g., ‘I can escape from stressful situations by listening to music’, ‘Listening to music in bed helps me fall asleep’, etc.). This scale was presented in a randomized order for each participant. This was assessed on a 5-point Likert scale from 1 (Strongly Disagree) to 5 (Strongly Agree). This scale possessed a Cronbach's alpha reliability score of α = 0.94. The Barcelona Music Reward Questionnaire (BMRQ; Mas-Herrero et al., 2013) was included to gauge perceptions of musical reward on a 5-point Likert scale from 1 (Completely Disagree) to 5 (Completely Agree). It is a 20-item questionnaire that measures musical reward along five factors: Emotional Evocation, Sensory-Motor, Mood Regulation, Musical Seeking, and Social Reward (e.g., ‘When I share music with someone I feel a special connection with that person’, ‘Music calms and relaxes me’, etc.). This scale possessed a Cronbach's alpha reliability score of α = 0.92. The full 39-item Goldsmiths Musical Sophistication Index (Gold-MSI; Müllensiefen et al., 2014) was administered to record individuals’ general musical sophistication along the 5 dimensions: Active Engagement, Perceptual Abilities, Musical Training, Singing Abilities, and Emotions (e.g., ‘I sometimes choose music that can trigger shivers down my spine’, ‘I can sing or play music from memory’, etc.). These were assessed on a 7-point Likert scale from 1 (Strongly Disagree) to 7 (Strongly Agree). This scale possessed a Cronbach's alpha reliability score of α = 0.96. The Vividness of Visual Imagery Questionnaire (VVIQ; Marks, 1973). We administered the adaptive version (MacGregor et al., 2023) of the Musical Emotion Discrimination Test (aMEDT; MacGregor & Müllensiefen, 2019), which assesses one's ability to discriminate emotions in music, using the R package psychTestR (version 2.23.2). Participants are presented with two performances of the same melody (selected from a large bank of excerpts) by the same performer, each attempting to communicate a different type of basic emotion, and are asked to select the performance they think is being conveyed according to a certain target emotion in a two-alternative forced choice (2AFC) format (for example, participants would be presented with the word ‘Happy’ and then played two melodies consecutively, after which they will click on the rendition that they think conveyed that target emotion). Scores are calculated by the aMEDT program by summing the correct responses and converting the value to a percentage. This test allows for experimenter-chosen trial parameters, thus we opted to include 25 trials based on the test authors’ findings of high correlations between true and simulated estimated test abilities using 25 trials (r = .82), and since correlations appeared to stabilize at 20 + test items. Using standard error of the mean (SEM) as a measure of reliability, the scale possessed an SEM of 0.3 when presenting 25 items. Guidelines for implementing this as a remote test were obtained from https://github.com/klausfrieler/EDT.
Procedure
Survey 2 was built and presented using Qualtrics. Participants in both samples were first provided with explanations of the study purpose, instructions, and informed consent information. They were then asked to provide demographic details, such as an anonymous ID, age, gender, and country of residence. Participants then completed the six questionnaires described above in the following order: MecScale, AFML, BMRQ, Gold-MSI, VVIQ, and aMEDT2. The aMEDT2 included listening trials, and so participants were advised to ensure that they used good-quality headphones and had minimal outside disturbances (though it was not formally checked whether this advice was adhered to). The survey also required participants to visit an external site to carry out the aMEDT2 before returning to officially complete the study, thus the completion button on this instruction page was timed to only appear after approximately 2 mins to avoid careless clicking. To mitigate the possibility that participants would not return to the survey page to formally end the survey, the aMEDT2 was presented last in the questionnaire running order.
This online survey took approximately 30 mins to complete, and participants received £5 as compensation for their time.
Analysis
Scores were computed for each questionnaire. aMEDT scores were missing from three participants due to technical issues. Statistical analyses were run in R (Version 4.2.2). Initial diagnostics of the data revealed non-normal distributions in at least two or more factors for each questionnaire, which transformations were not able to correct. To mitigate this, non-parametric tests or tests known for being robust against such issues were used where possible.
To test differences in emotion discrimination abilities, a non-parametric Mann–Whitney U test was run on aMEDT scores between the aphantasic and control groups. Multivariate linear models, which are robust against non-normality in dependent variables, were run to test potential differences between the aphantasic and control groups for their scores across the different questionnaires (MecScale, AFML, BMRQ, and Gold-MSI). In all models, factors from the questionnaires were entered as dependent variables while Group (aphantasic and control) was entered as the fixed effect. Pillai's Trace was used as the test statistic in the analysis involving the MecScale due to violations in homogeneity of covariance (Box's M = 69.32, p < .001).
These analyses were rerun to consider differences between the control group and the pure as well as minimal aphantasic groups. Independent samples t-tests maintained that there were no differences in age between the pure aphantasics (M = 57.11, SD = 14.21) and controls (M = 52.03, SD = 11.34), t(32.52) = 1.31, p = .201, and between the minimal aphantasics (M = 58.60, SD = 13.31) and controls (M = 52.03, SD = 11.34), t(13.80) = 1.39, p = .185.
Results
Differences in Emotion Discrimination
A Mann–Whitney U test run on aMEDT scores showed that there was no difference between the aphantasic (M = 1.27, SD = 0.79) and control (M = 1.39, SD = 0.89) groups in terms of their emotion discrimination abilities of short melodies, W = 287, p = .265.
There were also no differences found between the pure aphantasic (M = 1.21, SD = 0.81) and control groups (M = 1.39, SD = 0.89), W = 184, p = .210, as well as between the minimal aphantasic (M = 1.38, SD = 0.79) and control groups (M = 1.39, SD = 0.89), W = 103, p = .751.
BRECVEMA Mechanisms
Figure 3 presents each factor of the MecScale for the different sample groups and displays which mechanisms were most highly rated in the aphantasic and control samples’ music listening experience. Multivariate linear model results revealed a main effect of Group (F(8,44) = 25.60, p < .001, Pillai = 0.82, partial η2 = .82) whereby the aphantasic group tended to score lower on the BRECVEMA factors than the control group. Given this main effect, follow-up linear models were run on each of the dependent variables, with a Bonferroni adjusted alpha level of .006 (see Table 1 for full model results).

Averaged scores of the MecScale factors for the aphantasic and control groups. Error bars reflect ± standard error of the mean.
Fixed effect estimates of multivariate linear mixed model on MecScale factors between the aphantasic and control groups.

Note. * significant at an alpha level of .006.
Linear models revealed that the control group scored significantly higher than the aphantasic group in terms of Visual Imagery (ß = 4.08, SE = 0.30, t = 13.77, p < .001) and Episodic Memory (ß = 1.71, SE = 0.44, t = 3.87, p < .001). No other significant effects were found amongst the remaining mechanisms.
Further, multivariate linear model results between pure aphantasics and controls revealed a main effect of Group (F(8,34) = 25.75, p < .001, Pillai = 0.86, partial η2 = .86) whereby the pure aphantasic group tended to score lower on the BRECVEMA factors than the control group. Follow-up linear models revealed that the control group scored significantly higher than the pure aphantasic group in terms of Visual Imagery (ß = 4.35, SE = 0.32, t = 13.72, p < .001) and Episodic Memory (ß = 2.40, SE = 0.46, t = 5.19, p < .001), as well as in terms of Evaluative Conditioning (ß = 1.37, SE = 0.42, t = 3.27, p = .002) and Musical Expectancy (ß = 1.61, SE = 0.44, t = 3.63, p < .001). No other significant effects were found amongst the remaining mechanisms. See Figure S3 for a visualization of the group score differences and Table S3 for full model results.
Finally, multivariate linear model results between minimal aphantasics and controls revealed a main effect of Group (F(8,25) = 11.23, p < .001, Pillai = 0.78, partial η2 = .78) whereby the minimal aphantasic group tended to score lower on the BRECVEMA factors than the control group. Follow-up linear models revealed that the control group scored significantly higher than the minimal aphantasic group in terms of Visual Imagery only (ß = 3.56, SE = 0.47, t = 7.50, p < .001). No other significant effects were found amongst the remaining mechanisms. See Figure S4 for a visualization of the group score differences and Table S4 for full model results.
Everyday Functions of Music
Figure 4 presents average scores for each factor of the AFML for the two sample groups. Overall, individuals from the control sample rated music more highly than aphantasics in terms of its everyday uses. Multivariate linear model results revealed a main effect of Group (F(11,46) = 2.87, p = .006, Wilks = 0.59, partial η2 = .41) whereby the aphantasic group tended to score lower on the AFML factors than the control group. Given this main effect, follow-up linear models were run on each of the dependent variables, with a Bonferroni adjusted alpha level of .005 (see Table 2 for full model results).

Averaged scores of the AFML factors for the aphantasic and control groups. Error bars reflect ± standard error of the mean.
Fixed effect estimates of multivariate linear mixed model on AFML factors between the aphantasic and control groups

Note. * significant at an alpha level of .005.
Linear models revealed that the control group scored significantly higher than the aphantasic group in terms of Reminiscence only (ß = 1.03, SE = 0.24, t = 4.33, p < .001). No other significant effects were found amongst the remaining factors after correcting for multiple comparisons.
Next, multivariate linear model results between pure aphantasics and controls revealed a main effect of Group (F(11,36) = 2.82, p = .009, Wilks = 0.54, partial η2 = .46) whereby the pure aphantasic group tended to score lower on the AFML factors than the control group. Follow-up linear models revealed that the control group scored significantly higher than the pure aphantasic group in terms of Reminiscence (ß = 1.32, SE = 0.26, t = 5.18, p < .001) and in terms of Strong Emotional Experiences (ß = 1.07, SE = 0.30, t = 3.58, p < .001). No other significant effects were found amongst the remaining factors after correcting for multiple comparisons. See Figure S5 for a visualization of the group score differences and see Table S5 for full model results.
Finally, multivariate linear model results between minimal aphantasics and controls revealed no main effect of Group (F(11,27) = 1.58, p = .161, Wilks = 0.61, partial η2 = .39). Thus, follow-up models for the dependent variables were not run. See Figure S6 for a visualization of the group score differences.
Differences in Musical Reward
The multivariate linear model predicting the five factors of the BMRQ revealed no main effect of Group (F(5, 52) = 1.53, p = .196). Thus, follow-up models for each of the dependent variables were not run. See Figure S7 for a visualization of these factors.
Similarly, the multivariate linear model predicting the five factors of the BMRQ between the pure aphantasic and control groups revealed no main effect of Group (F(5, 42) = 0.70, p = .623). However, the model between the minimal aphantasic and control groups did reveal a main effect of Group (F(5, 33) = 3.42, p = .013, Wilks = 0.66, partial η2 = .34). Given this main effect, follow-up linear models were run on each of the dependent variables, with a Bonferroni adjusted alpha level of .01. The follow-up models did not reveal significant differences for any of the factors after correction. However, they reflected a tendency for the minimal aphantasic group to score lower than the control group in terms of the Musical Seeking factor (see Table S9).
Differences in Musical Sophistication
The multivariate linear model predicting the five factors of the Gold-MSI revealed no main effect of Group (F(5, 52) = 1.39, p = .243). Thus, follow-up models for the dependent variables were not run. See Figure S8 for a visualization of these factors.
Similarly, the multivariate linear model predicting the five factors of the Gold-MSI between the pure aphantasic and control groups revealed no main effect of Group (F(6, 41) = 1.92, p = .100), as well between the minimal aphantasic and control groups (F(6, 32) = 2.04, p = .089). As a result, follow-up models for the dependent variables were not run.
Discussion
One of the purposes of Survey 2 was to understand the effects that a lack of visual imagery ability might have on emotional processing and engagement with music. In this case, we contribute to Aim 1 by showing that aphantasia does not seem to affect emotion discrimination abilities. It is evident that while aphantasics may exhibit reduced emotional responses to imagined stimuli, this does not necessarily affect their ability to recognize and discriminate distinct emotional differences in perceived stimuli such as music.
There were, however, some notable group differences in terms of the BRECVEMA emotion induction mechanisms. Apart from visual imagery, aphantasics scored lower than controls in terms of episodic memory. Our findings therefore add to Aim 2 in showing that mechanisms of music-induced emotions occurring in the visual domain or with the potential to be experienced visually (as in the case of memory) tend to be experienced less in aphantasics. Interestingly, these findings resonated with other significant differences between aphantasics and control listeners with regard to everyday music functions. In particular, the factor that was distinguished most strongly between groups was Reminiscence, the act of thinking back and remembering past events, contributing to Aim 3. Modulations in the experience of memory in aphantasics has been a focus of recent literature, with some studies highlighting that aphantasics exhibit deficient autobiographical memories (Dawes et al., 2022; Monzel et al., 2023; Zeman et al., 2020). Our study highlights that the general impairments in autobiographical memories reported by aphantasics further translates to their experience of music listening.
The differences in terms of memory-related factors found here are relevant, both in terms of the functions that music may serve and in terms of emotion-related mechanisms. Whilst aphantasics do not tend to exhibit any reductions in the process of consolidating working memory (Knight et al., 2022), our findings are in line with previous literature that has shown that visual imagery is strongly associated with the visual experience of memory (Handy et al., 2004; McKelvie & Demers, 1979; Pearson & Keogh, 2019). The ability to consolidate memories of events and then use it for later recall is a fundamental aspect of visual imagery; individuals with congenital aphantasia appear to show a reduced ability to relive their memories (Greenberg & Knowlton, 2014) and difficulties in simulating the future (Dawes et al., 2022).
Moreover, we observed no differences between groups in terms of their musical reward along the BMRQ dimensions (Aim 4), suggesting that a lack of visual imagery ability does not impede one's ability to derive rewards from music, including those pertaining to emotional rewards. No differences were further found between the aphantasic and control groups in terms of their musical sophistication index, as measured by the Gold-MSI (Aim 5).
Taking findings thus far, it appears that emotion discrimination and musical rewards are not majorly impacted by a lack of, or minimized, visual imagery abilities. However, aphantasics appear to generally report fewer instances of experiencing episodic memory and reminiscing past events in response to music.
Our additional analyses examining pure and minimal aphantasics separately offer interesting results. Firstly, the finding of no differences between these subgroups and controls was maintained in terms of emotion discrimination abilities, musical reward, and musical sophistication. However, in addition to visual imagery and episodic memory, pure aphantasics appeared to exhibit markedly lower scores in evaluative conditioning (the enjoyment of musical stimuli paired with other positive or negative stimuli) and musical expectancy (emotions induced due to a confirmation or violation in expectations). Further, our findings suggest that, in addition to lower reminiscence in everyday functions of music, this subgroup further provided significantly lower ratings in terms of strong emotional experiences. Thus, we conclude that it is generally the more extreme levels of aphantasia that lead to more accentuated decreases in memory formation and emotional experiences during music listening. These results seem contradictory to the fact that none of the affect-related factors of the BMRQ and Gold-MSI were similarly negatively affected. Since the effect sizes are low, further replications would be necessary to explore the extent of the robustness and generalizability of these findings.
The fact that minimal aphantasics did not also exhibit significantly lower episodic memory, as in the pure and overall aphantasic groups, suggests that even low levels of visual imagery abilities may be enough to utilize music for the purpose of visually forming and recalling past events. This was further in line with finding no apparent differences in terms of the everyday uses of music in minimal aphantasics compared to controls.
General Discussion
In this study, we compared aphantasics and controls with regard to differences in their experiences of music-induced visual imagery, aesthetic appeal, and emotional response (Survey 1). We also explored patterns of experience and engagement with music in everyday life, as well as emotion discrimination ability (Survey 2). Specifically, the purpose of this research was to shed light on how emotional processes and responses to music are related to the experience of visual imagery. In Survey 1, we predicted that aphantasics and controls would demonstrate distinctly different visual imagery abilities (Hypothesis 1), as well as differences in their felt emotional intensity and liking towards music (Hypothesis 2). Relatedly, we predicted that, following evidence of group-level differences in our behavioral data, correlation analyses would reveal positive associations between visual imagery abilities and felt emotional intensity and liking in the aphantasic and control samples (Hypothesis 3). In terms of trait features, imagery prevalence was expected to be positively related to VVIQ mean scores (Hypothesis 4).
It was shown that the aphantasic and control groups did indeed show significant differences in their visual imagery abilities and did display differences in their ratings of felt emotional intensity towards the musical excerpts in Survey 1, albeit not in how much they liked them. These findings were further replicated when comparing pure and minimal aphantasics against controls separately. While our study tested this in the context of music listening, this finding is in line with previous results showing that a lack of visual imagery is associated with reduced feelings of fear when imagining negative situations (Wicken et al., 2021) as well as fewer experiences of intrusive memories (Dawes et al., 2020).
Our results from Survey 1 help to strengthen visual imagery's place in the BRECVEMA framework of music-induced emotions (Juslin, 2013; Juslin & Västfjäll, 2008). For example, it has been shown that emotive descriptions enhance the formation of visual imagery that heightens emotion induction during music listening (Vuoskoski & Eerola, 2015), while another study revealed that the active suppression of music-induced visual imagery led to minor attenuation of emotional response to music (Hashim et al., 2020). Our results are not capable of contributing to the discourse regarding the directionality of the causal relationship between visual imagery and music-induced emotion (Day & Thompson, 2019; Küssner & Taruffi, 2023; Vroegh, 2018), but we propose that the significant reductions in felt emotional intensity ratings in aphantasics could be the result of a lack of visual imagery ability. One interpretation for the reduced music-related emotional intensity is that, with impeded visual imagery abilities, aphantasics may have less ability to engage narratively with music (Day & Thompson, 2019; Hashim et al., 2023; Küssner & Eerola, 2019; Margulis, 2017; Taruffi et al., 2017). It is possible that this hinders one potential method for engaging emotionally with music; namely through the simulation of emotional visual scenes associated with the music. This poses further questions regarding aphantasics’ reasons for listening to music (more specifically, film music, as was used here), and further research may benefit from adopting a nuanced and perhaps qualitative approach to addressing this question.
Following on from the finding that aphantasic and control individuals showed different emotional responses to musical excerpts, in Survey 2, we administered a series of questionnaires to explore whether aphantasia would be related to reduced emotion discrimination abilities (Aim 1) as well as to explore whether aphantasics exhibit any differences with regard to emotion induction mechanisms (Aim 2), functions (Aim 3), and rewards (Aim 4) of listening to music. We further explored group differences in terms of musical sophistication (Aim 5), as well as, once again, assessing potential differences when analyzing pure and minimal aphantasics separately against controls. The purpose of this study was essentially to more broadly understand the various experiences that a lack of visual imagery may involve.
Regarding Aim 1, we found no differences between aphantasic and control individuals with respect to their musical emotion discrimination scores, despite finding an indication of lower felt emotional intensity in aphantasics in Survey 1. Similarly, no differences were found when analyzing pure and minimal aphantasics separately. This new finding suggests that although past reports have shown dampened imagination-related emotional experiences in those with aphantasia (Wicken et al., 2021) and proposed the idea of visual imagery as an emotional amplifier (Holmes et al., 2008), aphantasia does not negatively affect the perception and discrimination of emotions expressed by music. However, some notable differences are the fact that the aforementioned studies mainly focused on the induction (not discrimination) of negative (i.e., fearful) emotions. It is plausible that visual imagery is not as necessary for the discrimination of perceived emotions expressed by music as for felt emotions induced by music. Further, with regard to feeling emotions, even in the context of a discrimination task, it is possible that positive emotions, like happiness, are not as impacted by reduced visual imagery abilities as negative emotions, like fear, are (Taruffi et al., 2017). This would be in line with neuroscientific evidence showing activation in the visual cortex when listening to fear-inducing (vs. happiness-inducing) music (Koelsch et al., 2013).
Differences in the MecScale factors were evident in our results. Unsurprisingly, visual imagery was the most distinctly affected mechanism of the MecScale. The second most affected mechanism was episodic memory, suggesting that aphantasia affects the ability to recall past events, a finding in line with a recent investigation by Dawes et al. (2022) who reported that aphantasia negatively affected the ability to re-experience the past and simulate future events when asked to remember past life events and imagine hypothetical future events. Our results show that this can apply to memories previously formed in response to musical excerpts. The findings further suggest that this reduction in episodic memory is most pronounced in those with pure aphantasia, i.e., those who report experiencing no visual imagery at all in their day-to-day lives.
Interestingly, aphantasic, as well as pure aphantasic, listeners also reported significantly lower levels of reminiscence (AFML factor) in addition to fewer episodic memories (MecScale factor), when listening to music. Both findings are in line with the previously reported link between imagery and memory processes. The current study's findings add emphasis to past assertions that visual imagery is important in the formation of memories (Otenen & Aydin, 2023). It is important to note that our results are not able to comment on aphantasics’ abilities to form and recall episodic memories, but simply that they tend to report having fewer of these experiences while listening to music. Indeed, it has been proposed that aphantasics perform just as well as non-aphantasics when recalling the details of an episodic event (Arcangeli, 2023; Keogh, Wicken, et al., 2021; Zeman et al., 2015). Thus, further investigations should aim to implement a task that specifically targets the formation of episodic memory in response to music. However, it is interesting to note that the marked differences in memory-related processes with regard to the MecScale and AFML were not present when assessing minimal aphantasics, which may provide tentative support for the idea that the general ability to form visual imagery, even to a small extent, may lead to higher instances of memory formation and consolidation during music listening.
Our analysis into pure aphantasics further illustrated that there were attenuations in terms of evaluative conditioning and musical expectancy (MecScale factors), as well as in terms of strong emotional experiences (AFML factor), extending results found in Survey 1 regarding significantly reduced felt emotional intensity in aphantasics compared to controls. Regarding conditioning, it seems that aphantasic listeners tend to form fewer general positive and negative associations between music and other stimuli. Further investigation with regard to expectancy is also required, although it is plausible that reductions in imagery ability are related to difficulties in predicting incoming events during music listening.
Limitations and Future Directions
There are a few key limitations to note in the design of Survey 1. One is the fact that only three musical excerpts were used, conveying only three basic emotions. Indeed, this may have limited the breadth of the conclusions that could be made with regard to the emotional responses of aphantasic listeners. Using pieces representing only three basic emotions could have limited the range that listeners were able to reflect on; for example, including excerpts conveying sadness could enhance emotional effects, given the wide literature surrounding the paradoxes and pleasures of listening to sad music (Eerola et al., 2016; Taruffi & Koelsch, 2014; Vuoskoski et al., 2012).
While participants in Survey 1 were instructed to provide felt emotional intensity ratings in response to the musical excerpts, it also remains a possibility that the emotional responses that participants provided were in response to their emotional reactions to memories of the movies, rather than of the musical excerpts themselves. Thus, future studies into aphantasics’ relationship with music should aim to present music representing a musical genre with fewer connotations attached.
A further limitation of the current research concerns the use of the MecScale in Survey 2, a questionnaire used to assess responses corresponding to the BRECVEMA framework of music-induced emotions (Juslin, 2013; Juslin & Västfjäll, 2008). These mechanisms have received significant attention over the last decade, especially with regard to their true presence in our experience of emotions. While some studies have been able to show evidence for the influence of a handful of the mechanisms (namely brain stem reflex, emotional contagion, episodic memory, and musical expectancy; see Juslin et al., 2014, 2015), the current test could represent an over-simplification of the experiences of the different framework mechanisms.
Our results suggest that differences observed between the whole aphantasic sample and controls tended to hold even when analyzing the pure and minimal aphantasics separately. Nevertheless, we propose that findings about these particular subgroups should be interpreted with caution given their very small sample sizes.
Importantly, one should also remember that compared to Survey 1, Survey 2 relied heavily on retrospection, a difficult task for many. It would be informative and fruitful to consider the implementation of an experience sampling methodology, where responses to and functions of music are reported in the flow of everyday life. Using this, one would be able to ascertain the situations in which aphantasics differ from controls with regard to memory and broad emotional experiences in the context of music listening.
A final limitation to consider is our extensive use of self-report measures. Visual imagery is widely recognized to be an elusive process to measure. Thus, attempting to capture an absence of it poses even further methodological constraints. Nevertheless, past studies incorporating implicit techniques to validate the experiences of aphantasia have been successful in revealing a lack of sensorial experiences in response to tasks that require visual imagery to be carried out (Kay et al., 2022). Such investigations aiming to obtain a more objective account of aphantasia are generally still in their infancy, but beneficial to strive for.
There are many avenues for future research. It would be important to employ listening tasks with which to address questions regarding music-induced emotions. These would be especially useful in distinguishing aphantasic responses while listening to musical stimuli differing in emotional content (Taruffi et al., 2017; Wicken et al., 2021). Additionally, utilizing objective indices such as pupil dilation response (Kay et al., 2022) would be a valuable way to measure the sensory strength of music-induced visual imagery. Finally, the current research only provided a general impression of the reasons and functions that music listening can hold in everyday contexts. It may be useful, as previously stated, to employ techniques such as the Experience Sampling Method (Juslin et al., 2008; Juslin & Laukka, 2004) for sending daily regular probes, given the richness and insight that can be gained from obtaining regular reports of music listening experience in day-to-day settings. Such developments would certainly gain significant headway in understanding the role of visual imagery in music, as well as discerning the unique experiences of listeners with aphantasia.
To what extent are the differences found in our emotion-related measures specific to the musical stimuli or simply reflect a general pattern of reduced emotionality? Given the past reported findings of reduced emotional experiences in response to imagined stimuli (Wicken et al., 2021), our results seem to corroborate this general trend in a different type of setting, i.e., music listening (Arcangeli, 2023; Dawes et al., 2020). This is not to say that aphantasics cannot derive enjoyment and experience a range of emotions in response to music that do not require imagination (Koelsch, 2014). It is possible that the lack of uniformity across measures regarding emotion-specific reductions in aphantasics compared to controls in Survey 2 is due to the nature of the questions being asked. While Survey 1 specifically instructed participants to form visual imagery to the music (supporting dampened emotionality to visual imagination), Survey 2 measured multiple functional and everyday experiences to music more broadly (thus encouraging a cross-modal retrospection of past musical experience). Therefore, understanding the source of such differences in emotion warrants obtaining data on aphantasics’ emotional responses towards non-musical as well as musical stimuli and situations.
Conclusion
The present investigation emphasizes the strong relationship that visual imagery and emotion have, and sheds light on some of the ways that listeners with aphantasia interact with music. It also confirms well documented links between imagery ability and memory processes.
Past findings suggest that aphantasics tend to exhibit diminished emotional response to imagined stimuli. The findings from our two surveys provide further support for this notion, and show how limited imagery ability may impact the ways in which music is used and experienced.
Supplemental Material
sj-docx-1-mns-10.1177_20592043231216259 - Supplemental material for The Experience of Music in Aphantasia: Emotion, Reward, and Everyday Functions
Supplemental material, sj-docx-1-mns-10.1177_20592043231216259 for The Experience of Music in Aphantasia: Emotion, Reward, and Everyday Functions by Sarah Hashim, Claudia Pulcini, Ashok Jansari, Mats B. Küssner and Diana Omigie in Music & Science
Footnotes
Action Editor
Solange Glasser, University of Melbourne, Melbourne Conservatorium of Music
Peer Review
Reshanne Reeder, University of Liverpool, Department of Psychology
Elizabeth Margulis, Princeton University, Department of Music
Contributorship
SH, CP, AJ, MBK, and DO were involved the conception of the research. SH, MBK, and DO designed the surveys. CP was involved in compiling our aphantasic sample, and SH and CP led the data collection. SH ran the data analyses and wrote the first draft of the manuscript. All authors edited, reviewed, and approved the final version of the manuscript.
Declaration of Conflicting Interests
The authors declared no potential conflicts of interest with respect to the research, authorship, and/or publication of this article.
Ethical Approval
Both surveys have received ethical approval from the Ethics Committee of the Department of Psychology at Goldsmiths, University of London. Participants provided online written consent for the collection, analysis, and potential publication of their data in a scientific journal. They also received monetary compensation for their time.
Funding
The article processing charge was funded by the Deutsche Forschungsgemeinschaft (DFG, German Research Foundation) – 491192747 and the Open Access Publication Fund of Humboldt-Universität zu Berlin.
Data Availability Statement
The datasets generated during and/or analyzed during the current study are available from the corresponding author on reasonable request.
Supplemental Material
Supplemental material for this article is available online.
References
Supplementary Material
Please find the following supplemental material available below.
For Open Access articles published under a Creative Commons License, all supplemental material carries the same license as the article it is associated with.
For non-Open Access articles published, all supplemental material carries a non-exclusive license, and permission requests for re-use of supplemental material or any part of supplemental material shall be sent directly to the copyright owner as specified in the copyright notice associated with the article.