
Abstract
There has been little quantitative analysis of the successful careers of music artists in the literature given the importance of music in world culture. The Billboard 200 database in the U.S. (BB200, 200 best-selling weekly albums) is freely available for the period 1963–2019, a long period encompassing the entire careers of many musicians. An analysis of this database enabled us to establish some rules of musical success for artists, which are examined in this article. Our results show that the time distribution of success for artists reaching high chart positions follows a Frechet-like distribution, with a decline principally due to the progressively shorter lifespan of successive charted albums from the same artist. We then show that the surmised difficulty of the second album exists. Our findings also confirm that success is more diverse than it was a few decades ago, in the sense that more artists reach the charts every year. Finally, we analyze and model the lifespan of albums in the charts, facilitating the isolation of the contribution of marketing to success and failure and comparisons between albums. The BB200 database provides an interesting point of entry to music data science, music marketing, but also to the more complex related notions of musical quality and creativity.
Introduction
The recent arrival of streaming has revolutionized consumer habits. People no longer buy albums (physical sales have fallen by 80–90% in volume or revenue over the last 25 years (Global Music Report, 2023; Sparrow, 2019; U.S. Recorded Music Sales, 2022)), but instead subscribe to services allowing them to listen to millions of tracks on demand. The massive use of personal “playlists” and automated music recommendations (a phenomenon coined as “curatorial turn” (Chodos, 2019)) have given an old-fashioned twist to the very concept of the “album.” The record shops where people used to go to discover and discuss the latest releases have disappeared (Etude sur la situation économique des disquaires indépendants en France, 2017). The leading generalist music magazines are progressively replaced by smaller, independent magazines (Peirson-Hagger, 2020; Simpson, 2018). Social networks have reshuffled the cards of marketing promotion, especially as their impact is almost global. The music market has been rendered illegible by this period of transition.
As a result, assessing the success of today's artists requires a complex equation based as much on sales of singles, concert tickets, albums, streaming and popularity on YouTube and Facebook (Mulligan, 2012) as on ancillary and commercial income. Indeed, the income of well-known artists is increasingly based on their current commercial success, capitalizing on compilations, tours, and the resale of catalog rights (Greenburg, 2022).
A look at the past can help us to analyze artistic success more easily. A few decades ago, the success of musical artists was based on their album sales, which were then the sacrosanct reference point of the music industry (Gamal, 2012; Shuker, 2017). However, rigorous studies of artistic success have been surprisingly rare in academic research journals and even in some music industry reference books (Baskerville & Baskerville, 2018). Music research has recently rather focused on music information retrieval, to analyze historical trends in songs contents and associated emotions (Mauch et al., 2015; Panteli et al., 2018; Schedl et al., 2014; Schellenberg & von Scheve, 2012) or success (Interiano et al., 2018). There are also many studies around new economic or consuming models related to streaming (Chodos, 2019). In fact, only a few studies used charts to investigate songs’ or albums’ longevity (Bhattacharjee et al., 2007; Jarynowski & Buda, 2014; Strobl & Tucker, 2000), prediction of musical success (Cosimato et al., 2019; Kang et al., 2022), or songs’ success across cultures (Buda & Jarynowski, 2015), and very few of these studies focused on artists.
As a source for artistic success, the Billboard 200 database in the U.S. (BB200, 200 best-selling weekly albums) is freely available for the period 1963–2019 (Acoustic and meta features of albums and songs on the Billboard 200, 2022), a long period encompassing the entire career of many musicians. By analyzing this database, we can establish some rules of musical success for artists, which are examined in this article. These rules provide an interesting, albeit imperfect, point of entry into music marketing, but also into the more complex notions of musical quality and creativity.
Methods
We analyzed the BB200 database with a freely available Matlab (Mathworks) code (https://gitlab.pasteur.fr/ida-public/musical-success) that imports data and generates each figure. The BB200 database contains lists of the top 200 albums for every week from May 1, 1963 to January 19, 2019. We converted each ranking (between 1 and 200) into a score between 200 (rank 1) and 1 (rank 200). For each artist, we obtained weekly scores, for all of the artist's albums included in the charts, which we added together over either a period of one year or the entire career of the artist. The distribution of these cumulative scores over a career follows a roughly normal distribution when plotted on a logarithmic scale (Figure 1A) although it fails the Jarque–Bera test (p = 1e-3). Indeed, it has a kurtosis slightly below 3 (2.63), indicating a platykurtic distribution (fewer extreme values). The distribution of the total score therefore resembles a lognormal distribution.

Quantifying the success of musical artists. A) Distribution of the total score for each artist measured over their entire career. Each week, the score of an album is 201 minus its ranking in the BB200. The first place therefore yields 200 points, the 100th place only 101 points. For a given artist, this score is then summed over all the weeks for which the artist appears in the charts during their career. B) Number of albums appearing in the BB200 per artist. C) Duration of success for artists, measured as the number of years between their first and last appearance on the BB200. D) Number of albums reaching number 1 on the charts per artist. E) Number of weeks spent at number 1 on the BB200, by artist.
Results
Musical Success is Precarious
Chart positions are highly competitive. In 2000, for example, at the peak of the CD era, an estimated 35,000 albums were released in the U.S. alone (Frankel & Gervais, 2014), but only 605 new albums, by 462 different artists, made the Billboard 200 charts that year. Assuming a range of 1 to 1.3 albums per artist (605/462), the proportion of artists who managed to place their album in the U.S. charts was, therefore, between 1.3% and 1.7%. The chances of a new artist reaching the charts were even slimmer, with 63% of those reaching the charts in 2000 having charted an album before. Even if new artists do reach the charts, they cannot rest on their laurels: 45.8% of the artists who have charted in the last 60 years managed to get only one album into the charts, and 62.8% have had two or fewer albums reach the charts (Figure 1B). The duration of a career, or at least of what may be considered success, is therefore relatively limited for many artists (Figure 1C): 58.5% appear in the charts over a period of no more than four years, and only 19.7% have a shelf-life of more than 10 years. Incredibly, 1% of artists manage to achieve 48 years or more in the charts. These artists generally fall into the following categories: 1) artists who died “young” but achieved such a cult following that they continue to sell via compilations (Elvis, Jimi Hendrix, Marvin Gaye, John Lennon, etc.); 2) bands that disbanded and follow the same trajectory (The Beatles, The Doors, Carpenters, Pink Floyd.); 3) artists, whether dead or still alive, and groups that can be considered to have completed their careers (Aretha Franklin, James Brown, Paul Anka, The Rolling Stones, Van Morrison, etc.).
Success is Unevenly Distributed Between Artists
Not only is success precarious, but it has long been observed that a small number of artists—“superstars” (Rosen, 1981)—dominate the top of the charts. This phenomenon has been illustrated quantitatively in studies based on U.S. album sales (Hamlen, 1991), the number of awards (gold records (Chung & Cox, 1994)), or the number of weeks at the top of the charts for each artist during their career, for example (Giles, 2006). A so-called Yule distribution (Strobl & Tucker, 2000), of the form 1/n/(n + 1), has been used to describe the unbalanced distribution of these indicators of success between artists, but this approach has been called into question in recent years (Giles, 2006; Hamlen, 1991); the ideal model for quantifying the “global” success of an artist remains to be determined. Here, data from the BB200 clearly show that the distribution, by artist, of the number of albums reaching the number one position (Giles, 2006) decreases more linearly than a Yule distribution (Figure 1D). If an analysis based on the number of weeks spent at the top of the charts (Figure 1E) is used, the distribution of this parameter appears to be modal and, therefore, does not strictly decrease like the Yule distribution as well. If the scores of each artist (see methods) are summed over their entire career (Figure 1A), a lognormal distribution is obtained, confirming that the highest scores are restricted to a small number of artists.
The Life Cycle of an Artist
By studying this score at the scale of a week, a month or a year, we can trace the evolution of an artist's success. Indeed, even for artists with long careers, there are relatively predictable ups and downs, and this is one of the lessons we can learn from this database. Success over the years approximates an asymmetric Frechet-type law. Smoothing out the artistic ups and downs over a period of five years reveals a “pattern” of rapid growth and then slow exponential decline. Frechet-type distributions gave the closest fit to the data of all the asymmetric distributions tested. For example, the Rolling Stones’ cumulative annual score clearly peaks at the beginning of their career (in 1966 to be exact), before decreasing inexorably over the following 50 years (Figure 2A). Thus, 1966 was the year in their career in which they had the largest number of albums in high chart positions for the longest. This model works for all the artists and groups explored (Figure 2B, Supp. Figure 1A and B), provided, of course, that only complete careers are considered, the group has not disbanded (if appropriate), and the artist did not die prematurely, which would distort the model. An artist dying tends to boost their sales in the short term, and even in the longer term, even for artists no longer considered trendy, as illustrated by the recent examples of Prince and Michael Jackson (Supp. Figure 2A and B). Finally, this rule of success is more regular and easy to identify in the BB200 database than in the BB100 database of best-selling singles (Supp. Figure 3).
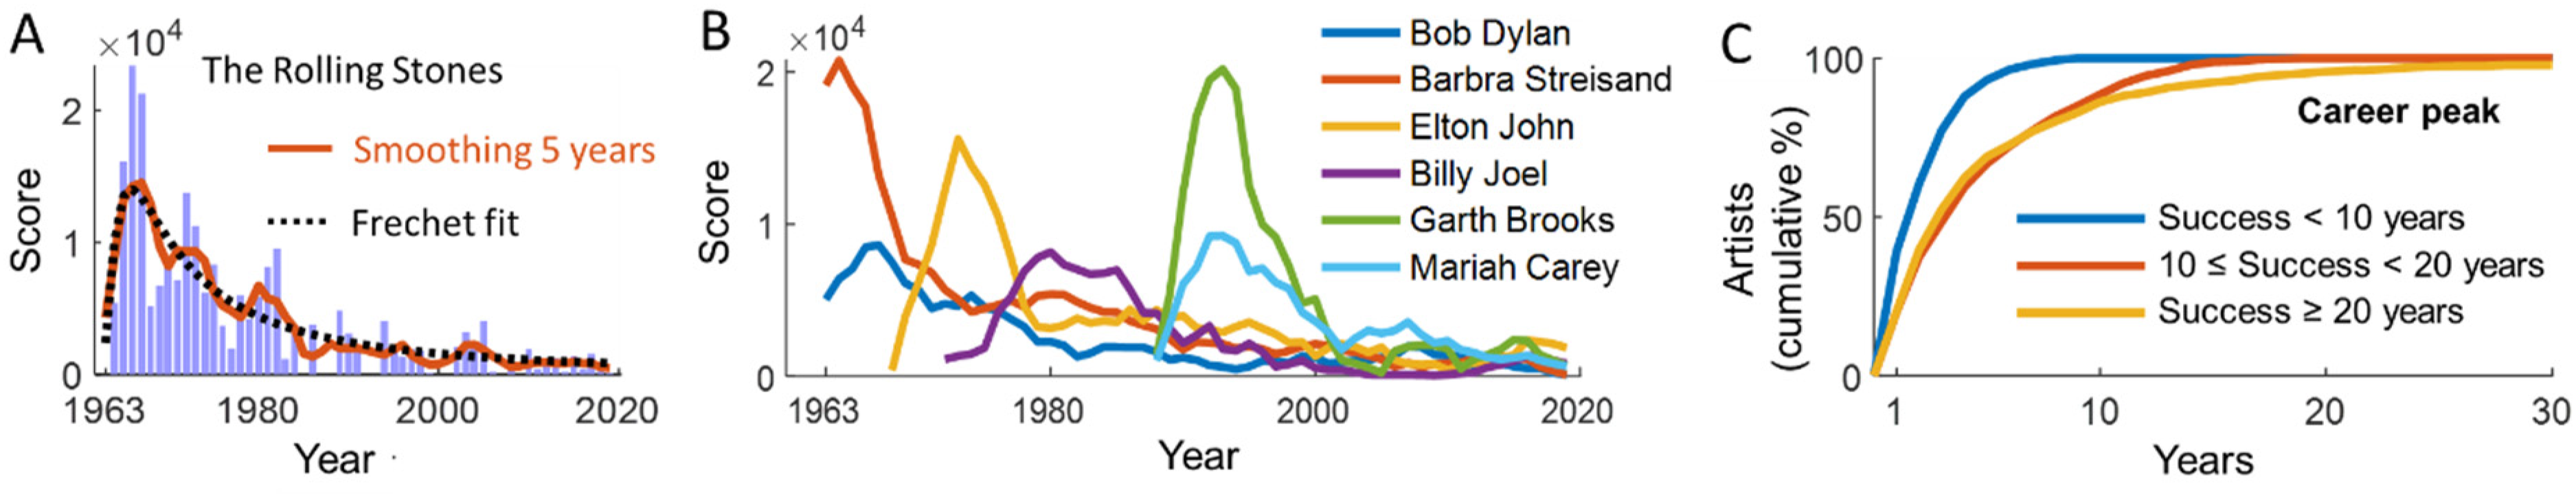
Artist's career trajectories, as revealed by the BB200. A) Example of the Rolling Stones: their cumulative score is represented by year and approximates a Frechet-type distribution. B) Many major artists follow a similar career path. C) Career peaks among artists, by length of career.
The Rise and Fall of an Artist
It is easy to imagine that an artist's success would grow and then decline, but these distributions are surprisingly consistent in their pattern: rapid success, a relatively brief career “peak,” and then a slow and inevitable decline, with no significant recovery. Unexpectedly, the same law seems to apply to artists who write only some of their own songs, such as Madonna (Figure 3Ci) and artists who only perform songs written by other people, like Barbra Streisand (Figure 3Di). It might be supposed that the possibilities for diversification and renewal open to pure singers would protect them from such a fate, but this is not the case. The relative earliness of the “peak” of success, in particular, is clearly demonstrable on a large scale. An analysis of career peaks over the entire database (9,372 artists, without excluding artists who die early or groups with that disband) clearly showed that, whatever the length of the career, the peak generally occurs between years 2 and 6–7 (Figure 2C).
The impossibility for an artist of avoiding the following decline is fascinating in itself. The BB200 database sheds light on certain aspects of this decline. A first way of approaching this aspect is to look at the evolution of the highest score achieved—i.e., the highest ranking in the BB200—by successive albums from the same artist (Figure 3A). This evolution actually depends on the number of albums released by the artist, which is not necessarily obvious a priori. Artists who have placed many albums in the charts, and therefore have a longer career, generally achieve a higher ranking for each of their albums than artists whose success is more ephemeral, who make up the bulk of the rankings (Figure 1A). More surprisingly, these prolific artists achieve increasing success up to their sixth album, and hold their own until about the tenth album, when the inevitable decline accelerates. This view is, however, relatively misleading.

Lifetime of albums in the BB200. A) Maximum score achieved by an artist's nth ranked album. B) Lifetime of the nth ranked album of an artist in the BB200. C) Example of Madonna. Cumulative score per year (Ci) and number of weeks spent in the BB200 for each of her top 10 albums (Cii). D) Similar to C) for Barbra Streisand. E) Number of weeks spent in the BB200 by an album over the decades. F) Number of albums in the BB200 each year.
Take Madonna's career, for example, which peaks in 1986 (in the sense of our “score,” Figure 3Ci), after her third album. Several of her albums reached the top spot (and, thus, a score of 200) in the 2000s (Figure 3Cii), but Madonna never recaptured the success of the 1980s, and her “decline” has followed a steady curve since 1986. Then there is Barbra Streisand, who holds the record for the number of albums reaching the number one spot and the unique distinction of having placed at least one album in the charts in every decade since 1963. However, her annual score has declined steadily since 1964 (Figure 2Di). For both these two artists, each successive album reaching the number one spot remained there for a shorter time as their careers progressed (Figure 2Cii&Dii), this phenomenon being the main contributor to the decline in their annual score.
This phenomenon is visible in analyses of all artists. For a given artist, regardless of the number of chart albums, the lifetime of each new album is shorter than that of the previous one, on average, this trend being weak at first, and gradually becoming stronger (Figure 3B). Amusingly, the marked difference between the colored curves in Figure 3B suggests that the lifespan of an artist's first album is a reasonably good predictor of the length of the artist's career! In any case, album lifespan (Figure 3B) and chart rank (Figure 3A) follow different trajectories over the course of an artist's career.
More Varied Charts over the Decades
The phenomenon described in Figure 3B may simply be related to the decline of album lifespan in the charts generally over the decades (Schneider & Gros, 2019). Artists with long careers, who began recording and performing 40–50 years ago, started working at a time when albums stayed in the charts for longer. For example, from the 1960s until the turn of the 1990s, an album stayed in the charts for a mean of 13 to 20 weeks (Figure 3E). Since the 1990s, the time an album stays in the charts has steadily decreased, to between two and three weeks today. At the same time, consistently, the number of albums passing through the charts (and, thus, the number of artists represented) each year has increased (Figure 3F). Note the decrease of such diversity since 2015, when the traditional sales-based ranking was supplemented by a multi-metric consumption rate that includes streaming (Schneider & Gros, 2019).
Evolution of an Album's Ranking
The life cycle of albums has already been studied (Hendricks & Sorensen, 2009; Jarynowski & Buda, 2014). The distribution of an album's sales over time is extremely asymmetric, with a maximum in the first week, followed by an exponential decrease (see the example of the two Coldplay albums in Figure 4A). We can also see, from the same figure, that the “rank” statistics used by the BB200 cannot account for this exponential distribution: they saturate, in the sense that the album remains in first place (Score 200) as long as its sales exceed those of the album ranked second. Note the typical shape of the curve for the change in score of the album Viva la Vida (likewise for X&Y) over the weeks in Figure 4A. Can this be modeled? Given the exponential decrease in sales of an album over the weeks, the decline of Viva la Vida's ranking in the charts depends directly on the distribution of sales of the other albums in the BB200 for a given week. A power law, i.e., a function of the 1/na type, where n is the rank of an album, may be appropriate, as suggested by analyses of the rare weekly public album sales figures, such as the Hanteo Chart in South Korea (Figure 4B). The following simple calculation can then be used to simulate the temporal evolution of an album's ranking, even if this model corresponds only to the ideal case (Figure 4C). For a given album X, the exponential decay of its sales over time can be expressed as
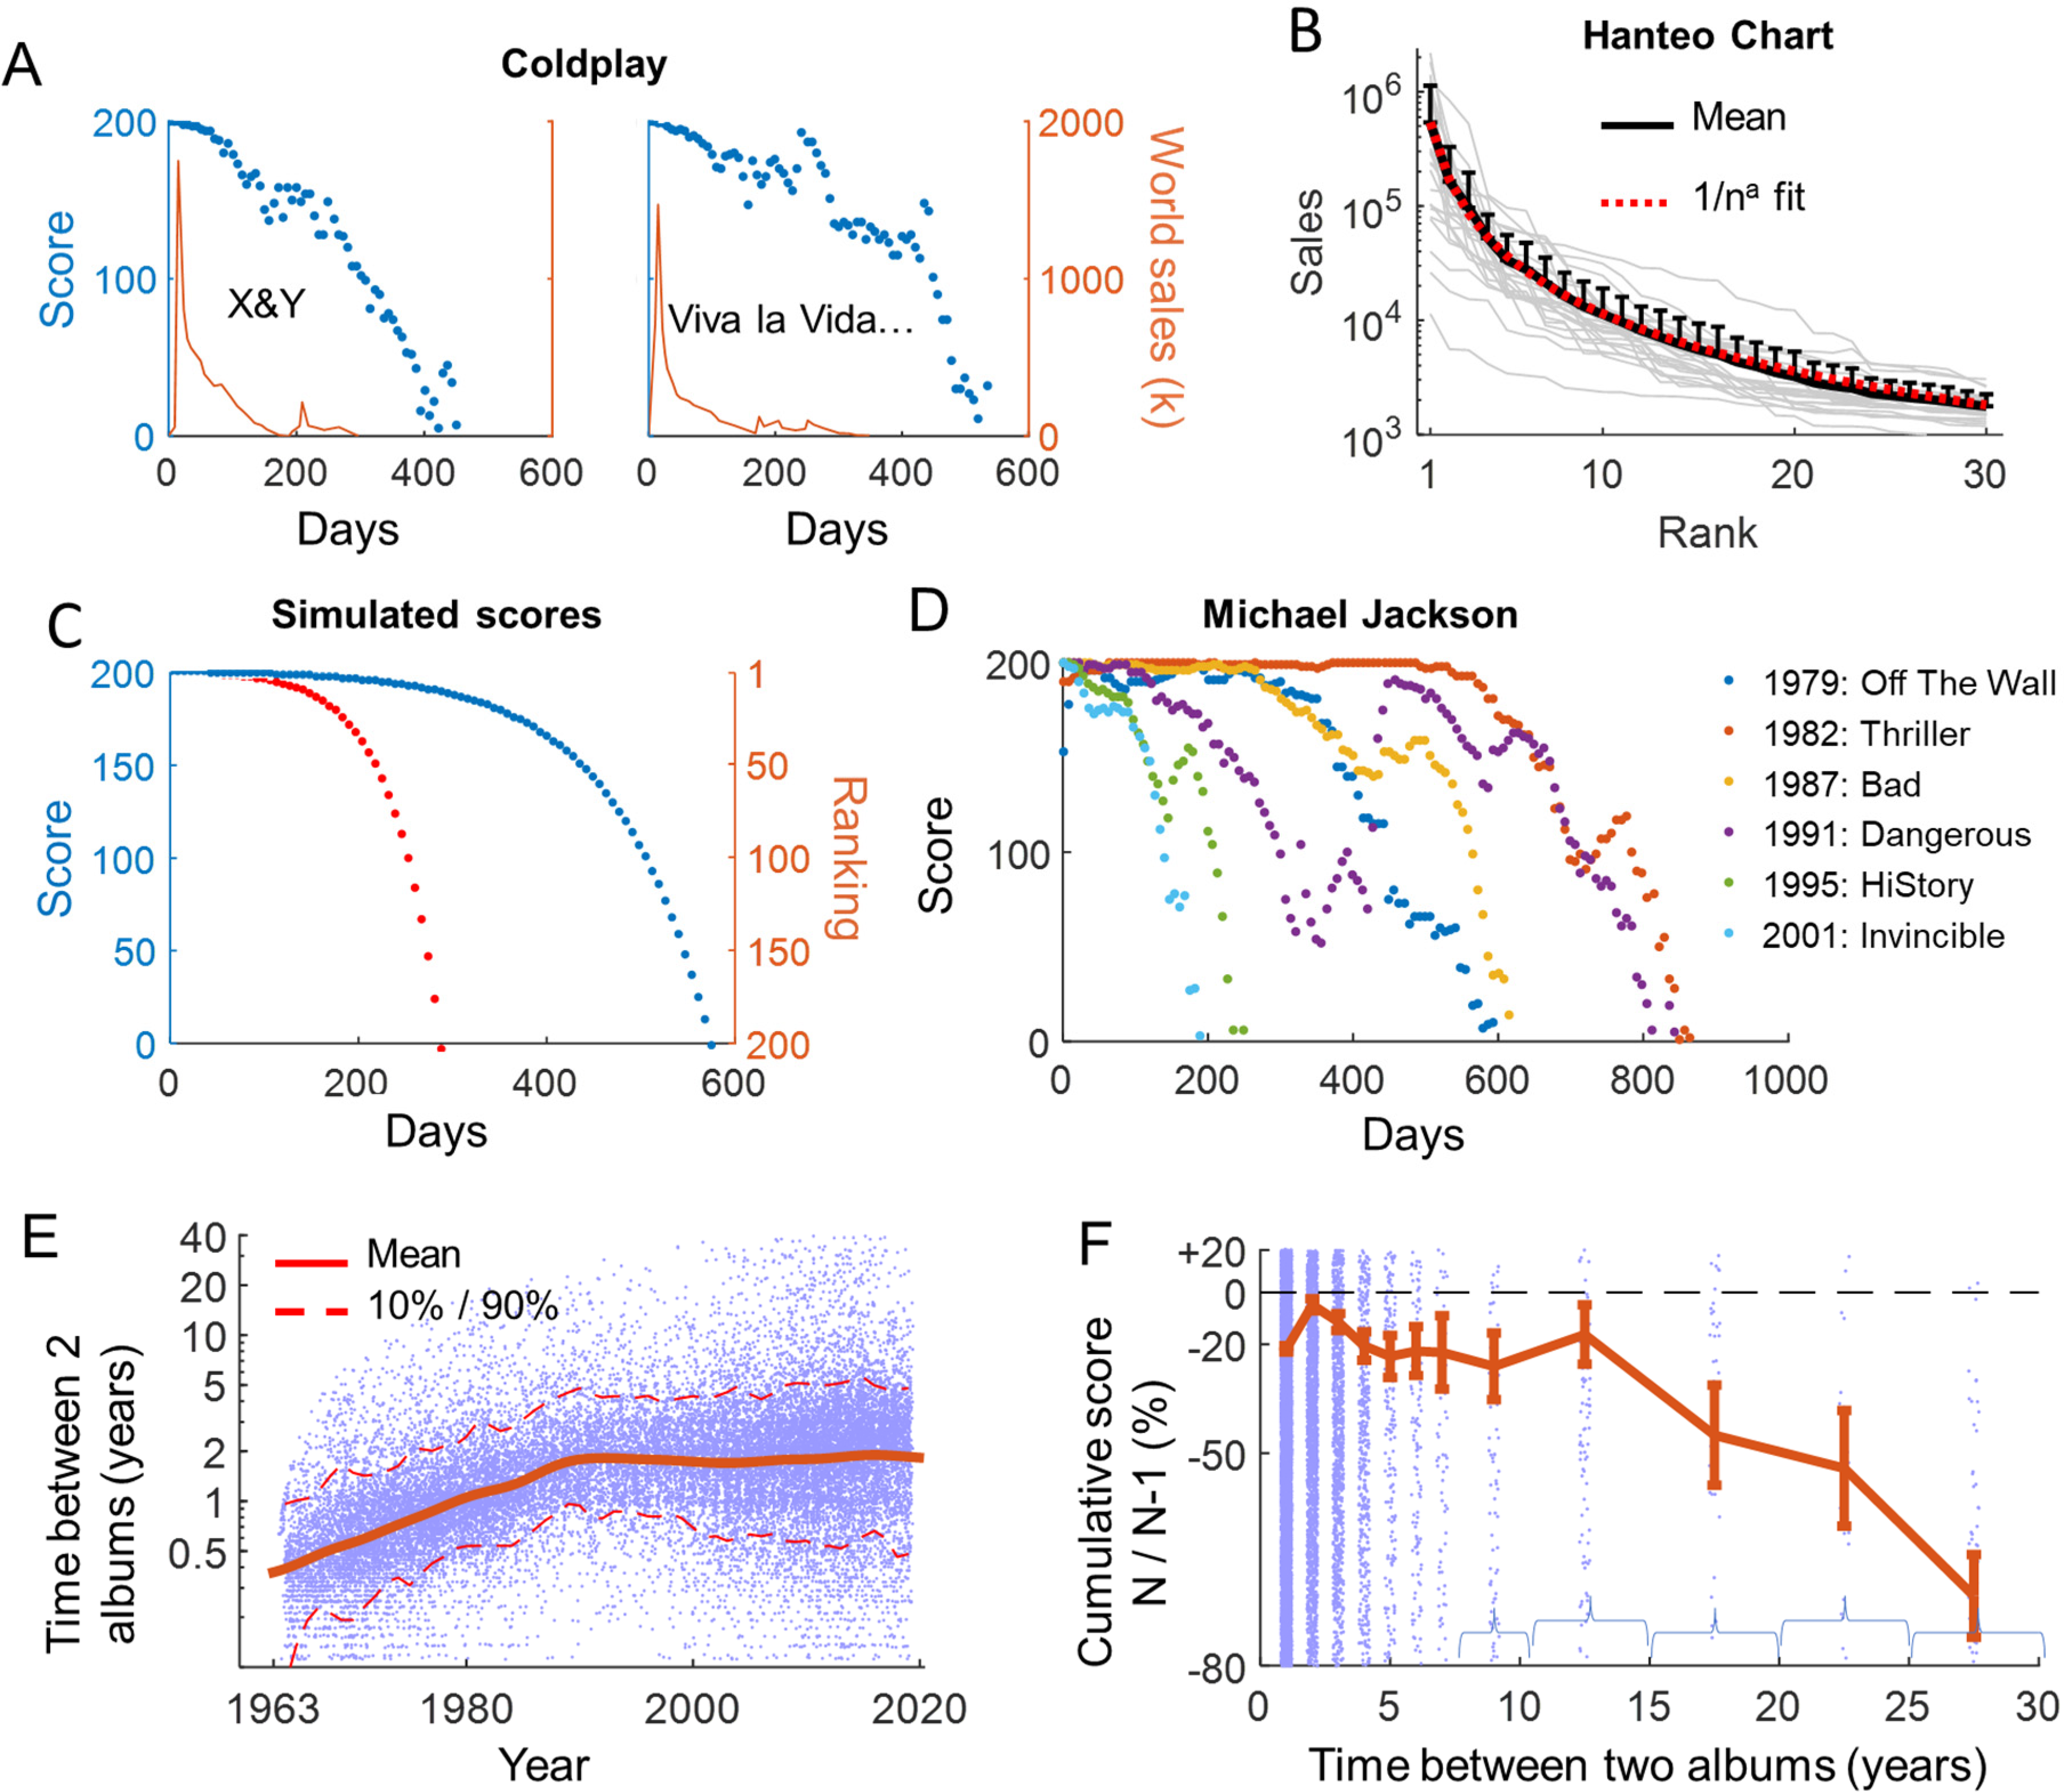
Album life cycle and production rate. A) Example of sales and rankings, by week, for two Coldplay albums. B) Percentage (in log scale) of album sales in the South Korean top 10 compared to the sales volume of the number 1 album in the first six months of 2022 (gray lines, source hanteonews.com/en). Black curve is the average and bars are standard deviation. Fit with 1/na distribution led to a = 1.67. C) Simulation of the ranking, by week, of two albums if the distribution of sales according to the ranking follows an 1/na model (with a = 1.67). model. Red and blue curves correspond to t0 = 30 and 60 (days), respectively. D) Example of the change in score (ranking) of Michael Jackson's albums over the weeks. E) Change in the number of years between two (charted) albums from the same artist over the decades. F) Change in the cumulative score of an album from a given artist relative to the previous album from the same artist, according to the interval, in years, between the release dates of these two albums. The data for the large gaps have been grouped together (brackets) to increase the number of elements in each class. Bars are standard error.
With these tools, we can then study the “life” of an album in more detail. We can compare the lifetimes of different albums from the same artist. Conversely, the differences in the ranking of an album relative to the “ideal” model illustrate its potential. For example, a long chart life illustrates the ability of an album to bounce back in the media or to attract buyers who are not necessarily inclined to purchase all of the artist’s albums. Here, we can take as an example the albums of Michael Jackson, all of which, from Thriller onwards, reached number one on the BB200. However, the patterns of change in their rankings are not similar (Figure 4D), or perfectly correlated with sales. For example, Dangerous remained in the charts for an exceptionally long period, almost matching that for Thriller, but its sales (8 million in the U.S.) were much lower than those of Thriller (20 million), or even Bad (11 million). The difference in the lifespan of the last two albums from the “King of Pop” (HiStory and Invincible) is telling. Look at the purple curve for Dangerous in Figure 4D: it followed the “ideal pattern” shown in Figure 4C in its first year. Subsequently, numerous media performances (SuperBowl, Bill Clinton's inauguration, Music Awards, Oprah Winfrey appearance) and single releases (7 in the U.S., 9 in France!) helped to recruit new fans, making it possible for the album to reach the top spot again and literally double its lifespan. Is it possible to achieve such a performance with an album of lesser quality, on the strength of marketing and media coverage alone? This seems doubtful, but it remains an open question that a closer analysis of the BB200 rankings might be able to address.
Does the Surmised Difficulty of the Second Album Exist?
It is possible, through analyses of chart data, to address the famous myth of the “cursed” second album of an artist. Is it really difficult for artists to achieve the same success for a second album as for the first? Here, we transform this basic question by considering the difficulty of placing a second album in the charts. The database does not indicate whether the first album from a given artist appearing in the charts was actually the first album of that artist. 1 However, we can obtain the first part of the answer to our question by considering the number of albums placed in the charts by the artists (Figure 1B). The scale of the percentage of artists is logarithmic, and this percentage decreases more rapidly than a simple straight line, and is perfectly predicted by a logarithmic law (Johnson et al., 2005), of the form exp(-n)/n. The advantage of fitting a model to this curve is that it allows us to identify atypical proportions. For example, the actual proportion of artists with only one album in the charts is, as indicated above, 45.8%, but the model (provided we accept that this model is relevant) predicts a value of 38.2% instead. The other percentages are correctly predicted for the top 20 albums, to within 0.5%. The conclusion is that artists who have only placed one album in the charts are overrepresented. This could also be interpreted as indicating that artists experience a certain difficulty placing a second album in the BB200. Consistently, we saw earlier that the first albums of artists remain in the charts for longer than subsequent albums, whatever the length of their career (Figure 3B). This trend is very strong for artists who have placed only a few albums in the charts. If we consider, as we suggested earlier, that the time an album spends in the charts is a more relevant indicator of success than the maximum score it reached (Figure 3A), then the conclusion is relatively straightforward: the second album in the charts was less successful than the first, despite the illusion of a higher ranking (Figure 3A).
Production Rate
The BB200 can also be used to analyze the relationship between production rate and success. In recent decades, it has become increasingly obvious that the rate at which artists produce albums has slowed. The Beatles recorded 13 albums in seven years between 1962 and 1969 and the Rolling Stones recorded 12 albums in 10 years between 1964 and 1974. By comparison, the best-selling bands of the twenty-first century, Maroon 5 and Coldplay (List of best-selling music artists, 2023), have released only seven albums in 19 years and nine albums in 21 years, respectively. This trend can be seen in the BB200 data (Figure 4E): the mean gap between two (charted) albums increased from five months (!) in 1963 to two years at the turn of the 1990s. It subsequently stabilized, but variability has increased over the last two decades (dotted lines). Has the inspiration of artists dried up since the 1960s? This is a question debated in the field (Mauch et al., 2015; Why Has Overall Musicianship in Popular Music Been in Decline since the 60s and 70s?, 2022). We cannot answer this particular question with the BB200 database, but we can at least address the question as to whether there is a production rate that would increase the success of an artist. The answer to this question is “Yes!” And that production rate is a new album every two years (Figure 4F). It should be noted that the cumulative score of an album is generally lower than that of the previous one, by about 20% in most cases. That is not very encouraging for either the artist or the producer. However, this decline is least pronounced for a two-year gap between successive albums. Late returns to the charts (“revival,” band reunions etc.) more than 15 years after a previous charted album are therefore rarely very successful. Also, contrary to what might be expected, the gap between successive albums (in the charts) is pretty stable throughout the career of artists (Supp. Figure 4A) and even tends to decrease after 20 albums, probably because of the release of concert albums and compilations at this stage of the career.
Discussion
A Little-Explored Area
The Billboard 200 database has been freely available for years. Strikingly, while music charts have long been identified as interesting sources of scientific data (Hesbacher et al., 1975), few studies actually use them. More generally, there are relatively few quantitative analysis of artists’ success (Boughanmi & Ansari, 2021; Buda & Jarynowski, 2015; Carroll, 2015; Cosimato et al., 2019; Davies, 2002; Giles, 2006; Hesbacher et al., 1982; Kang et al., 2022; Schneider & Gros, 2019; Strobl & Tucker, 2000) in the literature given the importance of music in world culture. It is, of course, possible that the three music major record companies (Warner, Universal, Sony), which accounted for 70% of global music sales in 2018 (Global Music Production and Distribution Industry Trends (2016–2021), 2021), have actually performed their own analyses and are jealously guarding their findings. After all, album sales are a well-kept secret in the music industry. Access to the database of direct sales in the U.S., owned by the RIAA (Recording Industry Association of America), for example, is not free.
Perhaps the most explored area of the success of artists is that relating to superstars (Chung & Cox, 1994; Giles, 2006; Hamlen, 1991; Rosen, 1981; Strobl & Tucker, 2000). This phenomenon is generally interpreted as a small difference in talent generating a disproportionate difference in success (Rosen, 1981). Its causes remain a matter of debate and there are two principal historical theories (Haampland, 2017). According to the first, consumers prefer to invest in the most talented artists, and only the careers of the most talented endure, leading to an accumulation of income that generates disproportionate inequalities between artists (Rosen, 1981). According to the other theory, consumers naturally, and therefore in ways unrelated to the music industry, take greater pleasure in consuming what is easier to find and therefore known, leading to even greater success for products that are already successful (Adler, 2006). Both these theories suggest that talent and success are decorrelated to some extent, which is quite a strong hypothesis. The BB200 cannot definitively settle this debate, but its data confirm the heterogeneity of success between artists, whose “scores” closely follow a lognormal distribution. This inequality is undoubtedly even underestimated, as rank statistics (and therefore the scores obtained) typically mask disparities in sales (and therefore income) between the top spots, as shown by the power law distribution of sales in the Hanteo Charts (Figure 4B). The observed lognormal distribution is not necessarily surprising, as the distribution of income in a society is also known to follow such a distribution (Clementi & Gallegati, 2006). The distribution of very high incomes follows a Pareto distribution (Charpentier & Flachaire, 2022), but it is difficult to draw a parallel with superstars because they are too few in number to test the distribution statistically. Note, however, that log(score) follows a platykurtic distribution (see methods), which indicates a lower proportion of extreme values.
The Rise and Fall of Artists
In marketing, it has been established since at least the 1960s that products have a relatively well-coded life cycle, marked by a phase of development, growth, maturity, and then decline (Cox, 1967; Levitt, 1965). Artists do not escape this fate, which weighs more heavily on them than the inevitable ups and downs of an artistic career. Surprisingly, the same Frechet-type distribution applies to many famous artists. This is, of course, an ideal model that is difficult to test on a large cohort: by definition, artists with little success will not reach a high score frequently enough for their career to be followed in the BB200. Sales figures for even modestly successful artists, or other objective measurements of their success throughout their careers would be required to confirm this hypothesis. Theoretically, an artist's annual score could be simulated using the combination of the following models: 1) a production rate of albums, which is roughly constant as shown in Supp. Figure 4A; 2) a rise and fall function of the maximum score achieved by an artist's nth ranked album as shown in Figure 3A; 3) a lifetime function of the nth ranked album of an artist as shown in Figure 3B; and 4) a function
The decline in the lifespan of albums also leads to an inevitable decline in artists’ scores. On the one hand, the lifespan of albums in the charts has decreased over a period of decades (Schneider & Gros, 2019), which may contribute to the phenomenon. On the other, an intuitive explanation for this phenomenon would be that there is already a fan base for each new album, with fans buying the album immediately, particularly if the artist is known from a previous album or has benefited from strong media promotion (Strobl & Tucker, 2000). Sales are then concentrated in the first few days after the release of the album, enabling the album to reach a higher chart position than the previous album, without necessarily achieving higher sales figures at the end. This could explain the increase in chart score for an artist's first six albums in Figure 3A. Conversely, these albums would disappear increasingly rapidly from the charts in the absence of new fan recruitment, and this phenomenon is evident from the first album onwards, accounting for the increasingly short life span of albums in Figure 3B. More formally, the decline in the success of a band or artist over the course of several albums could thus be described as a deficit due to the number of “disappointed” fans not buying the new album exceeding the number of new fans recruited. On the one hand, the “disappointment” of fans can be explained by the lack of novelty, the decline of talent or inspiration, or weariness with an already known style. On the other, a lack of new fans may reflect too little publicity, label investment or touring, an outdated musical style or, more generally, the fact that artists often find their audience quickly, with little renewal thereafter.
Musical Diversity and Quality
Because of the curatorial turn in streaming, there have been concerns of convergence towards a limited number of artists in popular music, i.e., an acceleration of the superstardom phenomenon, which have been contradicted by recent studies (Bello & Garcia, 2021; Bourreau et al., 2022; Datta et al., 2018). How did musical diversity evolve since the 50s? Consistent with a previous study (Schneider & Gros, 2019), we show here that success is more diverse than it was a few decades ago, in the sense that more artists reach the charts every year. It is difficult to determine whether this is a direct consequence or the cause of the shorter life span of albums (or singles (Spivack et al., 2019)) since the 1990s. In any case, several hypotheses can be put forward: buyers are “consuming” more music, renewing their “stock” more frequently, or, with the same end result, consuming music of more varied styles (Schneider & Gros, 2019). Media acceleration, with a succession of “buzzes,” also decreases the duration of media exposure for a given album. The development of streaming and the globalization that accompanies it should further amplify this phenomenon in the future, unless the concept of the “superstar” monopolizing the world's charts puts a brake on this momentum. Some authors have even suggested that the acceleration of chart renewal may reveal a “speed-up of societal and political processes at large” (Bentley et al., 2017; Schneider & Gros, 2019) together with a faster geographic spread (Buda & Jarynowski, 2015). Finally, we cannot exclude the hypothesis of a real or perceived decline in the overall quality of the music produced. Indeed, more “mediocre” music does not allow an album to persist and recruit fans from beyond the consumer circles that pushed it into the charts in the first few weeks. Are there as many legendary songs in the collective memory from the last two decades as there are from the 1960s and 1970s, or even the 1980s and 1990s? Recent investigations suggest that this might not be the case (Spivack et al., 2019).
Is it even possible to isolate the “intrinsic” quality of an album out of context? This seems difficult. 2 The quality of the music, the fact that it belongs to its time or that it is truly innovative, the media coverage it received, an ability to withstand the test of time over a period of decades, to create consensus or to create a rift—there is no shortage of factors to be considered. Nor can we simply compare the sales of an artist's different albums. On the one hand, the number of albums sold in the history of music varies by a factor of 1 to 3, with a maximum in the 1990s (U.S. Recorded Music Sales, 2022). On the other, album sales figures are not available from a free database. The changes in an album's ranking over the weeks and its lifespan in the charts, as provided by the BB200, at least provide interesting criteria for the comparison of albums from the same artist, as illustrated by our study of Michael Jackson's albums (Figure 4D). It has also been hypothesized that the initial ranking of an album may determine its fate (Schneider & Gros, 2019). Overall, charts provide individual success trajectories for albums and artists for a long period with stable metrics and economic circuits. In a few decades, such trajectories shall be compared to those emerging from the dramatic changes in music listening habits and consumption of people.
From Success to Musical Talent
In this study, artists are considered as isolated and comparable individuals. This is obviously a practical, but simplistic view. First, the association between musical success and artists is necessarily incomplete, and may even be abusive. Performers who do not write their own songs, for example, are highly dependent on the intrinsic musical quality of their album and, therefore, on the talent of the composer. Fame, media coverage, and the match between musical supply and demand are also important factors for success that are not easy to analyze objectively for hundreds of artists even if metrics based on social and traditional media coverage of albums seem to allow good prediction of musical success (Cosimato et al., 2019). Moreover, the influence of production is growing in the success of artists (Staff, 2021), particularly in the U.S. and in current urban and R&B music styles, 3 and is disrupting the natural association between the talent of the artist and the artist's success. Where would Radiohead be without Nigel Godrich? It is impossible to answer such question. In general, the quality of an album rarely depends on the artist alone, other than in “traditional” forms of music (American folk, chanson française), in which the author, composer, and performer are often one and the same. Nowadays, albums often result from a mixture of contributions to the text, composition, production, and interpretation that is difficult to deconstruct when trying to analyze the reasons for musical success. Moreover, these contributions change from one album to another. Interestingly, at the scale of a career, it has been shown recently that the number of collaborations could be highly predictive of musical success in the charts (Kang et al., 2022).
Also, the predominance of the pop/rock/variety style in the charts means that the “fan” base for jazz, contemporary, or classical music remains more commercially restricted, clearly creating a bias against artists performing music of these styles. Should commercial success be the benchmark of musical talent? Of course not. For example, artists like Duke Ellington never sold many albums. Innovation, and the ability to emerge and endure within a stylistic community, are all markers of a certain genius. However, it would also be unfair to claim the opposite: the strength of a widely sold, famous and timeless simple pop-rock melody (think of Paul McCartney's “Yesterday” and Lennon's “Imagine”) certainly reflects a particular ability of that musical style to convey emotions in a universal way. There is, thus, no clear relationship between the cognitive processes of musical creativity, the subjective appreciation of musical creativity, and actual marketing success (Schiavio et al., 2021).
Other Limitations of the Study
These results call for further investigations, but also caution, due to other methodological limitations. One of these limitations is the very nature of the BB200, which is a ranking of album sales. It is common practice in science to use non-parametric “rank” statistics to compare quantities. The disadvantage of such statistics is that they are subject to “saturation”: Album sales can decrease by a factor of three from one week to the next, with the album remaining in the number one position. A new album from an artist may also outsell its predecessor but achieve lower scores, if its release coincides with that of a “smash hit” album by a superstar, for example. The score of an album is, by definition, relative to that of others available at the same time, whereas album sales provide a more absolute measurement of success. Equations for transferring from a rank (or score) to a value closer to sales have been proposed (Carroll, 2015; Hesbacher et al., 1982). We are aware of these equations, but the use of a score in this study was simpler and had the advantage of providing a comparable measurement scale for albums from different periods. Indeed, scores do not suffer from the overall variation in album sales over the decades, for example (U.S. Recorded Music Sales, 2022).
Another structural limitation concerns the necessarily restrictive view of the U.S. market provided by the BB200, whereas music is a global phenomenon. However, databases equivalent to the Billboard 200 are not very common around the world, and were often founded more recently or are less comprehensive. For example, the French Top 50 only dates from 1984 (Syndicat National de l’Édition Phonographique, 2022). The German charts started with 50 albums in 1959 before expanding to 100 only in 1989 (GfK Entertainment Charts, 2022). The modern version of the Italian Top 100 only dates from 1994 (Federazione Industria Musicale Italiana, 2022). The English reference charts contain 75 or 100 albums (UK Albums Chart, 2022). In addition, the overwhelming dominance of the United States should not be underestimated, as the U.S. market accounts for one third of the world music industry's sales (Global Music Report, 2023). This dominance is also enshrined in the dominant musical styles: pop/rock, variety, R&B, and urban music. The trends observed in this article do not necessarily apply to world, classical, jazz, or contemporary music artists. 4 Here again, it seems likely that we are at a turning point in history, as the predominance of the United States has tended to decline over the last decade. Five countries (the U.S., Japan, the United Kingdom, Germany, France) have long accounted for 80% of global music sales, but streaming has enabled a rapid globalization of music sales and revenues, including strong growth in Asia, in particular (Joux, 2018; Strobl & Tucker, 2000). It is possible that other musical styles (Korean K-Pop or Indian or South American world music) and, possibly, other consumption habits will further disrupt the current situation in the years to come.
Perspectives and Conclusions
The BB200 database alone is not sufficient to answer many open questions about musical success. For example, we have studied the duration of success here, but were unable to link it to obvious factors, such as the age of the artist. There is a theory—not formalized but often mentioned (Anderson, 2016; Forever Young, 2016; What Bands Have Kept Releasing Hits into Their 40s?, 2022)—that artists lose their inspiration and/or their ability to produce “hits” after the age of 40. The rare counter-examples sound more like exceptions proving the rule. Moreover, after the age of 50, examples become even rarer. 5 It can also be hypothesized that career length is at least as great a constraint as age in terms of inspiration. Thus, a later start may help to push back the 40-year barrier. 6 A fine-grained study of this kind of hypothesis requires the cross-referencing of hit databases, such as BB200, with artist databases, such as musicbrainz. Surprisingly, this area of research remains in its infancy, even in the age of BigData. As pointed out above, the study of factors influencing success (media coverage, distribution, political or social context, gender (Lafrance et al., 2011) etc.), which should be objectively quantified at the scale of hundreds of musical successes, also remains at a very early stage (Cosimato et al., 2019).
The musicbrainz database also includes some metadata relating to musical content (tempo, key, mode, harmonicity, timbre). With data of this type, it is already possible to quantify the diversity of musical styles over the decades (Mauch et al., 2015) or collaboration-based networks and social-based coverage predictive of musical success in the charts (Cosimato et al., 2019; Kang et al., 2022). In the future, it may become possible to identify constants and patterns among the great hits and to finally “crack” the code defining a sure-fire hit. Artificial intelligence is already being used to compose fairly coherent pieces of music today. Will the machine eventually triumph over human creativity? Will human creativity eventually run out of steam with the intensive musical exploration of the last 70 years? Will we be able to create as many legendary songs in the coming years as we did in the 1960s? The future of music is exciting and intriguing, but perhaps also more analytical.
Supplemental Material
sj-docx-1-mns-10.1177_20592043231186692 - Supplemental material for Billboard 200: The Lessons of Musical Success in the U.S.
Supplemental material, sj-docx-1-mns-10.1177_20592043231186692 for Billboard 200: The Lessons of Musical Success in the U.S. by Boris Gourévitch in Music & Science
Footnotes
Action Editor
Kelly Jakubowski, Durham University, Department of Music.
Peer Review
Daniel Shanahan, Northwestern University, Bienen School of Music, Klaus Frieler, Max Planck Institute for Empirical Aesthetics.
Author Contributions
BG designed the study, analyzed the data, wrote and revised the document.
Declaration of Conflicting Interests
The author declared no potential conflicts of interest with respect to the research, authorship, and/or publication of this article.
Ethical Approval
This research did not require ethics committee or IRB approval. This research did not involve the use of personal data, fieldwork, or experiments involving human or animal participants, or work with children, vulnerable individuals, or clinical populations.
Funding
The author disclosed receipt of the following financial support for the research, authorship, and/or publication of this article:
Fondation pour l’Audition, Agence Nationale de la Recherche, (grant number FPA-IDA03, ANR-21-CE34-0012).
Supplemental Material
Supplemental material for this article is available online.
Notes
References
Supplementary Material
Please find the following supplemental material available below.
For Open Access articles published under a Creative Commons License, all supplemental material carries the same license as the article it is associated with.
For non-Open Access articles published, all supplemental material carries a non-exclusive license, and permission requests for re-use of supplemental material or any part of supplemental material shall be sent directly to the copyright owner as specified in the copyright notice associated with the article.