
Abstract
Jill Jarman completed the musical composition Resonance for solo cello in 2022 with the intention that it would be heard, seen, and felt as a multisensory experience. The cellist Laura Ritchie produced cymatic images for each of the musical pitches in the work, compiled them in a video, and rehearsed to be able to perform the first live synchronized multisensory performance with integrated mathematically accurate cymatic images. The cymatic images were generated using a tonescope emulator in the Cymatic Frequency Emulator software package. Images were compiled and arranged on screen in time and space to create a visual representation of the musical sounds. The resulting video accompanied live performances to enable the audience to have a full experience of the musical notes in physical, visual, and aural forms. Challenges of production and opportunities for future applications of this research are discussed.
Introduction
From a performer's perspective music has physicality and is produced through physical means (McCormack, 2010). The string player feels every note as the fingers of one hand decide the length of the string and the other hand draws the bow to set the sound wave in motion. Typically instrumental music is produced through touch and received through hearing; we listen to music. However, music does not exist exclusively as something perceptible by one sense alone; musical pitches do have inherent, tangible substance that is perceptible through multiple senses. Although a multisensory approach enhances the experience of musical perception, the practical possibility of mixing sensory modes to allow a more diverse experience for perceiving music is seldom researched or realised (Gabrielsson, 2003; Juslin, 2005; Platz & Kopiez, 2012).
Jill Jarman is a contemporary English composer who has experience working with sensory impaired musicians and has produced compositions that specifically cater to senses other than just the ears. Her piece Echoes from the Birdcage (2017), written for Dame Evelyn Glennie explores the multi-cultural sound world of Kings Cross. It is performed with a music ‘signer’, communicating the music through Sign Language, which allows both hearing and non-hearing audiences to share the experience. Jarman's orchestral work Soundwaves of light (2006), is inspired by the frequency of light from the stars in the sky, brought into the human aural range and used as a musical pallet from which to compose. For Soundwaves of Light, Jarman worked with physicist Dr Paul Stevenson to utelise aspects of the stellar spectrum emitted, as determined by each star's elemental composition. By attending to the scientific detail of the processes which connected the source material to her music, Jarman actively worked to close the gap between music as a representational art and music as an inherently multisensory experience.
The following discussion focuses on the multisensory realization of Jarman's composition Resonance for solo cello. Jarman composed the two-movement work (first movement completed 2014, and second movement 2022) with the intention that the science of cymatics would be used to visualise the music: Resonance was intended to be heard, seen, and felt, with each note having its own distinct physical and aural characteristics.
Listening to music encompasses more than the discrimination and identification of individual pitches to include the perception of “emergent properties not present in the component notes” (McDermott & Oxenham, 2008, p. 452). Contextualised cognition takes into account relational aspects, patterns, and temporal placements of sounds to form meaning from music. Even though music exists most obviously in heard sound waves, non-hearing senses should not be discounted when it comes to the reception and perception of music. Not all senses may be equally involved in music perception, but when catered for, the interaction of multiple sensory inputs cay influence and guide deeper perception and experience of the music. Hodges et al. (2005) define the multisensory perception of music as “input from different sensory modalities is integrated into a coherent perceptual gestalt” (p. 175).
Music is presented as an aural phenomenon (Thompson et al., 2005), just as text is visual, and speech is aural, but these assumptions instantly dissolve when considering the blind feel text and the deaf see speech. What if music also holds the possibility of being visual and having tangible substance? Research exploring a multisensory approach to music often focuses not on performance to the general public, but on marginalized groups, specifically those with some form of deficiency such as special educational needs, a sensory impairment, or dementia (Dowlen & Keady, 2022; Frid, 2019; Russo, 2020). The present research explores bringing an accessible, multisensory musical experience to all.
Seeing Music
The composer Oliver Messiaen famously experienced music as something seen in color through the phenomenon of synaesthesia (see Harrison & Baron-Cohen, 1994). Although this is a particular neurological condition, Ward et al. (2006) suggest elements of synaesthetes’ experiences are available to all who experience music. The visual aspect of experiencing music is often directed at watching or identifying the source of the music and not the music itself (Thompson et al., 2005). For example the audience watches performers create music on their instruments; they do not see the music itself. They do see gesture, which conveys aspects of the musical meaning, and Küssner (2018) evidenced through research examining drawn impressions of musical meaning.
Vibrations can of course be felt, and devices including bone-resonating speakers and wearables like a vibrating glove (Mazzoni & Bryan-Kinns, 2016) and wristband (Perrotta et al., 2021) allow individuals to feel the music directly through intensified vibrations against their skin.
Evidence of sound vibrations can be seen on some instruments (e.g., a moving string) at a very close range but this is not the sound itself. When considering the visual perception of sound waves, individual sound waves can be distinguished one from another by viewing their length. Just as the minute differences in pitch are perceived by the ear, the eye could see small variations in length, and aspects of the patterned relationships in the structure and makeup of musical sound could guide a learned visual distinction between pitches. However, the length of a wave is a two-dimensional representation that shows little in terms of the uniqueness of each different pitch.
Chlandi (1787) demonstrated aspects of the physical properties of sound waves by bowing the edge of a metal plate covered with sand. The vibrations caused the sand to gather into patterns making the nodes visible. This showed the places on the plate's surface that did not vibrate. In effect he demonstrated the physical components of harmonics and laid the groundwork for future research into visualisation of sound. (See also Wheatstone, 1833).
In 1967 Hans Jenny furthered this study with a series of very well documented experiments where he used an oscillator to guide sound through a metal plate to demonstrate the alignment of frequencies from the oscillator with resonant harmonics of the plate. The sand on the surface of the plate formed unique geometric patterns. By specifying the frequency and using the strength of the direct input from the oscillator, he was could selectively match frequencies to the resonant harmonics. The pure tone of the oscillator allowed Jenny to excite the sand precisely and his resulting patterns are a physical representation of each frequency as it aligns with and is translated through a specific harmonic on that plate. Jenny's research extended to using round plates and other powder and liquid substances to generate a wide variety of patterns (Jenny, 2001).
He called this science cymatics, building on the Greek ta kymatika “on matters pertaining to waves” (Jenny, 2001, p. 20). As Jenny experimented it became clear that each differently sized plate produced its own unique set of resonant harmonic frequencies. These resonant frequencies did not necessarily align with musical pitches but fell on fractions of Hertz in between traditional note values and the harmonics of each plate produce a set of patterns unique to that size of plate. For example, a square plate with a side length of 300 mm will produce a different set of resonant frequencies with a different set of patterns to a plate with a side length of 302 mm.
The Challenge of Live Cymatic Image Generation
Jenny's experiments produced images for single note frequencies, and not music in either time or space. The concept of producing cymatic images for instrumental music is attractive, but incredibly complex. To date there have been no strictly acoustic performances with live-generated cymatic images.
A confounding practical challenge to producing cymatic images with a plate is which of the plate harmonics align with the various musical pitches and whether these (pitches or harmonics) are physically accessible. As each plate has its own harmonic series which does not follow the natural overtone series, but is akin to a Bessel function (Wu et al., 2007), matching a full multi-octave instrumental range necessitates using quite high numbered harmonics from the plate. Reliably exciting these harmonics is a challenge that may be beyond a physical reproducible possibility. Stanford (2014a) created a video showing what appears to be an electronic keyboard producing a series of four repeated images on a plate in a ‘live’ context. However the images were not created live or with the pitches heard. Stanford explains: After finding out what frequencies resonated the plate the best, I selected four shapes that looked good, giving me four notes to use for the musical instrument that would accompany it. Because the sand took a few milliseconds to move into the next shape, I couldn't change notes very fast, and so wrote something that stayed on each note long enough for the shape to form. Originally I wanted to use the actual audio that generated the shapes, but it was very high pitched, and kind of un-musical - so I ended up just using the notes I wanted, and mixing a recorded element of the sound of the actual plate with a simple synthesizer sound. (Stanford, 2014b)
In theory, a practical solution could include a set up with multiple carefully chosen plates to ensure the desired musical pitches align with harmonics found at the very low end of the harmonic series of each plate. However, this is not practical for a live performance and an oscillator that is directly connected via a speaker to the vibrating plate is far different to a person playing an instrument in a venue. Each instrument has its own harmonic envelope and tone including other confounding noises such as the sounds related to the mechanics of the onset of a musical pitch: the scraping of the bow or the flow of breath (Butler, 1992). The strength and clarity of the input are necessary for creating cymatic patterns and this is currently an unsolved challenge for live instruments.
The CymasSope is a single instrument (tool), invented by Reid (2014), to produce 3D patterns as the result of musical sound input. There is very little publicly available information on the CymaScope and it is unclear exactly what is being produced in terms of the computational algorithm, as there is no published information about the size of the membrane or how the images created relate to the direct vibrations. Ried's website states: The CymaScope instrument reveals a cross section through a sound bubble: cymatic patterns on a circular membrane can be considered representative of a 2D slice through a 3D sound bubble. This is based on the physics principle that the crests of the ripples in the cymatic pattern are in phase with the crests of the pressure graph of the sound that created the pattern. (Reid, 2022)
To date the CymaScope Institute are documented as being commissioned in 2014 to produce 2D circular images for 12 piano notes and released a video of circular projections of the patterns produced on water membranes with the CymaScope of individual piano keys being struck (Reid, 2014). There are no other publicly documented examples of cymatic representations of notes by the CymaScope. Others have produced artistic impressions of cymatic waves such as with Grillotti's (2019) multisensory art instillation that included sound, color, and cymatic waves in liquid. There are a host of commercially available visualisers for music, such as Magic Music Visuals (https://magicmusicvisuals.com/) which has geometric patterns generated by a sound input, but does not scientifically represent cymatic patterns created by the frequency of any one note.
A practical solution to creating cymatic images is to use a computer simulator. The Cymatic Frequency Emulator is the only commercially available computer programme which is a “mathematically accurate Tonoscope emulator” (Secret Energy, 2022). This software enables the user to set the size of a virtual plate and to then generate cymatic images for each of the resonant harmonics of that plate. The user specifies a frequency range (e.g., 0–5000 Hz or 0–10,000 Hz), and the programme displays harmonics with frequencies that extends both below and above the 8 octaves typically used in instrumental music. Once the initial settings are configured, the programme displays the first harmonic for that plate. In Figure 1, the fundamental harmonic for a square plate with 418 mm sides is shown to be 12.5 Hz, which is below the threshold for human hearing.

Image of the cymatic frequency emulator software.
There are various basic limitations to the software, such as older operating system requirements (Windows only, and no newer than Windows 10, no Mac version). There are limitations of the plate size one can choose dictated by the physical pixel capacity on the display screen of the computer monitor. For example the image in Figure 1 typically fits on a laptop screen, however the plate size used in the present research the use of a larger monitor to enable the programme to functionally display a larger simulated plate. Finally the overall resolution of the images produced is limited to that of the size shown on screen; there is no enhanced resolution which enables scaling that is not hugely pixilated. The programme does allow for scientifically accurate images to be produced which are detailed far beyond physical production capabilities with external ‘live’ equipment. Creating images with the Cymatic Frequency Emulator also solves the additional practical problems to do with creating the images of needing multiple plates, of being able to discretely access higher harmonics, and of being able to change from one image to the next quickly which are barriers to using cymatics with instrumental performance.
Method
Creating Cymatic Images for Resonance
The Cymatic Frequency Emulator software was used to create a full library of images that could be used with a functional performed rendition of Resonance. The creators of the software openly encourage creative projects and impose no restrictions on the use of images created.
To visualize the music, the pitches composed for the cello needed to align with the harmonics naturally occurring on a plate. When the plate size changes, so do its harmonics, and not all sized plates produce harmonics that align with musical pitches. It was necessary to find the exact size of plate that would produce harmonics best aligned, beginning with the lowest note of the cello as close to the fundamental harmonic of the plate as possible. Then subsequent harmonics needed to match the chromatic pitches of the musical scale as closely as possible across the four octaves of chromatic pitches in Resonance. This was achieved through several trials of manually checking the harmonics of different plate sizes, changing by 1 mm at a time.
A plate size of 434 mm allowed a very good fit, with the plate harmonics and the frequency of the musical notes being within 2 Hz of each other for over 95% of the notes across the four octaves (40 pitches < 1 Hz difference, seven pitches between 1–2 Hz different, and two pitches with a 2–3 Hz difference). Once generated, the cymatic image for each note was saved as a .bmp file to retain the best possible resolution. The measurements of the pitch frequency, the frequency and number of the generated plate harmonics from the bottom and top octaves used in Resonance are detailed in Table 1 1 .
The Musical Note Names and Their Frequency, and Then the Frequency and Number of the Resonant Frequency on the Simulated Plate from Notes C2-C3 and C5-C6.

The open cello C string (C2), the lowest note of this composition, aligned with the 8th harmonic on this 434 mm plate. Various plate sizes were explored to see if it was possible to begin the image generation with the fundamental harmonic of a plate, and move chromatically along with the harmonics, but this was not possible as subsequent harmonics either fell between or passed over and did not align with the notes of the chromatic scale. There was considerable searching to find a plate with harmonics that aligned as synchronously as possible with the chromatic pitches of the musical scale. Other plates were possible, but they required starting with even higher harmonics. This 434 mm plate allowed the earliest start and the closest alignment between the frequency of the notes and the harmonic series of the plate.
Also, in Table 1 note that across the four-octave range, the harmonic numbers progress quickly, moving into and through the hundreds. Higher numbered harmonics are closer together in frequency, and these harmonics are only possible to generate with software. They would not be possible to reliably single out and achieve with an acoustic instrument and a physical plate.
The resulting library of electronic images see Figure 2 provides a scientifically based starting point for a cymatic interpretation of the work. The images alone did not represent the composed music, performed music, or the audience's musical experience. The images are merely black and white squares with patterns, in the same way that sound waves could be described as noise before they are composed to be music.
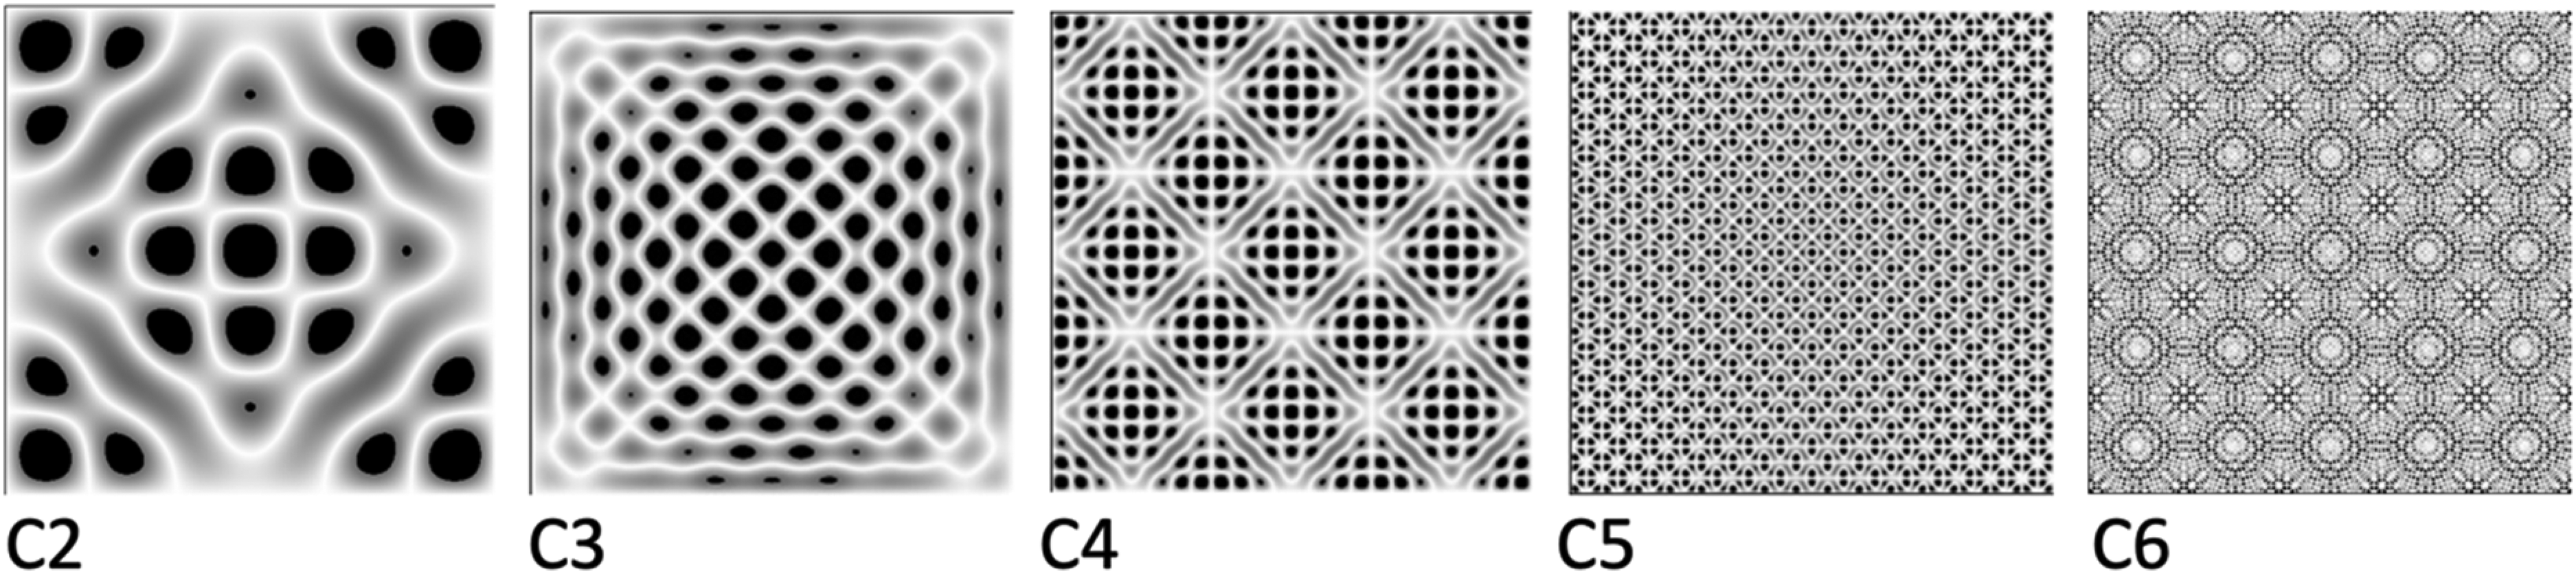
Cymatic images for the note C across four octaves. As the pitch increases, so does the complexity of the generated sand pattern. Copyright for the images of the musical pitches on the cello resides with the author.
When examining the cymatic patterns for the notes, it is clear to see the relationships demonstrated by sound waves with intervals such as octaves are not related in the same way graphically. There are similarities, but the images do not strictly double as a sound wave would to create a pitch in the next octave. This is because the harmonics of the plate are unique to the plate and do not follow the same organization as musical harmonics of the natural harmonic series.
Creating a Performance
The visual aspects of the presentation needed to be considered in terms of the musical aesthetic experience. Having uniform static images which were all the same size (in black and white) was not adequate in representing live music, in the same way that the uniform typeset characters for the note values do not depict the musical experience, even when they are placed in the correct places on the musical staff. There were several considerations for the treatment of the images.
They needed to appear visually with the performed sound. As it was not possible to generate them live, they would have to be sequentially programmed to appear exactly in sync with as a live performance took place. The first step in achieving this was to use an audio recording of a live performance as a template to align the images. It was also necessary to consider their presentation so there was not simply a sequential alternation of squares on a screen. All the aural timbral, dynamic, and melodic qualities written into the piece and expressed through performance had to be considered to instill the heard aesthetic interpretation into the visualised music. The open-source video editing software HitFilmExpress was used to allow the images to be imported and manually placed on the screen.
To transform the cymatic patterns into visualised music, the images were compiled, coloured, and arranged on screen and animated by hand, to portray aspects of the performer's musical interpretation using the programme HitFilmExpress. This is shown in Figure 3.
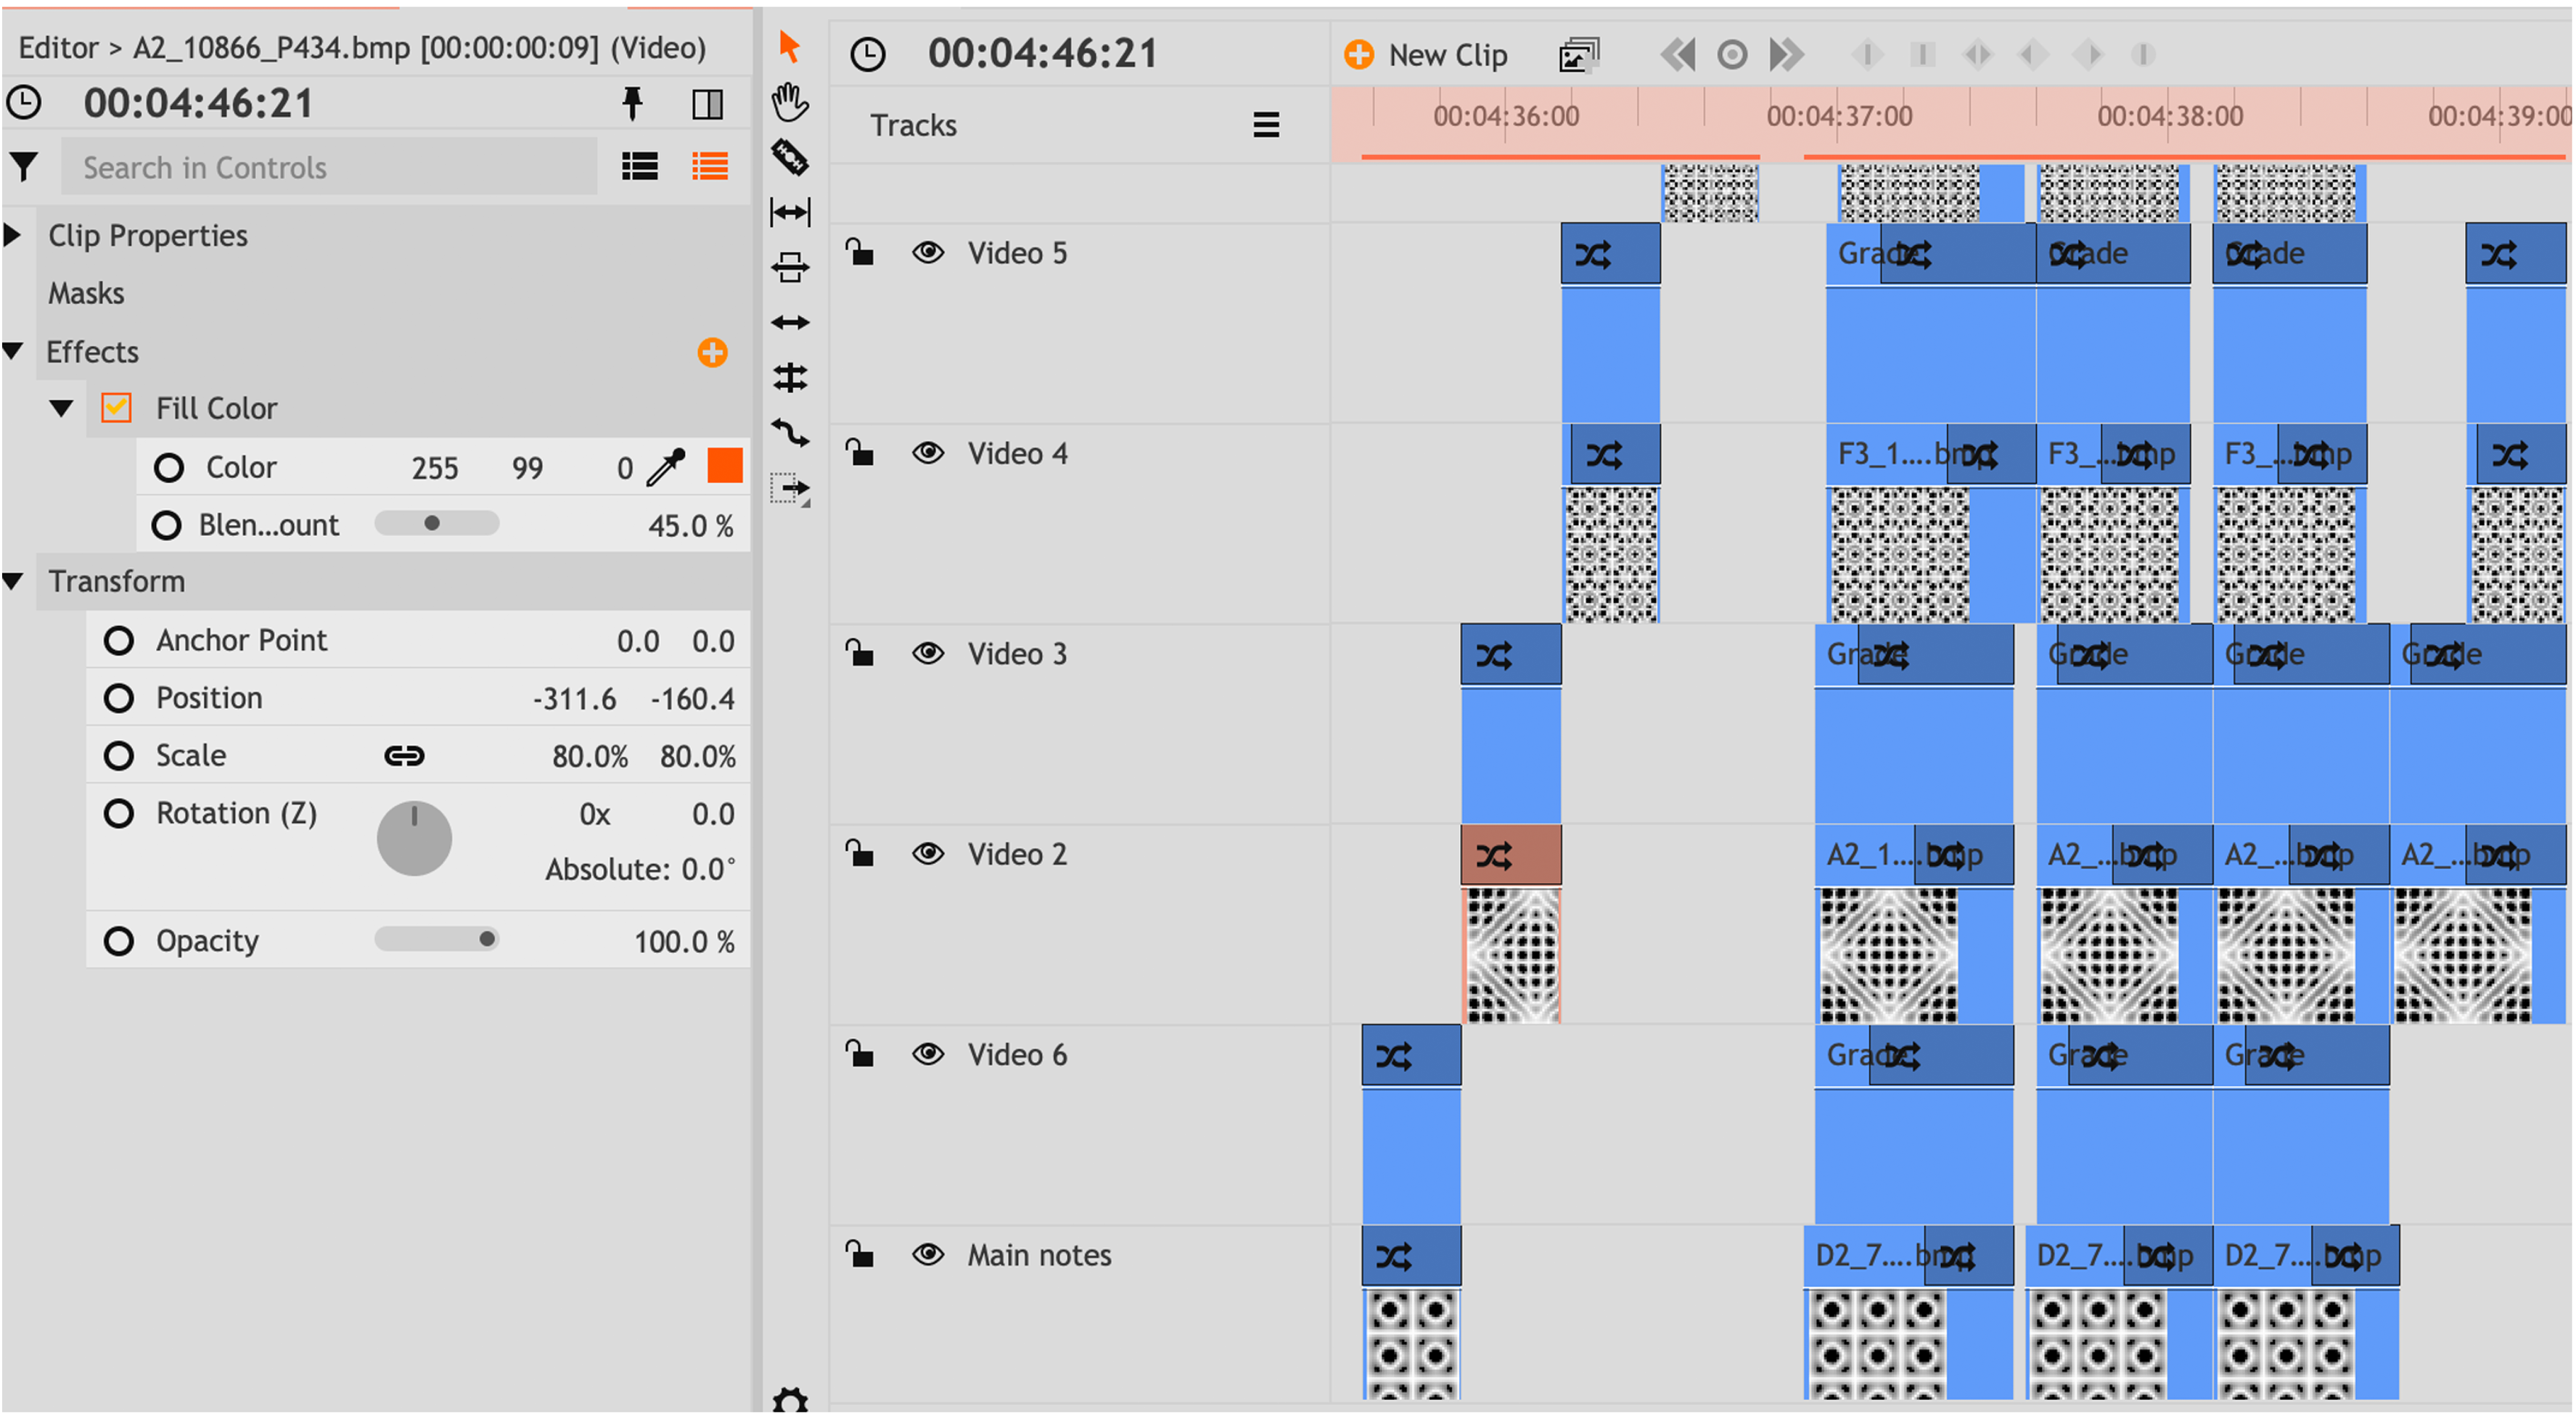
Image of the desktop of HitFilmExpress while editing the individual cymatic images of the notes in Resonance.
Factors of size, location, and motion of the image-notes was considered. The images could not simply be placed in equivalent spaces on the Y-axis in relation to their pitch, and put in a size that was strictly relational to their dynamic, as this rendered the visuals unapproachable. With listening there is a window of attentional time that acts as a ‘perceptual present’ (Butler, 1992) which is only a few seconds long, and the listener's perception of the piece is largely relational. The aural schema of the musical topography only has a certain amount in aural view at a time. The same principle transfers to visual perception and thus both the arrangement and the relative sizes of notes were not bound by a steadfast rule.
Movement 1: Evolution
Within the first movement, Evolution, Jarman composed a full range of typical bowed cello notes of various lengths, from very crisp staccato notes to notes held for up to in excess of 10 sec each. Other techniques included glissandi, tremolo, combinations of simultaneously bowed drones and pizzicato notes, three and four-note chords, and extreme dynamics. Aspects of the musical phrasing to do with implied motion in the line were projections of the cellist's personal interpretation. The placement and motion representing the musical lines also parallels the logic and techniques used as “devices for rhetorical development” in visual scores, where for example, vertical motion represents the rise or fall of a run and growth depicts augmentation (Applebaum, 2018, p. 284) Images demonstrating examples of how the various techniques were represented on screen are presented in Figures 4–7.

A drone represented on the left, and a pizzicato note, on the right. The decay of the pizzicato note is represented by the motion and fade of the image. The cymatic has been given a visible flare effect, which also fades from the onset, to indicate the different timbre of the pizzicato as opposed to the sustained tone of the other arco notes.

The change in location and size of notes to show the growth and duration of a two-note chord.

The faded note behind showed the lingering resonance heard from the cello after a staccato note was played on a different string in a fast passage.

The final chord from movement 1 depicts three loud, pizzicato notes. To show the force with which the notes were played, the resonance, and the decay of the notes they filled the screen to the point of overlapping; each had a glint to represent pizzicato; and the images both grew and drifted up the screen over the course of 1–2 s as the sound from striking the notes faded.
Movement 2: Introspection
The second movement of Resonance, Introspection was intended to demonstrate further change in both the music and the performer. The most dramatic change was that the composer indicated the notes should also have colour. Jarman used a formula by Melendez (Goss, 2022) to relate frequency and length of the sound wave to the colour of the proportionally associated light wave. Table 2 shows the RGB chart for the colour specifications for the chromatic notes of the scale and Figure 8 shows an extract from the musical score, printed with coloured notes.
The Red, Green, and Blue Colour Specifications for the Chromatic Notes of the Scale Used in Resonance.


Bars 68–71 from Resonance Mvt.2.
In the second movement each note-image was given its colour, with higher octaves being more brightly coloured to show some distinction between higher and lower versions of the same musical note.
The details of the colour, the planned note placement on the screen, and the visual effects of the glint for the pizzicato and the subsequent fade can be seen in the screenshot from within HitFilmExpress in Figure 9. The vertical alignment of the notes represents the physical action of the strummed motion across the four strings of the cello.
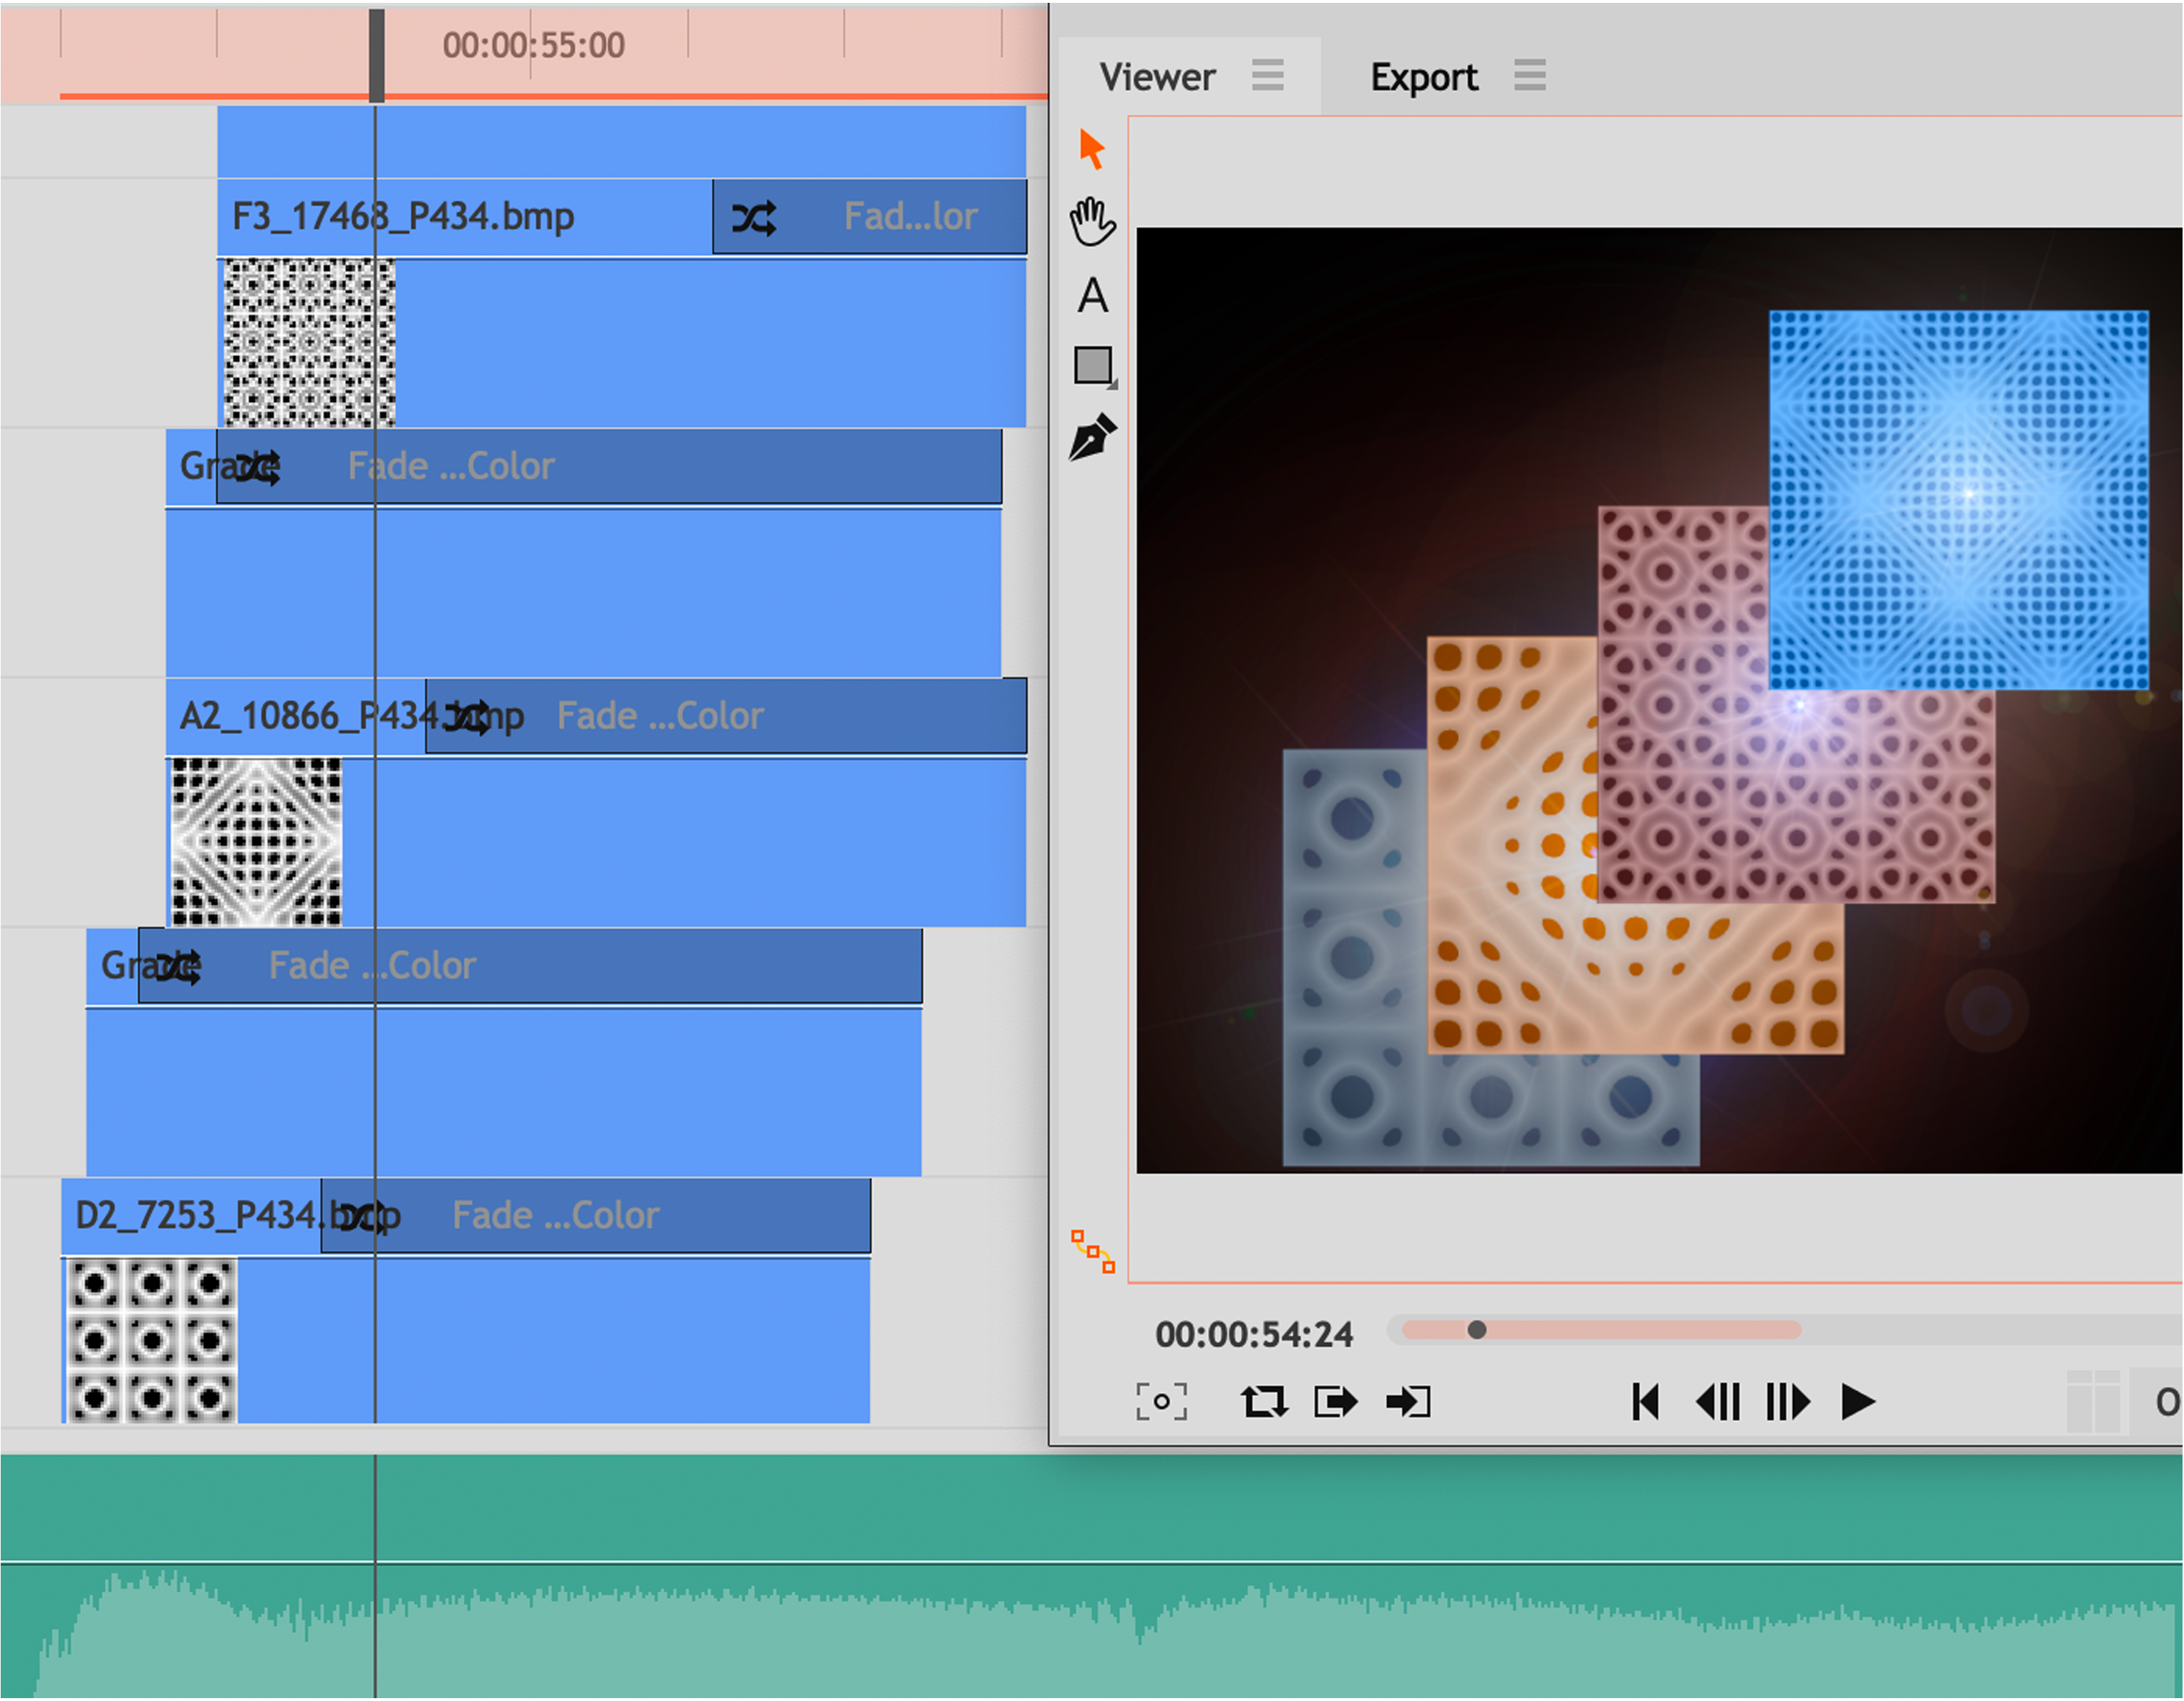
Screenshot showing the placement of the cymatic images within HitFilmExpress, aligned with the guide audio, and presented in the viewer, on the right hand side of the screen.
Discussion
Although music is acoustic, it is already received through a multisensory approach, and the science of cymatics can add another layer of experience by its demonstration of the unique physical structure of musical notes. Since the invention of recording devices, it has been possible to separate the sound component from the rest of the sensory input that normally accompanies musical performance, and private listening devices are both popular and widely socially accepted (Bull, 2006). Separating the modes of delivery to only reach the ears in headphones / earbuds acts as a limitation for the expressive capabilities of music, as “one can neither show facial expressions through radio nor timbre of voice through text” (Thompson et al., 2005, p. 206).
To experience the multimodality of musical experience and the difference added by cymatics, the reader can first examine the following four bar extract from Resonance and then view live-recorded performances of these passages without and then with cymatic images (see Figure 10).

Bars 140–142 from Evolution, movement 1 of Resonance, in score form, and then performed without cymatic images: https://youtu.be/PTIoI-A35GU?t=403 and with cymatic images: https://youtu.be/T7By8OXPoSU?t=86.
Resonance was premiered in the UK in May 2022, and in America in June 2022 (see Figure 11). The combination of the live physical action, the sound produced, and the cymatic images allowed the composition to be fully realised as the composer intended through live performance. First the cymatic images were generated, then aligned and animated as a video synced with an audio recording of the cello part from Resonance. The performer was given the video with enough time to prepare for a performance with the pre-made visuals. It was essential that the performer could be completely in time and not have to watch the screen and respond to the images. In the performances, the cellist sat in front of the screen and performed without music and without turning to look at the screen behind. To the audience, it appeared as if the visual images on screen were occurring live, in response to the cellist, which allowed the audience to experience the musical performance as a unified happening.

Image from American performance demonstrating the setting of the performer and the screen.
This project has been an experimental endeavour and the integration of the video of the scientifically produced cymatic images into the live performance has in created interest and opportunities to reach and share with new audiences. Audience members commented that the felt guided through the piece and were able to follow the ‘visual score’ in ways they could not follow purely aural instrumental music. Complex contemporary music was made accessible by being multisensory. Future performances include bringing Resonance to students at the Frank Barnes School for Deaf Children in London. This work was intended to be heard, seen, and felt, and what began with generating cymatic images has unfolded into a project that opened doors to new ways experiencing of performance.
This research is replicable and the methodology can be applied to other instruments, however a primary limitation of the techniques described here is the amount of time it takes to prepare the material. It took 100 hours to create the 12 min cymatic film to visualise Resonance, and preparing the live performance to the level where every detail of the performance was exactly with the visuals took nearly the same amount of time again. For future projects that consider other ways to generate cymatic images, they will have to surpass the current limitations of creating images with instruments, and for any live generation of images, the challenge of being able to isolate notes amidst a musical line.
To apply this to another instrument, a researcher would have to use the specific range of that instrument to determine the exact plate size to use for generating the most scientifically correct images for that instrument. The frequency of each musical pitch used in the composition would be identified, and aligned to the closest harmonic produced by the chosen plate size. Finding the plate that best fits the instrument requires significant manual calculations. Once images are produced, there is no existing protocol for how to compile them as an unfolding visual musical interpretation; this is currently an artistic decision of the researcher. Future research can continue to develop ways to improve the production and incorporation of cymatics in performance.
Footnotes
Action Editor
Riccardo Wanke, Universidade NOVA de Lisboa, Centro de Estudos de Sociologia e Estética Musical.
Peer Review
Two anonymous reviewers.
Ethical Approval
This research did not require ethics committee or IRB approval. This research did not involve the use of personal data, fieldwork, or experiments involving human or animal participants, or work with children, vulnerable individuals, or clinical populations.
Declaration of Conflicting Interests
The author(s) declared no potential conflicts of interest with respect to the research, authorship, and/or publication of this article.
Funding
The author(s) received no financial support for the research, authorship, and/or publication of this article.