
Abstract
There have been several studies investigating whether musical sound can be used as cell stimuli in recent years. We systematically searched publications to get an overview of studies that have used audible sound played through speaker-based systems to induce mechanical perturbation in cell cultures. A total of 12 studies were identified. We focused on the experimental setups, the sounds that were used as stimuli, and relevant biological outcomes. The studies are categorized into simple and complex sounds depending on the type of sound employed. Some of the promising effects reported were enhanced cell migration, proliferation, colony formation, and differentiation ability. However, there are significant differences in methodologies and cell type-specific outcomes, which made it difficult to find a systematic pattern in the results. We suggest that future experiments should consider using: (1) a more controlled acoustic environment, (2) standardized sound and noise measurement methods, and (3) a more comprehensive range of controlled sound parameters as cellular stimuli.
Introduction
Is there such a thing as music for cells? The use of musical sound to induce a beneficial physiological and psychological effect on biological beings is not a novel idea (Babikian et al., 2013). In light of this, the efforts to attain a deeper understanding of the relationship between sound and the human body have become more specific, now at a minuscule level in the field of mechanobiology in the last few decades. Mechanobiology has developed substantially with more than 33,000 publications up until 2016 (Sokabe, 2016; Wall et al., 2017). More recently, there has been an indication of escalating interests and efforts to understand mechanotransduction through mechanical cues induced by acoustical perturbation on cellular responses (Exbrayat & Brun, 2019). Various cell types have been investigated including: plant cells (Lim & Bae, 2014), micro-organisms (Algieri et al., 2018), auditory cells (Exbrayat & Brun, 2019), and other mammal cells in vitro (Kumeta et al., 2018) or in vivo (Wei et al., 2016). The effects of sound on plant cells have been reported and reviewed numerous times previously (Hamant & Haswell, 2017; Hendrawan et al., 2020; Jung et al., 2018; Mishra et al., 2016). Hence, the aim of this review is to get an overview of studies that have used audible sound played through speaker-based systems to induce mechanical perturbation in bacteria, yeast, and mammalian cell cultures. We start with a brief background to mechanobiology and the basic physical properties of sound. Subsequently, the selected studies are discussed concerning the experimental setups, sound used (categorized into “simple” and “complex” sounds), and experimental outcomes.
Background
The Mechanobiology of Cells
Cells in vivo are endlessly perturbed by different types of mechanical forces such as tension, compression, and shear stress (Mishra et al., 2017), and it has been suggested that cells are sensitive to physical forces (Kung, 2005). Mechanical signals, such as adhesiveness or extracellular matrix (ECM) stiffness, are also sensed by cells (Zhang et al., 2020). Different types of mechanical cues instigate specific responses in cells where certain genes can be activated through specific signaling pathways (Fedorchak et al., 2014). For instance, YAP and TAZ of the Hippo pathway, which has been identified as conserved mechanical transducers, change their locations to the nucleus in cells if the stiffness of the surface is rigid (Argentati et al., 2019). This nucleus localization is critical for driving stem cells’ fate (e.g., targeting the cell type that stem cells change to through differentiation process; Zhang et al., 2020). At the same time, its altered activity is involved in aberrant cell mechanics transduction and several diseases (Panciera et al., 2017). Cells have different means to sense the mechanical changes in their immediate surroundings, which include mechanosensitive ion channels, membrane mechanosensors, and mechanosensitive proteins inside the cells (Yang et al., 2015). Interestingly, it has been reported that cells cannot only sense mechanical stimulations but also generate mechanical signals themselves. For example, bacterial cells can generate sound waves between 8 and 43 kHz (Matsuhashi et al., 1998), and mechanical vibrations of yeast cells (Pelling, 2004) and stem cells have also been observed (Ventura et al., 2017).
Sound as a Mechanobiological Stimulus
Sound is essentially vibration. The word vibration originates from the Latin word vibrationem, which means shaking. When an object is disturbed by a mechanical stimulus and starts shaking and vibrating, sound energy is produced (Wood, 1946). This energy is propagated in the form of pressure waves from the sound source, usually as a longitudinal wave consisting of compressions and rarefactions of matter (Huber, 2010). Sound waves can travel through different mediums, including gas, liquid, and solids, with speeds dependent on the medium (Nandanwar et al., 2017). Typically, sound travels faster in a liquid or solid medium (e.g., water or a steel bar) than in a gas medium (Huber, 2010; Khilyuk et al., 2000).
A medium's density impacts energy transmission when sound is traveling from one medium to another (Wood, 1946). This physical property of sound is a factor that needs attention in cellular experiments, in which sound energy transmits from the air into a liquid-based solution such as cell culture media. For a progressive plane wave, the physical property of a medium can be expressed as the acoustic impedance, defined in equation 1.


The medium's thickness also impacts the transmitted energy. If the thickness of the second medium is much smaller than the wavelength of the incident sound, for instance, the amount of transmitted energy will be minimized (Wood, 1946).
Manipulable Sound Parameters
When exploring the use of sound for the experimental set up of cells, there are several properties to consider. Some of the basic parameters of sound include its frequency content (which contributes to the perception of pitch and timbre), amplitude (which corresponds to perceptual loudness), and exposure time. Additionally, there are different types of waveforms, from the most basic (sine tones) to synthetic waveforms (sawtooth, square, triangle), and more complex and natural waveforms (noise, speech, music) (Farnell, 2010).
When it comes to basic descriptions of sounds, the sound frequency (Hz) is represented as the number of cycles or vibrations per second. It can be defined as:

Review Method
We searched for articles using PubMed and Google Scholar. The keywords included in the search were: “sound,” “music,” “acoustic stimulation,” and “cell culture.” The combinations of words used for the search were: “sound stimulation on cell culture,” “music stimulation on cell culture,” and “acoustic stimulation on cell culture.” Publications were collected between July 1, 2019 and June 20, 2020.
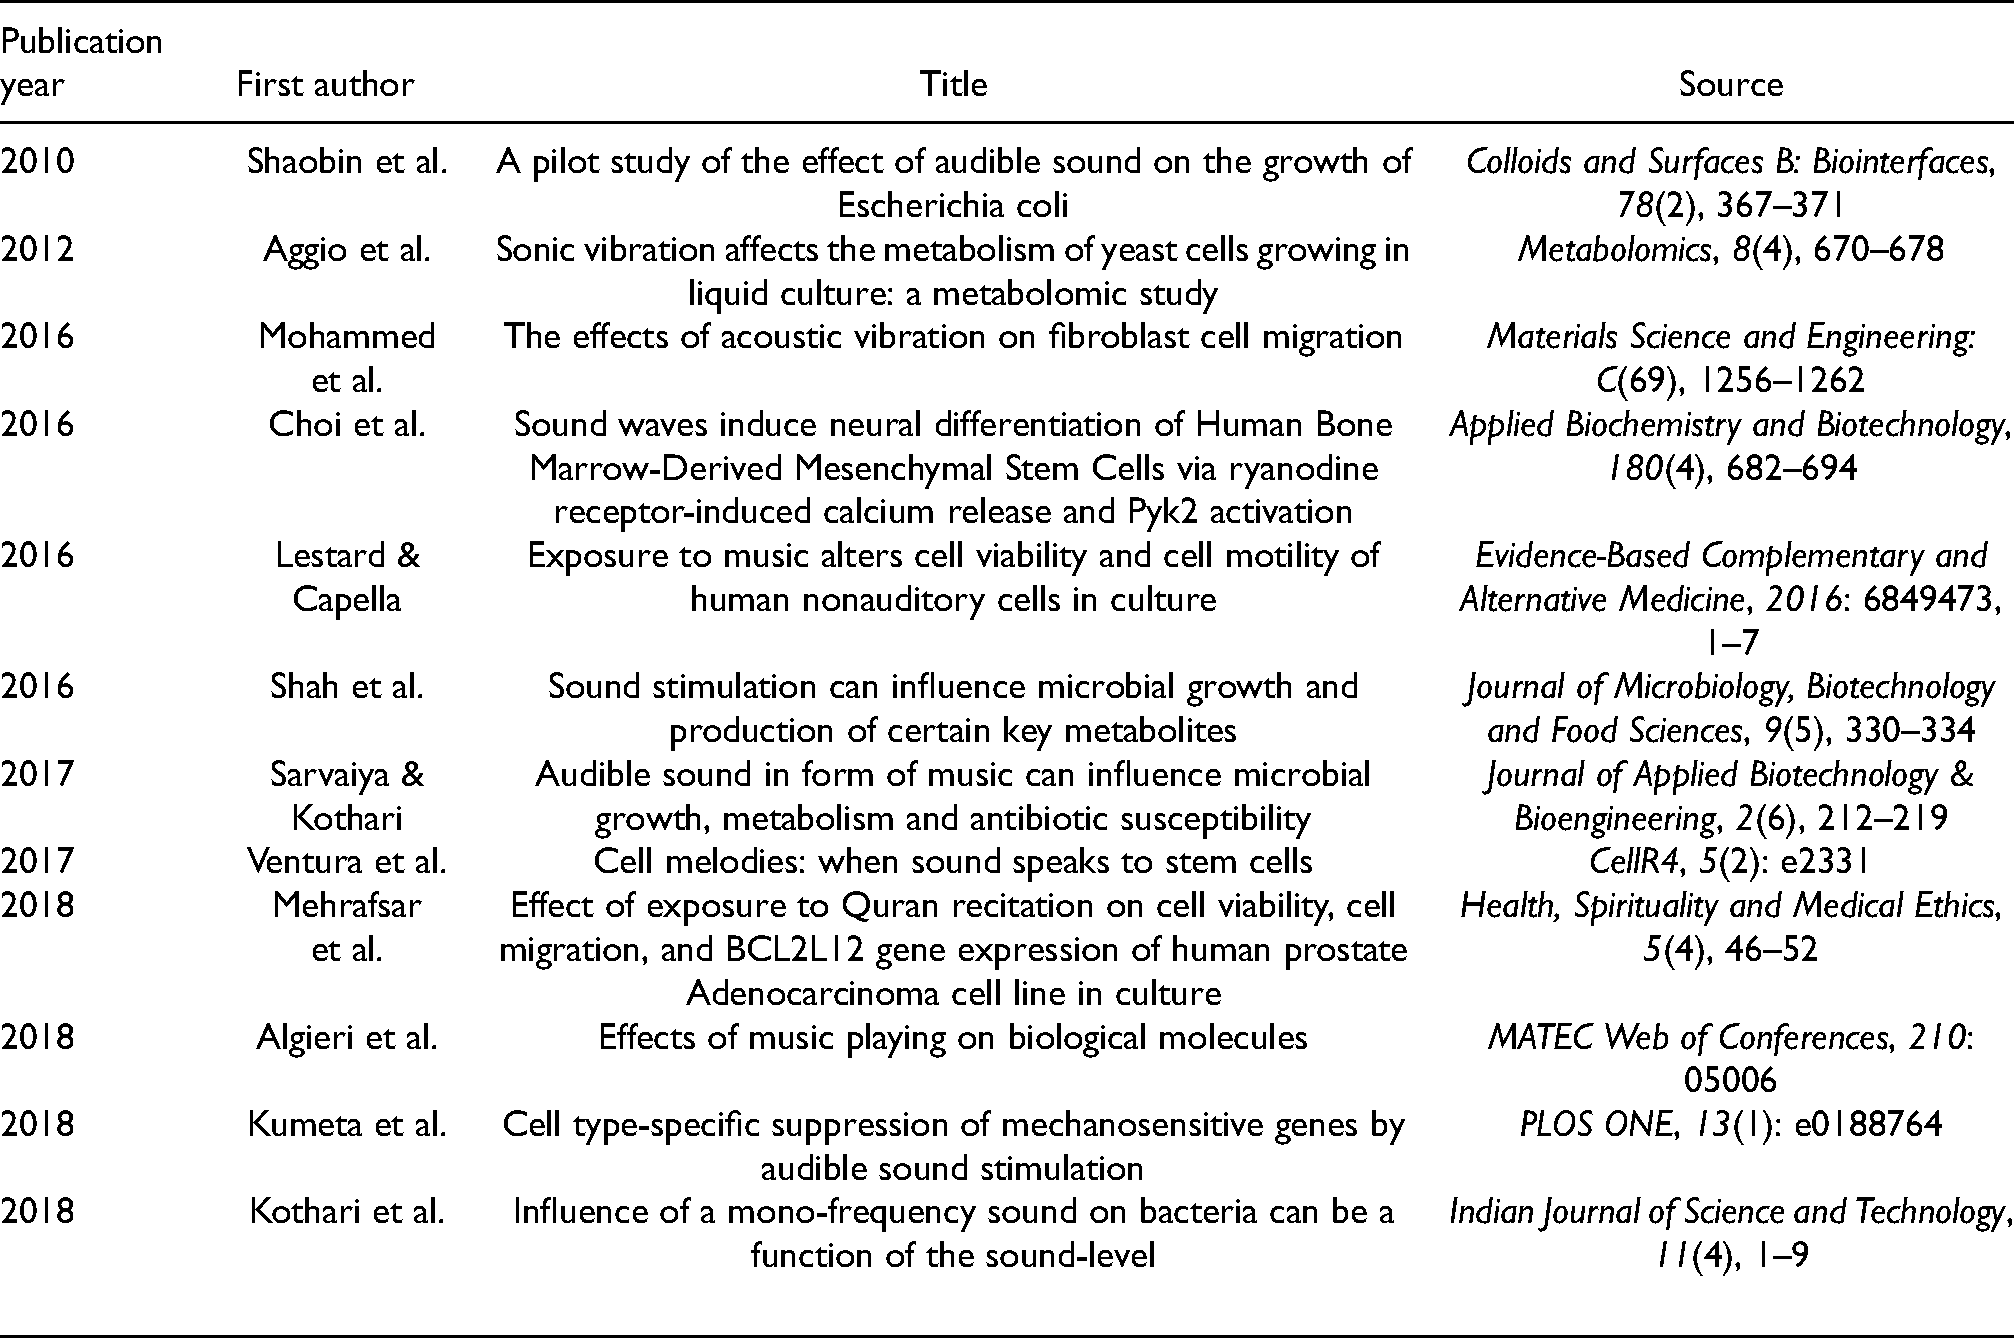
As illustrated in Figure 1, a total of 95 records were identified through database searching. Of these, seven records were removed as duplicates, 74 records were investigated but considered not relevant and hence removed. This included studies that were not related to cell studies in vitro, or not related to audible sound stimulation, or publications not in English. The full texts of two records were unobtainable and were not considered either. This left us with 12 studies that were included for further qualitative consideration (Table 1).

The PRISMA flow diagram for systematic review (search and filtering results).
List of Included Studies (in order of Publication Year).
Results
When looking broadly at the selected studies, the sound used in the literature can be divided into two main sound types:
simple sounds (e.g., sine tones): six studies complex sounds (e.g., music and speech): six studies
We will now look more closely at each study in terms of the experimental setup, sound parameters, and biological outcomes.
Simple Sound Stimulation on Cell Cultures
The studies identified within the category simple sound stimulus all used a sine tone with a constant sound pressure level in the experimental settings. An overview of the findings can be found in Table 2.
Simple Sound Stimulus Studies (in order of Publication Year).

The amplitude was measured by a laser vibrometer.
White noise was also tested but the effect was insignificant.
The sound was also played at 100 dB SPL, but did not show any effect
It caused less biomass production up to 14% (p<.05).
In Shaobin et al. (2010), a speaker was placed above the petri dish inside a box-shaped temperature-controlled (37 °C) environment. The box was acoustically treated with sound absorption around the walls. Sine tones with frequencies of 1,000, 5,000, and 10,000 Hz were played separately at 90 dB SPL for 1 h at a time and repeated six times with 3 h breaks in between. Escherichia coli were spread on an agar plate and were therefore not in a liquid-based media. The petri dish holder was made to rotate using a motor installed outside the chamber. It is not stated whether the control group was placed on the holder while the holder was rotating. Cell colony-forming efficiency was tested, and 1,000, 5,000, and 10,000 Hz sine tones showed upregulation of the cell colony forming by 141.6, 130, and 131.1%, respectively.
In Aggio et al. (2012), a pair of mid-high frequency speakers and a subwoofer was placed around shaker-flasks in a cell incubator. The distance between speakers and flasks was 20 cm. Sine tones of 100 and 10,000 Hz were played using computer software at 92 and 89 dBA, respectively, for 14 h to Saccharomyces cerevisiae yeast culture. The results showed an effect on the exponential growth rate where it was increased by 8.7% (p<.005) when 100 Hz sine tone was played to the cell culture and by 11.5% (p<.005) with 10 kHz sine tone. Subsequently, the cells exposed to sine tones showed reduction in the biomass production which decreased by 14% (p<.05).
In Choi et al. (2016), an 8-inch active speaker (NA-818APR, NBN) was placed underneath (10 cm away) the cell culture dish inside a cell incubator. A 1000 Hz sine tone was generated by a function generator (FG-7002C, EZ digital) at 81 dB SPL. The sine tone was played for 7 days to Human Bone Marrow Mesenchymal Stem Cells (hBM-MSCs). The sound treatment induced neural differentiation, and MAP2 and NF-L protein levels significantly increased by more than 150% without altering the cell viability compared to the control group. Phosphorylation levels of Pyk2, ERK, Akt, and CREB were also tested at 10, 45, 90, and 180 min post-stimulation. Pyk2 level spiked (>200%) at 45 min and decreased after 90 min. The ERK level was increased (>150%) from 45 min and stayed until 180 min (p<.05). The CREB level was increased (>200%) from 90 min but slightly decreased (∼150%) at 180 min (p<.05). The Akt level showed no difference. The Pyk2 level was rechecked at a different SPL (100 dB SPL), but did not show any effect, which suggests a possible SPL dependency.
In Mohammed et al. (2016), a thin mylar speaker (⌀ = 4.5 cm, 0.2 W) was placed directly underneath the cell culture dish (⌀ = 3.5 cm). A sine tone with different frequencies (100, 200, 400, 800, 1600 Hz) was generated using an Arduino microcontroller. This induced vibrations in the cell culture dish at a particular displacement amplitude (9, 5, 2, <1, <1
In Kothari et al. (2018), a speaker (Minix soundbar) was placed 15 cm away next to the cell tubes inside a glass box-shaped chamber (25 (l) × 25 (w) × 15 (h) cm). A 300 Hz sine tone was played from a computer software NCH Tone Generator at five different SPLs (70, 76.5, 83, 87.5, 89.5 dB SPL) for 48 h each time. The stimulated cells were bacteria of type Chromobacterium violaceum. The noise level was below 40 dB SPL in the control chamber. The result showed an SPL dependency. It is important to note that the SPL difference of less than 13 dB SPL showed no significant alterations in the growth of cells. The cell growth was upregulated the most by 15.02% (p<.001) at 70 dB SPL. Quorum Sensing regulated pigment production was affected the most which increased by 59.63% at 89.5 dB SPL (p<.01).
In Kumeta et al. (2018), a 4-inch active speaker (Fostex 6301NB) was placed above (25 cm away) the cell culture dish inside a cell incubator. A 440 Hz sine tone (triangle, square tones, and white noise were tested too) was generated at different SPLs (76, 82, 88, 94 dB SPL) using NCH Tone Generator on a computer. Each tone was played for 2 h. The background noise inside the incubator was measured to be around 65 dB SPL. The results showed a dependency on the type of waveform used on mice cells (ST2). The sine tones downregulated the gene (Ptgs2, CTGF, TNC) expression level between 60% and 80% (p<.01). The triangle tones downregulated only one of the genes (TNC), and the square tones and white noise did not show any significant effect compared to the sine tones. Different frequencies (55, 110, 4000 Hz) were also tested for the sine tone condition, but the effect was similar to that of 440 Hz. The sound level of 94 dB SPL showed a significant impact, while tones with other SPL showed little effect. Another important finding in this study was the temperature change in the cell culture media liquid. When sound was played at 94 dB SPL, it caused the temperature in the media to increase by 0.4 °C. A noteworthy assumption was that the sound energy would be reflected at the lid of the petri dish by more than 10 dB SPL. The transmitted sound pressure into the liquid-based media eventually was calculated to be approximately 10.4 mPa.
Complex Sound Stimulation on Cell Cultures
Here we will look at studies that have used different types of complex sound. This includes the use of music (different styles and genres) or speech (human voice) to stimulate the cell cultures in various experimental settings. An overview of the findings can be found in Table 3.
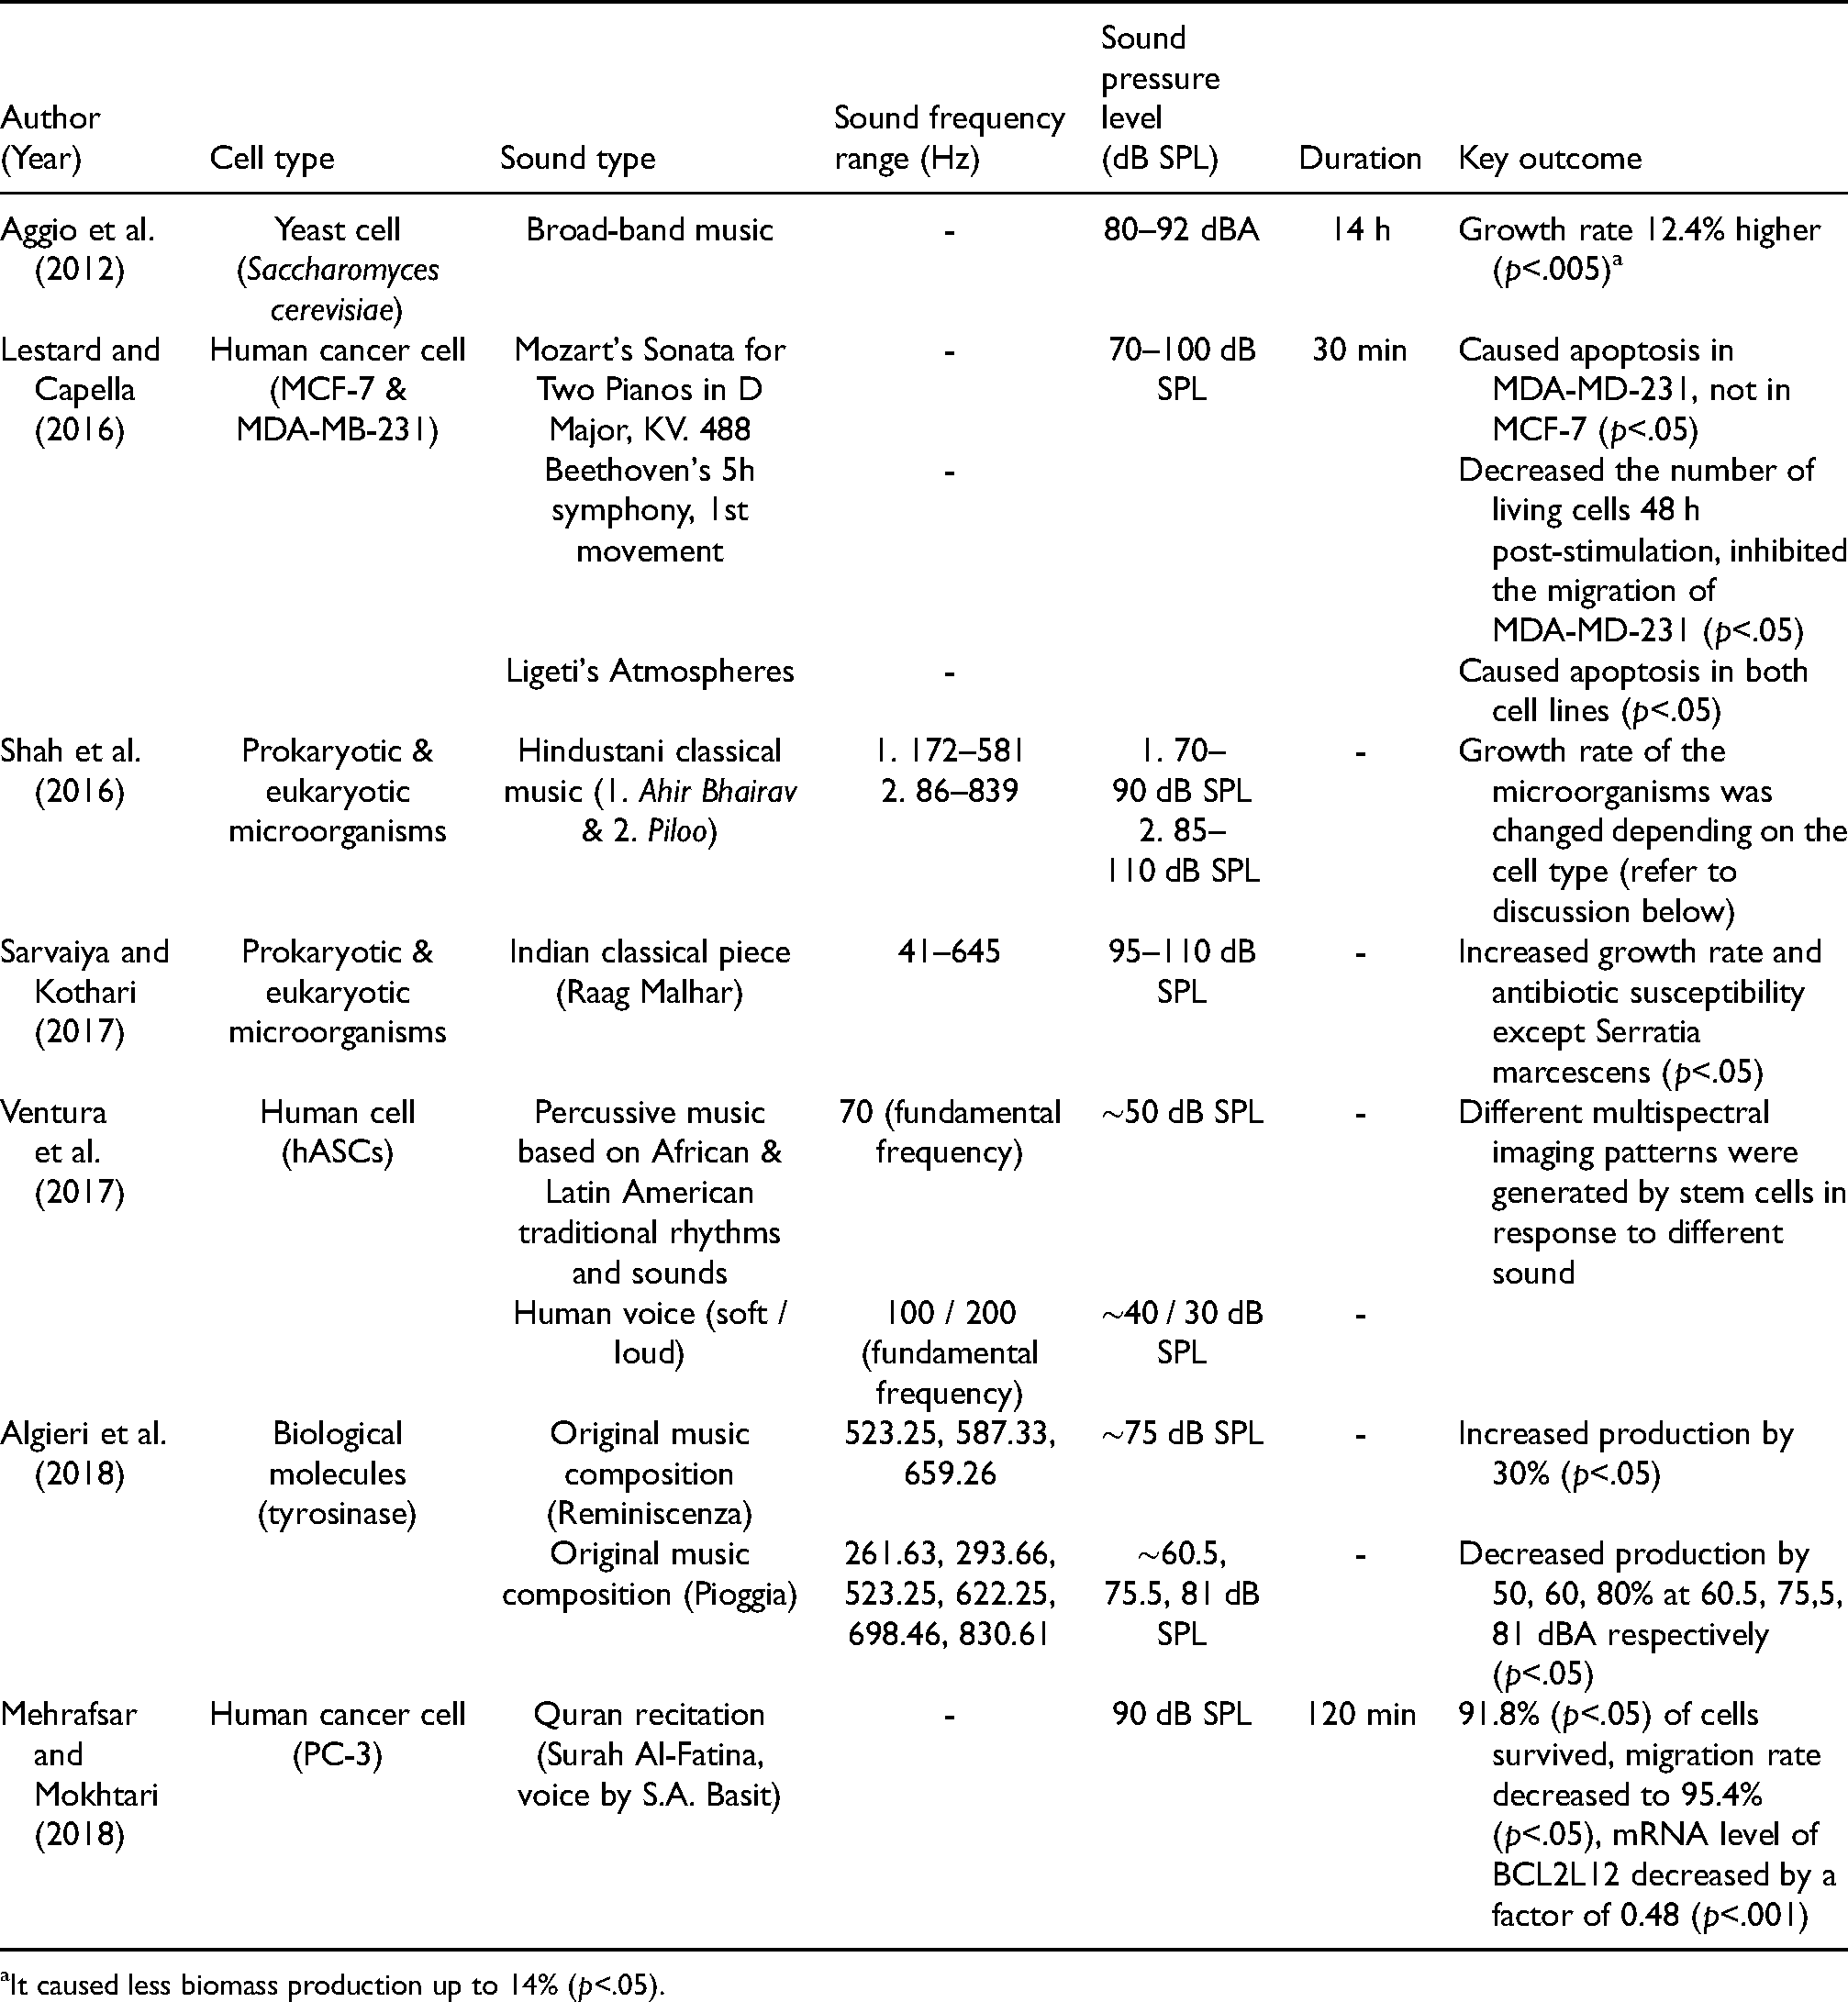
Complex Sound Stimuli Studies (in order of Publication Year).
It caused less biomass production up to 14% (p<.05).
In Aggio et al. (2012), the setup is described in the previous section. The description of the music is limited; they describe it as “broad-band music” sampled at a bit rate of 320 kbps. The growth rate showed an increase by 12.4% (p<.005) when the music was played to the cell culture, which caused a decrease in biomass production by 14% (p<.05). This observation was similar when the sine tone was played to the cell culture in the same study.
In Lestard and Capella (2016), a 60 W coaxial speaker was installed at the top of the acoustically treated (with cork and foam) incubator. The first movement from Mozart's Sonata for Two Pianos in D Major, KV. 488, the first movement from Beethoven's 5th symphony, and Ligeti's Atmospheres were played to the cells. These excerpts were played at around 70–100 dB SPL for 30 min each to human breast cancer cells (MCF-7 and MDA-MB-231). Mozart's piece did not alter the viability of MCF-7 but caused cell death (apoptosis) in MDA-MD-231 (p<.05). The Beethoven and Ligeti pieces decreased the number of living cells 48 h post-stimulation and inhibited the migration of MDA-MD-231 (p<.05). The Ligeti piece caused significant cell apoptosis in MCF-7 (p<.05).
In Shah et al. (2016), a speaker was placed next to (15 cm away) the cell tubes inside a glass chamber (22.5 (l) × 22.5 (w) × 12.5 (h) cm). The SPL was measured with an SPL meter (ACD Machine Control Company) that was positioned 15 cm away from the speaker. Two pieces of music (Ahir Bhairav and Piloo) were played at 70–90 dB SPL and 85–110 dB SPL, respectively, to six different microorganisms (prokaryotic and eukaryotic). The recordings were from a CD album named Call of the Valley (Saregama Indian Ltd.). The fundamental frequency ranges of the two pieces were 172–581 Hz (Ahir Bhairav) and 86–839 Hz (Piloo). After playing Ahir Bhairav, the growth rate of Serratia marcescens (−4.32%, p<.01), Chromobacterium violaceum (4%, p<.05), Xanthomonas campestris (6.66%, p<.05), Saccharomyces cerevisiae (8.94%, p<.01), Lactobacillus plantarum (6.14%, p<.01), and Bacillus parabrevis (18.75%, p<.01) were changed compared to the control. After playing Piloo, the growth rate of Serratia marcescens (−7.46%, p<.01), Chromobacterium violaceum (−24.19%, p<.01), Xanthomonas campestris (9.32%, p<.05), Saccharomyces cerevisiae (4.68%, p<.01), Lactobacillus plantarum (3.41%, p<.01), and Bacillus parabrevis (18%, p<.05) were changed compared to the control.
In Sarvaiya and Kothari (2017), the experimental setup was the same as in Shah et al. (2016). A piece of music (Raag Malhar) was played at around 95–110 dB SPL to various microorganisms (prokaryotic & eukaryotic). The fundamental frequency range of the music was between 41 and 645 Hz. All tested cells showed an increase in growth rate, and in antibiotic susceptibility, except Serratia marcescens (p<.05). Another key finding was the enhanced alcohol tolerance of Saccharomyces cerevisiae was significantly enhanced by 33.69% (p<.001) after 24 h of incubation when the concentration of ethanol was 5%v/v, 132.94% (p<.001) after 24 h of incubation when the concentration of ethanol was 10%v/v, 27.92% (p<.01) after 48 h of incubation when the concentration of ethanol was 12.5%v/v, and 1200% (p<.001) after 120 h of incubation when the concentration of ethanol was 15%v/v.
In Ventura et al. (2017), the cell culture was placed 2 m in front of a live performance. Percussive music based on traditional rhythms and sounds from Africa and Latin America and an actor's voice were played for 45 and 30 min, respectively, to Human Adipose Stem Cells (hASCs). The tempo of the percussive music was taken from the performer's own heartbeat, and the actor's voice was performed with two different intensities (soft and loud). The most dominant frequency for the percussive music was around 70 Hz at ∼50 dB SPL, and for the actor's voice was around 100 Hz at ∼ 30 dB SPL (soft voice) and 200 Hz at ∼30 dB SPL (loud voice). The sound analysis was done through Praat, a software package developed for speech analysis. The cell culture was observed in real time under the Multi-Spectral Imaging (MSI) system (Nikon Eclipse TS 100). The MSI analysis showed spectral changes of cell imaging with specific vibrational signatures in relation to the performances.
In Algieri et al. (2018), a set of 3 W internal speakers (LENOVO E93z) was placed underneath (10 cm away) the reactor vessel on a magnetic plate. The SPL measurement was done with a FUSION −1 dB meter and analyzed using dB Trait. Two distinctively composed pieces of music, Reminiscenza (constant rhythm and melody) and Pioggia (irregular rhythm with more variable devices such as irregular tempo changes, and melody) were played to biological molecules (tyrosinase). These were placed in a reactor vessel with a stirring mechanism and a constant temperature of 30 °C. In Reminiscenza, only C5 (523.25 Hz), D5 (587.33 Hz), and E5 (659.26 Hz) musical notes were used and played at ∼75 dBA. In Pioggia, C4 (261.63 Hz), D4 (293.66 Hz), C5 (523.25 Hz), D#5/Eb5 (622.25 Hz), F5 (698.46 Hz), and G#5/Ab5 (830.61 Hz) were used, and played at different SPL (60.5, 75.5, and 81 dBA). As one of the key findings, the 1-DOPA production rate was reported. Playing Reminiscenza resulted in a significant increase in the 1-DOPA production, by 30% more compared to the control group. Playing Pioggia resulted in decreased the 1-DOPA production by 50% at 60.5 dBA, 60% at 75.5 dBA, and 80% at 81 dBA (p<.05).
In Mehrafsar and Mokhtari (2018), four speakers were placed around the cell culture plate. A voice recording (Surah Al-Fatina, voice by Sheikh Abdul Basit) was played at 90 dB SPL for 2 h to the human cancer cell line (PC-3; Human Prostate Adenocarcinoma Cells). The cell viability, migration, and BCL2L12 gene expression level were reported. After the recorded audio was played to the cells, it was reported that 91.8% (p<.05) of PC-3 cells survived, the migration level decreased to 95.4% (p<.05), and mRNA level of BCL2L12 decreased by a factor of 0.48 (p<.001).
Possible Cell Sensing Mechanisms of Sound
Many of the reviewed studies have proposed possible ways that cells sense mechanical cues due to sound stimulation. Some of the speculations reported are compared in Table 4.
The List of Proposed Cellular Sensing Mechanisms or Type of Forces Induced by Sound Waves.

In the subsequent sections, we will discuss some of the central issues from the selected studies.
Discussion
Many different types of sound (simple and complex), with an extensive range of audio frequency and SPL have been tested. The results reported for both simple and complex sound studies are promisingly beneficial. Some of the important observations include enhanced cell migration, proliferation, colony formation, and upregulation of certain genes and proteins or decrease in cancer cell migration and inducing apoptosis of cancer cells. However, it is both challenging to find a systematic pattern across studies and to compare the results to test for publication bias because the studies used different statistical analysis and effect sizes, sounds, experimental setups, sound measurement methods, and observation strategies. Below, we synthesize and discuss the results while considering the practical aspects of the studies (e.g., experimental setups and measurement methods) and the physics of sound.
Experimental Setup
Many of the reviewed studies were based on a speaker position above (Figure 2; scenarios 1 and 2, position a.), underneath (Figure 2; scenarios 1 and 2, position b.) or outside an incubator or specially constructed chamber for the cell cultures (Figure 2; scenario 1, position a.). The distances between the speaker and petri dish varied, ranging from ∼0 (directly underneath the dish) to 200 cm. These speaker placements claimed to have resulted in cellular responses regardless of whether the speaker was placed outside or inside a specially constructed chamber or cell incubator. Whether the observed biological alterations are a direct effect of sound pressure waves is doubtful in some cases such as speaker position c in scenario 1 in Figure 2. As discussed earlier, there are several physical factors that contribute to the transmission loss of sound energy. This was discussed by one of the studies where the polystyrene cover of petri dishes and significant impedance mismatch between water and air were taken into consideration to estimate the transmission loss (Kumeta et al., 2018). Theoretically, the amount of acoustic energy that reaches the cells would be insignificant compared to the incident energy as elaborated above.

Different positions (scenarios) of the speaker used in the experiments.
It would be of value to perform a systematic experiment of how different positioning of the sound source (the speaker) results in various types of mechanical force in the cell culture media. For example, whether a speaker is coupled (in direct contact) with the petri dish. Several of the reviewed studies have not clearly stated how the experimental environment was acoustically treated. Based on its physical properties, sonic vibrations may interact with the testing environment. Ideally, sound experiments should be performed in an acoustically controlled environment. For example, an anechoic chamber is designed to imitate the free field conditions (i.e., no reflected sound waves), and to allow no or minimum external sound to enter the chamber. Using such an environment can greatly improve the accuracy of acoustic measurements (González et al., 2018). Additionally, for practical reasons, speakers should ideally be placed inside or facing directly into an acoustically treated chamber. Another reason would be to prevent hearing damage of the researchers. For example, a continuous sine tone at a loudness level of 70 dB SPL or higher can cause temporary or even permanent hearing damage (Huber, 2010). Although, a full anechoic chamber would not be feasible considering the cost and size, it would still be useful to try to reduce the acoustic impact of the environmental “noise” by using an acoustic damping device. In that way, it becomes more possible to measure and characterize how the sound behaves in an environment. This could also be used to address potential obstacles during experiments (e.g., amplitude distortion at specific frequencies, standing waves, and phase cancelation) and increase the chance to infer how different acoustic conditions are related to observed cellular responses.
Sound Features
We will look at four basic sound features here: frequency (Hz), sound pressure level (dB SPL), waveform (simple & complex), and rhythm. The overview of the studies is illustrated in Figure 3.

A simplified schematic diagram of the outcome of the studies. A wide range of sound frequency was tested (approximately between 20 and 10,000 Hz) with the sound level being around 90 dB SPL. The studies are divided into bacteria/yeast and mammal cells studies. The studies are further categorized into biological outcome as positive (upregulation) and negative (downregulation), and types of sound as simple (sine tone) and complex (music and speech). Since each experiment had a specific cell line and a setup, it was not possible to draw a full conclusion. However, the diagram provides an overview and some recognizable patterns in the result. Concerning these specific sets of outcomes, mammal cells showed more frequency dependency than bacteria cells. A group of studies of bacteria/yeast cells reported a general increase of colony-forming and growth rate over a wide range of frequencies, whereas, in mammal cell studies, the effects of the sound depended more on which frequency was used.
Frequencies
In the studies where single-frequency sound was used, a single frequency selected in the range of 55–10000 Hz were explored on bacteria cells (Escherichia coli, Chromobacterium violaceum, Serratia marcescens), mouse cells (ST2), and human cells (hBM-MSCs, LL24). In the studies where the more complex sounds were used, musical pieces or human voices over a wide frequency range were explored on a biological molecule (tyrosinase), microorganisms (various prokaryotic & eukaryotic), bacteria cells (Escherichia coli), human cancer cells (MCF-7, MDA-MD-231), and human cells (hASCs).
To summarize, bacteria and yeast cells showed an effect of sound across a wide range of frequencies: cell colony-forming and growth rate increase using 100, 300, 1,000, 5,000, and 10,000 Hz (Aggio et al., 2012; Choi et al., 2016; Lestard & Capella, 2016). On the other hand, mammal cells showed a more selective and frequency-dependent effect. For example, a lower frequency (100 Hz) induced cell migration increase in human cells, but higher frequencies (above 1600 Hz) induced the opposite effect on cell migration (Mohammed et al., 2016). Also, a sine tone of 440 Hz induced gene (Ptgs2, CTGF, TNC) expression increase in mouse cells (ST2), while 55, 110, and 4,000 Hz showed a less or similar effect (Kumeta et al., 2018).
In the complex sound studies, the styles of music and human voice employed varied widely (Table 5). The most present frequencies of the music and voices tested stayed between 40 and 840 Hz. However, it is most likely that other frequency content, especially overtones, varied between different types of music or speech style due to distinctive timbre differences between instruments and human voices. Since complex sounds typically consist of many frequencies, it is difficult to know if a particular frequency had an impact on the cellular responses. Regardless, a notable outcome was where two musical compositions of contrasting characteristics in terms of melody and rhythm (regular/constant vs irregular/spontaneous) showed contrasting results in 1-DOPA production rate in tyrosinase. A musical composition with regular characteristics, Reminiscenza, resulted in 1-DOPA production increase. This piece of music is described, by Algieri et al. (2018), as having stability in terms of harmony and rhythm. The entire piece is based on a thetic rhythm and centered around 523.25 Hz (musical note: C5), 587.33 Hz (D5), and 659.26 Hz (E5). Another piece of music that had a contrasting characteristic, Pioggia, resulted in 1-DOPA production decrease. Unlike the first piece, Pioggia is described as more unstable and based on agogic accents and rubato, and frequencies varied more using 261.63 Hz (C4), 293.66 Hz (D4), 523.25 Hz (C5), 622.25 Hz (D#5/Eb5), 698.46 Hz (F5), and 830.61 Hz (G#5/Ab5) (Algieri et al., 2018). This indicates a possible role of the degree of pitch (frequency) and rhythm in the produced outcome.
The List of Music and Voice Styles From the Selected Studies.

Sound Pressure Level
In the investigated studies, although the sound pressure level range used varied extensively, from 40 to 110 dB SPL, the majority of the studies used the range between 75 and 95 dB SPL. The range centered around 90 dB SPL, which is about 632 mPa. This pressure level is small compared to the periodic blood flow pressure, for example, which can typically be around 120/80 mmHg (approximately 10–16 kPa) (Zhou et al., 2017). The transmitted sound energy in the cell media (liquid) from the air is estimated to be even smaller: approximately 29.67 mPa (when the temperature is 20 °C, R≈0.9988, transmitted sound energy from the air to water is 1 − R≈0.0022 when there is no absorption) (Kumeta et al., 2018). This is a insignificant mechanical stress, but the cells have mechanisms that can sense such small forces and changes involving cytoplasmic molecules α-catenin, for example (Maki et al., 2016).
It should be noted that some of the SPLs specified in the literature are incomparable. This is because some of the reports were unclear about how the actual sound output was measured. Additionally, some of the commercially available SPL measurement devices typically come with filters that imitate the human hearing characteristics (less sensitive at very low and high frequencies within the audible frequency range), such as an A-weighting filter. There are other weightings, as illustrated in Figure 4 (Skovenborg & Nielsen, 2004), designed for different applications. This is a small piece of information that may not be considered necessary, but it should be stated in the report, as a specific weighting filter readout can undermine a particular frequency range as shown.

Frequency response of the A, B, C, D, M, and RLB frequency weighting filters. All the curves are aligned in level so that their magnitude response at 1 kHz is 0 dB. The figure is reproduced with permission (Skovenborg & Nielsen, 2004).
Waveform
As pointed out earlier, the majority of the simple sound studies employed sine tones. There was only one study that compared different waveforms (triangle and square) and white noise. Interestingly, the different waveforms yielded contrasting outcomes in cellular responses (Kumeta et al., 2018). However, the underlying mechanism is not well understood. Sine waves do not have any harmonics (overtones), only the fundamental frequency. Triangle and square waves, on the other hand, contain odd harmonics of the fundamental frequency. The higher harmonics of the triangle wave get weaker faster than those of a square wave, as shown in Figure 5. When the amplitude and the frequency are the same, there is more sound energy in square waves and stronger harmonics than in sine and triangle waveforms. Although there is a need for further investigation, according to the differences we explore, a possible explanation of different outcomes between sine, triangle, square, and white noise could be the strength of harmonics present in the sound material.

Comparisons between 440 Hz sine, triangle, and square waveforms (top) and Fourier Transforms (below).
Rhythms
Rhythm is one of the fundamental properties of music and is also an essential feature of biological life. The “synchronization of multiple rhythms” is vital in living organisms (Muehsam & Ventura, 2014), and rhythmicity as a parameter is underexplored. The human body is full of different rhythms, such as heart rate and breathing rhythms. If certain rhythms in the human body become irregular, it can be an indication of more severe health problems, for example, abnormal respiration rhythms (Whited & Graham, 2020).
In the investigated simple sound studies, there were no rhythmic features in the sound. On the other hand, all the complex sound studies had an aspect of rhythm. The styles of rhythms varied between Western classical music, Hindustani classical music, and African and Latin-American traditional music. For illustration, Mozart's Sonata for Two Pianos in D Major, KV. 488 shows more regular and steady rhythmic patterns than Ligeti's Atmospheres (Figure 6a and b). There was only one study in which the aspect of rhythm was deliberately tested and reported, and where regular/constant and irregular/inconstant rhythms were compared in terms of cellular responses (Algieri et al., 2018). As discussed previously, the results showed that the musical piece with regular rhythm produced an increase in the production of 1-DOPA compared to the control group, whereas the piece with irregular rhythms resulted in a decrease, although other factors in the pieces of music could have contributed to the difference.

Spectrograms of (a) the first movement of Mozart's Sonata for Two Pianos in D Major, KV. 488 and (b) Ligeti's Atmospheres.
Other possible premises can be reflected upon when it comes to the rhythmic stimulation of in vitro cells. For instance, the regulation of intake of Ca2+ is a crucial factor for insulin secretion β-cells (Yang & Berggren, 2006), which is regulated by Ca2+ channels located in the cell membrane (Larsson-Nyrén et al., 2007). The Ca2+ intake of β-cells is known to be rhythmic (Idevall-Hagren & Tengholm, 2020), and the mechanical force can regulate the Ca2+ intake (Matthews et al., 2010; Yang et al., 2015). Therefore, it would be interesting to explore the question of whether a rhythmic mechanical stimulation can “rescue” irregular or un-synchroneity Ca2+ oscillation (Li et al., 2014; Yang et al., 2015) in unhealthy β-cells. Taken together, rhythmicity is a possible new avenue of sound stimulation of cells to be investigated further.
Cell Sensing Mechanisms of Sound
There have been some reports on cellular changes after a certain period of exposure to sound waves. Although several possible mechanisms have been suggested (Table 4), the studies in the current review unanimously acknowledged the lack of understanding of the mechanism by which cells are affected by sound waves. One of the aspects that needs more attention is a possible shear force generated by the flow of the fluid (cell culture media) within the petri dish when sound is played to the cell culture. Shah et al. (2016) and Sarvaiya et al. (2017) partly referred to a possible effect of shear force by suggesting that sound induces vibration within the cell culture media. Nevertheless, it is not clear whether fluid flow has any effect on the reported outcomes. Such mechanical oscillations could potentially have an impact on the cellular responses in addition to the sound waves (Kanie et al., 2019).
Conclusion
There appears to be promising effects of using audible sound on microorganisms and mammalian cells. However, the correlations are complex, and the exact cause of cell responses to audible sound stimulation is still largely underexplored. We have also found that there are considerable differences in experiment setups and their acoustic environment. This makes it difficult to understand how the stimulation happened. In future research, therefore, we see the need for:
Many other possible non-sound related factors can alter the functionality of cells under examination (Goetzke et al., 2018). Therefore, as to recommendations for future research in this multidimensional and uprising field, it is crucial to have the sound waves well under control and elucidate the practical issues. High priority should be given to investigating the optimal acoustic environment for cell stimulation that takes cell viability (e.g., temperature) into consideration. The focus should also be put on standardizing methods to measure and analyze the characteristics of the experimental sound output and the background noise. Finally, we suggest replication studies of the findings from the literature under the above-mentioned controlled conditions.
Footnotes
Action Editor
Trevor Agus, Queen’s University Belfast, SARC, School of Arts, English and Languages.
Peer Review
Silas Villas-Boas, University of Auckland, School of Biological Sciences.
Ratnesh Mishra, UGent, Laboratory of Functional Plant Biology.
Declaration of Conflicting Interests
The authors declared no potential conflicts of interest with respect to the research, authorship, and/or publication of this article.
Funding
The authors disclosed receipt of the following financial support for the research, authorship, and/or publication of this article: This work was supported by UiO:Life Science through ABINO project and the Research Council of Norway through its Centres of Excellence funding scheme, project numbers 262613 (HTH) and 262762 (RITMO). The funders had no role in study design, data collection and analysis, decision to publish or preparation of the manuscript.