
Abstract
The main goal of this study was to test the hypothesis that disorders in entrainment to the beat of music originate from motor deficits. To this aim, we adapted the Beat Alignment Test and tested a large pool of control subjects, as well as nine individuals who had previously showed deficits in synchronization to the beat of music. The tasks consisted of tapping (Experiment 1) and bouncing (Experiment 2) in synchrony with the beat of non-classical music that varied in genre, tempo, and groove, and then judging whether a superimposed metronome was perceived as on or off the beat of the same selection of music. Results indicate concomitant deficits in both beat synchronization and the detection of misalignment with the beat, supporting the hypothesis that the motor system is implicated in beat perception.
Introduction
Across cultures, human beings spontaneously move to music (e.g., Janata et al., 2012). This movement is coordinated with the beat, which corresponds to perceived musical regularities at a milliseconds timescale. Despite its apparent simplicity, synchronizing movements to a musical beat is a complex behavior. It has been argued that it is unique to human beings and only a few animal species (Merchant & Honing, 2014; Patel, 2014), though this idea has been challenged (e.g., Large & Grey, 2015; Rouse et al., 2016; Wilson & Cook, 2016). It is indeed a complex process because in many musical contexts one needs to predict the beat in the auditory signal, as there is no one-to-one correspondence between beats and sounded events. This is particularly the case for syncopated rhythms in which accents, which are moments of high acoustic salience, occur at non-beat locations. Furthermore, moving in time to a musical beat is an anticipatory behavior that relies on predictive timing mechanisms (van der Steen & Keller, 2013). Finger taps, for example, tend to occur slightly in advance of the beat (e.g., Patel et al., 2005; Sowiński & Dalla Bella, 2013). This anticipatory tendency is stronger for purely isochronous sequences and is known as mean negative asynchrony (for a review, see Repp, 2005). Thus, the ability to predict the beat of music is likely to recruit sophisticated neural networks consisting of intertwined motor, attentional, and perceptual mechanisms. Here, we focus on the motor system.
Accumulating evidence suggests that the ability to predict a periodic pulse in music cannot be understood in isolation from movement. These actions, more than being a mere reaction, may play an active role in predicting the beat (Manning et al., 2020; Patel & Iversen, 2014; Ross et al., 2016; Su & Pöppel, 2012), especially for beat rates that typically occur in musical stimuli (Zalta et al., 2020). Indeed, the way we move our bodies to rhythms can shape the internal representation of its beat structure (Chemin et al., 2014; Phillips-Silver & Trainor, 2005, 2007). In these prior studies, the same rhythmical sequence was internally represented as a march (duple meter; One-two-One-two) or a waltz (triple meter; One-two-three-One-two-three), depending on whether one bent the knees every two (march) or three (waltz) beats. Conversely, occupying the motor system with a competing task can disrupt beat perception (Walker et al., 2014). Altogether, these behavioral results indicate an active role of the motor system in beat perception.
The motor system also shows neuronal activity during beat-perception tasks, even when no overt movement is produced (Chen et al., 2008; Gordon et al., 2018; Grahn & Brett, 2007; Grahn & Rowe, 2009). For instance, both the perception and the production of a regular rhythm activate brain areas implicated in motor processing, including the supplementary motor area, premotor cortex, cerebellum, and basal ganglia (Grahn & Brett, 2007; Grahn & Rowe, 2009). According to Patel and Iversen (2014), the recruitment of the motor system sharpens the perception of a beat, rather than simply co-activating with auditory regions. These authors propose the Action Simulation for Auditory Prediction (ASAP) model, according to which the prediction of upcoming beats is facilitated by the simulation of periodic movement, in the form of neural oscillations in motor planning regions of the brain (cf. Proksch et al., 2020). Specifically, neuronal activity in the motor system entrains to the frequency of the beat, which is communicated to the auditory region in a temporally precise way via the dorsal auditory pathway.
The ASAP model is an attractive framework because it can explain why people often experience a compelling drive to move along to the beat when listening to music (Janata et al., 2012). Moving to music is a human universal, appearing in very young children (Drake et al., 2000; Kirschner & Tomasello, 2009) and in cultures across the world (Nettl, 2000). Here, we test one prediction of the ASAP model: If motor entrainment to the beat frequency is altered, beat perception should be equally perturbed. Individuals showing poor beat-synchronization abilities, however, have preserved beat perception, shown through normal performance in beat-perception tasks that require no motor response (Sowiński & Dalla Bella, 2013; Tranchant et al., 2016). However, the tasks used in these prior studies were not optimal for distinguishing beat perception from motor synchronization with music, as previously mentioned in Tranchant and Vuvan (2015). More specifically, Sowiński and Dalla Bella (2013) used the Rhythm test of the Montreal Battery of Evaluation of Amusia (MBEA; Peretz et al., 2003) to assess beat perception, even though this test can elicit high performance solely through the detection of temporal grouping. Tranchant et al. (2016) used the Metric test of the same battery to assess beat perception. However, this test lacks sensitivity and has a cut-off score of two SD below the mean, close to chance level. Thus, the observation of intact beat perception in the case of impaired, anomalous synchronization deserves further examination. The goal of the present study was to examine whether beat perception is indeed dissociable from beat synchronization.
To test this possibility, we developed a customized version of the Beat Alignment Test (BAT; Iversen & Patel, 2008), which was designed to assess beat perception and production in a general population using natural songs. The production task requires participants to synchronize (i.e., match the tempo of) their taps to the beat of preselected music, while the perceptual task tests the ability to detect a misalignment of a superimposed metronome soundtrack to the beat of the same music. The songs selected varied in genre, groove, and tempo. Indeed, classical music, as used in some prior tests of beat perception (Bégel et al., 2017; Sowiński & Dalla Bella, 2013) may not be optimal for studying motor entrainment. Other musical styles, for example, rhythm and blues or jazz, have a strong groove and induce a pleasant desire to move along with the music (Janata et al., 2012). Furthermore, in strong-groove contexts (e.g., dance clubs or music festivals), movement is rarely limited to finger tapping but typically involves whole-body motion (e.g., Butler, 2006; Van Dyck et al., 2013). Thus, we investigated beat alignment through both tapping (Experiment 1) and bouncing (Experiment 2). We tested nine “beat-synchronization-impaired” young adults and a large group of control subjects.
Experiment 1: Beat Synchronization and Perception
Methods
Participants
We tested 41 young adults (“control subjects”) without suspected difficulties in beat perception or production (23 women; mean age 26.6 years, range 20–39 years, SD = 4.4) and nine individuals with beat-synchronization impairment (seven women; mean age 26.4 years, range 22–30 years, SD = 2.6). All participants were non-musicians and had no history of neurological, cognitive, hearing, or motor disorders. Four beat-synchronization-impaired subjects (subjects 1, 2, 3, and 5 in Table 1) were identified on the basis of poor bouncing and clapping synchronization to music in three out of six musical excerpts according to the criterion described in Tranchant, Vuvan & Peretz (2016). Two further subjects (4 and 6) were identified in a pilot experiment investigating tapping synchronization, using the musical stimuli of the present study. Their tapping performance fell below two SDs from the mean of a group of 20 participants with varying musical expertise. Two other subjects (7 and 8) were recruited based on their self-declared inability to follow the beat in music, after directly reaching out to the authors of the present study. The last beat-synchronization-impaired subjects (9, TB) was initially recruited to be part of the control group but was shifted to the beat-synchronization-impaired group because her score was two standard deviations below the mean of the control group (see Results section) in tapping. This was expected to happen because individuals can have beat-perception deficiencies without being aware of the fact (Bégel et al., 2017). Inclusion in the control group followed accurate performance in an online test for the identification of amusia, which included an “off-beat” test. In this test, half of the stimuli in a total of 24 melodies contain a delayed note, and the task involved judging whether each melody contained a temporal incongruity.
Musical processing. Beat-synchronization-impaired participants’ scores on the Montreal Battery of Evaluation of Amusia and scores of the control group (N = 41) on its online version. Scores below the cut-off are given in bold.

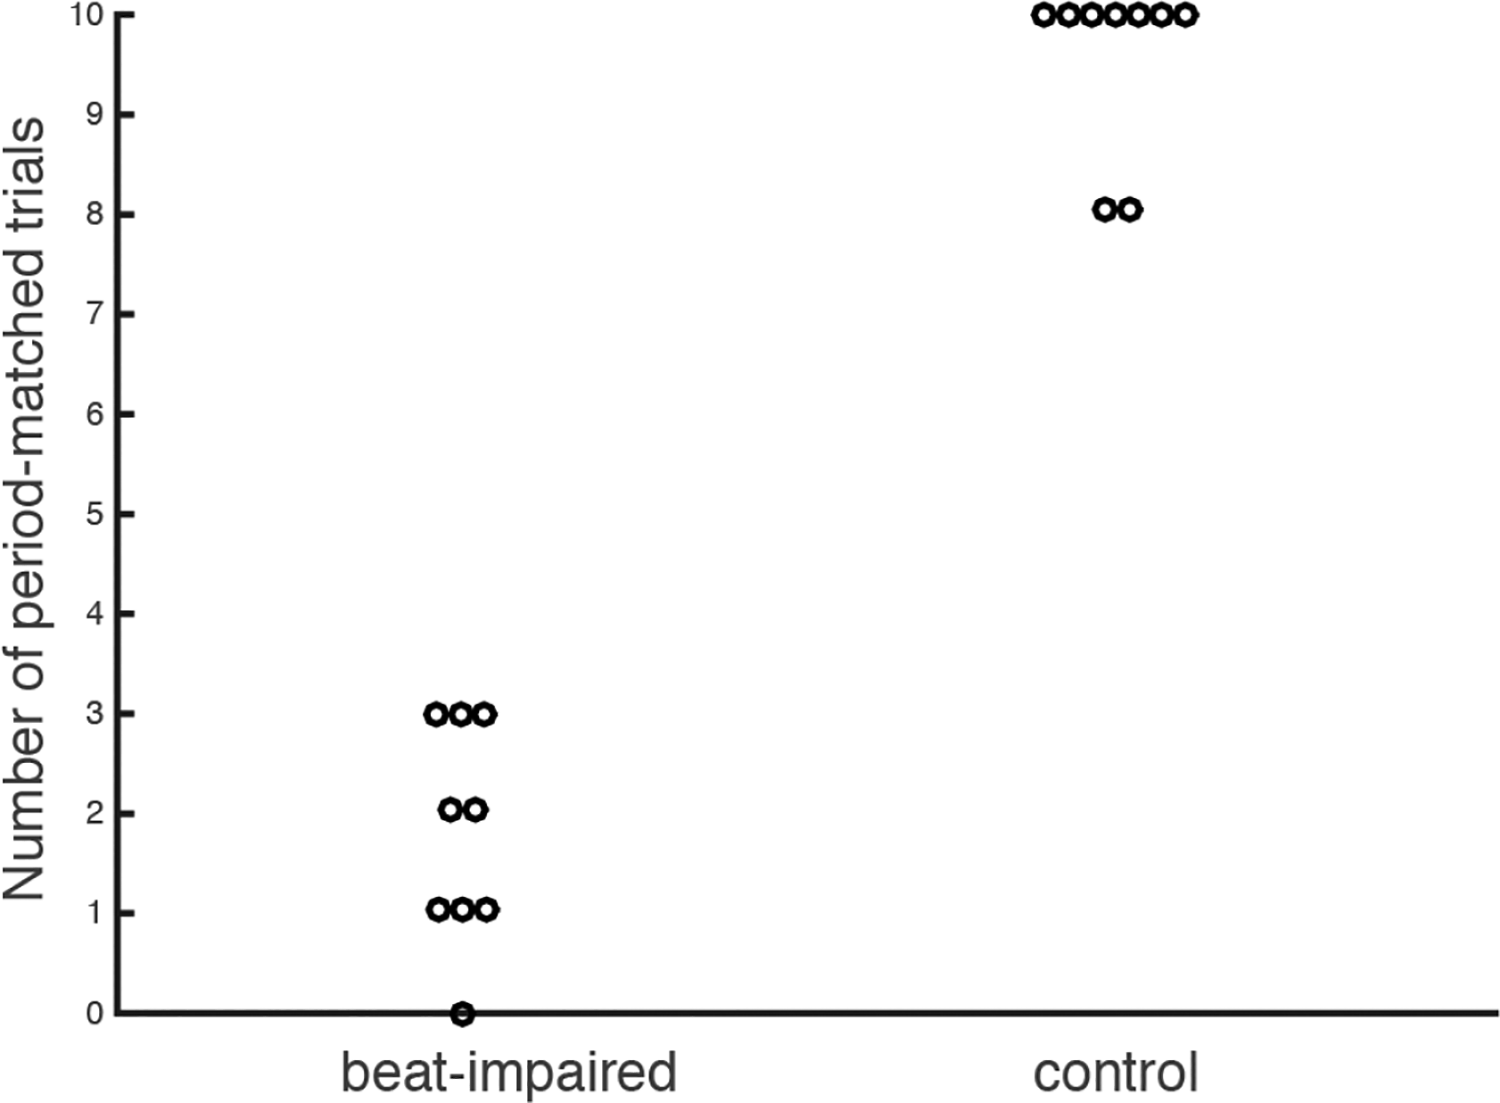
All participants were assessed for the presence of musical deficits using standard tools. Control participants were tested using an online test (Peretz & Vuvan, 2017). Scores were within normal variations (Table 1), except for two participants who were subsequently tested with the MBEA (Peretz et al., 2003) in the laboratory and obtained normal scores on the latter battery. Beat-synchronization-impaired subjects were assessed using the MBEA (Table 1). They obtained a normal melodic composite score, which is an averaged score for three tests (scale, contour, and pitch interval) that assess pitch processing in a melodic context (Vuvan et al., 2017). All beat-synchronization-impaired subjects obtained a normal score in the discrimination of melodies by their rhythm, whereas two of them (6 and 7) scored two SD below the population mean on the Metric test (below the cut-off according to Vuvan et al., 2017). All beat-synchronization-impaired individuals were tested for their ability to period-match finger taps with a metronome. Stimuli consisted of sequences of 31 isochronous tones, with two inter-onset intervals (476 and 506 ms, corresponding to 126 and 119 beats/min, respectively). Successful synchronization consistency was observed using both metronome sequences.
Stimuli
We used a customized version of the BAT so as to include music excerpts used in the first case study of beat deafness (Phillips-Silver et al., 2011) and add new ones with variable degrees of beat salience. Ten songs that varied in genre (Table 2) were selected from previous research (Einarson & Trainor, 2016; Janata et al., 2012; Phillips-Silver et al., 2011; Tranchant et al., 2016). Beats were identified using a beat tracking algorithm (Ellis, 2007) implemented in MATLAB (MathWorks). Eight songs had a simple meter in 4/4, while two had a more complex meter: Solsbury Hill in 7/4 and Take Five in 5/4. To obtain groove ratings, an independent sample of 64 adults unselected for their musical experience (35 women; mean age: 24.2 years, SD = 5.3) listened to the musical stimuli while moving a slide potentiometer (linear 10 kΩ, 0.5 W, 100 mm). Analog signals from the slider potentiometer were read by an Arduino microcontroller as 10-bit integers (0–1023) and synchronized with the audio using a customized Python script (Schultz & van Vugt, 2016; van Vugt & Schultz, 2015). Participants listened to each stimulus twice in separate blocks, in a randomized order. Slider values ranged from zero (least groovy) to 1023 (most groovy). Groove was defined as “that aspect of the music that induces a pleasant sense of wanting to move along with the music” (Janata et al., 2012). Ratings were averaged across the two presentations and then transformed into z-scores within participant. These values were then averaged across participants in order to obtain a groove score for each song (Table 2). Finally, pulse clarity was computed using the MIR Toolbox (Lartillot, Toiviainen, & Eerola, 2008). Pulse clarity is an indicator of how easily listeners can perceive the underlying beat in audio recordings (Lartillot, Eerola, Toiviainen, & Fornari, 2008). The Pulse Clarity function in the MIR Toolbox is computed from autocorrelation of the amplitude envelope of a stimulus’s waveform.
Genres, tempi durations, and groove ratings of musical stimuli.

For the perception test, the 10 songs were presented with a metronome track constituted of pure tones (100 ms, 1000 Hz) that was superimposed on the last 24 beats of each stimulus, except for Take Five, for which the track was superimposed on the last 36 beats because it had a faster tempo. To give participants some time to entrain to the beat, the metronome track started five seconds after the beginning of each stimulus. Each song was presented eight times, four times with misaligned metronome tones (off-beat conditions), with period shifts of ±15% phase (as in van der Steen et al., 2014) or ± 5%, and four times with aligned metronome tones (on-beat conditions), twice on each beat and once for each of two alternating beat arrangements, for a total of 80 trials. The two alternating arrangements (on-beat conditions) consisted of metronome tones occurring every two beats, either starting on the first or the second beat of the song. Two different on-beat conditions were used to equate the ratio of on-beat and off-beat conditions without presenting the same condition more than twice. A schematic description of on-beat and off-beat conditions is provided in Figure 1. For the tapping test, the songs did not have a superimposed metronome and were 10 s longer: 5 s were added at the beginning (to give participants enough time to find the beat) and at the end of the excerpt. Note that these extra seconds were not included in the analyses.
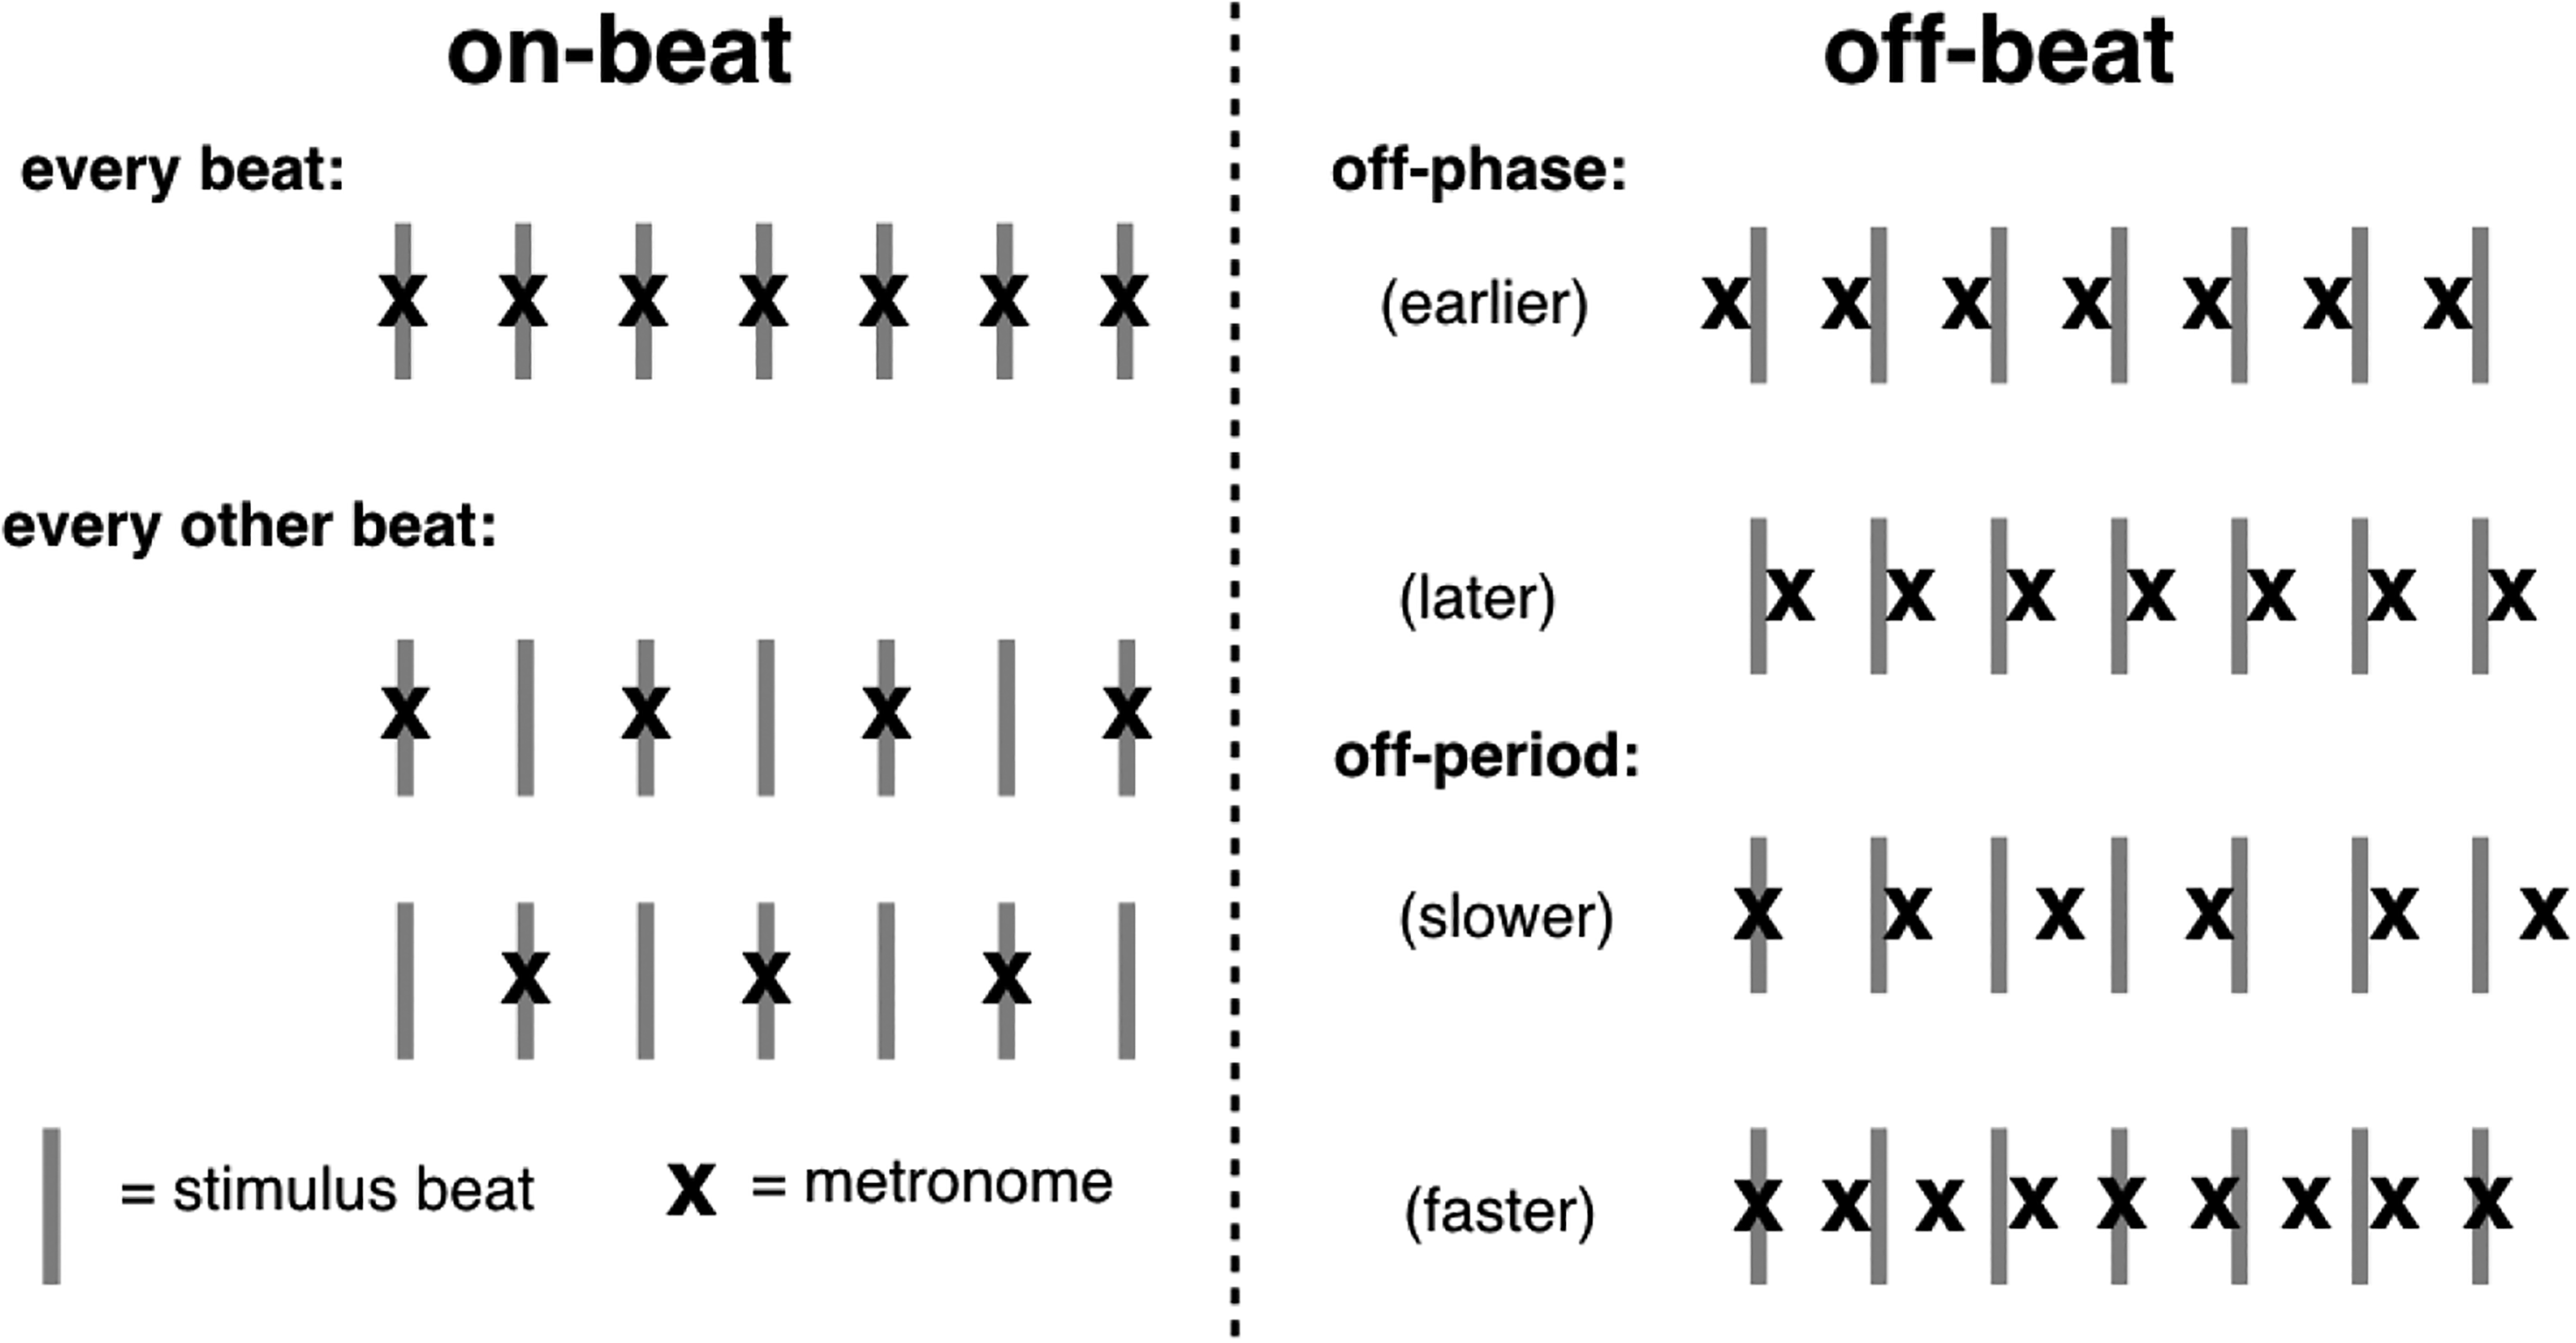
Beat alignment of the metronome soundtrack for (left) on-beat and (right) off-beat conditions for the perception test of Experiment 1.
Materials
The production test was programmed using MAX-MSP (Cycling ‘74) which read output from the Arduino; the perception test was programmed using MATLAB. Taps were recorded using a square force sensitive resistor (3.81 cm, Interlink FSR 406) connected to an Arduino Duemilanove (arduino.cc) running an adapted Tap Arduino script (based on fsr_silence_cont.ino; Schultz & van Vugt, 2016; van Vugt & Schultz, 2015) to transmit timing information to the computer via the serial USB port with a 1 ms temporal resolution. The square resistor was placed on a table in front of the participant. Stimuli were delivered through headphones (DT 770 PRO, Beyerdynamics).
Tasks and Procedure
Participants first provided written informed consent and received financial compensation for their participation. Participants completed the tapping test before the perception test on the same day. Tapping was always administered first to avoid biases or clues provided by the metronome in the perception test. In the production test, participants were instructed to tap in time with the beat of the music. There were four familiarization trials using songs that were different from the experiment stimuli. After each of these four trials, participants listened to a metronome superimposed on the beat of the same song, to ensure that they understood the concept of beat. The actual test started immediately after the practice session. Each stimulus was played twice in two distinct blocks, for a total of 20 trials. The order of stimuli was randomized within each block. Participants were invited to take a short break between the two blocks.
In the perception test, participants judged whether the superimposed metronome was aligned with the beat of the music or not. The task consisted of choosing one of four options: (a) always on the beat, (b) mostly on the beat, (c) sometimes on the beat, and (d) rarely or never on the beat. For the analysis, the first two choices were considered “on-beat” responses and the last two choices were considered as “off-beat” responses. We provided four choices rather than a binary on- or off-beat option because, for off-period trials, some metronome tones could happen to be on a beat (Figure 1). Participants received two on-beat trials, two off-phase trials, and two off-period trials for familiarization before the experimental trials. The songs used in the familiarization session were different from the experimental stimuli, and were identical to the tapping familiarization songs. Feedback was given after each familiarization trial to ensure that the participant understood the task. The actual test began immediately afterward, with no feedback. The test was divided into four blocks, with 20 trials in each block. The order of presentation of the stimuli was pseudorandom, so that no song was presented twice consecutively. Participants were instructed not to move to the music in order to reduce the contribution of body movements to the perception task. There were three breaks of at least 5 s between blocks and participants were given the opportunity to take longer breaks if needed. The production test lasted for approximately 20 m and the perception test lasted for approximately 40 min, for a total experiment duration of approximately 60 m.
Data Analysis
Data were preprocessed in MATLAB and statistical analyses were performed in R (R Core Team, 2013). There were no missing data in the perception test, with 80 responses (10 per stimulus) recorded per participant. For the tapping test, six trials (0.5% of the total) from three control participants were missing, owing to a technical error. Trials in which fewer than eight taps were recorded (0.8% of the total) were also excluded from the analyses. This happened in one trial of a beat-synchronization-impaired subject and in eight trials from five control participants. Tapping data were analyzed using circular statistics, using the Circular Statistics Toolbox for MATLAB (Berens, 2009). Linear mixed-effects models were computed using the lme4 package (Bates et al., 2014) in R. Degrees of freedom were calculated using the Satterthwaite approximation with the lmerTest package (Kuznetsova et al., 2017). When groups did not have equal variance, Welch’s t test and Hedge’s g statistic were used to calculate p and effect sizes, respectively.
Results
Synchronization
We used the Rayleigh z test to assess synchronization consistency for each musical stimulus, after transforming tap times into radians (for a detailed description of how synchronization consistency was measured, see Sowiński & Dalla Bella, 2013). A significant Rayleigh z test (p < .05) indicates synchronization consistency above chance, i.e. the taps were produced with a relatively consistent phase relationship with respect to the stimulus’ beat.
Fewer than three out of 20 trials per participant produced non-significant Rayleigh z tests in the control group with one notable exception (Figure 2). One participant initially from the control group (9, TB) failed to synchronize above chance levels in seven trials. As synchronization performance for this participant was characteristic of the beat-synchronization-impaired group (see Figure 2), the participant was moved into this group.

Number of trials (out of 20) with significant Rayleigh z tests in the tapping task. Each dot corresponds to a participant.
Synchronization of the taps to the song beat was calculated using circular statistics. Individual taps were expressed as angles (vectors) on a polar scale from 0° to 360°, considering that the full circle corresponds to the inter-beat interval. Taps within a trial were consistent with the stimulus’s beat when corresponding vectors were clustered around a mean direction. The mean resultant vector length (i.e., a measurement of circular concentration) was used to calculate the strength of synchronization consistency (following Bégel et al., 2017; Sowiński & Dalla Bella, 2013). A value of one means that all taps occurred exactly at the same time interval before or after the pacing stimulus (i.e., maximum consistency). A value of zero presents a total absence of synchronization (the taps are uniformly distributed between the beats). When participants tapped twice as slow or twice as fast as the beat tempo (e.g., McKinney & Moelants, 2006; Tranchant et al., 2016), the full circle corresponded to half or to twice the beat period, respectively. Tapping twice as slow or twice as fast as the beat is a behavior observed even in people with normal beat-synchronization abilities, since the periodic structure in music occurs at several time scales (Cooper & Meyer, 1960; Lerdahl & Jackendoff, 1983). When a participant alternated between two metrical levels during the course of a trial, the faster one (i.e., the one with the shorter period) was used to avoid bi-modal distributions on the circle. Therefore, taps that were produced at a tempo that was twice as slow or twice as fast as the beat could still be considered to be successfully synchronized. Before statistical analysis, resultant vector lengths were log transformed, based on the visual observation that resultant vectors were positively skewed (log score = −1*log(1-resultant vector)). A higher score indicates higher consistency of the taps relative to the beat. For each participant, the log-transformed score was averaged across the 20 trials. The scores are summarized in Figure 3. The beat-synchronization-impaired group (including TB) performed largely below the control group, with all scores below two SD of the mean of the control group.
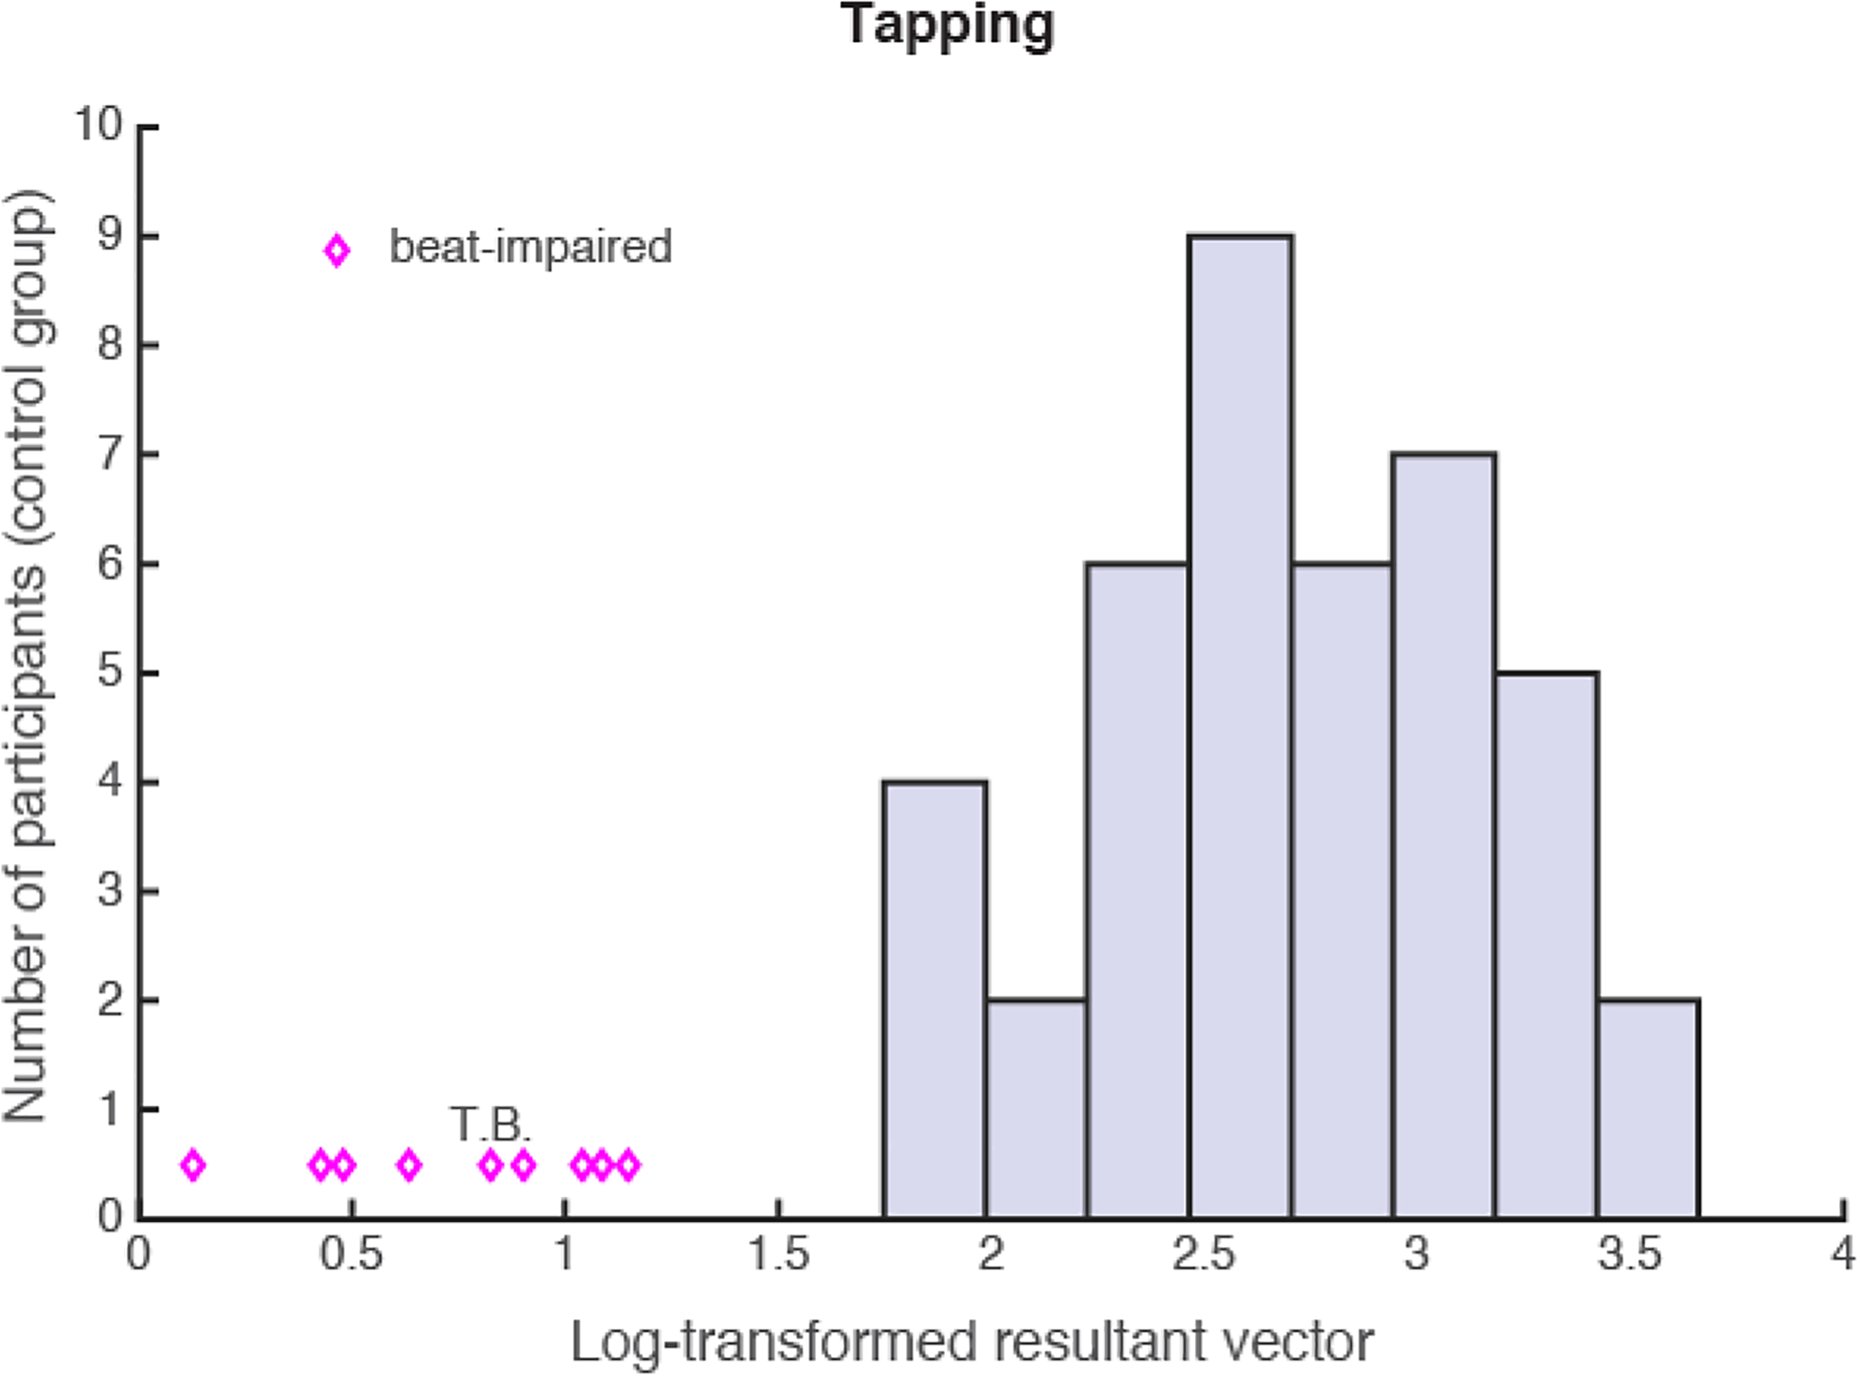
Distribution of synchronization scores (log-transformed resultant vector length) of the beat-synchronization-impaired (N = 9; diamonds) and control (N = 41; bars) groups. A synchronization cut-off score of 1.74 represented two SD below the mean of the control group (i.e., M − 2*SD).
Synchronization varied across songs. To better understand which aspects of the stimuli contributed to synchronization consistency, we performed a linear mixed-effects regression on the dependent variable transformed resultant vector in the control group, with Groove and Tempo as predictors and Participant as a random factor. Block (first versus second block of tapping) was also entered in the model to assess the potential effect of practice. “Song” was not considered a random factor, since each song retained the same Groove and Tempo values. Note that the songs Solsbury Hill and Take Five were not considered in this analysis for the sake of clarity, since all other stimuli (8 out of 10) had a simple 4/4 metric structure. We observed a significant effect of Block (β = .15, SE = .058, t(601) = 2.52, p = .012), indicating superior performance in the second block, a negative effect of Tempo (β = −.24, SE = .030, t(601) = −8.21, p < .0001), indicating better performance for slower stimuli, a negative effect of Groove (β = −.12, SE = .056, t(601) = −2.17, p = .031), indicating an unexpectedly better performance for lower-groove music, and an interaction between Tempo and Groove (β = −.13, SE = .039, t(601) = −3.47, p < .001), with R2 = .11. These results indicate that tempo influences synchronization consistency more than groove (see Figure 4). Finally, the Pulse Clarity score computed using the MIR Toolbox did not significantly predict synchronization scores (β = −.15, SE = .12, t(607) = −1.20, p = .23).
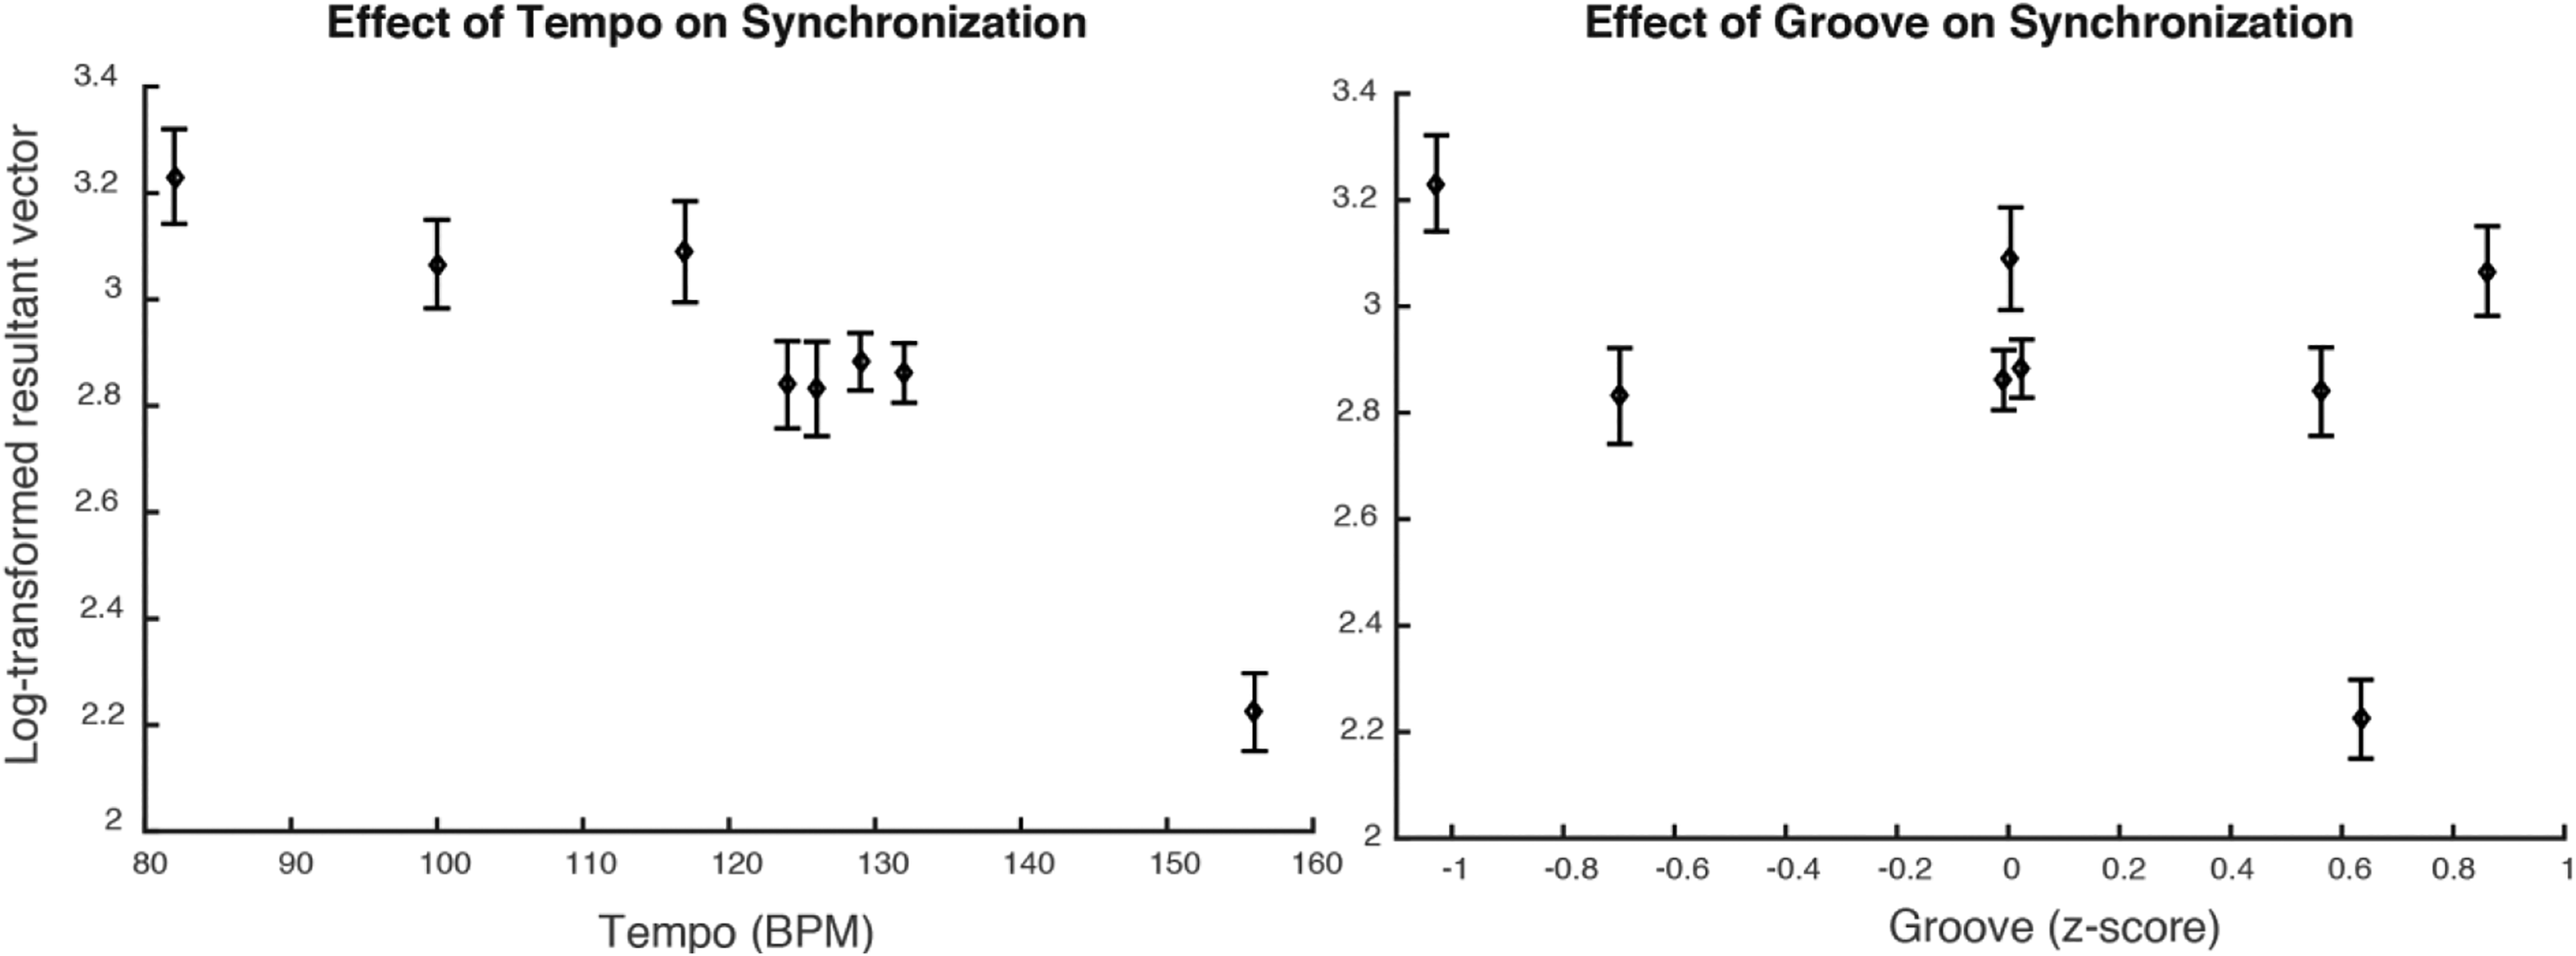
Synchronization for the control group as a function of (left) stimulus tempo and (right) groove. Standard errors of the mean are represented by error bars.
Similar statistical modeling for these effects was not performed in the beat-synchronization-impaired group because there were too few trials with a significant Rayleigh z test to be considered.
Perception
In the control group, two participants obtained a near-perfect score with only one or two incorrect responses out of 80 trials, while five participants performed around chance level (being 48/80, by binomial test). In the beat-synchronization-impaired group, two participants (6 and 7) performed at chance, with accuracy scores of 40 and 43/80, respectively. Interestingly, these two participants were also the ones who showed a deficit on the Meter test of the MBEA (Table 1). The sensitivity index (d′) was calculated, as an unbiased measure of detection performance, based on z-scores of the proportions of hits (when misaligned beats were correctly detected) and false alarms (when aligned beats were incorrectly judged as misaligned).
As can be seen in Figure 5, four beat-synchronization-impaired participants performed below the perception test cut-off computed from control scores. This cut-off score (d′ = 1.29) corresponded to two SD below the mean of the control group, after excluding the control participants who performed at chance. The other five beat-synchronization-impaired subjects performed above the cut-off, albeit with scores on the lower end of the distribution. Because the sample size and variance were not equal between the two groups, Welch’s two-sample t test was conducted. Results confirmed that the d′ score (calculated for participants who obtained a number of correct responses above chance) was lower in the beat-synchronization-impaired group (M = 1.54, SD = .34) compared with the control group (M = 2.66, SD = .68), t(15.25) = 4.17, p < .001, Cohen’s d = 2.04). Altogether, these results indicate poor beat-perception abilities in the beat-synchronization-impaired group. Interestingly, d′ scores in the beat-synchronization-impaired group were positively correlated with scores for the Meter test of the MBEA (r(7) = .69, p = .04).

Distribution of d′ scores in the perception test for the control participants (bars and stars) and the synchronization-impaired participants (diamonds). The perception test cut-off score was 1.29, corresponding to two SD below the mean of the control group. Participants from the control group who performed below the cut-off score are identified by black stars.
Because poor performance in the perception task may simply reflect a poor understanding of task demands, the five individuals from the control group and the two beat-synchronization-impaired participants who were performing at chance were invited to take the test a second time, on a different day, and we made sure that the instructions were clear to them. One beat-synchronization-impaired participant still performed at chance (6, with 46/80 correct response) while the other performed slightly above chance (7, with 50 correct responses). Nevertheless, the d′ score remained below the cut-off for both participants (.41 and .78, respectively), confirming a beat-perception deficit. Three participants from the control group performed above chance, but only two of them (identified in Figure 6) obtained a score above the cut-off (d′ = 2.1 and 1.88). Therefore, a beat-perception deficit was confirmed in two participants from the control group. The fifth participant from the control group was unavailable for retesting. Note that the two participants from the control group who failed the perception test twice were further tested using the MBEA and their scores were within the normal range.
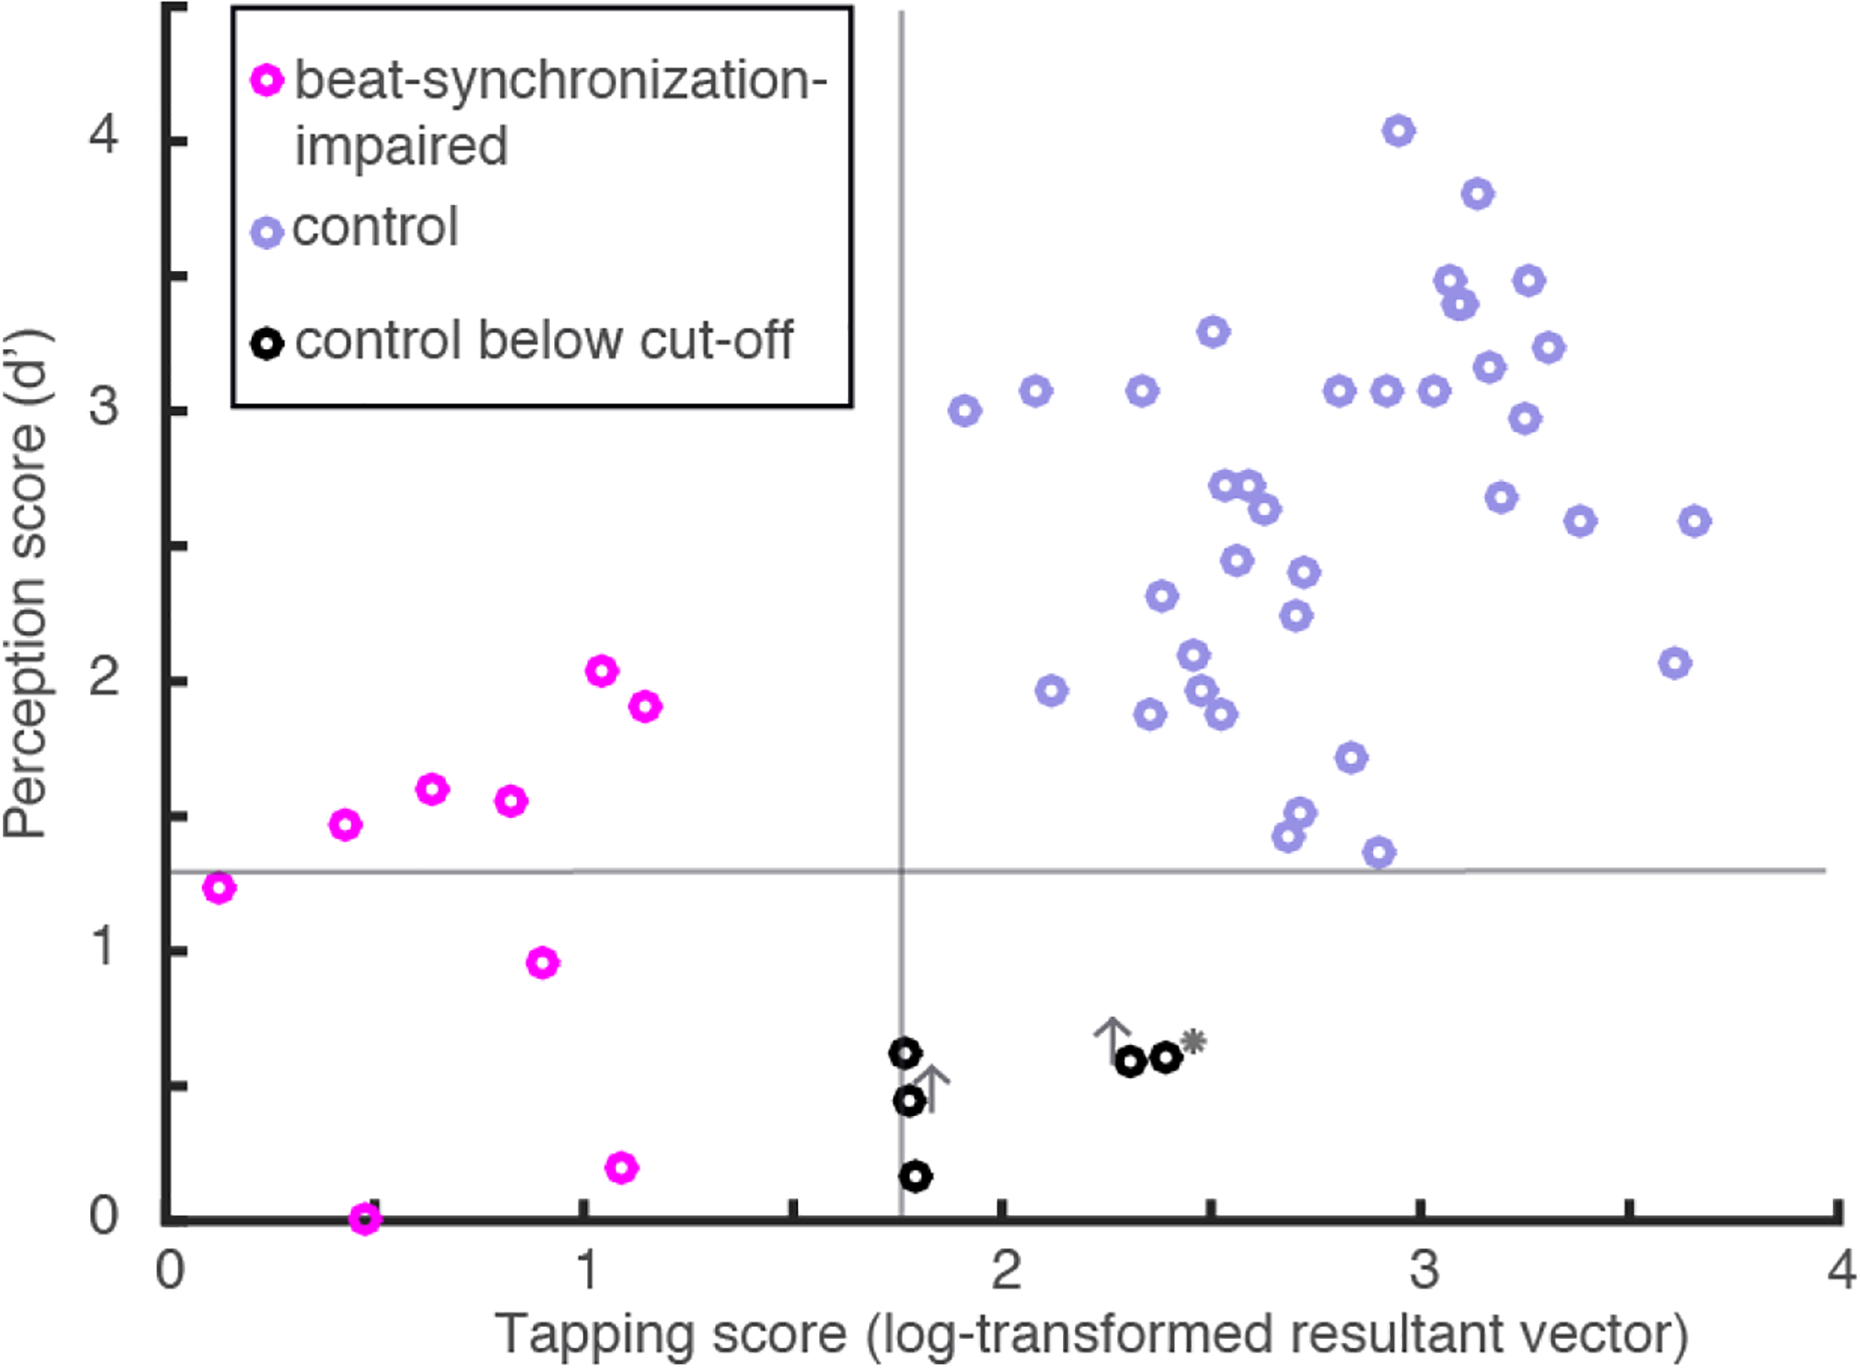
Individual scores in the beat-perception task as a function of beat-synchronization score. Gray lines indicate cut-off scores. Participants who performed above the cut-off on retesting on the perception test are identified by gray vertical arrows; the control participant who could not be retested is identified by a gray star.
A different measure of sensitivity from d′ was used to assess the role of tempo and groove on beat perception, because there were only eight responses per stimulus and per participant to consider. A correct response corresponded to “always or mostly on the beat” when metronome tones were on-beat and to “sometimes or rarely on the beat” when the metronome was off-beat. Participants who failed to perform above chance (five in the control group and two in the beat-synchronization-impaired group) were not considered in this analysis. In the control group, we found a significant effect of Tempo (β = −.15, SE = .050, t(249) = −3.04, p < .01), indicating higher accuracy for slower tempi, no significant effect of Groove (β = −.025, SE = .094, t(249) = −.27, p = .79), and no significant interaction between Groove and Tempo (β = .091, SE = .066, t(249) = 1.38, p = .17, R2 = .036). In the beat-synchronization-impaired group, there were no significant main effects of Tempo (β = −.14, SE = .15, t(46) = −.97, p = .34) or Groove (β = −.47, SE = .27, t(46) = −1.73, p = .091), and no interaction between Tempo and Groove (β = −.24, SE = .19, t(46) = −1.29, p = .20, R2 = .050). Pulse Clarity did not predict perception scores, in either the control group (β = .08, SE = .20, t(251) = .40, p = .69) or the beat-synchronization-impaired group (β = .65, SE = .57, t(48) = 1.14, p = .26).
Finally, we assessed whether participants were better able to detect that the metronome was off-beat for the off-period than for the off-phase condition. Indeed, in the off-period condition, neither the period nor the phase correspond to the beat, while the period remains correct in the off-phase condition. To this aim, we used the number of hits corresponding to “sometimes or rarely on the beat” when the metronome was off-beat, in the off-period and off-phase conditions. A perfect score corresponds to 20 hits in each condition. We found no significant effect of Group (β = 1.74, SE = 1.34, t(41) = 1.31, p = .20), no significant effect of Condition, that is off-period or off-phase (β = −1.26, SE = .66, t(41) = −1.93, p = .061), and no significant interaction between Group and Condition (β = −2.53, SE = 1.31, t(41) = −1.93, p = .061, R2 = .12). Because the effects of Condition and of the interaction approached significance, we conducted post-hoc comparisons (with the Bonferroni–Holm correction). These tests yielded significant differences between the groups, whereby the control group showed significantly more hits in the off-period condition than in the off-phase condition (t(41) = 4.78, p <.001) and the beat-synchronization-impaired group showed no difference between conditions (t(41) = 0, p = 1), that is, the mean number of hits was equal between conditions. Thus, in contrast with the control group, detection of a misaligned metronome in the beat-synchronization-impaired group was not facilitated when both period and phase were off, compared with when only the phase was off. This result suggests that the two groups might be using different strategies in the BAT perception test.
Performance in the two tasks was related (Figure 6), with a positive correlation between d′ and synchronization consistency (r(48) = 0.62, p < .001). To further test for a dissociation between beat perception and synchronization, participants were divided into groups based on the cut-off scores in the perception test. Participants who performed below the cut-off in the perception task constituted one group (N = 9), and participants who performed above the cut-off in the perception task constituted the other group. The two new groups were compared using Welch’s two-tailed t test. This analysis revealed that participants who scored below the cut-off in the perception test had significantly lower synchronization scores (M = 1.40, SD = 0.79) than participants who scored above the perception cut-off (N = 50, M = 2.35, SD =0.89, t (11.57) = 3.99, p = .002). Similarly, participants who scored below the cut-off in the synchronization test (the beat-synchronization-impaired group) had significantly lower d′ scores than those above the synchronization cut-off. These results suggest that beat perception and synchronization are related and that an impairment in beat perception generally corresponds to an impairment in beat synchronization (and vice versa).
To summarize, we confirmed poor beat-synchronization (via finger tapping) performance in eight beat-synchronization-impaired subjects assessed by objective testing and discovered a new subject who had deficient synchronization without awareness (TB). Four of these showed impaired beat perception and the other five obtained a low but normal beat-perception score. The reverse pattern of impaired beat perception with a low but normal synchronization consistency score was observed in two individuals initially recruited to be part of the control group. Nevertheless, all of the beat-synchronization-impaired participants performed poorly for both beat perception and synchronization. This raises the possibility that the disturbance is not confined to either auditory–perceptual or audiomotor beat-predicting mechanisms.
Experiment 2: Bouncing
Synchronization performance was assessed with bouncing movements to the same songs to ascertain the generality of the beat impairment found with finger tapping in Experiment 1. Synchronization performance may vary somewhat across movement types (Repp & Su, 2013; Tranchant et al., 2016) and may depend on how natural the movement feels to the participant. Thus, finding a deficit in both tapping and bouncing would provide convergent evidence for the presence of a beat-synchronization disorder and for the abstract nature of the processes involved (i.e., not movement-specific).
Methods
Participants
The nine beat-synchronization-impaired subjects from Experiment 1 and nine control participants (6 women, 3 men; mean age: 27 years, range: 22–32 years), who were closely matched in age and education, participated in the bouncing task. Control participants in Experiment 2 were part of the control group in Experiment 1. This control group did not significantly differ from the other control participants tested in Experiment 1 on tapping performance (t(19.73) = 1.67, p = .11; Welch’s two-sample t test).
Materials
Movement data were recorded using an optical infrared motion capture system (Qualisys Oqus). The cameras detected three-dimensional positions of the markers, at a sampling rate of 200 Hz. The 10 songs were delivered at a comfortable volume through two loudspeakers (Genelec 8040A) controlled by an audio interface (RME Fireface 800). Data from the markers were synchronized with the stimuli through a Qualisys Analog interface, and recorded by the Qualisys Track Manager software (http://www.qualisys.com).
Procedure
Participants stood in the middle of a large room, facing away from the experimenters. A reflective marker was placed on the right knee of the participant, which served to measure bouncing. The bouncing consisted of a vertical full-body movement by bending the knees. Participants were instructed to bounce in time with the beat of the music, keeping knees parallel and hips facing forward, with their arms resting at their sides. Before starting with the music, participants were instructed to bounce in a regular fashion for 40 s in silence (at their spontaneous motor tempo), to confirm that they could perform the movement. Then a procedure similar to the tapping test (Experiment 1) was followed, except that the stimuli were presented only once (10 trials in total). The stimulus order differed for each participant, and matched the order followed for the first tapping block of Experiment 1. There were four practice trials. After each practice trial, the participant was presented with the same stimulus but this time with a metronome track aligned with the beat. The experiment trials without the metronome started immediately after the practice. The session lasted for approximately 40 min. The bouncing test was performed one to two weeks after Experiment 1.
Data Analysis
Data were processed using the Qualisys Track Manager software for marker identification and the Motion Capture (MoCap) Toolbox (Burger & Toiviainen, 2013) in MATLAB. Statistical analyses were performed using R. For each trial, displacement data of the marker placed on the right knee were extracted and linearly interpolated to 1000 Hz in order to obtain the same timing resolution (1 ms) as in the tapping (Experiment 1). The component of maximal movement amplitude was selected, and corresponded to the horizontal direction perpendicular to the wall faced by the participant. For each trial, time points of maximal flexion of the knee were extracted (zero-crossings of the backward horizontal velocity), and were used to calculate resultant vectors and synchronization consistency, as done for tapping.
Results
As in Experiment 1, the Rayleigh z test was used to assess whether the bounces were consistent with the stimulus beat for each song. We found significant Rayleigh z test values (p < .05) for only 18% of the trials in the beat-synchronization-impaired group and for 96% of the trials in the control group, with no overlap between the group’s scores (see Figure 7). Note that one subject, TB, failed to show synchronization consistency for all 10 songs, even though they displayed successful consistency for 5 out of 10 songs in tapping in Experiment 1. This failure to bounce in synchrony with the beat could not be attributed to mechanical limitations; the coefficient of variation of bouncing (corresponding to the standard deviation of the inter-bounce intervals divided by the mean inter-bounce interval) in the spontaneous motor tempo task for TB was normal (0.034), even slightly more regular than the control group (M = 0.040, SD = .018, range = .021–.076). More generally, the coefficient of variation for spontaneous bouncing in the beat-synchronization-impaired group (M = 0.053, SD = .022, range = .033–.083) was not significantly different from the control group (t(16) = 1.44, p = .17), and this result was corroborated by non-parametric testing.
Number of trials (out of 10) with significant Rayleigh z test in bouncing. Each dot corresponds to a participant.
To compare bouncing and tapping performance, we used synchronization consistency (i.e., log-transformed resultant vector; log score = −1*log(1 − RV)), averaged across the 10 bouncing songs and across the first block of 10 tapping trials of Experiment 1. As expected, performance was worse in the beat-synchronization-impaired group than in the controls in both experiments (see Figure 8). Bouncing scores were generally lower than tapping scores in the beat-synchronization-impaired group, whereas the reverse pattern was observed in the control group. This was confirmed by a mixed-design ANOVA (type III sum of squares), 1 in which we found a main effect of Group (F(1,16) = 759.1, p < .0001, ηp 2 = .95), no significant main effect of Condition, that is, tapping or bouncing (F(1,16) = 0.040, p = 0.32, ηp 2 = .012), and a significant interaction between the two factors (F(1,16) = 16.15, p < 0.001, ηp 2 = .39). The interaction between Group and Condition was examined using post-hoc comparisons (with the Bonferroni–Holm correction). These tests yielded significant differences between the tapping and bouncing conditions, whereby the beat-synchronization-impaired group was significantly more consistent when tapping compared with bouncing (t(8) = 2.80, p = 0.047), and the control group demonstrated the opposite effect (t(8) = −2.91, p = 0.039).

Tapping and bouncing alignment to the musical beat as a function of group. Dots indicate individual scores.
Correlations between tapping and bouncing performances did not reach significance in the beat-synchronization-impaired group (r(7) = −.38, p = .32) or in the control group (r(7) = −.22, p = .58; r = −.35, p = .36 and r = −.27, p = .49 by non-parametric tests). In sum, the deficits in aligning taps to the musical beat generalize, and are even amplified, in aligning whole-body movements for the beat-synchronization-impaired group. In contrast, synchronization for the control group was more consistent in bouncing than in tapping. Higher synchronization scores for bouncing in the control group might be due to practice effects, as the bouncing test systematically occurred after the tapping test. Poorer synchronization scores in bouncing than in tapping in the beat-synchronization-impaired group suggests that practice is not sufficient to improve synchronization or that bouncing is more challenging than tapping.
General Discussion
The goal of this study was to test the hypothesis that motor entrainment to a musical beat is implicated in beat perception, as framed in the ASAP model of Patel and Iversen (2014). To this aim, we used a classic neuropsychological procedure that consisted of testing whether dissociations could be found between beat perception and production in nine individuals with clear evidence of a deficit in motor entrainment to the musical beat. According to the ASAP model, a deficit in motor entrainment to the beat of music should impair beat perception where no motor response is required. Support for this prediction was shown in the co-occurrence of poor beat alignment judgments in the nine subjects identified, with poor tapping and bouncing to the beat. Moreover, beat-synchronization and beat-perception scores were significantly correlated in the control group.
However, there were a few borderline cases. Beat perception did not appear as defective as production was in five individuals with severe motor entrainment deficits. These impaired-synchronization subjects managed to perform in the low but normal range in the perceptual BAT. Conversely, two individuals exhibited a deficit in the BAT while tapping along to music normally. These seven cases of dissociation question the causal assertion of the ASAP model between motor entrainment and beat perception. However, the evidence for a dissociation is not strong because all seven subjects performed poorly in general.
The examination of dissociations raises a thorny question concerning the diagnostic tests that should be used to identify disorders in musical beat processing. In this respect, it is worth mentioning that the Meter test of the MBEA, the current standard tool for the identification of musical disorders, was not sensitive enough to detect the presence of a beat-based deficit, even though it positively correlated with BAT perception (d′ score). Only two of the four subjects with a clear-cut deficit in beat perception on the BAT also failed the MBEA Meter test. The Rhythm test of the MBEA had even less (or no) sensitivity to the presence of a beat processing impairment; all nine beat-synchronization-impaired participants performed in the normal range on the Rhythm test, including those with deficient beat perception on the BAT. Thus, the Rhythm test of the MBEA is not appropriate to determine normal beat-perception abilities, contrary to what was suggested in prior research (Sowiński & Dalla Bella, 2013). The current findings suggest that the MBEA Meter test might be a complementary measure but cannot replace the BAT for the diagnosis of beat-perception deficits.
The BAT perceptual task also has limitations. It assesses one’s capacity to discriminate between the beat (which the participant must be able to extract first) and an added metronome, which may or may not be aligned with the beat. However, some people may use strategies relying on time-interval discrimination rather than beat perception to decide whether the metronome is aligned with the beat or not, especially for songs where there is a clear accented sound event for each beat. The beat was not equally prominent across stimuli in the present study (Table 2). We can thus reasonably assume that beat perception is necessary to succeed in the BAT perception task globally. Still, we cannot exclude the possibility that, in some instances where a sounded accent corresponded to the beat, participants used time-discrimination mechanisms to detect a misalignment with the superimposed metronome. In particular, the use of time-discrimination mechanisms might have helped some beat-synchronization-impaired participants, especially those who performed above the cut-off in the beat-perception task. As the metronome is absent in the synchronization test, reliance on time-discrimination mechanisms might, therefore, explain the decreased separation between the beat-synchronization-impaired group and the control group in the beat-perception test compared with the tapping test. However, because time discrimination is less efficient than beat perception for auditory timing (Teki et al., 2011), if participants in the beat-synchronization-impaired group were using time-discrimination mechanisms to compensate for their poor beat-perception abilities, their scores would generally remain lower than those of control subjects, which is what we observed. Since we did not specifically test time-discrimination abilities in this study, the contribution of time-interval discrimination to the BAT scores is unclear. A more thorough assessment of combined time-interval discrimination and beat-perception processes could be addressed in future studies, using such tools as the recently developed Battery for The Assessment of Auditory Sensorimotor and Timing Abilities (BAASTA; Bégel et al., 2017; Dalla Bella et al., 2017).
In contrast, the power of the BAT tapping task in diagnosing the presence of a synchronization deficit was validated here with the bouncing task. The evidence is compatible with the idea that the difficulty is more cognitive than motoric, in accordance with the ASAP model and with previous research (Fujii & Schlaug, 2013; Iversen & Patel, 2008; Leow et al., 2014). Moreover, recent findings showed that beat-synchronization-impaired individuals show poor tapping synchronization to naturally or regularly spoken sentences (Lagrois et al., 2019), suggesting that the deficit is not specific to music but probably extends to any auditory rhythmic stimulation.
To conclude, our study confirms that beat-perception and synchronization abilities are probably coupled so that a congenital anomaly can barely dissociate them. Now that we can characterize beat impairment at the behavioral level, future research should be brought to the next level by delineating its neural correlates and its training potential.
Footnotes
Action Editor
Yoshitaka Nakajima, Kyushu University, Department of Human Science.
Peer Review
Emi Hasuo, Taisho University, Department of Human Sciences.
Yuko Hattori, Kyoto University, Primate Research Institute.
One anonymous reviewer.
Author Contribution
PT, MÉL, AB, BGS, and IP researched the literature and conceived the study. PT and MÉL obtained ethical approval and conducted participant recruitment and data analysis. PT wrote the first draft of the manuscript. PT, MÉL, BGS, and IP edited the manuscript. All authors reviewed the manuscript and approved its final version.
Acknowledgments
The authors would like to thank Mihaela Felezeu and Charline Lavigne for their help with data collection.
Declaration of conflicting interests
The authors declared no potential conflicts of interest with respect to the research, authorship, and/or publication of this article.
Funding
The author(s) disclosed receipt of the following financial support for the research, authorship, and/or publication of this article: This work was supported by the Natural Sciences and Engineering Research Council of Canada, and the Canada Research Chairs program.