
Abstract
Objectives
Systemic lupus erythematosus (SLE) is an autoimmune disease involving multiple organs and is characterized by immune inflammation. The pathogenesis of SLE is complex and involves genetic and environmental components.
Methods
In this study, single nucleotide polymorphisms (SNPs) closely related to SLE were searched through integration analysis of public gene expression profiles from Gene Expression Omnibus and European Bioinformatics Institute data, and immunochip data in a genome-wide association study.
Results
SLE-associated SNPs were identified in 17 genes common among datasets. The mRNA expression levels of three genes among them were verified to differ between SLE patients and healthy controls subjects based on real-time polymerase chain reaction and sequencing of peripheral blood mononuclear cells (PBMCs). The GG genotype frequency of rs116253043 in LY6G6D was significantly lower in SLE patients and the GC genotype frequency of rs328 on LPL was significantly higher in SLE patients than in controls. VARS2 levels were significantly higher in SLE PBMCs than controls, but there was no significant difference in allele or genotype frequencies of the two SNPs (rs115470445 [C/T] and rs114394807 [A/G]) between groups.
Conclusion
Our results suggest that the GG genotype of rs116253043 plays a protective role against SLE, whereas the C allele of rs328 is a risk factor for SLE and rs116253043 with the GC genotype is an SLE-susceptibility SNP.
Keywords
Introduction
Systemic lupus erythematosus (SLE) is a chronic autoimmune inflammatory disease involving multiple organs. 1 SLE typically occurs in women of childbearing age with a male to female ratio of about 1:9 2 and diverse clinical manifestations characterized by the production of autoantibodies, activation of complement, deposition of immune complexes, and damage to multiple organs and tissues with a poor prognosis. The pathogenesis of SLE is complex and is influenced by a combination of genetic and environmental factors. The prevalence of SLE is lowest among Caucasians, higher among Asians and African Americans, and the highest among Caribbean populations. 3
Single nucleotide polymorphisms (SNPs) represent the most common type of human heritable variation, accounting for more than 90% of all known genetic polymorphisms. Multiple human leukocyte antigen (HLA) genes at chromosome regions 6p21.1–6p21.3 represent potent genetic risk factors for SLE in European and Chinese populations. 4 Genome-wide association studies (GWASs) 5 indicated 38 novel SLE-associated loci, although the mechanisms remain unclear. Han et al. 6 identified nine new SLE-susceptibility loci through a GWAS of 1047 SLE patients and 1205 control subjects in the Chinese Han population. However, this study only identified differences in SNPs and corresponding genes between groups; it did not assess whether these SNPs could lead to changes in gene transcription or protein translation.
With the rapid development of high throughput sequencing technology, increasing attention is being paid to analyses of the accumulating gene expression profiles to explore relationships between gene differences and disease. Despite the large number of microarray SLE sequencing studies, most of the data are underutilized, leaving substantial information that has not been mined in-depth. 7 Therefore, in the present study, we conducted an integrated analysis by combining reported gene profile and immunochip data 8 to screen for SLE-related SNPs. This analysis can yield new reliable biomarkers to better understand the pathogenesis of SLE.
Materials and methods
Public datasets
The basic information of the eligible microarray gene expression datasets.

Note: SLE: systemic lupus erythematosus; NC: normal control. a. SLEDAI as for disease activity; b. British Isles Lupus Activity Grade (BILAG) as for disease activity.
Subjects
A total of 28 patients newly diagnosed with SLE at the Rheumatology Department of Hunan Provincial People’s Hospital from March 2019 to September 2019 were included in this study for verification analysis. All diagnoses were according to the diagnostic criteria revised by the American Rheumatism Association in 1997. Exclusion criteria: 1. Pregnancy and/or breast feeding patients; 2. Active infections, including but not limited to current or past infection with hepatitis B or C, HIV, tuberculosis; 3. Infection such as tuberculosis, pneumocystis, cytomegalovirus, herpes simplex virus, herpes zoster and atypical mycobacteria, and so on; 4. History of malignant neoplasm; 5. Severe, progressive or uncontrolled renal, hepatic, hematological, gastrointestinal, pulmonary, cardiac or neurological medical condition; 6. Other connective tissue diseases. In addition, healthy control samples were obtained from 25 age- and sex-matched medical and nursing staff working at the same hospital during the same time period. SNPs were analyzed from the DNA samples of 350 SLE patients diagnosed in the Rheumatology Department of Xiangya Hospital of Central South University and the Department of Rheumatology of Hunan Provincial People’s Hospital from March 2016 to September 2017. Healthy control samples (n = 200) were obtained from the volunteers of the community patients with infections, tumors, chronic diseases, and connective tissue diseases were excluded. Clinical data and blood samples were collected after the patients were explained the objectives of the study and signed an informed consent form. In accordance with the provisions of the Declaration of Helsinki, the study was approved by the Ethics Committee of Hunan Provincial People’s Hospital (HPPH-2018-56 and HPPH-2020-58) and the Ethics Committee of Xiangya Hospital (XYH-201212074).
Differential gene expression analysis
The original probe-level data (CEL files) from GEO and EMBL-EBI were processed in the R package 9 using the robust multi-array average algorithm. Expression levels were obtained after background correction, quantile normalization, and induction of the probe set value. The probe array annotation was downloaded from GEO. If multiple probe sets mapped to the same gene, the average value of the probe was used as the expression level for the analysis. Differentially expressed genes between the PBMCs of SLE patients and control subjects were then identified using the R limma package, 10 with p < 0.05 as the criterion for differential expression.
Single nucleotide polymorphisms analysis
The GWAS dataset of a Chinese population obtained from Illumina immunochips 8 was processed prior to analysis of SLE-related SNPs as follows. Patients with a genetic phenotype loss (> 10%) were excluded. In addition, SNPs with phenotypic deletion (> 5%) those that did not conform with Hardy–Weinberg equilibrium (p < 0.0001), or those with a minor allele frequency (< 0.5%) were also excluded. In the quality control step, SNPs of overlapping clusters were filtered out. We then analyzed the data of the remaining quality-controlled SNPs to screen out loci with a p-value < 0.05 in GWAS and used ANNOVAR software to annotate the SNPs associated with SLE. From the annotation results, we selected the locus in the exon region of the candidate SLE-associated genes, which were compared to the frequencies in the general population using the SNP database of the Broad Institute (http://exac.broadinstitute.org/). Based on this comparison and after selecting missense and stop-gained polymorphisms with a frequency > 5%, we identified SNPs that might be associated with the occurrence of SLE.
Reverse transcription-quantitative polymerase chain reaction (RT-qPCR)
RT-qPCR was performed on PBMCs for validation of the results from the public datasets. Trizol was used to extract RNA, which was then reverse-transcribed to cDNA and used as a template for the amplification of the target genes. Specific primers were synthesized by Shanghai Sangon Biological Engineering Co., Ltd. (Supplementary Tables 1 and 2). The reaction mix included 5 μl cDNA, 0.5 μl forward and reverse primers (10 p.m. each), 12.5 μl SYBR (20×), 0.4 μl Rox II, and ddH2O to a total volume of 25 μl. Thermal cycling included 40 cycles of pre-denaturation at 95°C for 10 s, 95°C for 5 s, and 60°C for 31 s. PCR and related data processing was carried out with the 7500 Fast Real-Time PCR System (Applied Biosystems, ThermoFisher, Singapore). Using the housekeeping gene GAPDH, relative gene expression levels were compared between groups according to the mean cycle threshold (Ct) value using the 2-△△Ct formula. PCR products were purified and sequenced on an ABI 3730 platform for SNP detection and confirmation.
Statistical analysis
SPSS 19.0 software (SPSS Inc. Chicago, IL, USA) was used to analyze the data. Pairwise comparisons of measurement data with a normal distribution were performed with a two-sample t-test or a paired t-test. The Wilcoxon rank-sum test was used for non-normally distributed data. All experimental data are presented as mean ± standard error of the mean, and a difference was considered to be statistically significant at p < 0.05. For SNP analysis, genotype distribution of the control group was tested for meeting Hardy–Weinberg equilibrium (i.e., conforming with the principle of random selection). The odds ratios and 95% confidence intervals were then calculated by non-conditional logistic regression to evaluate the correlation between polymorphism at a given site and risk of SLE.
Results
Screening of differentially expressed genes in SLE
A total of 4486 differentially expressed genes (2106 up-regulated and 2380 down-regulated) were identified from the GSE81622 dataset, and 7114 differentially expressed genes (3362 up-regulated and 3752 down-regulated) were identified from the MTAB145 dataset based on a threshold of p < 0.05. Intersection analysis identified 1634 common differentially expressed genes between the two datasets, including 713 up-regulated and 414 down-regulated co-expressed genes, and 507 with inconsistent expression trends in the two microarrays (Figure 1). Cluster analysis diagram and Venn diagram of differentially expressed genes identified in the GSE81622 and MTAB145 datasets. (A) GSE81622 cluster analysis diagram, showing clear separation of differentially expressed genes between normal (blue squares) and SLE (red squares) tissues. Red indicates higher expression levels and green indicates lower expression levels in SLE. (B) MTAB145 cluster analysis diagram. (C) Venn diagram of genes obtained from the GSE81622 and MTAB145 datasets. There were 4487 differentially expressed genes in GSE81622 and 7114 differentially expressed genes in MTAB145; 1634 co-expressed genes were obtained, including 713 co-up-regulated genes and 414 co-down-regulated genes. The expression trend of 507 genes was inconsistent in the two microchips.
Key SNP loci from GWAS
Analysis of the GWAS data from Chinese SLE patients 8 identified a total of 199 SNPs potentially associated with SLE located in 169 exonic gene regions.
Selection of target genes
Integrated analysis of the SNPs identified from the gene expression chip and annotated from the GWAS revealed 17 intersecting genes exhibiting potential associations with SLE: MX1, LAMP3, LY6G6D, VARS2, LPL, ABCF1, NOD2, KIF13 A, WDFY4, CFB, TLR5, STAT2, HSPA1L, CR1, VPS54, PRSS36, and FCGR2A (Figure 2). Manhattan map and Venn diagram from the genome-wide association study data of Sun et al. (2016). (A) Manhattan map. The abscissa is a chromosome, and the ordinate is –log10 (P); a greater ordinate value indicates a more significant correlation between the SNP and SLE. (B) Manhattan map of chromosome 6. (C) Venn diagram of differentially expressed genes (blue, n = 1127) and SNP-related genes (red, n = 169), and their intersection (n = 17 genes).
Basic information of the intersection of gene expression chip and SNPs annotation.
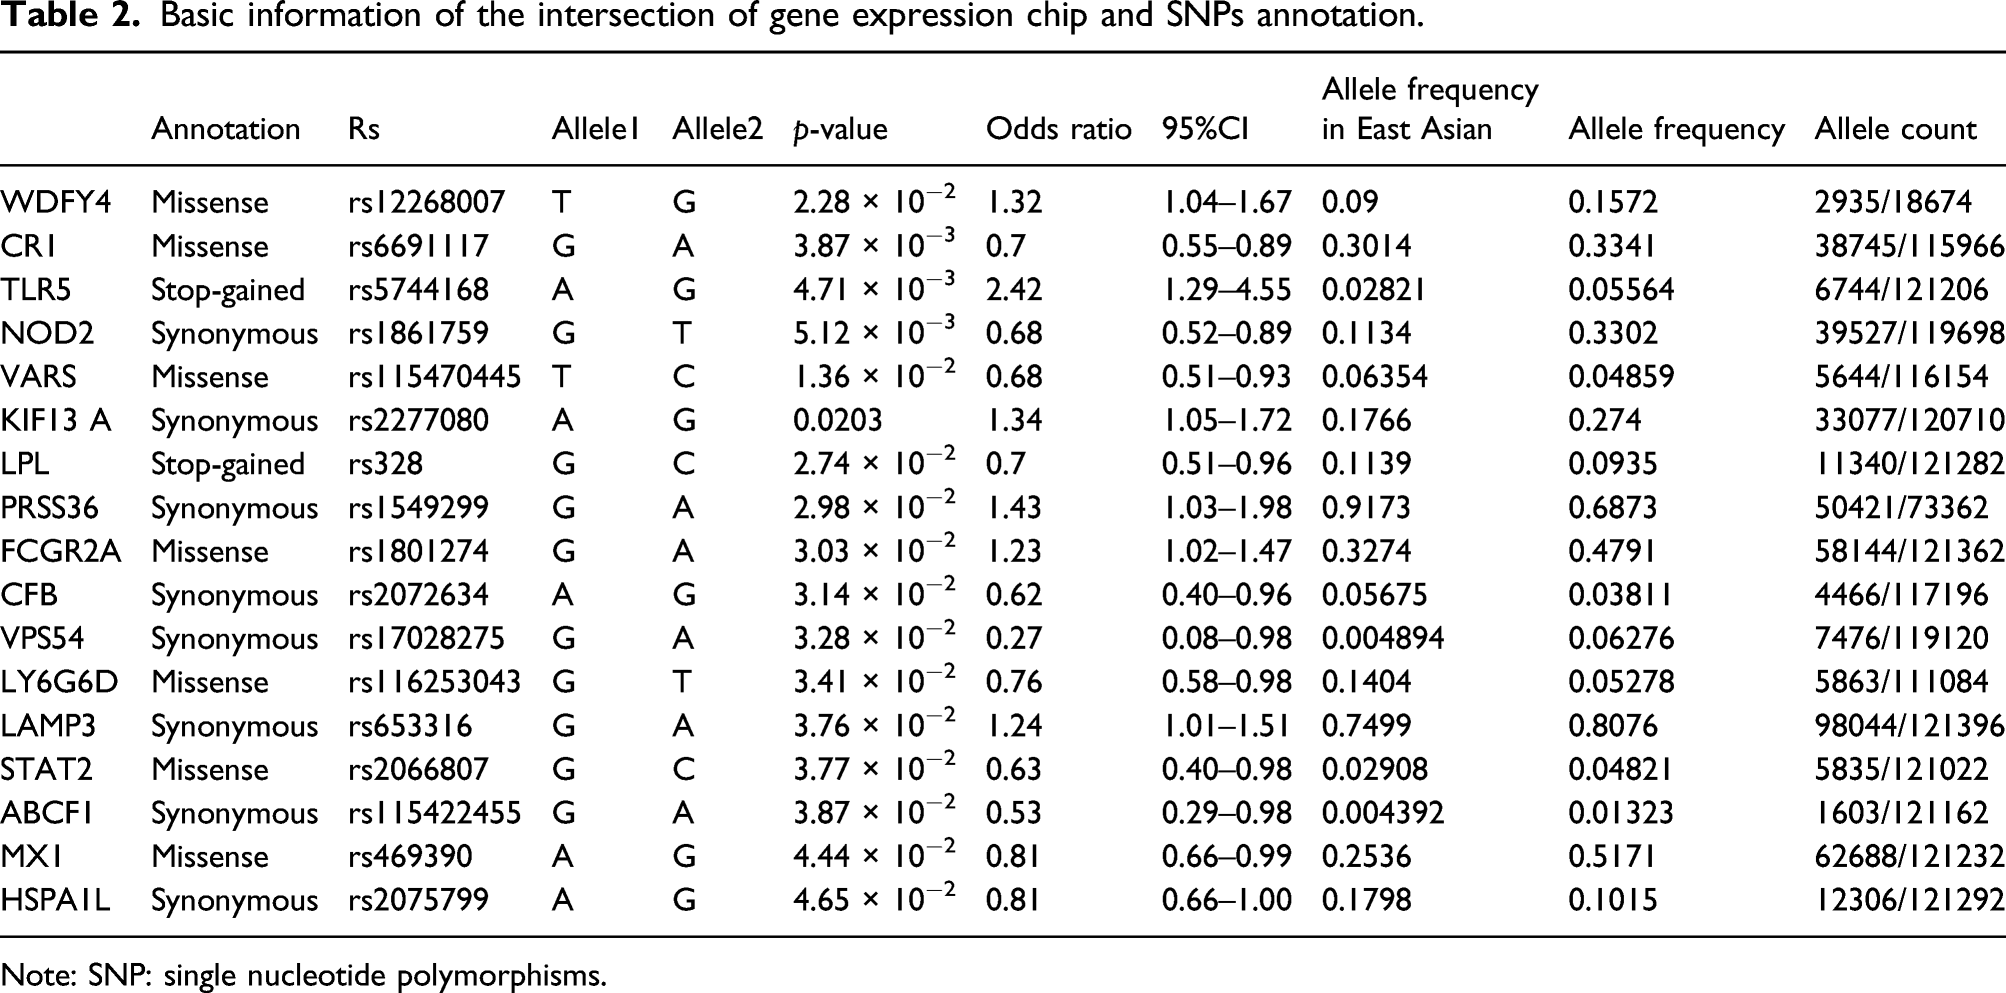
Note: SNP: single nucleotide polymorphisms.
Validation of the key genes in SLE
RT-qPCR analysis of PBMCs from SLE patients and controls at our institutes confirmed that the expression levels of LY6G6D (p < 0.001) and VARS2 (p = 0.0133) were significantly higher in SLE patients than in controls, whereas the level of LPL was lower but without statistical differences (p = 0.209) in SLE PBMCs than in the control group (Figure 3). Gene expression levels corresponding to the identified SNPs verified by RT-PCR in PBMCs of control subjects and SLE patients. (A) LY6G6D levels were significantly higher in SLE PBMCs than in controls (p < 0.001). (B) VARS2 levels were significantly higher in SLE PBMCs than in controls (p = 0.0133). (C) LPL levels were significantly lower in SLE PBMCs than in controls (p = 0.209).
Systemic lupus erythematosus susceptibility SNPs
Comparison of gene frequency and genotype frequency between SLE and NC on RS116253043.
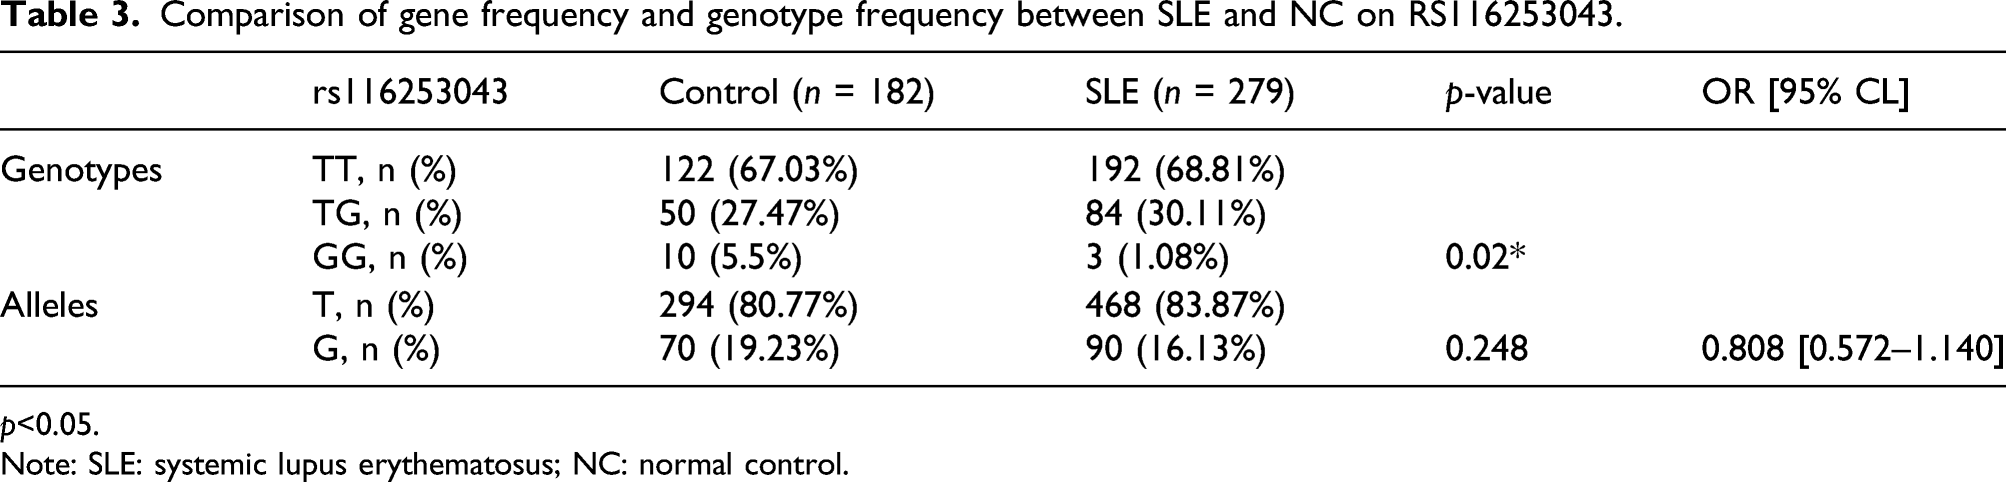
p<0.05.
Note: SLE: systemic lupus erythematosus; NC: normal control.
Comparison of gene frequency and genotype frequency on RS115470445 and RS114394807 between SLE and NC.

Note: SLE: systemic lupus erythematosus; NC: normal control.
Comparison of gene frequency and genotype frequency in SLE and RS328 between NC and SLE.
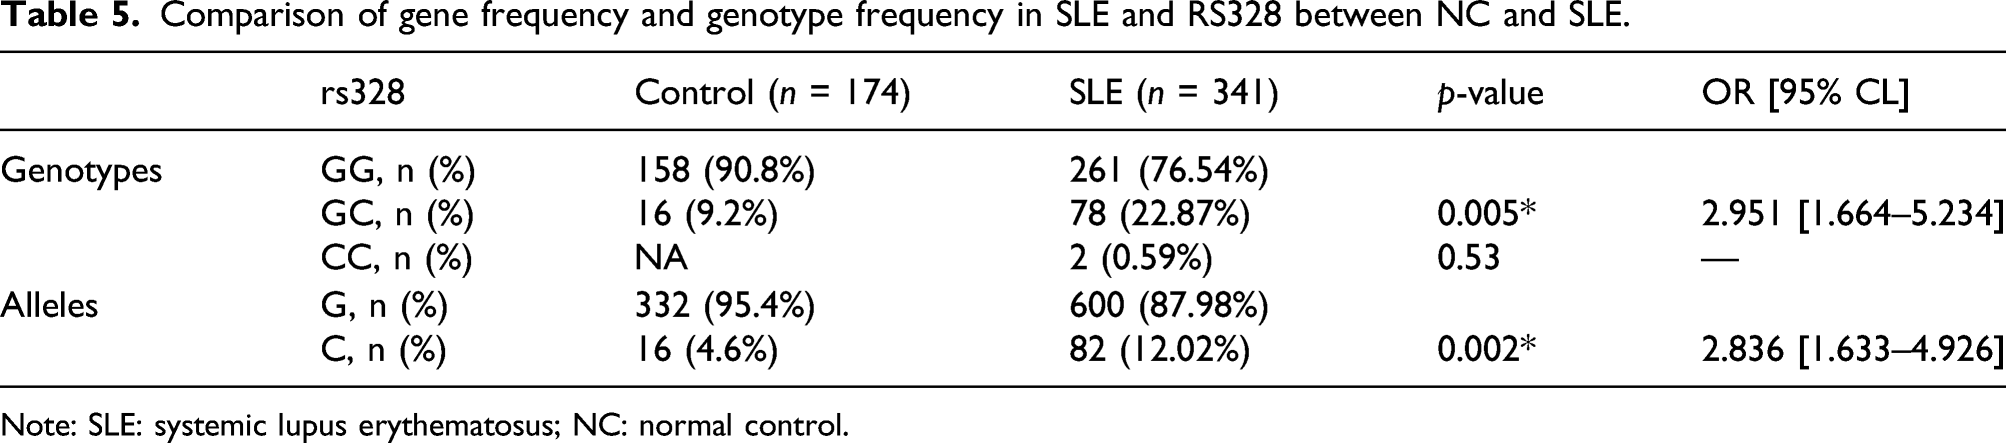
Note: SLE: systemic lupus erythematosus; NC: normal control.
Discussion
Given the complexity of the pathogenesis of SLE, along with variations in its prevalence according to ethnicity, investigating SNPs associated with SLE in exons is of great significance. This approach has been used to understand the nature of several genetic diseases by identifying the impact on the expression or function of encoded proteins. 11 The disease risk haplotype (rs922483 A) is known to be associated with reduced expression of BLK mRNA transcript in human B cell lines. The regulatory effects of SNP in BLK restricted to naive and transitional B cells, but not observed in PBMC and allelic regulation of Blk expression at the protein level were confirmed in umbilical cord blood B cell subsets. 12 Simon H. Jiang et al. 13 demonstrated the functional consequences of rare and low-frequency missense variants in the interacting proteins BLK and BANK1 in lupus patients.
Through data mining analysis, we found that SNPs in NOD2(rs1861759), KIF13A(rs2277080), PRSS36(rs1549299), VPS54(rs17028275), LAMP3(rs653316), and ABCF1(rs115422455) were synonymous substitutions(shown in Table 2); thus, changes in the coding sequence caused by these SNPs will not affect the translated amino acid sequence of the protein. The SNPs located in VARS2, STAT2, and LY6G6D were missense mutations. The LPL SNP is a stop-gain variant and is thus expected to lead to gene expression and translation changes. The incidence of these SNPs in VARS2, STAT2, LY6G6D, and LPL in the East Asian population was 6.35%, 2.91%, 14.04%, and 11.39%, respectively (Table 2). Given the low incidence of SNPs in the coding region of STAT2 in the studied population of East Asian, we further focused on VARS2, LY6G6D, and LPL SNPs to confirm the association with SLE.
LY6G6D is a member of the leukocyte antigen-6 (LY6) gene family, located in the major histocompatibility complex III region on chromosome 6. Members of the LY6 protein family typically contain 70–80 amino acids, including 8–10 cysteines. Most LY6 proteins are anchored to the cell surface by glycosylphosphatidylinositol and are directly involved in signal transduction. The identified SNP rs116253043 was located on chromosome six on the LY6G6D exon. We verified that the LY6G6D mRNA level in the peripheral blood of SLE patients was significantly higher than that of controls, and the rs116253043 genotype frequencies differed between the groups. This suggested that a missense mutation in present in this location, which may lead to abnormal transcription and translation. The GG genotype frequency was higher in the control group than in the SLE patients, suggesting a protective role.
The ∼18 kb valanyl transfer RNA synthase 2 (VARS2) gene is located on chromosome 6p21.33 in the HLA-III region and it has been suggested to have an association with autoimmune diseases. 14 The main function of VARS2 is in the synthesis of valyl-tRNA synthetase (ValRS), which contains 1063 amino acids and is the largest aminoacyl tRNA synthetase in humans. Aminoacyl tRNA synthetases catalyze the synthesis of aminoacyl tRNA, activate amino acids, and then synthesize corresponding proteins, along with possessing a correction function. ValRS is believed to be mainly distributed in the mitochondria where it plays a critical role in maintaining the physiological functions of cells. Thus, changes in synthetases within the mitochondria are likely to alter protein levels and even mitochondrial function, eventually leading to disease. Patients with mitochondrial dysfunction and oxidative phosphorylation deficiencies harboring VARS2 mutations were shown to have reduced amide acetylation of fibroblast tRNAs. 15 Variations in VARS2 have also been associated with combined oxidative phosphorylation deficiency 20, a mitochondrial respiratory chain complex disorder. 16 Mitochondria play a role in the generation not only of NETs but also of pro-inflammatory oxidized mitochondrial DNA in autoimmune diseases, 17 mitochondria and their components (e.g., N-formylated peptides and mtDNA) are recognized as damage-associated molecular patterns (DAMPs), which activate the innate immune system and elicit an inflammatory response, 18 ATP and reactive oxygen species (ROS), produced by mitochondria are triggers of the nuclear oligomerization domain (NOD)–like receptors and contribute to inflammasome activation. 19 We confirmed that the VARS2 mRNA expression level in the PBMCs of SLE patients was significantly higher than that of controls. It is speculated that VARS2 is involved in the pathogenesis of SLE by regulating mitochondrial function. However, we found no difference in the genotype and allele frequencies of the VARS2 rs115470445 and rs114394807 SNPs between SLE patients and controls, suggesting little association of these SNPs with the pathogenesis of SLE.
The 30 kb LPL gene is located on chromosome 8p22 and contains 10 exons and nine introns. 20 Analysis of immunochip data identified the SNP rs328 in the exon region of LPL associated with SLE, which was annotated as a gain-of-function mutation. This SNP results in a non-synonymous change, indicating that it would affect gene expression and translation. A previous study showed that a high frequency of anti-LPL antibodies in patients with SLE may lead to the antibody-mediated downregulation of LPL expression. 21 Lipoprteinlipase (LPL) is a glycoprotein synthesized and secreted by parenchymal cells, cardiomyocytes, skeletal muscle cells, breast cells and macrophages, combined with polysaccharides on the surface of capillary endothelial cells and catalyzes the decomposition of triglycerides in chymetry (CM) and very low-density lipoprotein (VLDL) into fatty acids and monate glycerides for tissue oxidation, energy and storage. Fatty acid oxidation provides energy for Treg cells and memory CD8 + T cells. 22 Fatty acid oxidation regulates the intrainflammatory function of macrophages and macrophage differentiation. 23 In macrophages, abnormal deposition of fatty acids and their derivatives lipoproteins is closely associated with the synthesis and pathological inflammation of foam cells. 24 Macrophages are a specialized phagocytosis capable of the uptake of various lipids (low-density lipoprotein, VLDL, and oxidized lipoprotein) through phagocytosis, macropinocytosis, and scavenger receptor-mediated pathways. 25 Autoimmunity and inflammation are significantly associated with changes in lipid and lipoprotein metabolism in SLE. 26 It was reported that phagocytosis function of macrophagocytosis from SLE patients were impaired, which can activate the inflammasome to induce the secretion of IL-18 and IL-1 along with NETs and their constituent peptide LL-37. Cytokines released can stimulate neutrophils to undergo NETosis and amplify the loop, thereby producing a variety of pro-inflammatory cytokines. 27 A higher risk of dyslipidemia was observed in SLE. C-reactive protein (CRP) and erythrocyte sedimentation rate (ESR) can inhibit high-density lipoprotein cholesterol (HDL) levels and increase triglyceride (TG) levels. Autoantibodies can cause endothelial damage, while circulating inflammatory mediators and antibodies can reduce lipoprotein lipase (LPL) activity, 28 leading to abnormal lipoproteinemia characterized by lupus. Although we found slightly decreased LPL mRNA expression levels in the PBMCs of SLE patients compared with those of controls, the difference was not statistically significant. Further studies with a larger sample size are warranted to examine this potential association. We found a significantly higher frequency of the GC rs328 genotype in SLE patients than in controls, suggesting that the C allele may be a risk factor for SLE. To our knowledge, this is the first study to clarify the distribution of the LPL rs328 allele and genotype frequencies in the Han Chinese SLE population. Although rs328 is located in the exon, further studies are needed to determine its impact on LPL gene or protein function.
Although we have identified SNPs in three genes that are strong candidates for contributing to the pathogenesis of SLE, this study has some limitations that should be mentioned. Firstly, the number of test samples was relatively small, 350 SLE patients and 200 controls; SNP detection usually requires a large sample size for effective comparison. Second, the relationship between the exon SNPs and gene expression needs to be further clarified. Transcriptional changes will only occur when SNPs are located in promoter regions that block or enhance the binding of transcription factors, and we have only based our results on SNP differences between SLE patients and healthy controls. Furthermore, there are some strongly correlated rare gene variants in SLE.29-32 Since our SNPs are derived from common differences between different centers, some common common SNPs are obtained. For rare variants, the low-frequency alleles, as well as detection methods in different centers, causes this part of rare variants to be dropped by our filter. In addition, considering the low incidence of SNPs with minor allele frequency, a large sample size is required for verification, which increases the implementation cost. Even if it is implemented, a low possibility of meeting expectations remains. In this study, we preferentially selected more common loci, and some SNP out of exon would correlate with SLE.33-37 Hence, we need to optimize the data analysis strategy to search for meaningful pathogenic rare variants, and aim to acquire a larger sample size to include low-frequency loci and locis located in introns, intergenic SNP and so on. Our present findings and follow-up research are expected to contribute to elucidation of the pathogenic mechanism of SLE and provide new targets for improved diagnosis and treatment.
Conclusion
The GG genotype of the rs116253043 SNP in LY6G6D reduces the risk of SLE. By contrast, the C allele of the rs328 SNP of LPL may be a risk factor for SLE, indicating that GC is a susceptibility genotype.
Supplemental Material
sj-pdf-1-eji-10.1177_20587392211070407 – Supplemental Material for Genetic variants related to systemic lupus erythematosus revealed using bioinformatics
Supplemental Material, sj-pdf-1-eji-10.1177_20587392211070407 for Genetic variants related to systemic lupus erythematosus revealed using bioinformatics by Xie Shuoshan, Xiao Changjuan, Zhu Honglin, Zeng Qinghua, Ouyang Shaxi, Wang Qi and Zhang Lihua in European Journal of Inflammation
Supplemental Material
sj-pdf-2-eji-10.1177_20587392211070407 – Supplemental Material for Genetic variants related to systemic lupus erythematosus revealed using bioinformatics
Supplemental Material, sj-pdf-2-eji-10.1177_20587392211070407 for Genetic variants related to systemic lupus erythematosus revealed using bioinformatics by Xie Shuoshan, Xiao Changjuan, Zhu Honglin, Zeng Qinghua, Ouyang Shaxi, Wang Qi and Zhang Lihua in European Journal of Inflammation
Footnotes
Acknowledgments
We would like to thank the Rheumatology Department of Xiangya Hospital of Central South University for providing us with many peripheral blood DNA samples of SLE patients and normal controls for SNP detection.
Declaration of Conflicting Interests
The author(s) declared no potential conflicts of interest with respect to the research, authorship, and/or publication of this article.
Funding
The author(s) disclosed receipt of the following financial support for the research, authorship, and/or publication of this article: This work was supported by grants from the Natural Science Foundation of Hunan Province (806268104034).
Author’s Note
All authors read the final manuscript and agreed to submit it.
Supplemental Material
Supplemental material for this article is available online.
References
Supplementary Material
Please find the following supplemental material available below.
For Open Access articles published under a Creative Commons License, all supplemental material carries the same license as the article it is associated with.
For non-Open Access articles published, all supplemental material carries a non-exclusive license, and permission requests for re-use of supplemental material or any part of supplemental material shall be sent directly to the copyright owner as specified in the copyright notice associated with the article.