
Abstract
Introduction:
Inflammatory bowel disease (IBD) is characterized by chronic inflammation of the intestinal tract. Known types are Crohn’s disease (CD) and ulcerative colitis (UC), but their cause remains unclear and there is no convenient biomarker for IBD. The present study aimed to demonstrate an association between the onset of CD and activating transcription factor 3 (ATF3); as a new biomarker, measurement of blood ATF3 mRNA would be useful for distinguishing between CD and UC.
Methods:
First, in a mouse model of IBD in which damage to the intestinal mucosa was chemically induced with dextran sulfate sodium (DSS), intestinal ATF3 mRNA was evaluated. Next, in human subjects, CD and UC patients, blood ATF3 mRNA and intestinal ATF3 protein production were evaluated.
Results:
In the mouse model of IBD, intestinal ATF3 mRNA was elevated compared with the control (P < 0.0001). In CD patients, blood ATF3 mRNA was elevated as compared with normal controls (NCs) and UC patients (P < 0.05). In addition, we observed an increase in ATF3 production in the intestinal tract specific to CD.
Conclusion:
ATF3 is involved in the onset of CD, and blood ATF3 mRNA measurements would be useful for distinguishing it from UC.
Keywords
Introduction
Inflammatory bowel disease (IBD) is characterized by chronic inflammation of the intestinal tract and known types are Crohn’s disease (CD) and ulcerative colitis (UC). IBD is common in young people between the ages of 10 and 30 years and has a major impact on people’s lives. Its cause had been thought to be abnormalities in mucosal immunity due to genetic factors and environmental factors, but it remains unclear. 1
These diseases are diagnosed based on clinical findings, pathology findings, and endoscopy findings as well as radiographically, 2 but no blood biomarker is available for use in clinical practice. Many previous studies aiming to establish a blood biomarker for IBD have examined genetic abnormalities, inflammatory factors, or plasma amino acid profiles3,4 but did not produce one that could be used in practice.
In IBD, tumor necrosis factor (TNF)-α and inflammatory cytokines produced by macrophages and T-lymphocytes damage the epithelial barrier in the intestinal tract, causing inflammation.5–7 Although the direct cause of induction of the inflammatory process is unknown, it has been reported that the amino acid sensor general control nonderepressible 2 (GCN2) detects amino acid depletion and decreases protein synthesis to suppress inflammation in the intestinal tract. 8 Also, when GCN2 senses amino acid depletion, there is an increase in AFT3 via phosphorylation of eukaryotic initiation factor-2 (eIF2) α. 9 ATF3 is known to regulate the immune response of macrophages 10 and has been reported to maintain intestinal tract barrier function via JNK signaling as well as to suppress inflammatory cytokines induced by nucleotide-binding and oligomerization-domain 2 (NOD2).11,12 Furthermore, ATF3 inhibits transcriptional activation of human solute carrier family 11 member 1 (SLC11A1) gene allele-3, whose involvement in infectious/inflammatory diseases is suspected. 13 The above findings suggest that a rise in ATF3 has a suppressive effect on colitis. Although ATF3 is also present in the blood and can be easily detected, no study has investigated its use in IBD. The objective of the present study was therefore to evaluate changes in ATF3 levels in IBD.
A mouse model of IBD is generally created by inducing damage chemically in the intestinal mucosa with dextran sulfate sodium (DSS), and this is widely used as a model of colitis. 14 Through the use of this model, it was reported that macrophages were involved in the development of colitis. 15 Therefore, we first induced colitis in the intestinal tract of mice using DSS and examined changes in ATF3 mRNA levels. Next, we examined whether there were changes in ATF3 mRNA levels in the blood and intestinal mucosa of human subjects with CD and UC. We thought that differences in blood ATF3 mRNA levels could possibly be used as a non-invasive means of distinguishing between CD and UC.
The present study aimed to demonstrate an association between the onset of CD and activating transcription factor 3 (ATF3); as a new biomarker, measurement of blood ATF3 mRNA would be useful for distinguishing between CD and UC.
Materials and methods
Ethics statement
The study was approved by the Ethics Committees of the Jikei University School of Medicine, Soiken Inc. and Soiken Clinic. Written informed consent was obtained from each subject. Animal experiments were approved by the Institutional Animal Care and Use Committee of the Jikei University.
Subjects
Subjects for the study were enrolled from 1 June 2013 to 30 June 2014. They consisted of 11 CD and 10 UC outpatients undergoing treatment at the Gastroenterology and Hepatology of the Jikei University Hospital (Tokyo). We enrolled as normal controls (NCs) 20 individuals aged between 20 and 64 years who attended the Soiken Clinic (Osaka). We did not conduct a formal sample size calculation for this pilot study. CD and UC were diagnosed on the basis of clinical findings, endoscopic findings, pathology findings, and radiographically. Disease activity was assessed through C-reactive protein (CRP) measurements as well as Crohn’s disease activity index (CDAI)16–19 for CD and Lichtiger’s Clinical Activity Index (CAI)20,21 for UC.
Intestinal tissue resected in curative surgery was used for disease tissue samples, and normal tissue samples were taken from the normal part of tissue resected in colon cancer surgery.
Animals
Male C57BL/6J mice were purchased from Japan Charles River Laboratories (Kanagawa, Japan). The mice were fed a commercial diet (CE-2; Japan CLEA) and given tap water to drink. Eight-week-old male mice were housed in standard cages in a temperature- and humidity-controlled room with a 12-h light/dark cycle and free access to standard lab chow and water. Experimental colitis was induced by the oral administration of 2.0% dextran sulfate sodium (DSS; MP Biomedicals) mixed with normal chow for 5 days. 22 Mice were divided into two groups: control group (not treated with DSS, DSS (−)) and DSS-treated mice (DSS (+)).
Animals were sacrificed after administering DSS for 5 days. Then, the colon was removed and slit open with scissors from the caudal end, and stools were removed with a wooden stick. Another wooden stick was placed under the slit and used to roll up the cleaned colon segment. 23 Specimens were further fixed in the same fixative, dehydrated through an ascending series of ethanol, embedded in paraffin, and sliced at a thickness of 4 µm with a sliding microtome. For routine histological observation, the paraffin sections were stained with hematoxylin and eosin (HE).
Assessment of mice with DSS-induced colitis
Total RNA was extracted from colon samples using TRIzol Reagent (Life Technologies). First-strand cDNAs were reverse transcribed using PrimeScript II 1st strand cDNA Synthesis Kit (Takara Bio).
ATF3, interleukin (IL)-1β, IL-6, and glyceraldehyde-3-phosphate dehydrogenase (GAPDH; internal 23 control) mRNA levels in mouse colon samples were determined by real-time polymerase chain reaction (PCR) with the Applied Biosystems QuantStudio real-time PCR System (Applied Biosystems). The amplifications were performed in duplicate with TaqMan Array, including probes for ATF3 (Mm00476032_m1), IL-1β (Mm00434228_m1), IL-6 (Mm00446190_m1), and GAPDH (Mm99999915_g1) (Applied Biosystems); 50 µL of TaqMan Gene Expression Master Mix (Applied Biosystems), 10 µL of the cDNA, and 40 µL of PCR-grade water per port. The thermal profile was 50°C for 2 min, 95°C for 10 min, followed by 40 cycles of 95°C for 15 s and 60°C for 1 min. Data analysis was performed using ExpressionSuite Software version v1.0.3 (Applied Biosystems).
Measurement of blood mRNA
Blood samples were collected in PAXgene Blood RNA tubes; total RNA was extracted from whole blood using PAXgene Blood RNA Kit (QIAGEN). cDNA was synthesized from total RNA using the PrimeScript RT reagent Kit (Takara Bio).
Blood mRNA levels of ATF3, IL-1β, IL-6, and GAPDH were determined by real-time PCR with the Applied Biosystems 7300 real-time PCR System (Applied Biosystems). Amplifications were performed in duplicate in a total volume of 25 µL containing 12.5-µL Premix Ex Taq (Takara Bio, Inc.), 0.225-µL forward primer (100 µM), 0.225-µL reverse primer (100 µM), 0.625-µL TaqMan probe (10 µM), 0.5-µL Rox reference dye, 8.925-µL PCR-grade water, and 2-µL cDNA. The reaction started with an initial denaturation step at 95°C for 30 s, followed by 45 cycles of 5 s at 95°C and 31 s at 60°C. Data were analyzed with Sequence Detection Software version 1.4 (Applied Biosystems). The primers and probes used were as follows: ATF3 forward primer, 5′-CGCTGGAATCAGTCACTGTCAG-3′; ATF3 reverse primer, 5′-CCTTCTTCTTGTTTCGGCACTTTG-3′; ATF3 probe, 5′-FAM-CCCTCGGGGTGTCCATCACAAAAGCC-TAMRA-3′; IL-1β forward primer, 5′-TGGCCCTAAACAGATGAAGTGC-3′; IL-1β reverse primer, 5′-AGTGGTGGTCGGAGATTCGTA-3′; IL-1β probe, 5′-FAM-CAGGACCTGGACCTCTGCCCTCTGG-TAMRA-3′; IL-6 forward primer, 5′-CATCCTCGACGGCATCTCAG-3′; IL-6 reverse primer, 5′-CCATCTTTGGAAGGTTCAGGTTG-3′; IL-6 probe, 5′-FAM-TTCTGCCAGTGCCTCTTTGCTGCTTTCA-TAMRA-3′; GAPDH forward primer, 5′-CACCATGGGGAAGGTGAAGG-3′; GAPDH reverse primer, 5′-CAATATCCACTTTACCAGAGTTAAAAGC-3; and GAPDH probe, 5′-FAM-CGCCCAATACGACCAAATCCGTTGACTCC-TAMRA-3′.
Fluorescent immunostaining
Colon sections (5 μm) were prepared from the paraffin blocks of two CD and two UC patients. After deparaffinization, antigen retrieval was performed in Tris-EDTA buffer (10mM Tris, 1mM EDTA, 0.05% Tween 20, pH9.0) at 95°C for 20 min, followed by blocking with Image-iT FX Signal Enhancer (Life technologies) at room temperature for 20 min. Colon sections were incubated with anti-ATF3 antibodies (clone 44C3a, Abcam) (1/100), which had been diluted with Can Get Signal immunostain solution A (Toyobo), for 1 h at 37°C and then washed three times with phosphate-buffered saline (PBS). Alexa Fluor 488 goat anti-mouse IgG (Molecular Probes) were used as secondary antibodies (1/200), which had been diluted with Can Get Signal immunostain solution A (Toyobo), for 30 min at 37°C. Slides were then washed three times with PBS, fixed with ProLong Diamond Antifade Mountant, stained with 4',6-diamidino-2-phenylindole (Molecular Probes), and visualized using an Olympus BX51 microscope and CCD camera (DP73; Olympus).
Statistical analysis
The Shapiro–Wilk W test was used to test the normality of data. Welch’s t test was used to compare between two groups. Analysis of variance (ANOVA) with the Games-Howell test was used to compare parameters among three groups, other than gender, which was compared using Fisher’s exact test. Relationships between variables were assessed using Spearman’s rank correlation coefficients. P < 0.05 was considered statistically significant. Statistical analyses were conducted using SPSS Statistics 21 for windows (IBM Corporation) and Prism 6 for Mac OS X (GraphPad Software).
Results
DSS-induced colitis in mice
Colitis was induced in the mice through the administration of DSS for 5 days. We observed bloody stools during administration of DSS and in the HE-stained sections, noted colitis and pia mater damage, confirming presence of inflammation. In the intestinal tracts exposed to DSS, the mRNA levels of the inflammatory factor TNF-α, IL-1β, and IL-6 and those of ATF3 were elevated as compared with those of mice that did not receive DSS (Figure 1(a)–(d)).

mRNA expression for DSS-induced colitis in mice. Intestinal mRNA expressions for (a) TNF-α, (b) IL-1β, (c) IL-6, and (d) ATF3 in DSS-treated mice (DSS(+); n = 5) and mice not treated with DSS (DSS(−); n = 6). Levels are normalized for GAPDH. IL-6 mRNA expression was below the detection limit in three mice not treated with DSS. Values are indicated as mean ± SEM. *P < 0.05, **P < 0.01, ****P < 0.0001; Welch’s t test.
Study subject characteristics
In the Shapiro–Wilk W test, age was normally distributed but not CRP. There were no significant differences by age or sex among NCs and UC and CD subjects. CRP was slightly elevated in UC and CD, but the differences were not significant (Table 1).
Study subject characteristics.
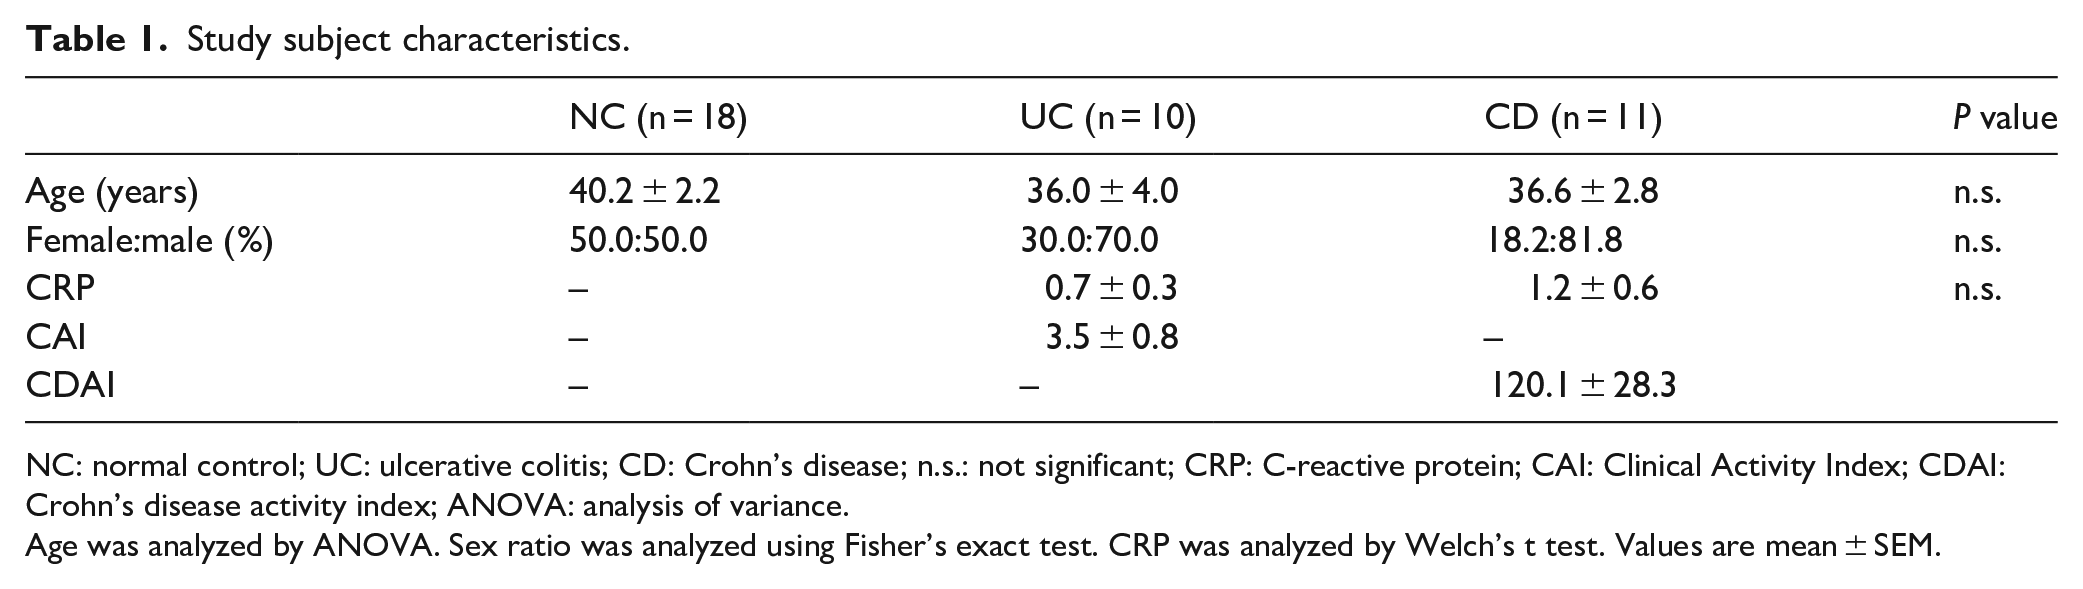
NC: normal control; UC: ulcerative colitis; CD: Crohn’s disease; n.s.: not significant; CRP: C-reactive protein; CAI: Clinical Activity Index; CDAI: Crohn’s disease activity index; ANOVA: analysis of variance.
Age was analyzed by ANOVA. Sex ratio was analyzed using Fisher’s exact test. CRP was analyzed by Welch’s t test. Values are mean ± SEM.
Change in inflammatory cytokines and ATF3 in UC and CD
In the Shapiro–Wilk W test, blood IL-1β and IL-6 mRNA levels were not normally distributed, whereas ATF3 mRNA levels were normally distributed. No significant difference in blood IL-1β or IL-6 mRNA levels was observed among UC, CD, and NC subjects (Figure 2(a) and (b)). However, blood ATF3 mRNA was higher in CD than in NCs and UC (Figure 2(c)). Also, no correlation was observed between ATF3 mRNA and IL-1β mRNA or IL-6 mRNA (ATF3 versus IL-1β: ρ = 0.22, P = 0.17; ATF3 versus IL-6: ρ = 0.03, P = 0.86; Spearman’s rank correlation coefficients).

Blood cytokine and ATF3 mRNA expressions in UC and CD patients, and intestinal tract ATF3 protein expression. (a) Blood IL-1β, (b) IL-6, and (c) ATF3 mRNA expressions in UC, CD, and NCs. Values are normalized for GAPDH. Values are mean ± SEM. *P < 0.05; one-way ANOVA with the Games-Howell test. (d, g) Intestinal tract ATF3 protein expression (green) in NCs, (e, h) UC and (f, i) CD. Nuclei are stained with DAPI (blue). The scale bar corresponds to 50 µm.
We also examined correlations between individual biomarkers and clinical characteristics (Table 2). CRP was correlated with the CAI score and CDAI score, measures of UC and CD disease severity. However, there was a negative correlation between blood IL-6 mRNA and disease severity. No correlation was observed between blood IL-1β or ATF3 mRNA and disease severity.
Correlations between each biomarker and severity.

CAI: Clinical Activity Index; UC: ulcerative colitis; CDAI: Crohn’s disease activity index; CD: Crohn’s disease; CRP: C-reactive protein; IL: interleukin; ATF3: activating transcription factor 3.
P < 0.05, **P < 0.01; Spearman’s rank correlation coefficients.
In addition, we examined ATF3 protein production in the intestinal tract. As compared with NCs and UC patients, the increase in intestinal tract ATF3 protein production observed in CD patients was greater (Figure 2(d)–(i)). Furthermore, nuclei or cytoplasm stained positive for ATF3.
Discussion
In the intestinal tracts of DSS-induced colitis model mice, ATF3 mRNA was elevated (Figure 1(d)). TNF-α, IL-1β, and IL-6 mRNA levels were also elevated, showing that active inflammation was present (Figure 1(a)–(c)).
When we examined whether ATF3 mRNA elevation was also present in human IBD subjects, compared with NCs and UC, significantly greater blood ATF3 mRNA expression was observed in CD (Figure 2(c)). Also, ATF3 protein production was increased in the intestinal tract of CD patients compared with NCs and UC patients (Figure 2(d)–(i)). It has been reported that nuclei or cytoplasm stained positive for ATF3 protein24,25 and positive staining for ATF3 was observed in both in our study too (Figure 2(f) and (i)). On the other hand, no significant increases in blood IL-1β and IL-6 mRNA were observed (Figure 2(a) and (b)). Thus, increases in blood inflammatory cytokine mRNA were not observed in the present study, in contrast to previously reported increases in blood IL-1β and IL-6 at the protein level in IBD.26,27 As a possible explanation, it has been reported that there was marked macrophage production of the inflammatory cytokines IL-1β and IL-6 in the lamina propria of the intestinal tract,28,27 so we considered that the inflammatory cytokines in blood were not derived from mononuclear cells in the blood but from those in the lamina propria. Also, there was a negative correlation between blood IL-6 mRNA levels and CAI and CDAI, which we suspected to be negative feedback due to the increase in the blood IL-6 protein level.
In addition, although ATF3 is generally considered to have an inflammation-inhibiting action,11–13 there was an increase in blood ATF3 in CD but not in UC, leading us to suppose that the rise in the blood ATF3 level did not accompany inflammation in the intestinal tract. Other reasons for thinking this were the lack of a correlation between ATF3 and CAI or CDAI (i.e. between it and disease severity (Table 2)) and there was no correlation of blood ATF3 mRNA with blood IL-1β mRNA or IL-6 mRNA. On the other hand, as there was a significant correlation between blood CRP and CAI and CDAI, we concluded that evaluation by CAI and CDAI was valid. Also, while the number of study subjects was small, we considered that the increase in intestinal ATF3 protein specific to CD patients that we observed (Figure 2(d)–(i)) was reflected as an increase in blood ATF3 mRNA. Further, in view of the increase in intestinal tract ATF3 in CD in the present study and because it has been found that ATF3 is involved in intestinal tract barrier function and inflammatory cytokine production,11,12 we considered it possible that ATF3 is involved in the mechanism of onset of CD. Although ATF3 did not reflect CD activity in the present study, in future research, through multiple measurements of ATF3 in the follow-up of individual patients, it should be possible to find out whether there is an association with disease activity or not.
Generally, ATF3 elevation is due to amino acid depletion as well as virus infection, endoplasmic reticulum (ER) stress, and oxidative stress via eIF2α phosphorylation. 29 In view of this, we speculate that GCN2 is also involved in the elevation of ATF3 observed in CD and this could be the cause of impaired nutrient absorption in CD.
Also, as it has been observed that ATF3 suppressed inflammatory cytokines induced by nucleotide-binding oligomerization domain-containing protein (NOD2), a known genetic risk factor for CD, and that it was potentiated by NOD2 stimulation,12,30 there could have been an association between NOD2 and elevation of ATF3 in the present study. In addition, although a previous study did not find an association between NOD2 gene polymorphism and CD in Japanese, 31 it was considered possible that ATF3 acts in conjunction with NOD2 in the development of CD.
However, as there was no association between ATF3 elevation and disease activity in the present study, the mechanism by which it occurs was not fully clarified so further studies are needed. In addition, while the reason for the difference observed in ATF3 elevation between UC and CD is also unclear, we consider that measurement of blood ATF3 mRNA could be used for distinguishing between the three diseases.
A limitation of the present study was the small sample size of the clinical specimens. In the future, it will be necessary to conduct further research using a larger number of samples.
Conclusion
In the intestinal tract of DSS-induced colitis model mice, an increase in ATF3 was observed, and in the human study, we demonstrated that compared with NC and UC, blood ATF3 mRNA was elevated in CD. This indicates that measurement of blood ATF3 mRNA would be useful in distinguishing between CD and UC.
Footnotes
Acknowledgements
We are grateful to Drs. Osami Kajimoto of Department of Biomarker and Molecular Biophysics, Osaka City University Graduate School of Medicine and Tomohiro Sugino at Soiken Inc. for their help in obtaining blood samples from normal controls (NCs). We thank Virus Ikagaku Kenkyusyo Inc. for their technical assistance and Mr. Alexander Cox for editorial assistance with the manuscript.
Declaration of conflicting interests
The author(s) declared the following potential conflicts of interest with respect to the research, authorship, and/or publication of this article: K.K. has stock in Virus Ikagaku Kenkyusho Inc. The other authors report no competing interests.
Funding
The author(s) disclosed receipt of the following financial support for the research, authorship, and/or publication of this article: This work was supported in part by the Ministry of Education, Culture, Sports, Science and Technology (MEXT)-Supported Program for the Strategic Research Foundation at Private Universities (grant number S1201032); Private University Research Branding Project from MEXT; Virus Ikagaku Kenkyusho Inc.; and Soiken Inc. The funders had no role in the design and conduct of the study; management, analysis, and interpretation of the data; or preparation, review, or approval of the manuscript.