
Abstract
The aims of this article are to investigate the effects of Th22 and Th17 cells and plasma cytokines in patients with nonalcoholic fatty liver disease (NAFLD) and to examine the correlation between Th22 and Th17 cells levels and disease progression. Blood samples from 70 patients with NAFLD and 26 healthy controls (HCs) were collected. Flow cytometry and enzyme-linked immunosorbent assay (ELISA) analysis were performed. ELISA revealed interleukin (IL)-22 plasma level in FibroScan subgroup patients was 2.2-fold higher than that in the HCs (P < 0.01), body mass index (BMI) subgroup patients were 2.3-fold higher than HCs (P < 0.01), IL-17A plasma level was 5.6-fold higher in FibroScan subgroup patients than that in the HCs (P < 0.01), and 5.8-fold higher in BMI subgroup than HCs (P < 0.01). Flow cytometry revealed median proportions of Th22 cells in FibroScan group was greater than that in the HCs (3.85% vs 0.86%; P < 0.001). Similar results were obtained for Th17 cells (6.36% vs 0.9%; P < 0.001). The liver stiffness measurement value was highly correlated with the proportion of Th17 and Th22 cells and moderately correlated with the plasma level of IL-17A, IL-22, and the BMI value. In conclusion, the elevated proportions of Th17 and Th22 cells were significantly correlated with the degree of liver cirrhosis in NAFLD patients. They may play an inflammatory and immune response role in progression from nonalcoholic fatty liver (NAFL) to nonalcoholic steatohepatitis (NASH) or fibrosis.
Introduction
Nonalcoholic fatty liver disease (NAFLD) is defined by an accumulation of liver fat exceeding 5% of its weight in the absence of significant alcoholic intake. The prevalence of NAFLD in the general population is estimated at 20%–30%. 1 Around 5%–20% of patients with nonalcoholic fatty liver (NAFL) progress to nonalcoholic steatohepatitis (NASH). 2 NAFLD progresses from hepatic steatosis, through inflammatory NASH, to fibrosis or cirrhosis. A proportion of people with NAFLD die from liver failure or hepatocellular carcinoma or need a liver transplant. Until now, why only some patients develop NASH is unarticulated.
Although the etiology of NAFLD is multifactorial and remains largely enigmatic, it is consensus that inflammation is a central component of NAFLD pathogenesis. 3 However, the critical immune mediators regulating NAFLD progression remain undefined. Recent reports highlight an important role for the interleukin-17 (IL-17, known as IL-17A) axis in mediating disease development and progression. 4 Some reports suggest that NAFLD pathogenesis would be modulated by regulating the activation of IL-17A and IL-17F, 5 and there was higher frequency of Th17 cells in liver and peripheral blood during the progression from NAFL to NASH. 4 Recently, IL-22 was identified as a potential therapy to ameliorate alcoholic liver disease, which is produced by Th22 cells. 6 Th22 cells were increased in patients with alcoholic hepatitis, which help in liver protection and liver regeneration.7,8
In addition, new report found that there is a relation between IL-17 and IL-22 in NASH development in mice: hepatic infiltration of Th17 cells is critical for NASH initiation and development of fibrosis in mice and reflects an infiltration of Th22 cells; Th22 cells are protective in NASH, but only in the absence of IL-17. 9 Th17 and Th22 cells are associated with different liver responses during chronic and acute hepatic diseases, but their specific role(s) and reciprocal interactions remain to be determined.
On this background, this study was designed to gain new insights into the dynamics of the Th17-related cytokines IL-17A and Th22-related cytokines IL-22 during the course of NAFLD. We hypothesized that Th17 and Th22 cells as well as the plasma cytokine levels will be elevated in patients with NAFLD or NASH. We, furthermore, examined whether there may be an association between high frequencies of Th17 and Th22 cells with disease development.
Materials and methods
Patient characteristics
In this study, 70 patients with NAFLD were treated between October 2015 and September 2016 at the First Affiliated Hospital of Guangxi Medical University (Nanning, P.R. China). The inclusive criteria for all enrollment patients were as follows: diagnosed with NAFLD by typical imaging findings, such as ultrasound, computer test, according to the American Practice Guideline (2012) of NAFLD; no causes for secondary hepatic fat accumulation such as significant alcohol consumption, use of steatogenic medication, or hereditary disorders; all patients were >18 years old. Other liver diseases were excluded with a detailed drug history and laboratory tests for chronic viral hepatitis (hepatitis B virus surface antigen (HBVsAg) and hepatitis C virus (HCV) serology), autoimmune liver disease (antinuclear antibody (ANA), antimitochondrial antibody (AMA), smooth muscle antibody (SMA), liver kidney microsome type-1 (LKM1) antibodies, immunoglobulins), and other treatable metabolic diseases (hemochromatosis, Wilson’s disease, celiac disease, alpha-1 antitrypsin deficiency). Patients with significant alcohol consumption (women >20 g/day and men >30 g/day) were excluded. All patients without histology-proven NAFL or NASH were classified as having NAFLD throughout the study. Finally, 26 healthy controls (HCs) were enrolled according to the following inclusive criteria: liver ultrasound or computer test was without pathologies; and there was no elevated liver stiffness measurement (LSM) value determined by FibroScan® 502 Touch device (Echosens, Paris, France); laboratory analysis showed no elevation of glutamic oxaloacetic transaminase (GOT) or glutamic pyruvate transaminase (GPT). All involving persons were enrolled after approval by the local ethics committee and informed consent and signed the consent to participate in the study.
Cytokine determination by enzyme-linked immunosorbent assay
Plasma was collected from all study participants and stored at −80°C until use. Commercial enzyme-linked immunosorbent assay (ELISA) kits (Cusabio, College Park, MD, USA) were used to determine plasma levels of IL-22 (CSB-E13418h) and IL-17A (CSB-E12819h) according to the manufacturer’s instructions. Samples and standards were analyzed in duplicate, and average optical density (corrected for the optical density of blank controls) was used to calculate cytokine concentrations from standard curves. Lower detection limits were calculated as the average value of the blanks plus two standard deviations; these limits were 1.56 pg/mL (IL-17A) and 3.9 pg/mL (IL-22). Values below these detection limits were set equal to these limits.
Percentages of cytokine-producing Th cells based on flow cytometry
Cell culture and stimulation
Peripheral blood mononuclear cells were isolated by Ficoll-Hypaque centrifugation (Eppendorf, Hamburg, Germany). Multiple samples from each patient were washed in phosphate-buffered saline (PBS) containing 20% heat-inactivated pooled human serum-AB. Cells (2−4 × 10⁶/mL) were cultured in a flat-bottomed 12-well plate (Corning Costar, Corning, NY, USA) for 4 h at 37°C in RPMI 1640 supplemented with 100 U/mL penicillin, 100 mg/mL streptomycin, and 10% heat-inactivated pooled human serum-AB in a 5% CO2 atmosphere. Then cultures were stimulated with 50 mg/mL phorbol 12-myristate 13-acetate (Sigma-Aldrich, St. Louis, MO, USA), 1 mg/mL ionomycin (Sigma-Aldrich), and 10 mg/mL of Golgi inhibitor brefeldin A (BD Pharmingen, San Diego, CA, USA) per 2.5 mL cell suspension.
Cell staining
Cultured cells were harvested, washed twice in wash buffer (PBS containing 2% bovine serum albumin and 0.9% azide), and adjusted to a concentration of 5−6 × 10⁶ cells/mL. Cell suspension (100 μL) was incubated with optimized amounts of fluorophore-conjugated antibodies against surface markers (CD3, APC Mouse Anti-Human CD3; CD4, PerCP-Cy™5.5 Mouse Anti-Human CD4, BD Pharmingen) for 20 min at room temperature in the dark. Following surface staining, cells were washed and treated with 1.5 mL of BD FACS lysing solution (BD Pharmingen) previously diluted 1:10 in deionized water according to the manufacturer’s instructions. Then cells were permeabilized using FACS Permeabilizing Solution (BD Pharmingen) previously diluted 1:10 in deionized water according to the manufacturer’s instructions. Cells were blocked with heat-inactivated murine serum (Invitrogen, Carlsbad, CA, USA) and subsequently stained with fluorophore-conjugated antibodies targeting intracellular IL-17A (Human IL-17A Alexa Fluor 647, BD Pharmingen) or IL-22 (Human IL-22-PE-conjugated antibody, R&D Systems, Minneapolis, MN, USA). In parallel, staining was performed with isotype controls matched for IgG subtype, concentration, species, and fluorophore. After 20 min of incubation at room temperature in the dark, cells were washed twice and fixed in 250 μL PBS containing 1% formaldehyde. Samples were analyzed within 24 h of fixation using a FACS Calibur flow cytometer and Cell Quest software (BD Bioscience, San Jose, CA, USA).
Flow cytometry gating
Based on a forward side scatter plot, a CD3+ T-cell gate was inserted and 10,000 events were recorded within the gate. A plot of forward scatter height versus amplitude was used to exclude events that did not appear to correspond to single cells. Lymphocytes were further identified based on their expression of CD4 (Th cells). The “fluorescence minus one” approach was used to correct for data spread due to compensation, and results with isotype controls were used to assess the extent of nonspecific antibody binding. We reported proportions of cytokine-positive cells within the subpopulation of CD4+ T cells.
Statistical analysis
Data were presented in the form of mean ± SD and were analyzed by software SPSS 22.0 (IBM, Chicago, IL, USA). Inter-group differences were assessed by the one-way analysis of variance (ANOVA) or Wilcoxon rank-sum tests. Correlation analysis between IL-22 and IL-17A levels was assessed by Spearman correlation analysis. P < 0.05 was considered statistically significant. Statistical graphs were generated using GraphPad Prism 5 software.
Results
Cohort characteristics
A total of 70 patients with NAFLD were enrolled in this study, with characterization of the peripheral immune cell profile. No patient was available the liver histology, and the samples were characterized as NAFLD by typically imaging (liver ultrasound or computer test). A total of 11.4% (8/70) of these NAFLD patients had GPT levels >1.0 upper limit of normal (ULN) and 11.4% (8/70) had GOT >1.0 ULN. In total, 37 of all fatty liver patients (n = 70) were overweight (n = 29, body mass index (BMI) 25–30 kg/m2) and obese (n = 8, BMI >30 kg/m2), and all of them were divided into BMI subgroup. Thirty-three of NAFLD patients who had LSM >10.3 kPa were divided into the FibroScan subgroup (NAFLD patients with an LSM value generally >10.3 kPa imply cirrhosis), 10 which is a quick, painless noninvasive test that measures liver stiffness as a marker of liver fibrosis. Only LSMs with 10 validated measurements and an interquartile range/median (IQR/M) <30% for values higher than 7.1 kPa were considered reliable. 11 In this study, NAFLD patients had a significantly higher BMI compared with HCs (P < 0.01), but there was no statistical difference compared with HCs in age (P > 0.05). Compared with HCs, more NAFLD patients had metabolic syndrome, with hypertension, hyperlipidemia (triglyceride: TG >1.7 mmol/mL or total cholesterin: T-CHO >5.2 mmol/mL), and diabetes mellitus (P < 0.01), and more NAFLD patients had elevated laboratory parameters of LSM value (P < 0.05, Table 1). Although 70 NAFLD patients were divided into BMI and FibroScan subgroups, there was inevitably some overlap between the two subgroups, and the data analysis was based on the two subgroups.
Subject characteristics.

ANOVA: analysis of variance; NAFLD: nonalcoholic fatty liver disease; HCs: healthy controls; LSM: liver stiffness measurement; TG: triglyceride; T-CHO: total cholesterin; BMI: body mass index; GPT: glutamic pyruvate transaminase; GOT: glutamic oxaloacetic transaminase; SD: standard deviation.
In this study, NAFLD patients had a significantly higher BMI and LSM value compared with HCs, but there was no statistical difference compared with HCs in age. More NAFLD patients had metabolic syndrome, with hypertension, hyperlipidemia, and diabetes mellitus, compared with HCs, and more NAFLD patients had elevated laboratory parameters of liver LSM value (one-way ANOVA analysis).
Plasma levels of cytokines
Plasma levels of IL-22 were 2.2-fold higher in FibroScan subgroup patients (249.66 ± 31.0 pg/mL) than in HCs (113.51 ± 21.54 pg/mL; R2 = 0.999, P < 0.01); plasma levels of IL-22 were 2.3-fold higher in BMI subgroup patients (263.69 ± 29.74 pg/mL) than in HCs (P < 0.01). Levels of IL-17A were 5.6-fold higher in FibroScan subgroup patients (1299.78 ± 199.15 pg/mL) than in HCs (231.92 ± 71.62 pg/mL; R2 = 0.997, P < 0.01), 5.8-fold higher in BMI subgroup (1361.66 ± 221.47 pg/mL) than in HCs (P < 0.01). However, the levels of IL-22 and IL-17A had no statistical difference between BMI and FibroScan subgroups (P > 0.05).
Distinct subsets of Th cells produce IL-17A and IL-22
T cell has been described, including IL-17A-producing cells (Th17 cells). Th17 cells are inflammatory CD4+ T cells that produce IL-17A but not interferon gamma (IFN-γ). Th22 subset is a more recently identified CD4+ T-helper subset, which is characterized by secretion of IL-22 but not IL-17 or IFN-γ. The effector cytokine of Th22 cells is IL-22. Therefore, we concomitantly stained for two cytokines and found that most cytokine-producing cells fell within the CD3+ CD4+ T cells gate (Figure 1(a)–(c)). Isotype control staining results were used to set the gating and thereby determine percentages of Th subpopulations, which were further subdivided into HCs, BMI, and FibroScan patients (Figure 1(d)–(f)).
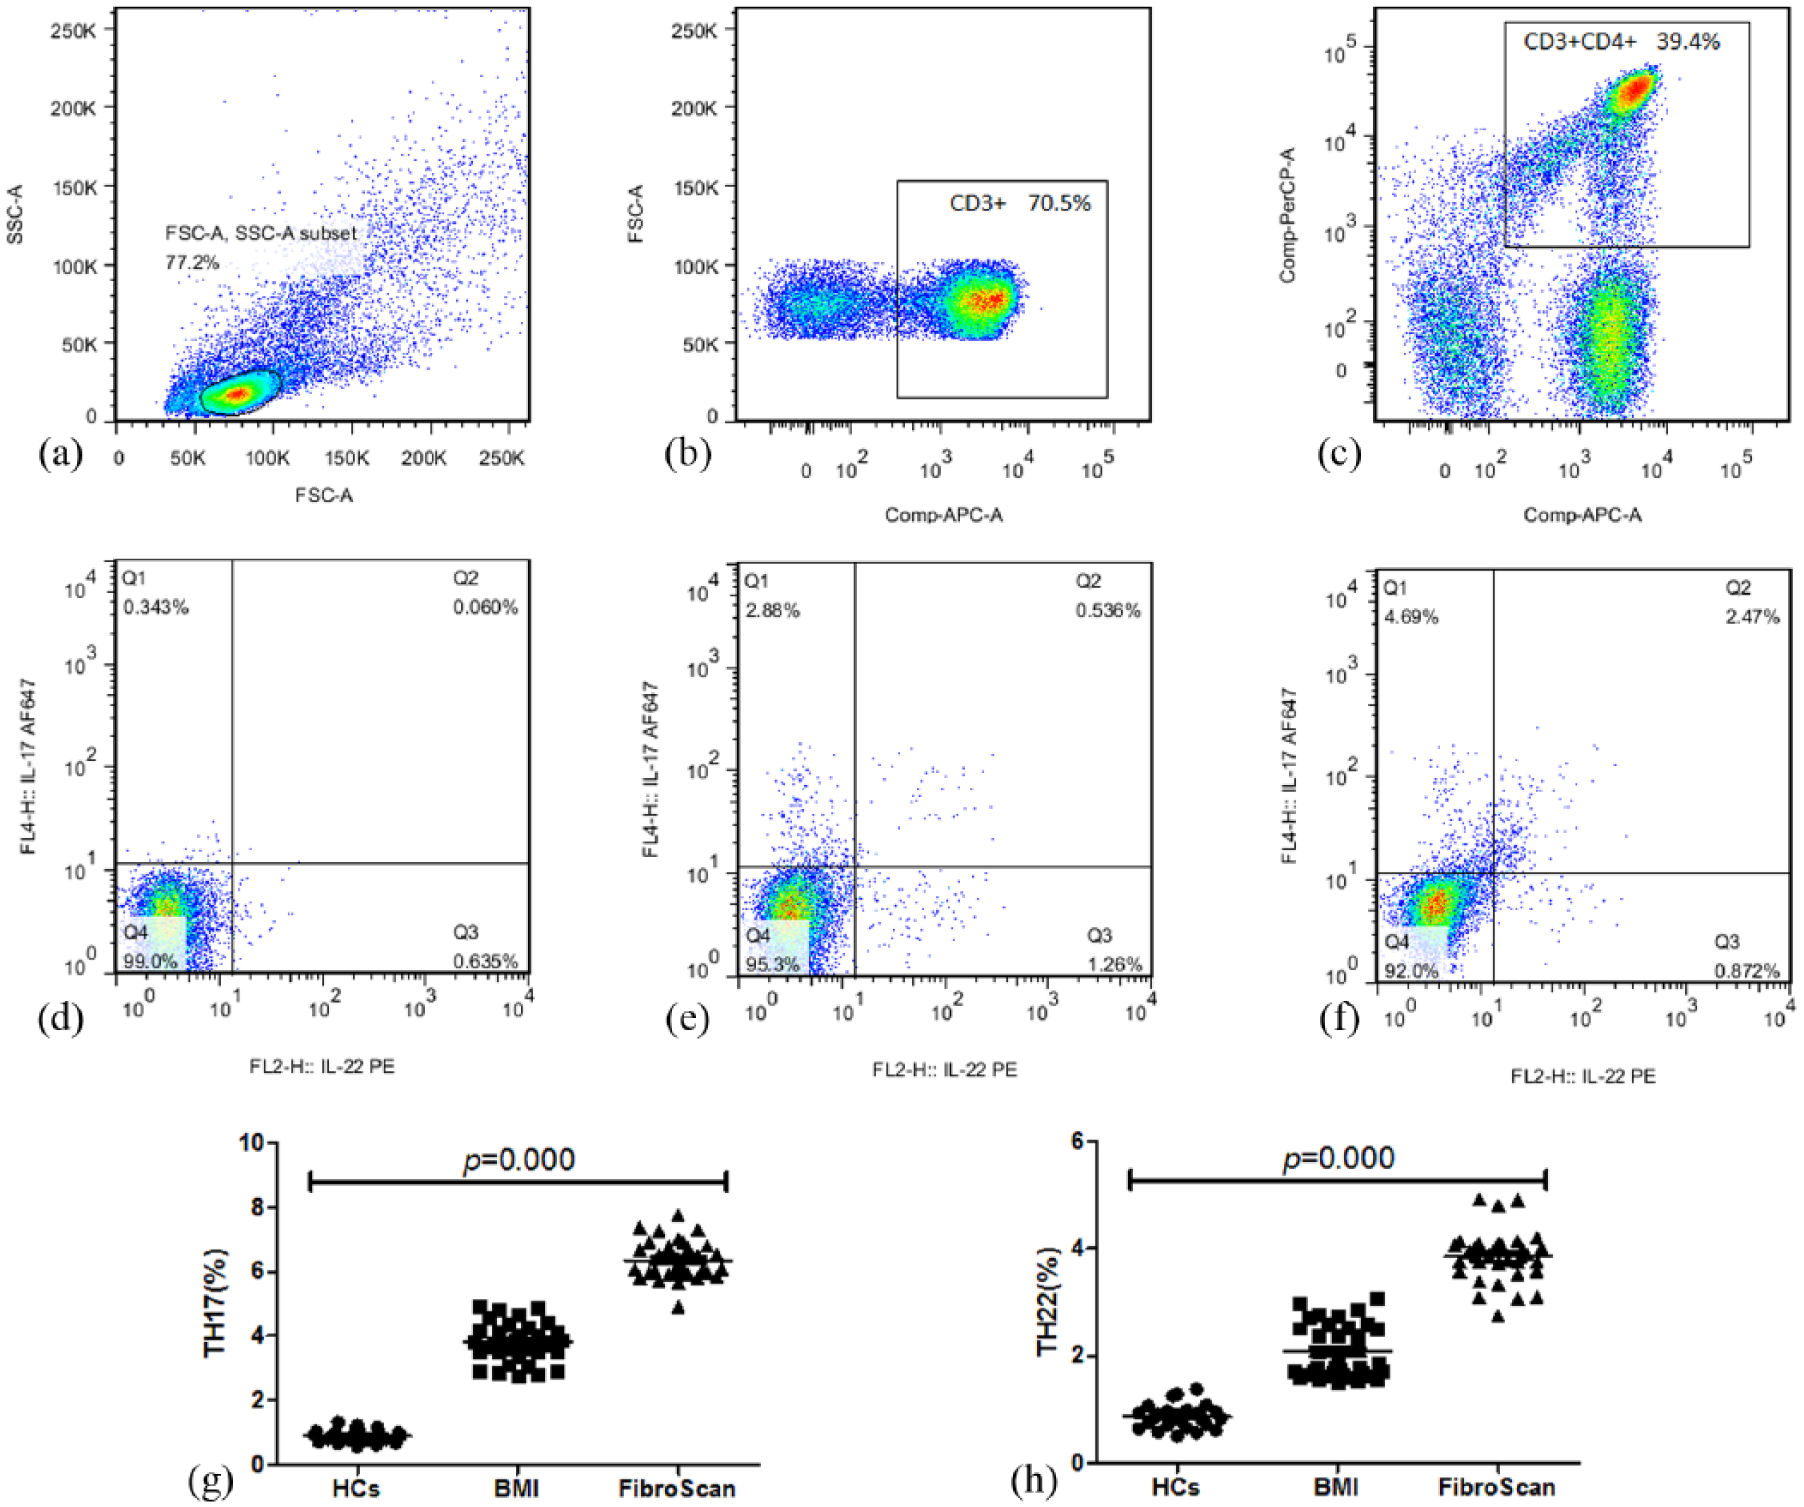
Flow cytometric analysis of cytokine production by CD3+ CD4+ T cells. Peripheral blood mononuclear cells were stimulated for 4 h with phorbol 12-myristate 13-acetate, ionomycin, and brefeldin A and then stained for intracellular IL-22 and IL-17A. (a) Isotype control staining results were used to set the gating. Most cytokine-producing cells fell within the CD3+ CD4+ T cells gate (b, c) and thereby determine percentages of Th subpopulations in healthy controls (d), BMI (e), and FibroScan subgroup patients (f). Percentages of Th17 cells
Elevated percentages of Th17 and Th22 cells in NAFLD patients
The median proportions of Th22 cells in our samples were higher in FibroScan group patients than in BMI and HCs (3.85% vs 2.07% vs 0.86%, respectively; P < 0.001, Figure 1(g)); Th17 cells were significantly higher in FibroScan group patients than in BMI and HCs group patients (6.36% vs 3.8% vs 0.9%, respectively; P < 0.001, Figure 1(h)), and the percentages of both Th cells in BMI group patients were also significantly higher than those in the HCs (P < 0.001).
Correlation between upregulation of cytokines and LSM
In principle, IL-22 and IL-17A antagonize each other’s function. IL-22 may help protect the liver and regenerate damaged liver tissue. IL-17A, in contrast, promotes inflammatory response and tumor growth by stimulating angiogenesis and recruiting neutrophils. Since our experiments indicated that both cytokines were upregulated in the FibroScan subgroup patients, we wanted to know whether the levels of both signaling molecules were correlated. Indeed, at the level of cytokine-producing cells, the percentages of Th17 cells significantly and highly correlated with levels of Th22 cells (r = 0.801, P = 0.000) and were moderately correlated with the plasma level of IL-17A and IL-22 cytokines (r = 0.604, P = 0.000).
As we defined the NAFLD patients with an LSM value generally >10.3 kPa implied cirrhosis, we found that the LSM value was highly correlated with the proportions of Th17 cells (r = 0.763, P = 0.000) and Th22 cells (r = 0.731, P = 0.000) and moderately correlated with the plasma level of IL-17A (r = 0.618, P = 0.000), IL-22 (r = 0.6, P = 0.000), and the BMI value (r = 0.454, P = 0.000). However, the LSM value did not correlate with triglyceride (r = 0.022, P = 0.828), cholesterin (r = 0.178, P = 0.083), and age (r = 0.007, P = 0.948). These results suggest that the degree of liver cirrhosis significantly correlated with Th cells which produce cytokines.
Discussion
The NAFLD prevalence is higher in individuals with characteristics of metabolic syndrome including obesity, diabetes, hypertension, and an increased waist circumference. These risk factors (or combination of risk factors) are good indicators of NAFLD that evolve to NASH or fibrosis. In this study, we found that more than half of the NAFLD patients had high BMI value and nearly half of the NAFLD patients had high LSM value. Therefore, these patients were divided into subgroups (BMI and FibroScan subgroups) of NAFLD. The average age of NAFLD patients was 44.88 years, which is similar to that in the NICE guideline (2016 London). Our results with NAFLD patients showed significantly higher expression of IL-22 and IL-17A than in HCs, especially with the BMI and FibroScan subgroups patients, this suggests that these two cytokines may contribute to the development from NAFL to NASH or fibrosis.
The inflammatory process and underlying immunological mechanisms in NASH are not well understood. Cells expressing several T-cell markers were recently identified by immunostaining in NAFLD liver biopsy sections. 12 In this study, higher frequencies of Th17 cells and expression of IL-17A could be detected in peripheral blood of BMI and FibroScan subgroup patients in comparison with HCs. Patients with high LSM values were differentiated from high BMI patients by a significantly higher frequency of Th17 cells among CD4+ T cells and remarkably elevated expression of IL-17A. These results led us to conclude that patients with NAFLD already show key pathological changes in their CD4+ T cell in peripheral blood. If those FibroScan subgroup patients were considered as NASH or fibrosis patients, our results also indicated that more pronounced accumulation of Th17 cells in liver implied the progression from NAFL to NASH or fibrosis. 4
Little data exist about the role of Th22 cells in NAFLD. Our study provided the first evidence in human that the high frequency of Th22 cells and elevated expression of IL-22 were detected in peripheral blood of NAFLD patients with high LSM value. There is a balance between IL-17 and IL-22 produced by liver-infiltrating T-helper cells, which critically controls NASH development. 9 Besides, the LSM value highly correlated with the proportions of Th17 cells and Th22 cells and moderately correlated with the plasma level of IL-17A, IL-22, and the BMI value. These may support some suggestions concerning both of them in the progression of NAFL to NASH or fibrosis.
In conclusion, our study demonstrated the increased frequencies of Th22 and Th17 cells and plasma cytokines in the peripheral blood of NAFLD patients. IL-17A and IL-22 may play an inflammatory and immune response role in progression from NAFL to NASH or fibrosis.
Footnotes
Authors’ Note
S.-B.S. and W.C. contributed equally to this work and are co-first authors.
Declaration of conflicting interests
The author(s) declared no potential conflicts of interest with respect to the research, authorship, and/or publication of this article.
Ethical approval
This study protocol was approved by the Medical Ethics Committee of First Affiliated Hospital of Guangxi Medical University (2016(KY-E-050)), and all participants provided oral informed consent before enrollment.
Funding
The author(s) disclosed receipt of the following financial support for the research, authorship, and/or publication of this article: This work was supported in part by grants from the National Natural Science Foundation of China (81360290) and from the Guangxi Emergency and Medical Rescue Small Projects Fund (GXJZ201407).