
Abstract
Background
Signal-to-noise ratio (SNR) is a key metric for evaluating MRI image quality, but conventional measurement methods are time-consuming and operator-dependent. Deep learning offers potential for automating this process.
Purpose
To develop and validate a deep learning-based method for automatic SNR measurement from single MRI images.
Material and methods
A Pix2Pix framework with a U-Net++ generator and GAN-based discriminator was trained using axial brain MRI images (T1WI, T2WI, and FLAIR) from a 3T scanner. The model generated signal and noise maps from a single image, and SNR maps were computed by pixel-wise division. Whole-brain, white matter (WM), and cerebrospinal fluid (CSF) regions were automatically segmented for regional SNR measurement. The subtraction-map method served as the reference. Structural similarity index (SSIM), correlation coefficients, and Bland–Altman analyses were used to evaluate agreement.
Results
Across all sequences, the mean SSIM was 0.95 ± 0.02. SNR values showed strong correlations with the reference method (r > 0.86) and low relative errors (<7%) for whole-brain, WM, and CSF. Bland–Altman analysis demonstrated a small paired bias and narrow 95% limits of agreement across sequences.
Conclusion
The proposed deep learning method enables automatic, accurate, and observer-independent SNR quantification from single MR images, supporting clinical and research image quality evaluation.
Introduction
Magnetic resonance imaging (MRI) enables not only morphological assessment but also quantitative evaluation. However, its long acquisition time remains a limitation. To address this, acceleration techniques like parallel imaging,1–3 compressed sensing,4–6 and more recently, deep learning-based reconstruction methods7–9 have been developed to enhance both scan efficiency and image quality.
Clinical implementation of these techniques requires rigorous image quality assessment. The key metrics include signal-to-noise ratio (SNR), contrast-to-noise ratio (CNR), and spatial resolution. Among these, SNR is particularly important due to its direct link with acquisition time,10,11 and it is widely used to evaluate and optimize imaging protocols.12,13
Traditionally, SNR is estimated by placing region of interest (ROI) in both the target structure and the background (air), and calculating the ratio based on these values.11,14–16 However, in parallel imaging, spatially varying noise undermines the accuracy of background-based methods.17–19 The subtraction method 20 and its extension, the subtraction-map method,21,22 have been proposed to address this issue, as they provide accurate SNR estimation under parallel imaging conditions.17,23,24 These methods, however, require two identically acquired images, limiting their routine clinical use.
Other techniques, including phantom-based measurements 25 and specialized acquisition protocols, 26 offer high accuracy but have limited clinical applicability. Recently, simplified ROI-based methods have been introduced, where SNR is calculated using the mean and standard deviation (SD) within a manually defined ROI.27–30 This approach is easy to implement with tools but suffers from operator dependency, potential ROI misplacement, and misinterpretation of inherent signal variation as noise.24,29
To address these limitations, we propose a deep learning-based method that enables pixel-wise SNR estimation from a single clinical image. Unlike conventional techniques requiring ROI placement, repeated scans, or phantom imaging, the proposed method automatically generates SNR maps using a conditional generative adversarial network. By estimating signal and noise maps simultaneously, it enables automated and objective SNR quantification. We validate its accuracy against the subtraction-map method21,22 and demonstrate its clinical utility.
Materials and methods
We designed the following methods to evaluate the feasibility and accuracy of our deep learning-based approach for generating SNR maps from single MRI images. SNR values derived from the proposed method were quantitatively compared with those from the subtraction-map method as the reference standard. The study focused on brain MRI, using an automated workflow to extract SNR values from anatomically defined regions.
SNR map generation using the proposed method
Figure 1 provides an overview of the proposed method for generating SNR maps from a single clinical image. Signal and noise maps are estimated using deep learning, and an SNR map is computed pixel-wise by dividing the signal map by the noise map. Overview of the proposed method for automatic SNR map generation. This figure illustrates the deep learning-based workflow for generating signal, noise, and SNR maps from a single MRI image. (a) The input image is processed by a Pix2Pix model to estimate a mean-signal image, followed by local averaging to produce the final signal map. (b) A subtraction image is generated by subtracting a one-pixel-shifted image from the original. Edge components are suppressed using both global and local thresholding, and a pseudo-noise map is generated via local standard deviation filtering. The final noise map is then estimated using a Pix2Pix model. (c) The SNR map is computed by pixel-wise division of the signal map by the noise map.
As shown in Figure 1(a), the input image is fed into a conditional generative adversarial network (Pix2Pix)
31
to predict a mean-signal image, which is then smoothed using a 7 × 7 local averaging filter to yield the final signal map. This filtering reduces the noise SD by approximately
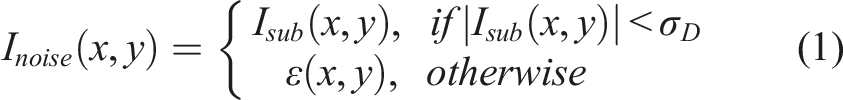
As illustrated in Figure 1(b), for noise map generation, we first construct a noise image from the input image
As shown in Figure 1(c), the SNR map is obtained by dividing the signal map by the predicted noise map on a pixel-wise basis. In the proposed method, the 7 × 7 local averaging filter is applied only to the signal map to suppress random local fluctuations. The noise map is obtained from the local SD within a 7 × 7 neighborhood of the noise image, without any averaging filter applied to the noise itself. Therefore, the denominator in the SNR calculation does not undergo variance reduction due to smoothing, and the measured SNR is not inflated by the filtering step.
Architecture and training of the Pix2Pix-based network
We used the Pix2Pix framework to estimate the mean-signal image and noise map from a single input image. Pix2Pix is a conditional generative adversarial network composed of a generator and discriminator trained on paired data to learn image-to-image translation. The generator was based on the U-Net++ architecture, which incorporates nested skip connections for improved feature representation and pixel-wise accuracy compared to conventional U-Net. 32 The discriminator employed the PatchGAN structure provided in the MONAI library (version 1.3.0).
The model was implemented in PyTorch (v2.2.0) and trained in a Python 3.11 environment using an NVIDIA GeForce RTX 4090 GPU. All input images were resized to 256 × 256 pixels and normalized to a 0–1 range.
For the mean-signal model, target images were generated by averaging two identical-condition acquisitions, as done in the subtraction-map method. The noise model was trained using subtraction-map–derived noise maps as targets. Details of this method are described in the following section.
SNR map generation using the subtraction-map method
As a reference method, we used the subtraction-map method, 21 validated for SNR measurement in parallel imaging. It requires two images acquired under identical conditions and generates pixel-wise signal and noise maps for SNR calculation.
The signal map is obtained by averaging the two input images and, as in the proposed method, applying a 7 × 7 local average filter, as recommended in prior studies, 21 to reduce statistical variation.
The noise map is derived from the pixel-wise subtraction of the two images. The local SD within a 7 × 7 window is computed for each pixel and divided by
As the method is sensitive to misalignment, we computed the structural similarity index (SSIM) 33 between the two images and excluded data with SSIM <0.9 to ensure spatial consistency. SSIM quantifies perceptual similarity between two images by comparing local luminance, contrast, and structure; values range from 0 to 1, with higher values indicating greater similarity.
Automatic SNR measurement from SNR map
We implemented an automated workflow to measure SNR from brain MRI by segmenting the whole-brain, white matter (WM), and cerebrospinal fluid (CSF). The whole-brain region was extracted using Otsu’s thresholding method,34,35 which identifies a global intensity threshold to distinguish brain tissue from the background. WM and CSF regions were segmented using K-means clustering36,37 based on pixel intensities, allowing for unsupervised classification into tissue types. As shown in Figure 2, these masks were applied to the SNR maps to extract mean SNR values for each region. This automated approach eliminates manual ROI placement and ensures consistent regional SNR quantification across all images. Automatic segmentation for region-specific SNR measurement. Segmentation masks were automatically generated from the input image to extract specific brain regions. The whole-brain mask was obtained using Otsu’s thresholding method based on the histogram of the input image. White matter (WM) and cerebrospinal fluid (CSF) masks were generated using K-means clustering, enabling automated region-specific SNR measurements.
MRI acquisition
Scanning parameters.
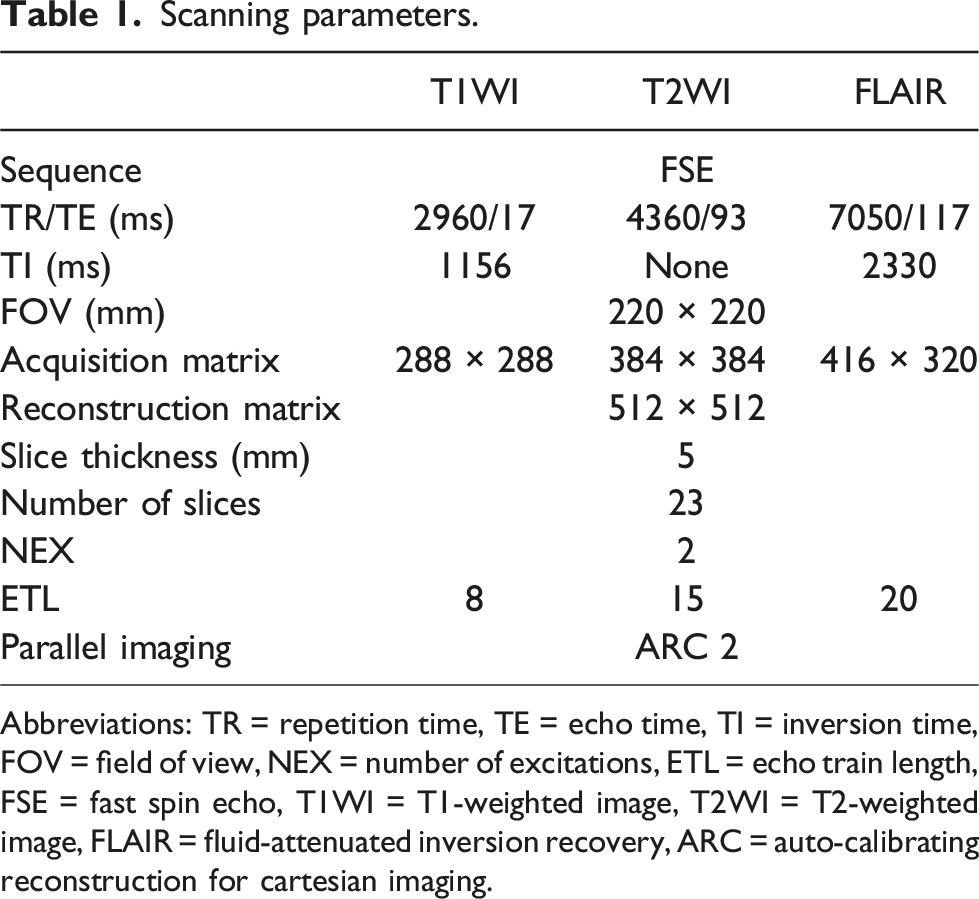
Abbreviations: TR = repetition time, TE = echo time, TI = inversion time, FOV = field of view, NEX = number of excitations, ETL = echo train length, FSE = fast spin echo, T1WI = T1-weighted image, T2WI = T2-weighted image, FLAIR = fluid-attenuated inversion recovery, ARC = auto-calibrating reconstruction for cartesian imaging.
Of the eligible scans, 152 cases (10,488 images; 3 sequences × 23 slices) were used for model training. An additional 98 cases were used for evaluation. Image pairs with motion artifacts were excluded using an SSIM threshold of 0.9. As a result, 97 T1WI, 72 T2WI, and 83 FLAIR datasets were included in the analysis. To ensure representative brain coverage, six axial slices from the upper edge of the tentorium cerebelli to the upper edge of the lateral ventricles were analyzed.
Statistical analysis
Continuous variables are summarized as mean ± SD unless otherwise stated. Structural similarity between the SNR maps from the subtraction-map and proposed methods was assessed using SSIM. SNR values were compared across sequences (T1WI, T2WI, FLAIR) and regions (WM, CSF). The relative errors (%) were calculated for each case as

Pairwise comparisons used the two-sided Wilcoxon signed-rank test (α = 0.05), that is, we tested whether the median of
Agreement between methods was evaluated using Bland–Altman analysis. We report the mean paired difference (bias,
All analyses were conducted using JMP Pro 17 (SAS Institute Inc., Cary, NC, USA).
Results
Whole-brain SNR comparison between the proposed and subtraction-map methods, pooled and by sequence, with relative error and correlation coefficients.

SNR values and relative error are presented as mean±standard deviation. P values are from two-sided wilcoxon signed-rank tests. Abbreviations: r = Spearman’s correlation coefficient, T1WI = T1-weighted image, T2WI = T2-weighted image, FLAIR = fluid-attenuated inversion recovery.

Correlation of SNR values between the proposed method and the subtraction-map method. Scatter plot comparing SNR values obtained using the proposed method (
Region-specific SNR comparison (WM/CSF) between the proposed and subtraction-map methods across sequences, with relative error and correlation coefficients.

SNR values and error rate are presented as mean±standard deviation. P values are from two-sided Wilcoxon signed-rank tests. Abbreviations: r = Spearman’s correlation coefficient, T1WI = T1-weighted image, T2WI = T2-weighted image, FLAIR = fluid-attenuated inversion recovery, WM = white matter, CSF = cerebrospinal fluid.
Figure 4 shows Bland–Altman plots for the whole-brain, WM, and CSF. No systematic trend or significant bias was found across sequences or regions. For the whole-brain, the mean paired bias was 0.37 ± 0.79 for T1WI (95% LoA −1.18 to 1.91), 0.70 ± 1.68 for T2WI (−2.60 to 4.00), and 0.12 ± 0.39 for FLAIR (−0.64 to 0.88). Detailed WM/CSF values are provided in Figure 4, likewise indicating small biases with narrow LoA across sequences. Bland–Altman plots comparing SNR values measured by the proposed method and subtraction-map method. Bland–Altman plots comparing SNR estimates from the proposed method with the subtraction-map for the whole-brain, white matter (WM), and cerebrospinal fluid (CSF) across T1WI, T2WI, and FLAIR. Differences are defined as (
Figure 5 shows representative SNR maps generated by the subtraction-map and proposed methods, both demonstrating similar SNR distributions. In contrast, Figure 6 presents a T2WI case with a high relative error (19.2%), where a clear discrepancy was observed. The proposed method yielded an SNR map more consistent with the input image, whereas the subtraction-map method was affected by image misalignment. This misalignment caused residual signal components, particularly along the cerebral sulci and falx cerebri, to be retained in the subtraction image, leading to overestimation in the noise map. The proposed method showed no such artifacts. SNR maps generated using the subtraction-map method (SNR-Mapsub) and the proposed method (SNR-Mappro). The examples shown are from T1WI, T2WI, and FLAIR sequences. In each row, the left column shows the original input MR images, the center column displays SNR maps created using the subtraction-map method, and the right column presents the SNR maps generated by the proposed method. Both methods produced visually similar SNR distributions across sequences, confirming the capability of the proposed method to accurately estimate SNR. Example case demonstrating a high relative error in T2WI. The upper row shows the input image (left), SNR map of the subtraction-map method (center), and SNR map of the proposed method (right). The lower row presents the subtraction image (left), noise map of the subtraction-map method (center), and noise map of the proposed method (right). Because of misalignment between paired images, the subtraction-map method underestimated SNR, especially in cerebral sulci and falx cerebri regions. The proposed method, using a single input image, avoids this issue and accurately reflects the anatomical signal distribution.

Discussion
In this study, we proposed a deep learning-based method for generating SNR maps from a single clinical image and validated it against the subtraction-map method. Results showed: SSIM >0.92 across all sequences; strong correlation (r > 0.86) and relative errors <7% for whole-brain, WM, and CSF; and Bland–Altman analysis demonstrated a small paired bias and narrow 95% LoA across sequences, supporting practical interchangeability with the subtraction-map method.
SSIM values exceeding 0.92 across all sequences confirm that the SNR maps from the proposed method closely resemble those from the subtraction-map method, indicating comparable structural fidelity. Although the between-method comparisons were statistically significant (Table 2; p < .01), this may reflect the large sample size rather than clinically meaningful differences. By contrast, in the Bland–Altman analysis, whole-brain results for each sequence showed small mean paired biases (T1WI: 0.37; T2WI: 0.70; FLAIR: 0.12) with narrow 95% LoA (Figure 4) and no evident proportional bias. The LoA for CSF on T2WI were somewhat wider, consistent with the broader SNR distribution in this tissue/sequence; nevertheless, overall agreement remained high. Taken together, these findings support the proposed method as a practical alternative to the subtraction-map method.
The strong correlation (r > 0.86) in SNR measurements across the whole-brain, WM, and CSF support the practical accuracy of the proposed method. In most cases, the relative error was within 5%. However, for CSF in T2WI, although the mean relative error was 3.9%, the maximum reached ∼20%, indicating higher variability and SNR overestimation. This was likely due to the subtraction-map method’s sensitivity to misalignment, rather than a flaw in the proposed method. As shown in Figure 6, minor misalignment caused residual signals in the subtraction image, leading to noise overestimation and SNR underestimation—particularly in CSF on T2WI. The narrow, high-intensity anatomy of CSF in the sulci makes it especially prone to this effect. To reduce misalignment bias, we applied an SSIM threshold of 0.9. While a stricter threshold could improve accuracy, it would reduce the sample size and statistical power; thus, 0.9 was chosen as a balanced compromise. In CSF on FLAIR, the relative error was ∼6%, likely due to the inherently low SNR in this region—small absolute paired differences in SNR translate to larger percentage errors. However, the actual SNR values (7.5 ± 1.8 for the proposed method vs 8.0 ± 1.6 for the subtraction-map method) indicate a minimal paired bias and are unlikely to be clinically relevant.
Traditional subtraction-map methods require paired acquisitions with precise alignment, limiting their clinical utility. Conventional ROI-based SNR measurements are also labor-intensive and operator-dependent. In contrast, the proposed method estimates SNR from a single image and includes automated segmentation of brain, WM, and CSF, reducing operator bias and enabling consistent measurements.
Several limitations should be noted. First, the proposed U-Net++ generator model was selected for its enhanced skip connections, which improve pixel-wise reconstruction for tasks such as signal and noise map estimation, achieving accuracy comparable to the subtraction-map method. 32 However, its increased parameter count may lead to overfitting when trained on limited data, highlighting the need for larger and more diverse training datasets. Second, the model was trained only on axial brain images (T1WI, T2WI, FLAIR), and its applicability to other anatomical regions (e.g., abdomen, pelvis) or orientations (e.g., coronal, sagittal) remains unclear. Third, we analyzed only whole-brain, WM, and CSF regions. Although gray matter (GM) can theoretically be approximated as whole-brain minus WM and CSF, our current segmentation pipeline cannot ensure GM purity due to boundary partial-volume effects and small misregistrations. To reduce cross-contamination, we applied morphological erosion to WM and CSF masks; however, the set-difference approach still inherits residual errors, so GM was not analyzed. Future work should incorporate more accurate segmentation techniques38,39 to enable finer regional SNR evaluation, such as cortical assessments and WM–GM differentiation. Finally, as this was a single-center study using images from one scanner, the model’s generalizability to other institutions, MRI systems, and imaging protocols is unknown. External validation using multi-center datasets will be necessary to ensure robustness and facilitate broader clinical deployment.
In addition to SNR, CNR is a key metric for assessing diagnostic image quality, particularly for lesion detection and tissue differentiation. Although no standard method currently exists for automatic CNR mapping, our pipeline’s noise map could enable such functionality by defining a reference tissue signal. Developing a CNR-mapping module is an important direction for future research.
To promote broader use, we developed an ImageJ plugin that automatically generates an SNR map from a single image. Due to technical limitations, segmentation is not included. Interested users may contact the authors. This plugin offers convenient, objective SNR measurement for research and clinical analysis.
In conclusion, we proposed a deep learning-based method for automatic SNR measurement from a single MRI image. The generated SNR maps showed strong correlation (r > 0.86) and low relative errors (<7%) compared with the subtraction-map method, indicating that the proposed method provides reliable SNR estimation for the whole-brain, WM, and CSF. This approach enables objective, observer-independent SNR quantification and reduces manual workload. It may facilitate efficient evaluation of image quality and support the clinical adoption of new imaging techniques.
Footnotes
Declaration of conflicting interests
The authors declared no potential conflicts of interest with respect to the research, authorship, and/or publication of this article.
Funding
The authors disclosed receipt of the following financial support for the research, authorship, and/or publication of this article: This work was supported by the Japan Society for the Promotion of Science (JSPS) KAKENHI Grant Number 23K07142.
Ethical approval
This single-center retrospective study was approved by our institutional review board (Approval No. 2023-0163). Because of the retrospective design and use of de-identified data, the requirement for written informed consent was waived; instead, an IRB-approved opt-out process was implemented. Study information was publicly disclosed, and patients were given the opportunity to decline participation; examinations with opt-out requests were excluded. The study complied with the Declaration of Helsinki and institutional guidelines.