
Abstract
Background
The assessment of small metastatic liver tumours using dual-energy computed tomography (DECT) has not been fully established.
Purpose
To assess the effect of low-keV virtual monochromatic imaging (VMI) with non-contrast and contrast-enhanced DECT on the qualitative and quantitative image parameters of small liver metastases.
Material and methods
Two radiologists retrospectively evaluated 92 metastatic liver tumours (5–20 mm) in 32 patients. Non-contrast and contrast-enhanced VMI were reconstructed at seven energy levels (40–100 keV) with 10-keV intervals. Lesion boundary, lesion delineation, image noise, and overall image quality were evaluated using the visual analogue scale. A high subjective score indicates good overall image quality, clear nodal boundaries and delineation, and less noticeable image noise. Subjective scores were compared using the Kruskal–Wallis test. A quantitative analysis involving the signal-to-noise ratio (SNR) and contrast-to-noise ratio (CNR) was performed.
Results
The lesion boundary was highest at 40 keV and significantly improved during the non-contrast portal venous phase compared to that at higher keV (p < .005). The lesion delineation score was significantly higher at 40 keV and tended to decrease at higher keV. Image noise and overall image quality were rated low at low keV; however, those at 80, 90, and 100 keV were rated the highest (p < .005). The CNR and SNR were highest for non-contrast CT at 100 keV. During the portal venous phase, no significant differences were observed in CNR and SNR at each keV.
Conclusion
Low-keV imaging using non-contrast and contrast-enhanced DECT is useful for delineating small hepatic metastatic tumours.

Keywords
Introduction
Dual-energy computed tomography (DECT) is a technology that analyses two different X-ray energy irradiation data to enable diagnosis using virtual monochromatic imaging (VMI). VMI, which can be generated by calculating the weighted sum of the photoelectric absorption and Compton scattering coefficient, 1 is useful for enhancing the visualisation of liver tumours. Theoretically, lower-energy VMI provides better depictions of liver lesions compared to those of liver parenchyma in contrast-enhanced CT owing to the rapid increase in iodine attenuation as the single energy level approaches the iodine K-edge.2,3 However, some metastatic liver tumours have shown reduced contrast with the parenchyma during contrast-enhanced studies. Therefore, it is important to evaluate metastatic liver tumours using not only contrast-enhanced CT but also non-contrast-enhanced CT.4,5 However, no studies have evaluated metastatic liver tumours using both contrast-enhanced and non-contrast-enhanced CT. Non-contrast CT is often used for screening and follow-up studies; however, it would be clinically useful if the appropriate conditions for detecting metastatic liver tumours could be clarified.
In this study, we used virtual monochromatic images generated using DECT to qualitatively and quantitatively analyse metastatic liver tumours with both non-contrast and contrast-enhanced CT for determining optimal imaging conditions.
Materials and methods
Patients
The Ethics Committee of our institution approved this retrospective study, and the need for informed consent was waived. Patients with liver metastases of abdominal tumours who had undergone contrast-enhanced abdominal DECT and were followed up between April 2019 and December 2022 were identified by a radiologist with more than 8 years of experience using abdominal imaging. All the patients had metastatic liver tumours of pancreatic, colon, gastric, gallbladder, or bile duct cancer based on clinical findings alongside CT and/or magnetic resonance imaging (MRI) findings. A total of 41 patients diagnosed with liver metastases who underwent portal venous phase abdominal imaging were identified. This study defined hypo-enhancing metastases as lesions showing hypoattenuation compared to the adjacent hepatic parenchyma during the portal venous phase. Further, the following cases were excluded: (1) a history of local treatment for hepatic metastases; (2) those with an indwelling bile duct stent, severely dilated intrahepatic bile duct, or obstructed main portal vein; (3) those in which cholangitis was clinically ruled out; and (4) those for which image evaluation was challenging owing to the reduced contrast agent dose, poor image quality, or poor breath-holding. We excluded three cases with an implanted bile duct stent, two cases with severe intrahepatic bile duct dilatation, and four cases previously treated with chemotherapy. A total of 32 patients (21 men, 11 women; mean age, 73.5 years; and range, 52–90 years) were evaluated (Figure 1). Primary tumour disease included pancreatic (n = 20), colorectal (n = 5), gastric (n = 3), bile duct (n = 1), and gallbladder (n = 3) cancers. Study design flowchart with the inclusion and exclusion criteria.
CT imaging protocol
DECT was performed using a 64-section multidetector CT unit (Revolution HD GSI; GE Medical Systems Healthcare, Chicago, IL, USA). All the patients were subjected to a dual-energy analysis with the following scanning conditions: fast kV switching dual-energy scan with 80 kVp and 140 kVp; beam collimation of 80 mm; rotation speed of 0.5 s/rot; and helical pitch of 0.518. Non-ionic contrast materials (Omnipaque 300; Daiichi-Sankyo, Tokyo, Japan; or Iopamiron 300; Bayer Healthcare, Osaka, Japan) were used. The iodine concentration was individually adjusted to the patient’s body weight at a dose of 2.0 mL/kg (600 mgI/mg) for 30 s (with an upper limit of 5 mL/s) through an intravenous catheter inserted in the antecubital vein using an automated dual-syringe power injector (Dual Shot GX 7; NEMOTO, Tokyo, Japan).
The delay times for each phase after contrast agent injection were as follows: arterial phase, 40 s; portal venous phase, 70 s; and delayed phase, 180 s. Non-contrast and portal venous phase images were evaluated during this study because the highest numerical value could be obtained by dynamic CT imaging during the portal venous phase to visualise a hypo-vascular tumour.6,7 All the phase images were reconstructed with the standard kernel using the ASiR-V algorithm (GE Healthcare, Waukesha, WI, USA) at level of 30%. Images obtained using VMI with seven energy levels (40/50/60/70/80/90/100 keV) were reconstructed axially in 2.5-mm slices using a gemstone spectral imaging viewer (GE Healthcare).
Image analysis
Metastatic liver tumours in 32 patients were analysed by a radiologist with more than 20 years of experience using abdominal diagnostic imaging. The maximum axial diameter of the tumour was measured during the portal venous phase. Metastatic liver tumours ≥5 mm and ≤20 mm were selected, and a maximum of three small nodules per patient were identified. A total of 92 lesions (average diameter, 8.6 ± 3.3 mm; mean diameter, 7.5 mm; range, 5–20 mm) were evaluated.
Quantitative analysis
A quantitative image quality evaluation was performed by a radiologist with 8 years of experience with abdominal imaging and a radiological technologist with 20 years of experience with CT imaging. The average measurements (Hounsfield unit [HU]) were obtained by setting the circular regions of interest (ROI) within the liver metastases and near-normal liver parenchyma (100 mm2). Areas of focal heterogeneity and tumour necrosis were not included. Image noise was defined as the standard deviation (SD) of fat and calculated by measuring the ROI within the subcutaneous fat of the waist (200 mm2).8,9 All the measurements were performed twice to improve data reproducibility. According to previous studies, the signal-to-noise ratio (SNR) and contrast-to-noise ratio (CNR) calculations were performed as follows8,10:


Qualitative analysis
During the qualitative image evaluation, two radiologists with 12 years of experience with abdominal CT interpretation evaluated the CT images. The readers were blinded to the patients’ medical histories. They were shown a simple diagram and informed of the approximate location and size of the nodules. All seven images of the same nodule were displayed in 10 increments of 40–100 keV randomly arranged on a screen. The readers scored each nodule using the visual analogue scale (VAS). They were allowed to manually adjust the standard window settings. The VAS with reference points was used for subjective evaluation among readers. When responding to a VAS item, respondents specified their level of agreement with a statement by indicating a position along a continuous line between two endpoints. 11 Based on the VAS, the following quality criteria were assessed: lesion boundary (0 = poor lesion boundary to 10 = excellent lesion boundary); lesion delineation (0 = poor lesion delineation to 10 = excellent lesion delineation); overall image quality (0 = poor image quality to 10 = excellent image quality); and image noise (0 = noticeable image noise to 10 = no relevant perceivable image noise). To examine whether the subjective score of the border and delineation scores showed a significant difference depending on the size of the nodule, the subjects were divided into the following groups: large nodule group, 8–20 mm; small nodule group, 5–7 mm; and median nodule group, 7.5 mm. Then, the subjective evaluation scores of each group were compared; 40 keV was selected because it is the lowest energy available for post-processing workstation programmes. We chose 70 keV because it was closest to the overall image appearance that was obtained using the 120 kVp polychromatic technique.12,13 Contrast degradation was expected at higher energies, and the upper limit was set at 100 keV, which is clinically acceptable.
Statistical analysis
Statistical analyses were performed using EZR version 1.33 (Saitama Medical Center, Jichi Medical University, Saitama, Japan), which is based on R and R Commander. 14 The continuous variables are expressed as means ± SDs. The Kolmogorov–Smirnov test was performed for normally distributed variables. Subjective scores were compared using the Kruskal–Wallis test with Steel’s post-hoc test. 15 Agreement among the readers was evaluated using the intraclass correlation coefficient (ICC) in a two-way mixed model with 95% confidence intervals (CIs). ICC agreement was classified as follows: poor, <0.20; moderate, 0.21–0.40; good, 0.41–0.60; and excellent, ≥0.61. 16 The Mann–Whitney U test was used to compare the subjective scores of each keV for each nodule size by dividing them into groups based on whether they were larger or smaller than the median size of the entire nodule.
Results
Quantitative analysis
Comparison of mean attenuation, calculated signal-to-noise, and contrast-to-noise ratio of patients with liver metastases from abdominal tumours in non-contrast and contrast-enhanced virtual monoenergetic images ranging from 40 keV to 100 keV.

Abbreviations: *HU: Hounsfield unit; SNR: the signal-to-noise rate; CNR: the contrast-to-noise rate.

Computed tomography images of a 77-year-old female patient with liver metastasis from colorectal cancer. Non-contrast and contrast-enhanced 40-keV reconstruction images show the highest scores for lesion boundary and delineation. The highest score is observed at 100 keV and the lowest score is observed at 40 keV during the subjective evaluation of the overall image quality and noise.

Computed tomography images of a 66-year-old male patient with liver metastasis from pancreatic cancer. The non-contrast and contrast-enhanced 40-keV reconstruction images have the highest scores for lesion boundary and delineation, but they have the lowest overall image quality and noise scores. In contrast, at 100 keV, the overall image quality score is high.
Qualitative analysis
Qualitative average score evaluated in terms of lesion boundary, lesion delineation, overall image quality, and image noise by two radiologists.

Lesion boundary and delineation score for each image set according to the lesion size.
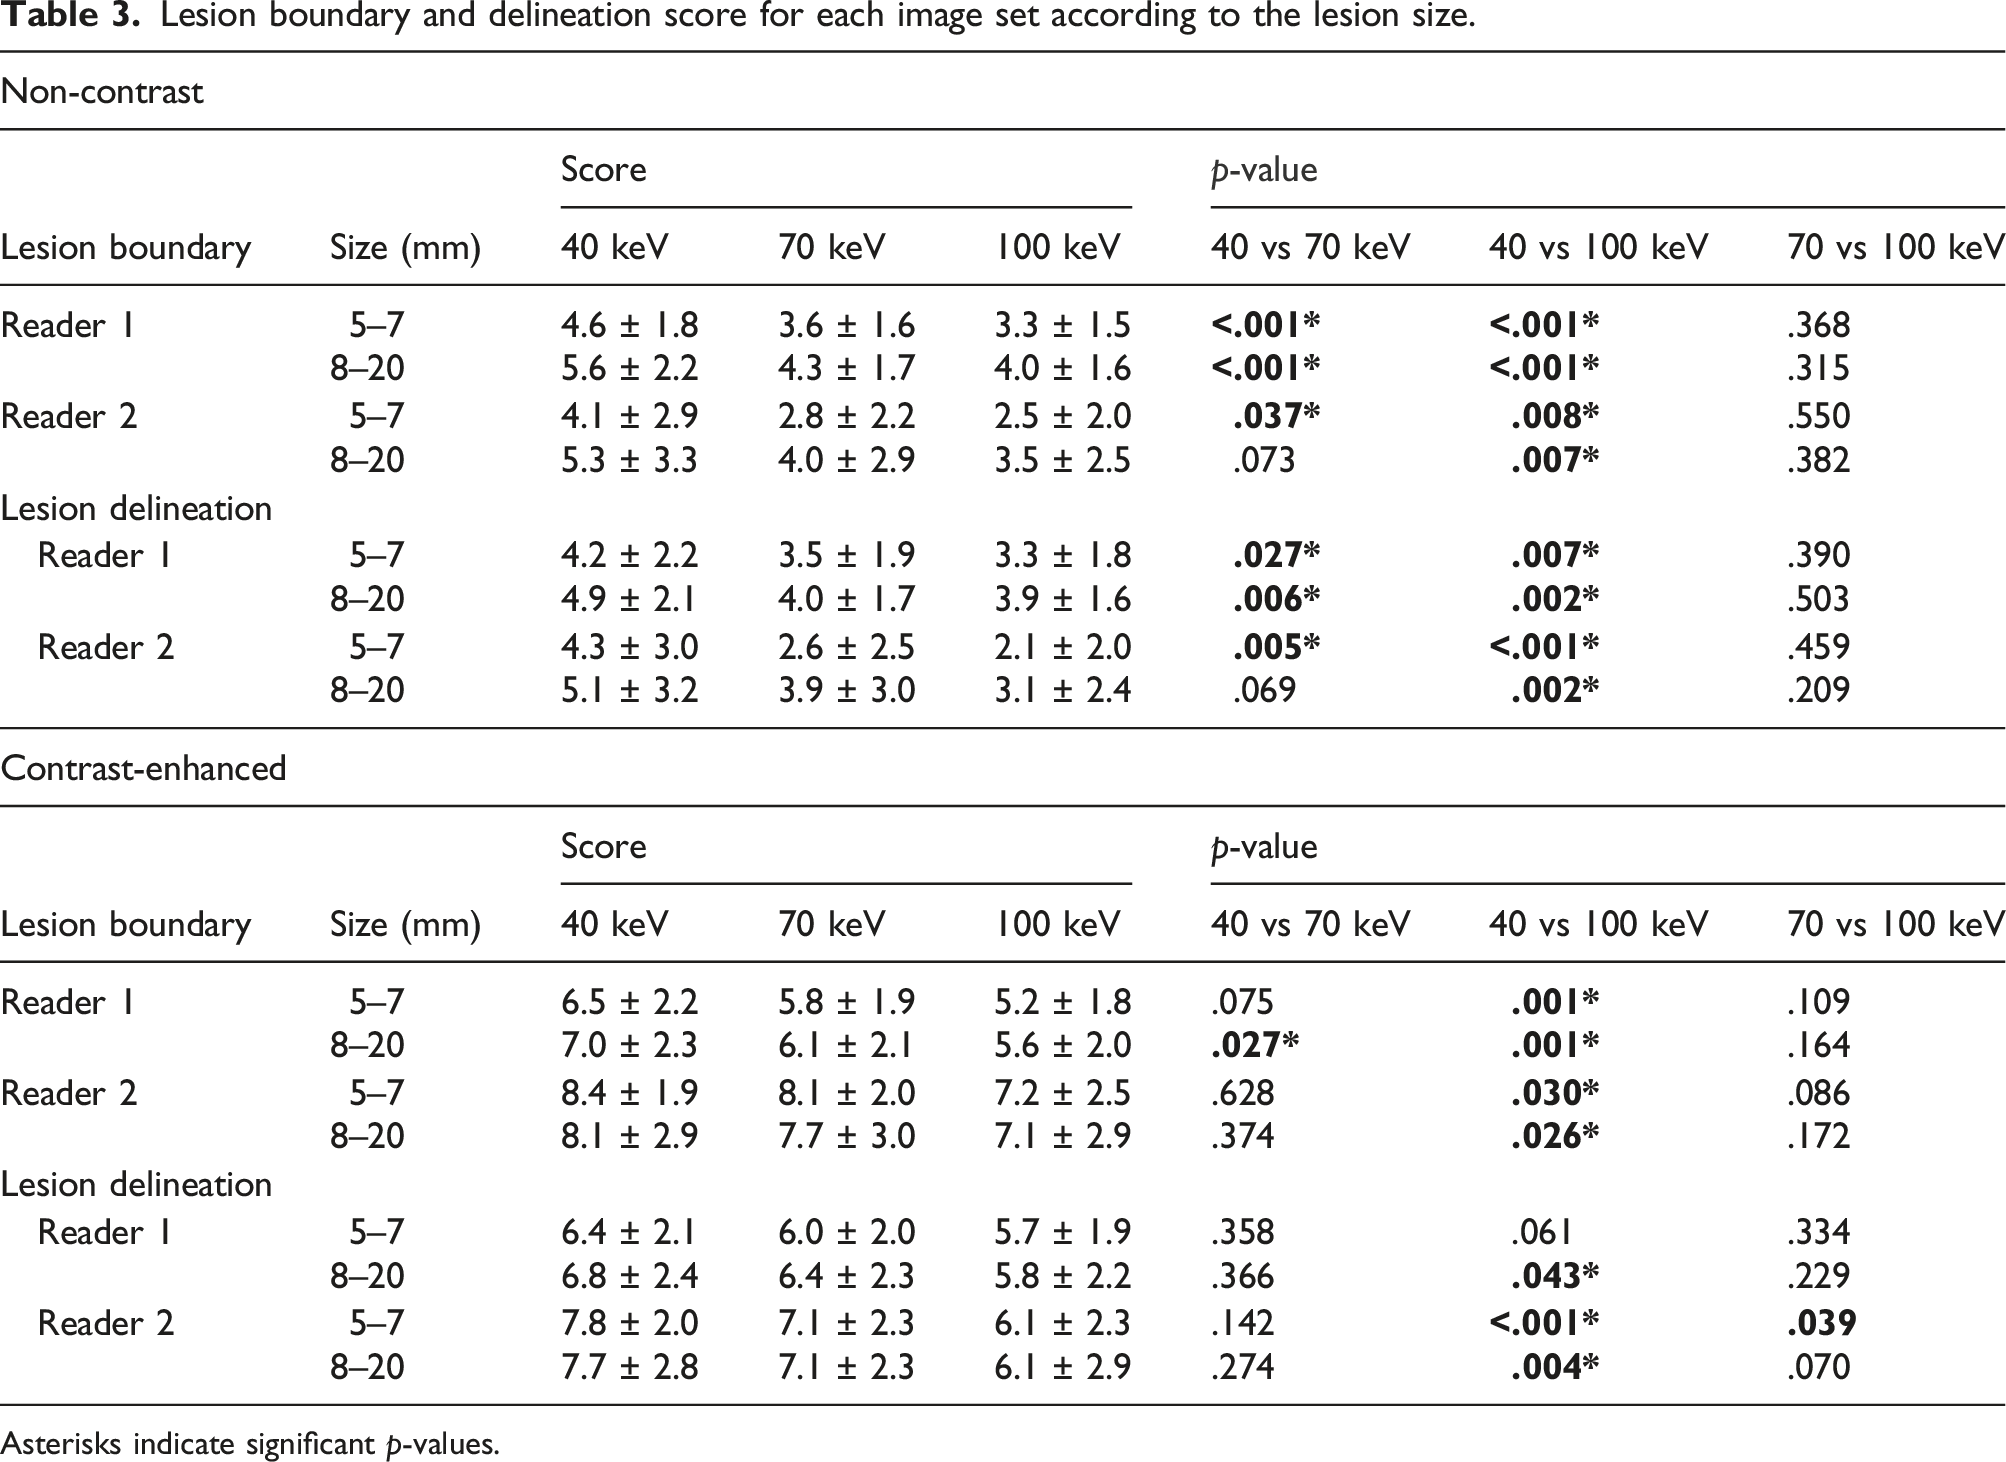
Asterisks indicate significant p-values.
Discussion
CT scans are typically used to evaluate metastatic liver tumours in their entirety. Nakai et al. analysed metastatic liver tumours that could not be detected by contrast-enhanced CT; they attributed this inability to the low contrast between metastatic liver tumours and liver parenchyma on contrast-enhanced CT and the presence of a fatty liver in the background. 17 Therefore, using contrast-enhanced CT alone for the evaluation of liver metastases may miss nodules, and it is important to use non-contrast CT in conjunction with contrast-enhanced CT.4,5 If non-contrast DECT is shown to be effective, it may improve the diagnostic performance for patients with renal dysfunction or allergies that make the use of contrast difficult, or for screening tests for metastatic liver tumours using non-contrast CT alone. During this study, comparison of the subjective evaluation of non-contrast DECT images showed that the lesion boundary and delineation scores at 40 keV were significantly higher than those at higher keV (70–100 keV). These results suggest a high efficacy of low-keV non-contrast DECT for the evaluation of liver tumours.
Contrary to the high rating for nodules evaluated on non-contrast images at 40 keV, the overall image quality and noise scores had poor ratings. During non-contrast DECT at low keV, the contrast of soft dense tissue is low, and the increase in image noise exceeds the contrast. 8 However, because the window level could be freely adjusted by the reader during this study, and because a high subjective score was obtained even at low keV, we consider that 40 keV is also good for liver tumour detection using non-contrast CT. 9
A significant difference was observed in the subjective scores of the readers for non-contrast DECT images, especially those of small (5–7 mm) nodules. These results are consistent with those of studies that found that the detection of smaller (6 mm) lesions may improve and become better than that of larger lesions with increase in the tumour–liver contrast. 18 Increasing the contrast between the tumour and liver by approximately 20–35 HU significantly increases the detection of small liver tumours with diameters of 6–14 mm. Under non-contrast CT conditions, the differences in the CT values of the liver and the nodule were greater at 40 keV (39.0 ± 15.5) than at 100 keV (15.6 ± 6.7) and provided more contrast, even under these conditions in our study.
Although non-contrast images at 40 keV had higher local subjective scores, the CNR and SNR were lower than those at higher keV because of increased noise. However, the CNR does not account for spatial resolution and noise spatial correlation; therefore, subjective scores may not be correlated with the CNR of the lesion. 19 Despite this discrepancy between the subjective and quantitative scores, the superiority of contrast over increased noise at 40 keV compared to higher keV may have contributed to the improved subjective scores of the nodal boundary and delineation.
Interestingly, non-contrast images at 40 keV showed significantly improved delineation and boundary scores compared to 70 keV. However, with contrast CT, there was no significant difference between 40 keV and 70 keV, and only 40 keV and 100 keV showed significant differences. This may be because the difference in keV was less influenced by the evaluation of the nodule during the contrast-enhanced study, when the contrast was originally clear. When detecting metastatic liver tumours under non-contrast conditions, 40 keV is considered more effective than 70 keV.
The contrast-enhanced 40 keV image reportedly showed improved contrast and delineation of the lesion compared to the other high-keV images, 15 and the highest subjective scores for the boundary and delineation. However, the overall image quality and noise tended to have poor scores. Other studies have also shown that although low-keV images improve contrast, they significantly increase noise, suggesting that they limit the diagnostic utility of VMI. 20 Regarding noise reduction, some studies have reported the use of wider window settings for low-energy VMI and obtained the highest subjective image noise and image quality scores at 40 keV during VMI. 9 This contribution of appropriate window-level settings to noise reduction indicates the possibility of a more convenient improvement in the effectiveness of low-keV energy.
Considering inter-reader agreement, the lesion boundaries and delineation were excellent (ICC, 0.77 to 0.54), image noise and overall image quality were poor (ICC, 0.38 to −0.1). A test reading attaining agreement is important for VAS evaluation. 11 In this study, few test readings and insufficient agreement were observed among readers, which may have resulted in the differences in the scores. However, the tendency of each reader’s evaluation was consistent, with good lesion boundaries and delineation at low keV, but poor noise and overall image quality.
This study had several limitations. First, an unavoidable selection bias may have existed due to the retrospective nature of this study. Second, the study sample was relatively small, which may have lowered the statistical power of the diagnostic performance comparisons. A larger sample size is required to confirm the results of the present study. Third, the lack of histological evidence made it impossible to compare the diagnostic accuracy. Although it was not possible to prove metastases based on accurate pathological findings, clinical information such as MRI results and size transitions suggested that the evidence of a metastatic tumour was sufficiently valid.
In conclusion, using low-keV imaging with non-contrast and contrast-enhanced DECT is useful for determining lesion boundaries and delineating small metastatic hepatic tumours.
Footnotes
Declaration of conflicting interests
The author(s) declared no potential conflicts of interest with respect to the research, authorship, and/or publication of this article.
Funding
This research received no specific grant from any funding agency in the public, commercial, or not-for-profit sectors.