
Abstract
Introduction
Advancements in image quality, relatively short scan times, and increased availability of computed tomography (CT) have led to increased utilization of the imaging modality globally. 1 However, CT examinations contribute more to a patient’s ionizing radiation exposure than other radiographic imaging modalities. 2 Pediatric patients are particularly vulnerable to the adverse effects of ionizing radiation exposure, such as the increased lifetime risk of cancer, due to their longer life expectancy and rapid cell replication and development.1–5 Ultimately, CT remains an essential diagnostic tool in pediatric medicine, highlighting the need to monitor examination doses and minimize radiation exposure in this population.
Diagnostic reference levels (DRLs) introduced by the International Commission on Radiation Protection (ICRP) in 1996 are an optimization tool to ensure that the use of ionizing radiation is As Low As Reasonably Achievable (ALARA principle) without sacrificing diagnostic image quality.2,6 The ICRP defines a DRL value as the 75th percentile of the distribution of median doses collected from several facilities. 2 Local DRLs (LDRLs) are defined by the European Commission as the 75th percentile of pooled dose distribution in a single large facility or 2–3 small facilities. 6 LDRLs can be compared to available national or international DRLs to optimize dose, achieving exam exposures that adhere to the ALARA principle while maintaining the image quality required for diagnostic interpretation. The European Commission strongly recommends updating NDRLs and LDRLs regularly at least every 3–5 years, and comparison of patient dose levels of a hospital or a group of hospitals should be carried out at the minimum frequency of once per year. 6
Whereas adult DRLs are based on the average adult’s expected radiation dose under a given imaging protocol, assigning DRLs to pediatric CT examinations poses the extra challenge of identifying the ‘average’ patient. Pediatric DRLs, therefore, require the subdivision of the population into smaller representative cohorts. 6 Pediatric DRLs have historically been grouped into age cohorts, the most common cohorts being <1, 1–5, 6–10, and 11–15 years. 2
The volume computed tomography dose index (CTDIvol) and dose length product (DLP) represent radiation dose metrics traditionally used to express DRLs in CT.2,6–11 Other variables, such as size-specific dose estimate (SSDE), can be incorporated into DRLs, especially when discussing their utilization in pediatric imaging.2,6 Whereas CTDIvol does not consider patient size, SSDEs seek to combine the actual size of the patient and the measured CTDIvol to produce a figure that more accurately describes the patient’s dose. 12 SSDE is recommended as a dose indicator for pediatric patients, but there are limitations to its use related to dose current modulation and variable patient thickness. 6
This collaborative study of three different institutions from Australia, Canada, and Norway aims to survey pediatric CT practices at local health facilities. These countries represent diverse healthcare systems and demographic profiles, which can offer valuable insights into the variability and optimization potential of radiation doses in pediatric CT imaging. Although our surveys do not represent nationwide data from each country, they allow us to determine local reference levels for included facilities. The academic relationship between institutions facilitated access to data, enabling a comprehensive multi-institutional analysis that might not have been feasible otherwise. By comparing practices sampled from these countries, we aim to identify commonalities and differences that can inform global standards and contribute to the ongoing efforts in radiation safety in pediatric imaging.
Materials and methods
Data collection
Characteristics of CT scanners included in the survey.
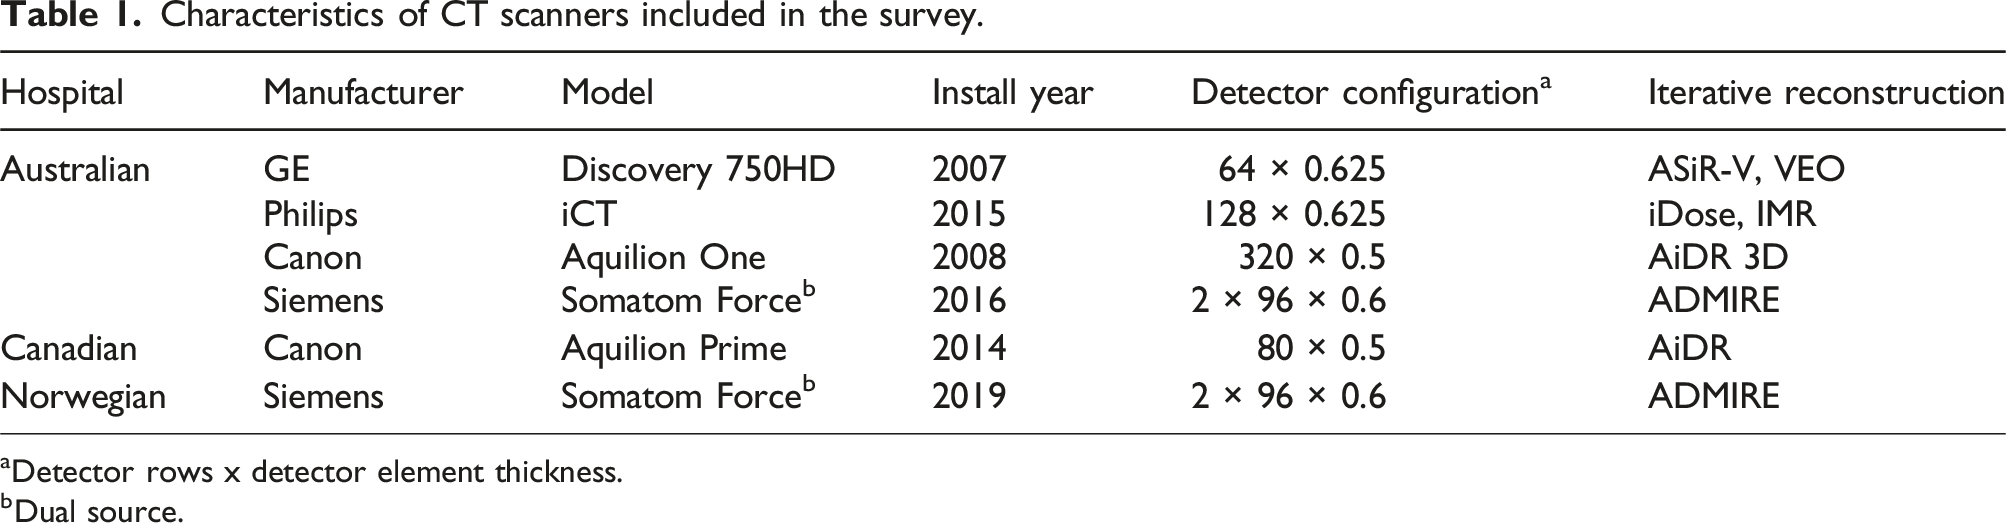
aDetector rows x detector element thickness.
bDual source.
Data analysis
Median values with interquartile ranges in the brackets for weight, age, AP thickness, and radiation dose metrics (CTDIvol, DLP, SSDE) for different patient age groups.

aN is the number of patients.
STATA/SE, Version 18.0 (StataCorp, College Station, TX, USA) was used to perform the Kruskal–Wallis test and post-hoc Dunn’s test 16 with Bonferroni adjustment, to assess the equality of populations for all measures of radiation exposure. STATA was also used to calculate the Pearson correlation coefficient (R) and corresponding p-value for SSDE and weight in chest and abdomen-pelvis CT scans.
Results
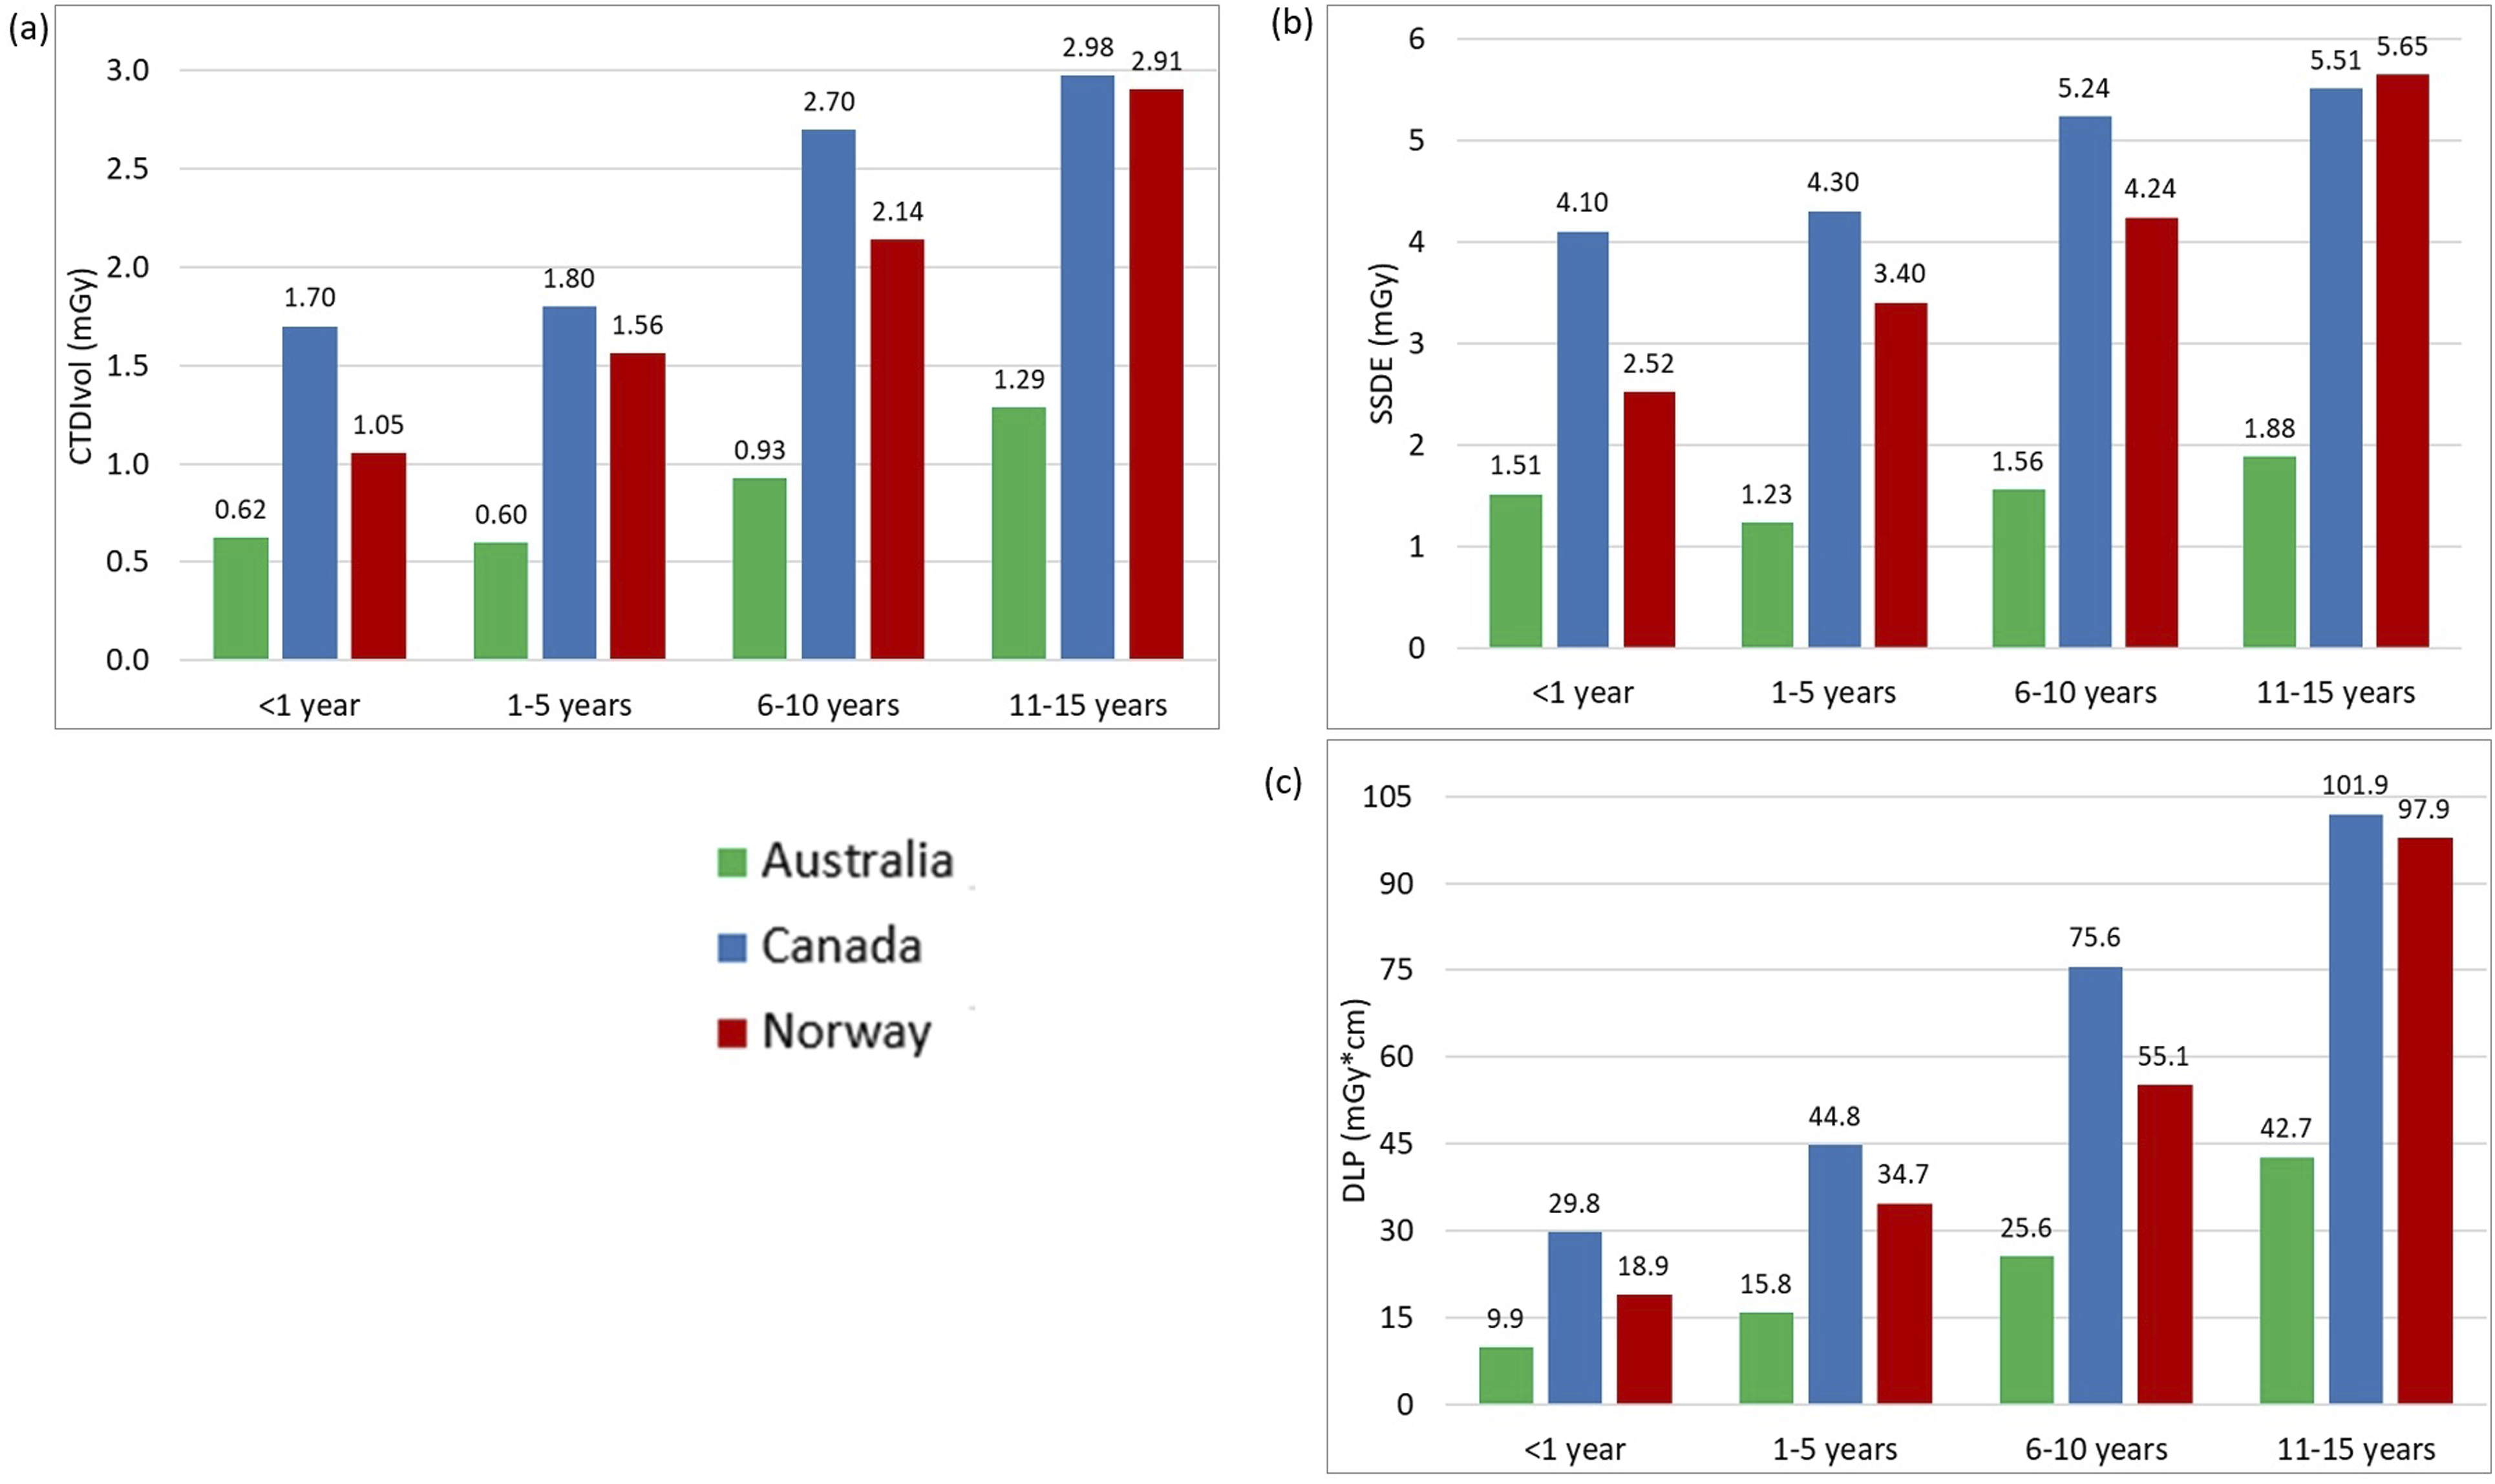
Table 2 displays the descriptive statistics for all examinations and age groups, including median and interquartile ranges for the CTDIvol, DLP, and SSDE values. The 75th percentile graphs are shown in Figures 1–3, representing the proposed local DRL values for each facility. LDRLs increased with the increasing age, except for Australia’s results for chest CT in <1 year-olds, where SSDE and CTDIvol values were, respectively, 23% and 4% higher in <1-year patients than in the 1–5-year-old group (Fig. 2). The LDRL values from Australian facilities were the lowest in all comparisons except for the 11–15-year-old abdomen-pelvis scans, where the Canadian hospital had the lowest dose values (Figure 3). The CTDIvol and DLP values from the Canadian hospital exceeded those from Norwegian and Australian facilities for chest CT in every age range (Figure 2). For abdominopelvic examination, the Canadian hospital demonstrated the highest values in the two youngest patient groups; however, dose indices for 6–15-year-old patients were the highest at the Norwegian hospital (Figure 3). The 75th percentile of the CTDIvol (a) and DLP (b) values for Head CT examinations in different age groups. The 75th percentile of the CTDIvol (a), SSDE (b), and DLP (c) values for chest CT examinations in different age groups. The 75th percentile of CTDIvol (a), SSDE (b), and DLP (c) values for abdomen-pelvis CT examinations in different age groups.

The Kruskal–Wallis test found significant differences in CTDIvol, DLP, and SSDE distributions for all examinations and age groups across countries (all p-values <0.002). The comparison between Canadian and Norwegian hospitals using post-hoc Dunn’s test with Bonferroni adjustment showed a significant difference at the 5% significance level for most age groups and examinations. No significant differences were demonstrated between Canadian and Norwegian facilities in all dosimetric indices for abdomen-pelvis CT in the 6–10-year-old age range with p-values of 0.601, 0.359, and 0.314 for CTDIvol, DLP, and SSDE, respectively. For head examinations, there were no significant differences in DLPs for patients from 1 to 15 years (p = .298 for 1–5, p = .643 for 6–10, and 0.429 for 11–15 years old), as well as in the CTDIvol values for patients of 6 to 15 years (p = 1.000 for 6–10 and p = .615 for 11–15 years old). The only non-significant difference with p-value >.05 for chest scans was found for all three dosimetric indices in the 11–15-year group (p-values were 0.147, 0.071, and 0.331 for CTDIvol, DLP, and SSDE, respectively).
The comparison based on post-hoc Dunn’s test with Bonferroni adjustment for Australian and Norwegian hospitals showed a significant (at the 5% level) difference for all dosimetric quantities across all exams and age groups except for the abdominopelvic DLPs for 1–5 years (p = .076) and all dosimetric indices for the abdomen/pelvis in the youngest group, which contained only seven observations from Australia, with p-values of 0.434, 0.227, and 0.638 for CTDIvol, DLP, and SSDE, respectively. Performing the test between Australian and Canadian hospitals revealed a significant difference between most examinations and age groups, except for the abdominopelvic CT in the 11–15 years category: CTDIvol (p = .921), DLP (p = 1.000), and SSDE (p = .078).
Using ordinary least squares, the fitted values of SSDE in the chest and abdomen-pelvis CT examinations were estimated as linear functions of patient weight (Figures 4 and 5). For each examination/country combination, the SSDE and patient weight were significantly positively correlated. The Pearson correlation coefficients for pediatric chest CT were 0.61, 0.73, and 0.32 for Canadian, Norwegian, and Australian hospitals, respectively (Figure 4). The correlation coefficients for pediatric abdomen-pelvis CT were 0.48 for Canada, 0.85 for Norway, and 0.76 for Australia (Figure 5). All correlation coefficients were statistically different from zero (p-values <0.05). Scatter-plot comparison and correlation coefficients for pediatric chest CT SSDE and patient weight for surveyed hospitals in each country. The resulting fitted functions are as follows: SSDEAustralia = 1.098 + 0.014·weight; SSDECanada = 3.357 + 0.045·weight; SSDENorway = 1.617 + 0.074·weight. Scatter-plot comparison correlation coefficients for pediatric abdomen-pelvis CT SSDE and patient weight for surveyed hospitals in each country. The resulting fitted functions are as follows: SSDEAustralia = 0.342 + 0.087·weight; SSDECanada = 3.756 + 0.038·weight; SSDENorway = 0.724 + 0.168·weight.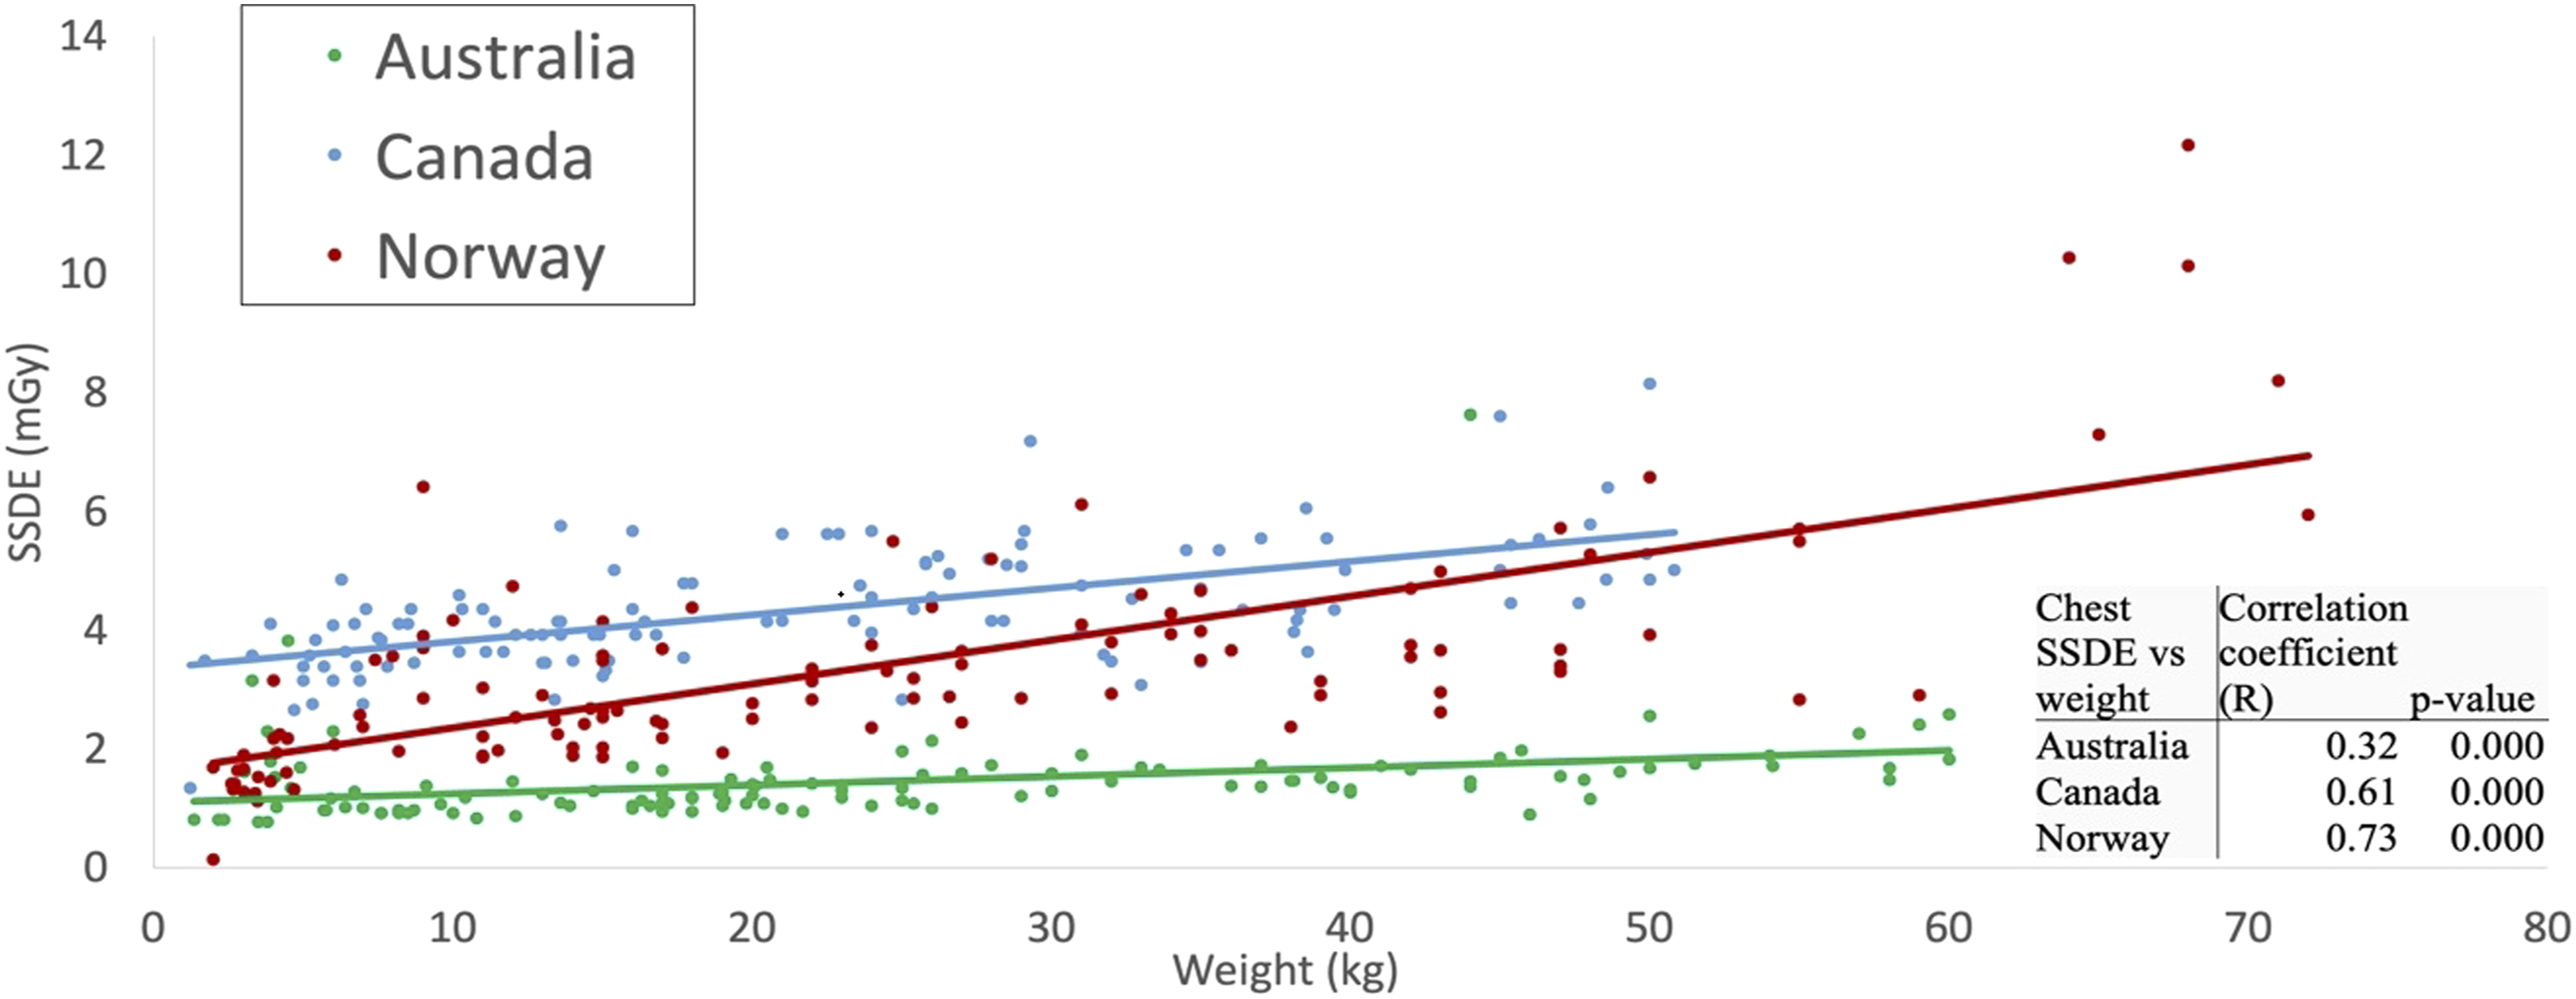

Discussion
This study investigated pediatric CT practices and suggested local diagnostic reference levels at different facilities providing pediatric care in three countries. None of those facilities previously conducted this type of survey; therefore, our results can provide a baseline for future studies. It should be noted that the surveyed Australian facilities used CT as ancillary imaging to monitor, in most cases, oncologic disease diagnosed using a different modality. In brain imaging, CT was employed only for craniosynostosis, or trauma to diagnose a bleed or fractures. Depending on the results, those patients would be followed with an MR scan for further evaluation. Therefore, a higher noise level was acceptable for CT studies at the Australian facility, unlike at the Canadian and Norwegian hospitals included in this survey.
Comparison of the local DRLs from this study with published data.

aDifferent age groups were chosen for head examination.
The local DRLs suggested for the Canadian hospital were also below previously established Canadian NDRL values. 14 The existing Canadian NDRLs include groups of patients aged 0–3 years, 3–7 years, and 7–13 years (Table 3), representing a different average patient age than reported in our study. This makes the direct comparison of established NDRLs to our suggested LDRLs challenging. It is important to note that existing Canadian pediatric NDRLs were published in 2016, based on the data collected in 2013, meaning they may not represent current technology, as updated CT scanners are more equipped for radiation dose reduction. While this is true, the Canadian data in this study came from a scanner installed in 2014; therefore, we can assume there are further opportunities for lower DRLs when considering the use of more modern equipment.
Pediatric DRLs established in the Nordic region in 2022 combined pediatric CT dose data from Denmark, Iceland, Norway, and Sweden. 15 These are the only established pediatric CT DRLs incorporating Norwegian data. Nordic head CT DRLs were divided into 0–3 months, 3 months–<1 year, 1–<6, and >6 years patient age groups. For chest and abdomen/pelvis examinations, the Nordic values were categorized by weight and did not incorporate patient age. 15 Using the approximate equivalent weight and age conversion chart provided by the European Commission, 6 local DRLs from the Norwegian hospital for both chest and abdomen-pelvis CT scans follow closely with national values, demonstrating appropriate adherence to these Nordic DRLs, except for 11–15-year-old abdomen-pelvis examinations. 15 In contrast, all head CTDIvol and DLP values represented here exceeded that of Nordic DRLs, as shown in Table 3. This suggests the potential for optimization of pediatric head CT. Interestingly, while the Nordic DRL study was released in 2022, data collection took place between 2018 and 2019, meaning the Norwegian scanner sampled in our study represents the most modern equipment.
Our study showed that abdomen-pelvis reference levels from the Canadian hospital for patients aged 11–15 years were lower than those collected from Australian and Norwegian facilities (Figure 3). A possible explanation for this is differences in patient size. The median weight/thickness of patients aged 11–15 years receiving an abdomen-pelvis CT in Canada was 41.0 kg/16.8 cm; while in Australia and Norway, it was 50.0 kg/21.4 cm and 44.7 kg/19.5 cm, respectively (Table 2). The lower weight of Canadian patients in the 11–15-year-age cohort likely contributed to the low LDRL. The differences observed in this age group could also be explained by variability in protocol, such as the age or weight at which patients begin to be scanned under adult parameters.
In contrast, the CTDIvol and DLP proposed as local DRLs at the Canadian hospital for pediatric chest CT exceeded that of Norwegian and Australian local reference values in all age cohorts, including the 11–15-year-old group, despite demonstrating similar differences in weight as in the abdomen-pelvis cohorts. The median weight of patients aged 11-15 years receiving a chest CT in Canada was 39.3 kg; while in Australia and Norway, it was 45.9 kg and 47.0 kg, respectively (Table 2). These noted differences in DRLs indicate the potential for optimization but must consider many other influences on examination dose such as operator use, operator training, scanner age, radiologist preference, diagnostic needs of the study, and image quality.
A patient’s size influences the dose modulation and radiation dose used during scanning; therefore, incorporating size into established DRL figures can ensure they accurately represent their assigned population. While CTDIvol measures the scanner radiation output, SSDE accounts for patient size and better indicates actual patient dose. 17 Our study demonstrated that SSDE values were higher than CTDIvol in all age groups and considered examinations. Other studies have reported similar results for pediatric and small patients.18–20 Therefore, the displayed CT dose indices from pediatric scans significantly underestimate the patient’s radiation dose. Pediatric protocols are often based on patient weight, and a demonstrated strong positive correlation between SSDE and patient weight indicates that it might be a more accurate dosimetric parameter for protocol optimization. Moreover, SSDE can be automatically and retrospectively recorded compared to patient weight. In future studies of pediatric CT DRLs, we suggest that SSDE be incorporated as an indicator of radiation use.
While this study provides valuable insights into the local practices in three different countries, it is important to acknowledge the limitations regarding the representativeness of the involved hospitals. The selection of hospitals was based on existing academic relationships, which, while facilitating data collection and analysis, may not capture the full spectrum of practices and technological variations present in the country. Additionally, within each country, the data were collected from a limited number of hospitals, which may not fully represent national practices. A limited number of pediatric CT examinations performed within the prescribed time parameters in each age category resulted in a relatively low sample size in some cohorts, notably for the abdomen-pelvis CTs in the <1-year group. No image quality assessment was performed in this study; however, it was assumed that all examinations were of diagnostic quality because the data were collected retrospectively from examinations reported by radiologists.
Another noteworthy limitation of this study was the number of scanners included in the survey. This limited our ability to draw conclusions based on variables such as scanner type and protocol. Multiple independent researchers manually collected and recorded data, leading to potential human error or bias.
In conclusion, our study proposed LDRLs for pediatric CT examinations of the head, chest, and abdomen/pelvis. The resulting values reflect differences in practices, such as using CT only for ancillary imaging at the Australian facility. Our findings suggested that there are opportunities for optimization in pediatric CT imaging, particularly chest CT in Canada and head CT in Norway. Promoting automated and standardized data collection may minimize human error in future DRL studies. Furthermore, integrating SSDE as a standard metric for DRLs can help achieve a more accurate dose descriptor for pediatric patients, thus improving radiation safety and optimizing imaging practices in pediatric CT.
Footnotes
Declaration of conflicting interests
The author(s) declared no potential conflicts of interest with respect to the research, authorship, and/or publication of this article.
Funding
The author(s) received no financial support for the research, authorship, and/or publication of this article.