
Abstract
The aim of this review article is to provide insight into the optimization of 1.5-Testla (T) and 3-T prostate magnetic resonance imaging (MRI). An approach for optimization of data quantification, especially diffusion-weighted imaging (DWI), is provided. Benefits and limitations of various pulse sequences are discussed. Importable MRI protocols and access to imaging datasets is provided. Careful optimization of prostate MR acquisition protocol allows the acquisition of high-quality prostate MRI using clinical 1.5-T/3-T MR scanners with an overall acquisition time < 15 min.
Keywords
Introduction
Prostate cancer is the most common male cancer type in the USA (1) and the second most common worldwide (2). Prostate cancer mortality has been steadily decreasing in the last decade. Nevertheless, prostate cancer remains one of the most common causes of cancer related death in men (1). The use of magnetic resonance imaging (MRI) is gaining acceptance for evaluation of men with a clinical suspicion or histologically confirmed prostate cancer.
Due to the wide variability in quality of prostate MRI (acquisition and reporting), attempts to standardize prostate MRI scans are of utmost importance. In 2012, the European Society of Urogenital Radiology published the first version of the Prostate Imaging and Reporting and Data System (PI-RADs) (3). One of the aims of the PI-RADs guidelines was to provide clear and easily understandable guidelines regarding the clinical role of prostate MRI and to design a reporting system. PI-RADs guidelines are excellent steps in the right direction, although details regarding MRI protocol development and implementation are sparse. The aim of the current review was: (1) to outline practical steps for optimization of prostate MRI acquisition protocol; and (2) provide a free access to an optimized MR acquisition protocols for 1.5-T and 3-T MR scanners with access to imaging datasets collected in the IMPROD trial (ClinicalTrials.gov identifier NCT01864135). Free access is provided to importable MRI protocols (1.5-T and 3-T) of two major MR vendors.
Field strength and receiver coils
Prostate MRI is commonly acquired using a 1.5-T or 3-T MR scanner. The higher field strength of the 3-T provides a higher signal-to-noise ratio (SNR). The induced MR signal in a receiver coil is proportional to the square of the main magnetic field (B0) while the noise has a linear dependence at field strengths > 1.0-T. Thus, the theoretical SNR gain of the 3-T vs. 1.5-T is two times higher. However, SNR of spin-echo- and gradient-echo-based MR sequences is proportional to the main magnetic field strength as well as the square root of the acquisition time, voxel volume, receiver bandwidth, longitudinal relaxation time (T1), and some sequence-specific factors. Longitudinal relaxation time T1 increases with increasing B0 while the changes in the transverse relaxation time (T2) are relatively minor. Thus, the theoretical SNR gain of 3-T vs. 1.5-T is in the range of 1.5–1.8 (4). Development of high density phase array coils led to major improvements in SNR (5). As can be seen in Fig. 1, comparison of Torso XL coils with Cardiac 32 channel Coil (Philips Medical Systems, Best, The Netherlands), receiver coils have a major effect on SNR.
Comparison of the trace DWI b = 2000 s/mm2 image acquired using a TorsoXL coil (a), Philips Medical Systems, Best, The Netherlands, and 32-channel cardiac coil (b), Philips Medical Systems, which demonstrated higher SNRs. Both DWI acquisitions had identical MR acquisitions parameters and image windowing/scaling.
In routine clinical practice, prostate MRI scans can be acquired at 1.5-T using surface array coils with a quality comparable to 3-T if the MR acquisition protocol is optimized (Fig. 2). Please note, the access to importable MRI protocols for 1.5-T (IMPROD_Siemens_1_5T.pdf/.edx) and 3-T MR (IMPROD_Siemens_3T.pdf/.edx; IMPROD_Philips_3T.ExamCard) scanners is provided in the supporting material. The main advantage of 3-T compared with 1.5-T, which is the gain in SNR, can be invested in higher resolution or shorter acquisition time. Specifically, in the IMPROD trial (ClinicalTrials.gov identifier NCT01864135) the diffusion-weighted imaging (DWI) acquisitions performed using 0–1500 and 0–2000 s/mm2 b-values at 3-T (3T Verio, Siemens, Erlangen, Germany) had an acquisition time of 1 min 37 s while similar image quality can be acquired using a 1.5-T MR scanners (1.5T Aera, Siemens, Erlangen, Germany) with an acquisition time of 2 min 21 s, thus a 45% increase in acquisition time (Fig. 2).
Axial T2W image (a), monoexponential apparent diffusion coefficient map (b, calculated using b-values in the range of 0–500 s/mm2), sagittal T2W image (c), trace diffusion-weighted image of b-value 1500 s/mm2 (d), and trace diffusion-weighted image of b-value 2000 s/mm2 (e) acquired using a 1.5-T MR scanner with an acquisition time < 13 min (IMPROD_Siemens_1_5T.pdf/.edx). The suspicious lesion in the apex (write arrows) was interpreted as Likert score 5, PI-RADsv2 4, and DWI score 1 (dominant Gleason grade 4 is probable). Prostate cancer with Gleason score 4 + 3 was found in two cores of the targeted biopsy while no cancer was present in the cores the systematic biopsy. Clinically significant prostate cancer was found only in the targeted biopsy cores, and the prediction of the Gleason score based on DWI was correct. The MR acquisition protocol (IMPROD_Siemens_3T.pdf, IMPROD_Siemens_3T.edx) and reporting system (IMPROD_trial_instructions.pdf) are provided in the supporting material.
Endorectal coil
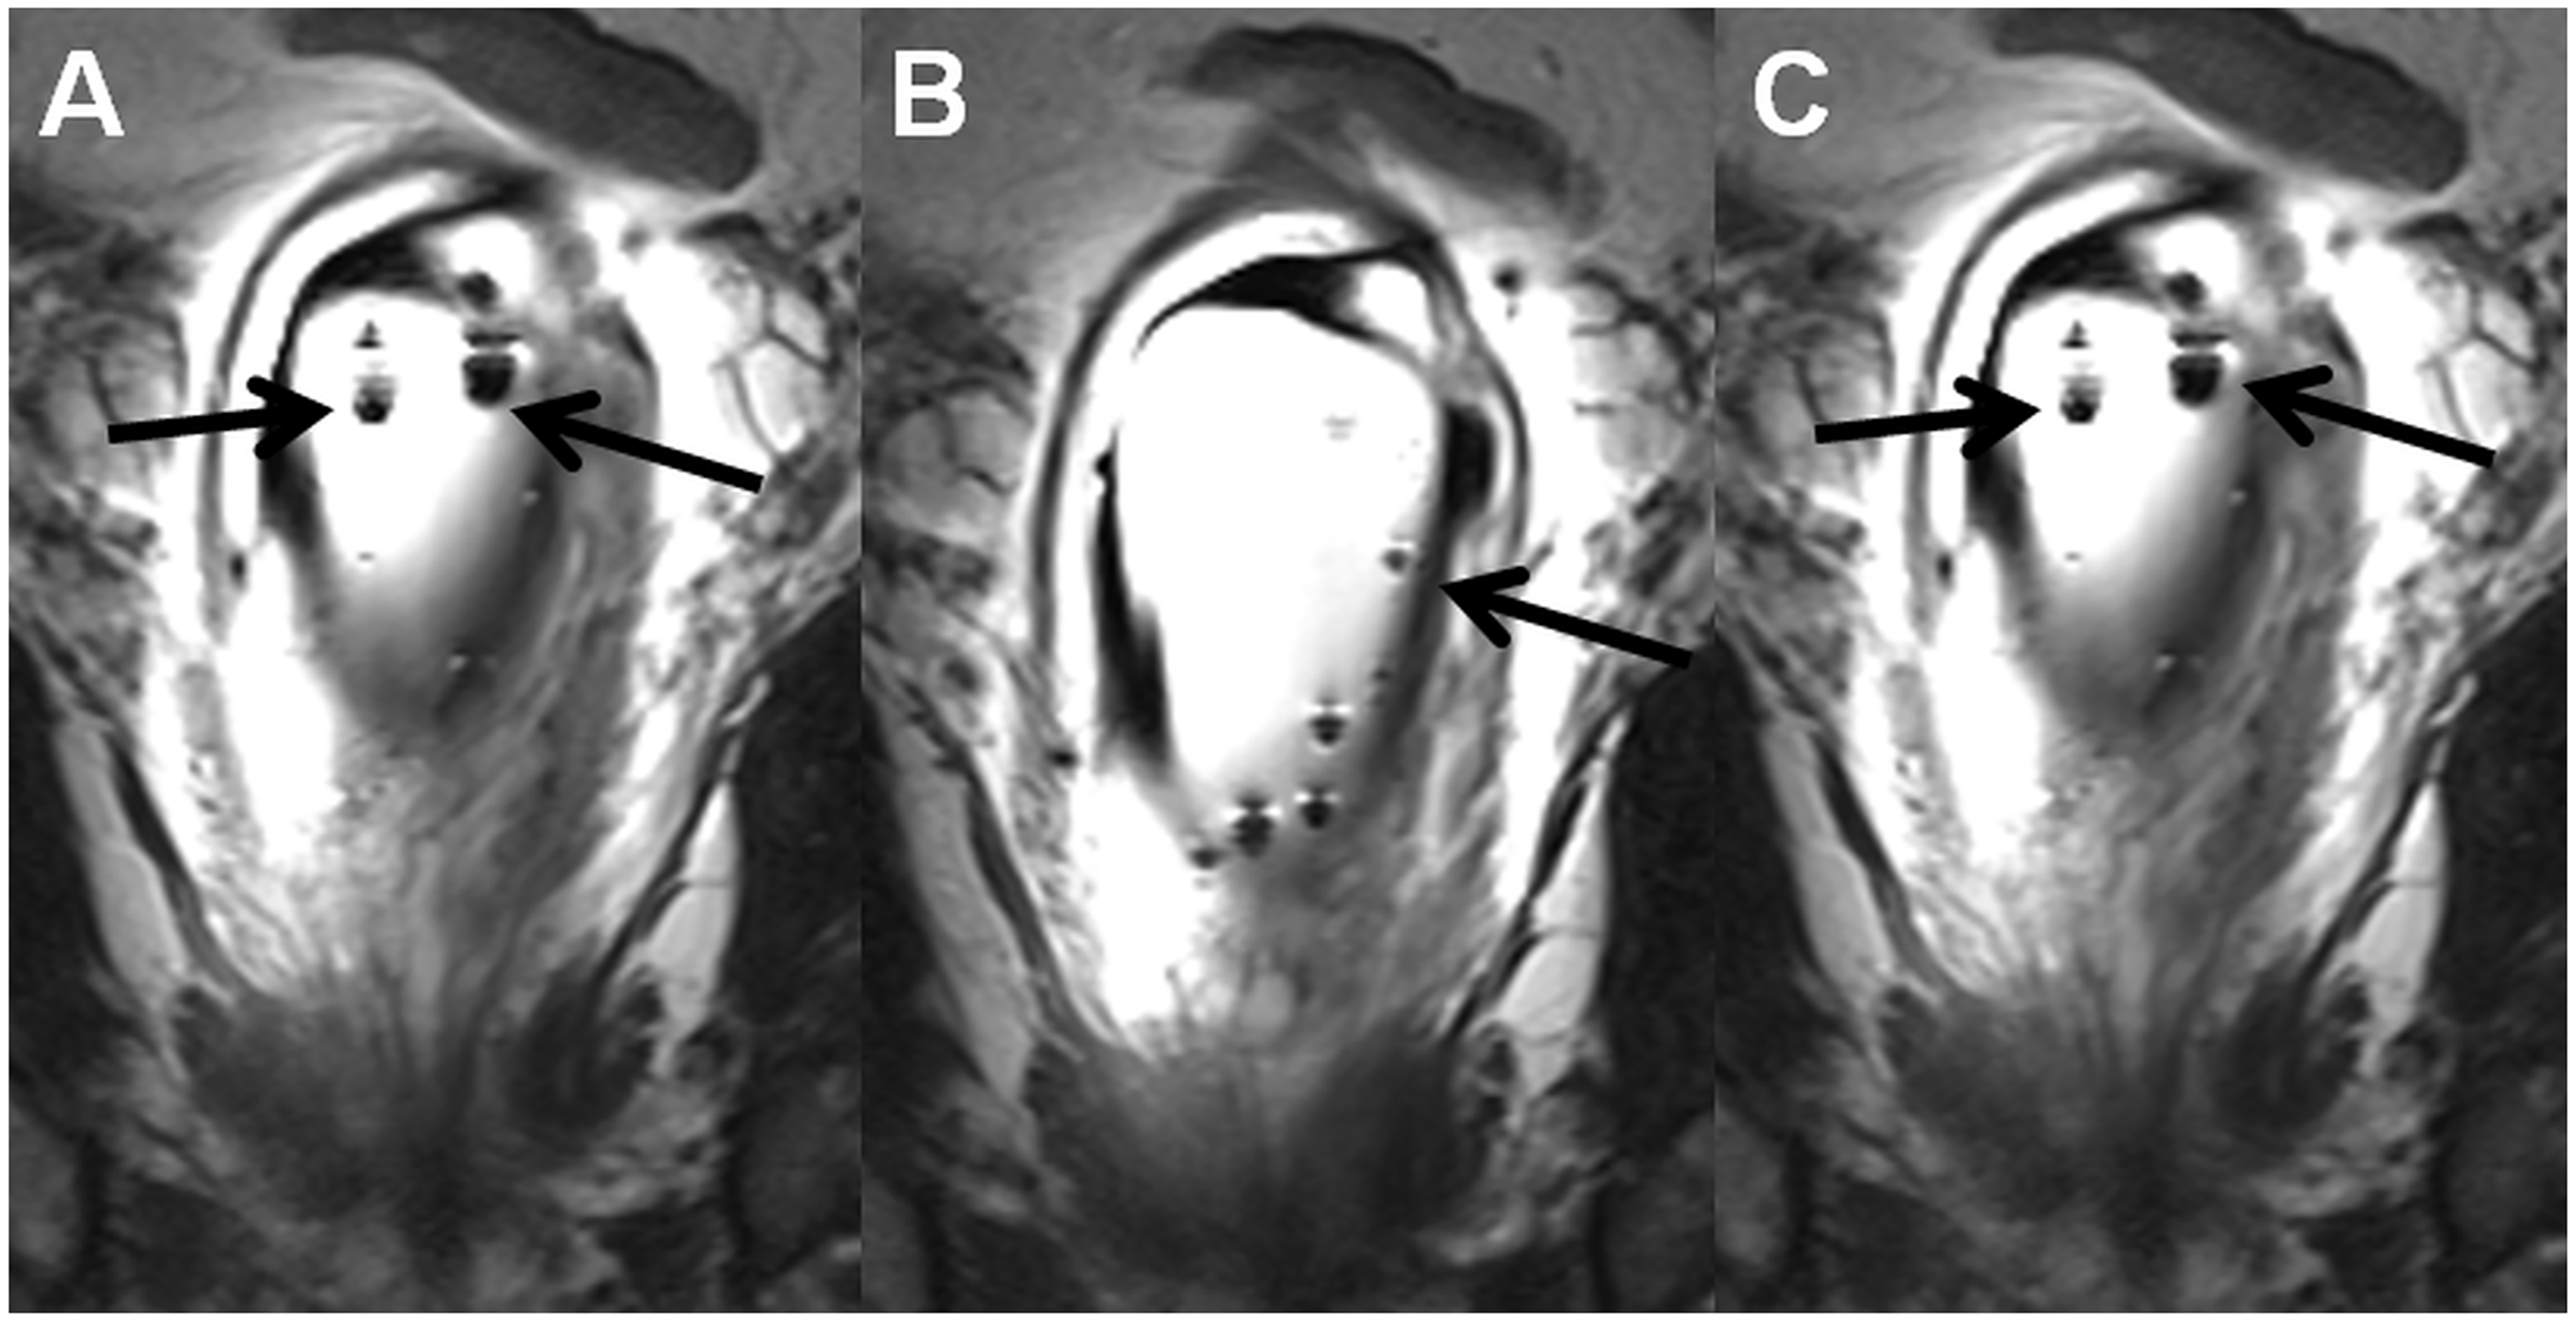
Endorectal coils (ECR) provide higher SNR compared with surface array coils but the receiver profile of ECR is inhomogeneous and signal gain decreases exponentially with distance from the coils (Fig. 3). The inhomogeneous receiver profile may cause problems in qualification of DWI and proton magnetic resonance spectroscopy (1H-MRS). High SNR near to ECR may lead to suboptimal diagnostic performance. Although methods for correction of this bias have been proposed (6), these methods just partly resolve this issue. Moreover, in DWI post-processing, Gaussian noise distribution is commonly assumed in the least squares fitting procedure. However, voxels further apart from the ECR have lower SNR and Gaussian noise distribution assumption might be violated leading to possible quantification bias (7–9). Furthermore, the external balloon of endorectal coils should not be filled with air if pulse sequences sensitive to B0 inhomogeneities are being acquired (e.g. DWI acquired using epi read-out). Filling ERC with distilled water offers benefit of visualizing possible air bubbles in contrast to the use of barium or perfluorocarbon (10,11) (Fig. 4). Instructions on how to limit the presence of air bubbles in ERC are provided in the Supporting Material (Instructions_how_to_fill_ERC.pdf). Finally, ERC is uncomfortable for many patients.
Axial T2W image (a), trace diffusion-weighted image of b-value 2000 s/mm2 (b), monoexponential ADC map (c, calculated using b-values in the range of 0–500 s/mm2) are shown. High SNR is present near to the endorectal coil which is filled with distilled water. (d) Whole mount prostatectomy section (cancer is outlined in blue). Please note the wrong position of receiver coil wire on the right side (a, red arrows). Coronal T2W images (a–c), the same MR acquisition as in Fig. 3, demonstrate multiple air bubbles (black arrows) in outer balloon of the endorectal coil. Instructions on how to fill endorectal coils are provided in the supporting material (Instructions_how_to_fill_ERC.pdf).
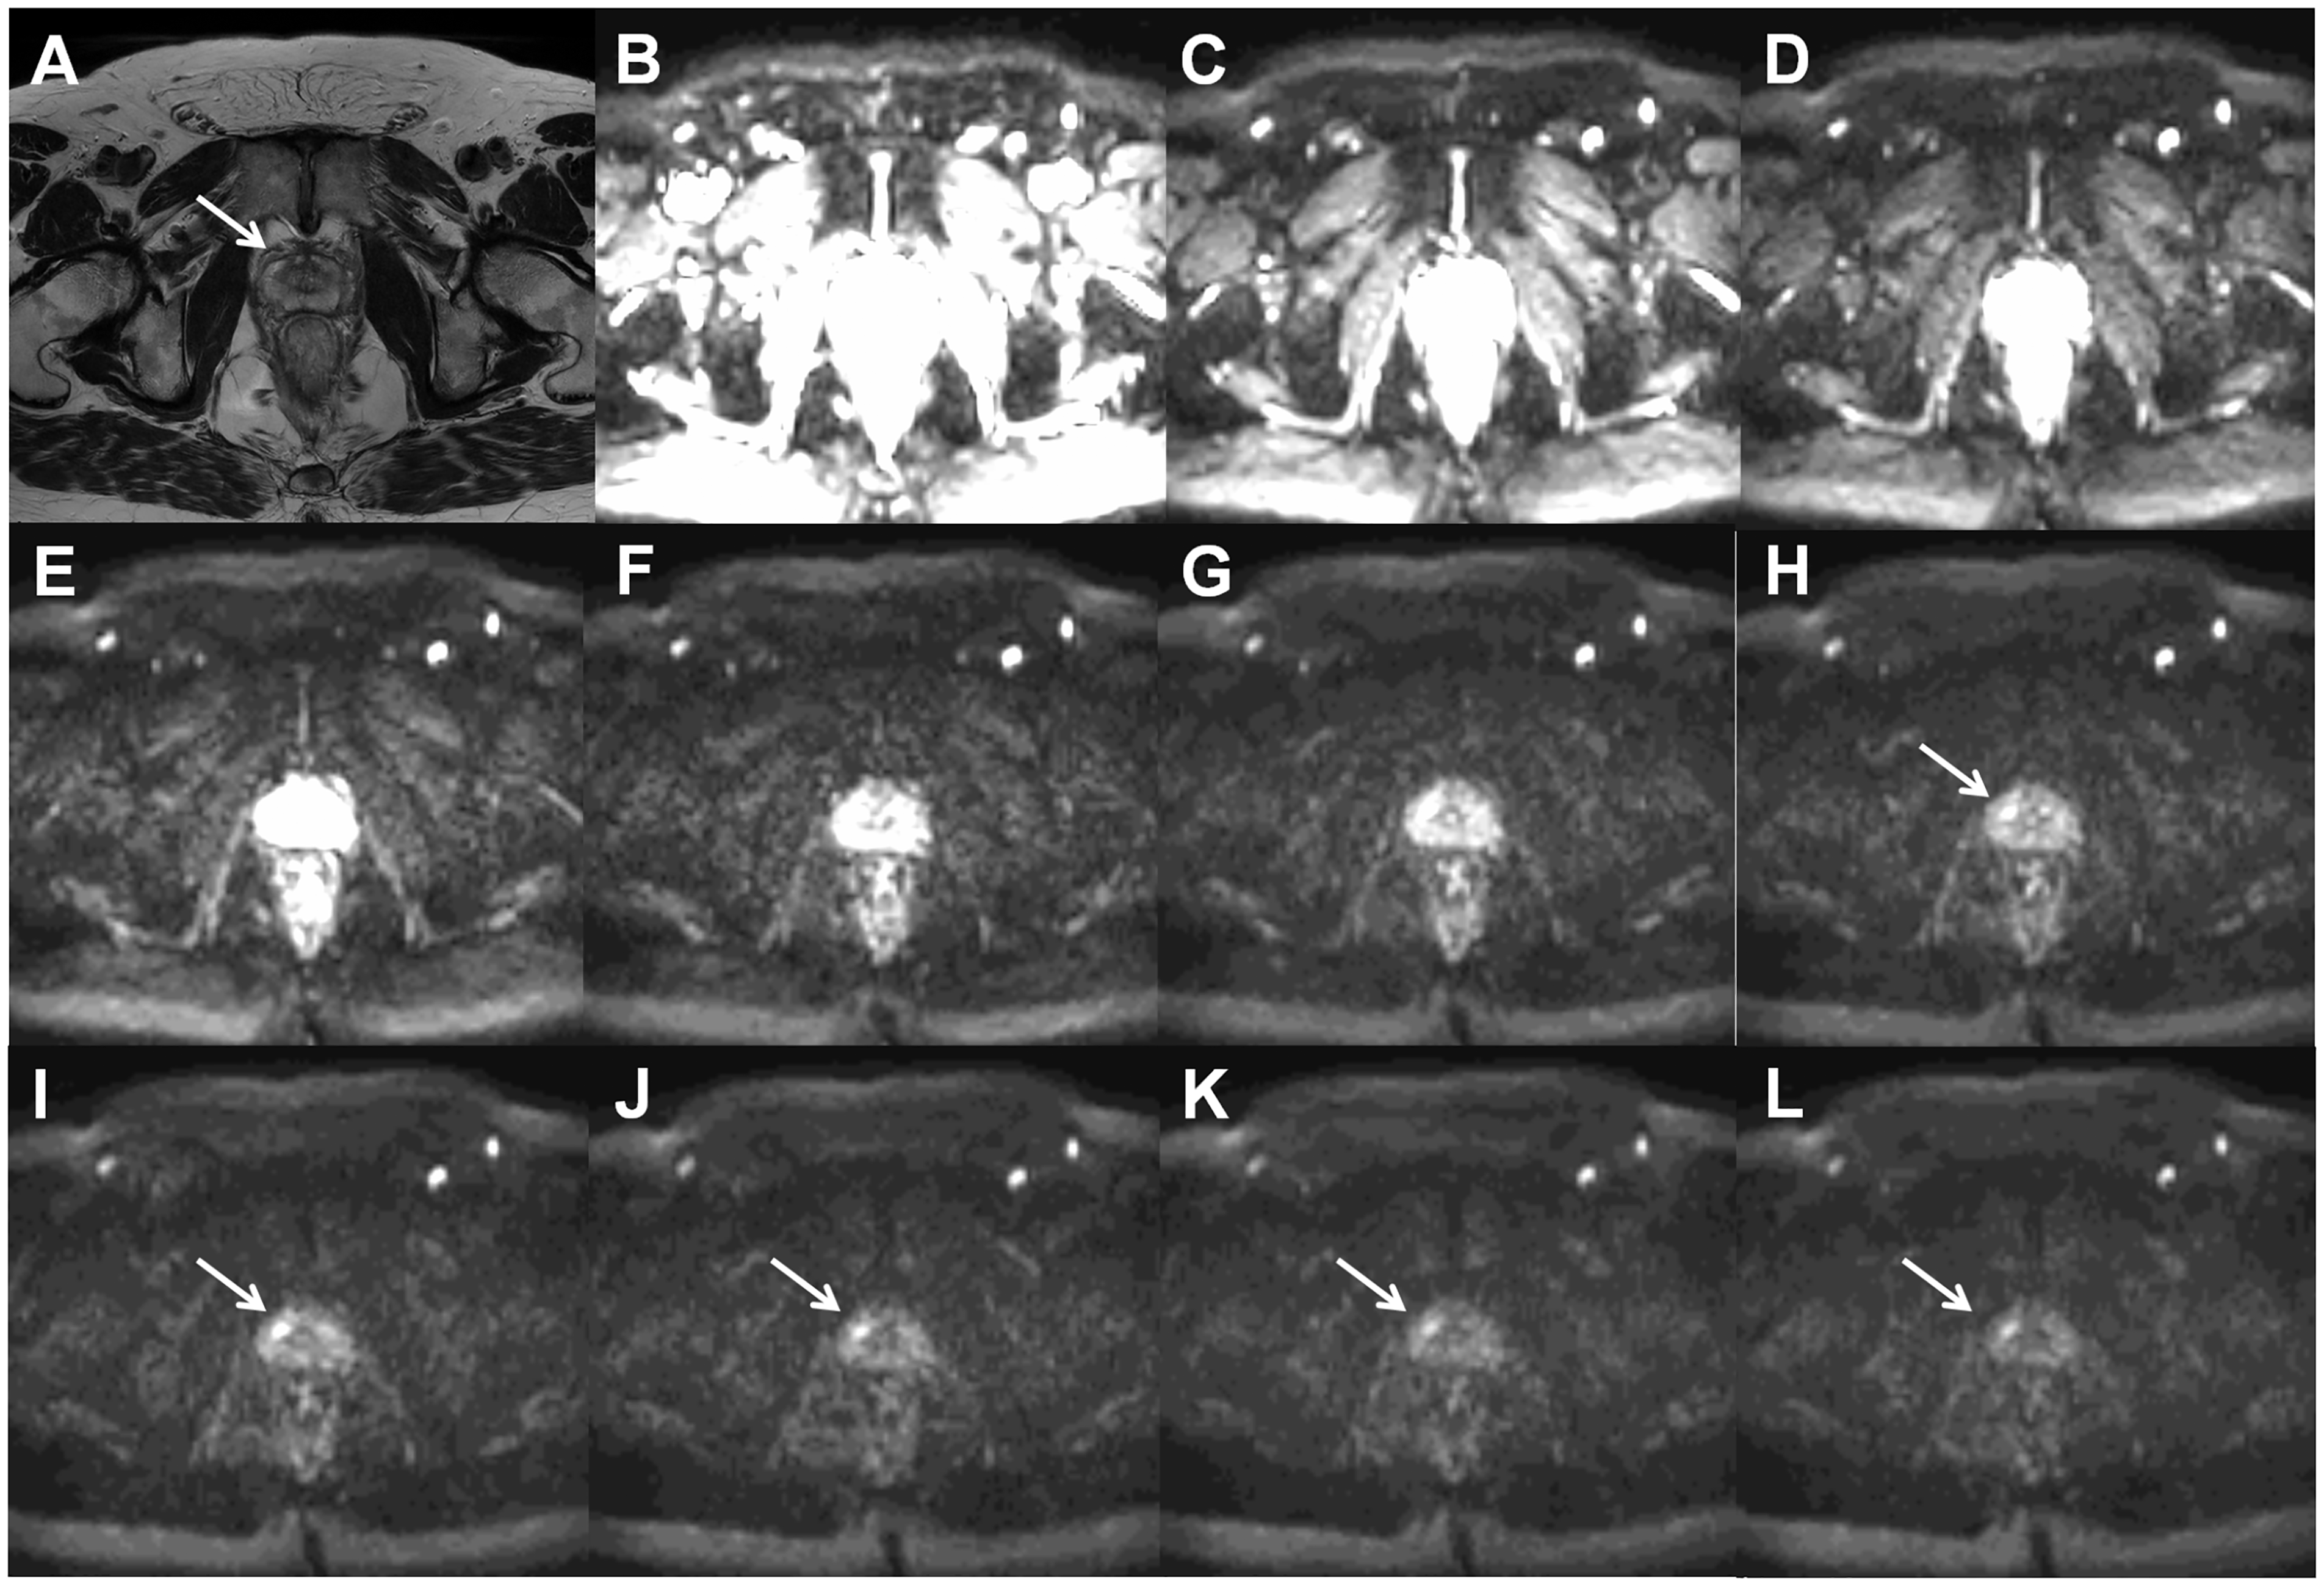
The main advantage of ERC, higher SNR close to the coil, can be used to increase acquisition matrix/resolution. The three-dimensional (3D) 1H-MRS covering the whole prostate, which is acquired using point-resolved spatially localized spectroscopy (PRESS) sequence, can miss even large prostate cancer lesions if the acquisition matrix is low (Fig. 5). Use of a PRESS sequence with weighted averaging of elliptically sampled k-space, Hanning filtering of the signal with zero-filling to a 16 × 16 matrix, field of view (FOV) 96 × 96 × 96 mm and matrix size of 12 × 12 × 12 mm results in a nominal voxel size of 8 × 8 × 8 mm. However, a real voxel size could be best approximated as a sphere with a volume of 1.51 cm3 and diameter of 14.24 mm after apodization (12). Increasing the nominal voxel size to 6 × 6 × 6 mm, 6.7 × 6.7 × 6.7 mm, and 7 × 7 × 7 mm would equal to a sphere of 0.637 (diameter of 10.68 mm), 0.887 (diameter of 11.93 mm), and 1.0 cm3 (diameter of 12.48 mm), respectively.
Axial T2W image (a, black arrow points to wrongly positioned receiver wires of ERC), 1H-MRS 16 × 16 matrix grid overlaid over T2W image (b), trace diffusion-weighted image of b-value 2000 s/mm2 (c), monoexponential ADC map ((d), calculated using b-values in the range of 0–500 s/mm2), whole mount prostatectomy section ((e), cancer is outlined in blue) demonstrate cancer area in peripheral zone. However, the individual spectral obtained using a PRESS sequence ((f), blue square in (b); (g), red square in (b); (h), yellow square in (b); (i), purple square in (b); (j), brown square in (b)) does not demonstrate increase in choline or decrease citrate suggestive of prostate. A real voxel size of the 1H-MRS could be best approximated as a sphere with a volume of 1.51 cm3 and diameter of 14.24 mm after apodization.
T2-weighted imaging
T2-weighted (T2W) images of the prostate allow zonal differentiation (peripheral zone, transitional zone) and identification of possible extra-capsular extension. T2W imaging is most commonly performed using a turbo spin-echo (TSE) sequence. According to PI-RADs version 2, T2W imaging of the prostate should be performed using 3-mm slice thickness, FOV 12–20 cm2, in plane resolution ≤ 0.7 × ≤ 0.4 mm2. Acquisition parameters such as parallel imaging method (13), TSE factor, TSE spacing, and image filtering should be all carefully optimized to allow the best image quality per acquisition time (Fig. 6). High quality axial T2W imaging of prostate can be performed in under 3 min using the MR acquisition protocol provided in the supporting material. 3D acquisition methods, such as VISTA (Volume ISotropic Turbo spin echo Acquisition) and SPACE (Sampling Perfection with Application optimized Contrasts using different flip angle Evolution), have been extensively evaluated for prostate imaging. These methods have long echo train lengths (typically 150–250 echoes) with ultrashort echo spacing and non-selective refocusing pulses. Unfortunately, image contrast of these sequences is not the same as with the TSE sequence.
Axial T2W images acquired at 3-T using surface arrays coils. All acquisitions fulfilled the recommendations stated in PI-RADs v2. However, substantial differences in acquisition times and image quality can be noted: (a) acquisition time is 2 min 55 s; (b) acquisition time is 2 min 30 s; (c) acquisition time is 2 min 20 s; (d) acquisition time is 2 min 55 s; (e) acquisition time is 3 min 10 s; (f) acquisition time is 3 min 7 s. All images have the same windowing.
Diffusion-weighted imaging
DWI is the cornerstone of prostate imaging and has a dominant role for prostate cancer detection and characterization. According to PI-RADs version 2, DWI of prostate should be performed using echo time (TE) ≤ 90 ms, repetition time (TR) ≥ 3000 ms, ≤ 4 mm slice thickness, FOV 16–22 cm2, in-plane resolution ≤ 2.5 mm2. Furthermore (14), according to PI-RADs version 2, the preferred lowest b-value should be set at 50–100 s/mm2 and the highest should be 800–1000 s/mm2. However, there is no theoretical or experimental evidence to support this claim. These recommendations are not only too general but also with some acquisition, such as those using two-dimensional (2D) radiofrequency pulses, they cannot be met (15,16). 2D radiofrequency pulses allow small FOV imaging with benefits such as shortened epi train length and resulting susceptibility. Thus, parameters such as “ideal” FOV is of limited value. In contrast to claims in PI-RADs version 2, the use of 3–5 b-values (including b = 0 s/mm2) and range up to 500–800 s/mm2 was shown to be “optimal” for the apparent diffusion coefficient (ADCm = monoexponential function) calculation aimed at quantitative detection and characterization of prostate cancer, especially in the peripheral zone, in three subsequent studies (17,18) of DWI datasets acquired using diffusion time of around 20 ms. Higher b-values are predominantly used for “visual” evaluation, but in studies by Merisaari et al. (17, 18) and Jambor et al. (19) b-values > 800 s/mm2 did not lead to any improvements in detection and characterization of prostate cancer using the monoexponential function.
Major issue for repeatability/quantitative detection and characterization of prostate cancer is ensuring sufficient SNR as shown in the simulation part of the Jambor et al. (19) publication.
DWI acquisition protocol
Prostate DWI is most commonly acquired using a spin-echo sequence with an echo planar (epi) read-out since epi read-out is very time efficient. However, epi read-out is susceptible to B0 field inhomogeneities (Fig. 7). These limitations can be overcome by shortening epi train length, e.g. segmented read-out methods (20), or using other read-out strategies such as TSE read-out (21), radial read-out (e.g. periodically rotated overlapping parallel lines (22)), or spiral read-out (e.g. Kim et al. (23)). However, these methods are not a free lunch since, for example, TSE read-out leads to a theoretical signal loss of 50% compared with epi read-out; segmented read out methods may suffer from motion since the data are acquired over several repetition times. Thus, epi read-out remains the most time efficient way to collect prostate DWI datasets. If a large number of slices is required, simultaneous slice excitation methods (24) are beneficial to reduce TR and acquisition time while maintaining image quality and SNR. Moreover, eddy currents can be an issue and tend to be scanner/gradient system-specific. In general, the aim of optimizing prostate DWI with an epi read-out is to use as short TE as possible while limiting adiabatic current generated by gradients. Thus, simultaneous gradient schemes, such as tetrahedral encoding (25), are beneficial.
DWI of prostate performed using a turbo spin echo read-out (TSE) ((a), b-value of 0 s/mm2; (b), b-value of 500 s/mm2) and epi read-out ((c), b-value of 0 s/mm2; (d), b-value of 500 s/mm2). Due to rectal gas and resulting B0 inhomogeneities, images acquired using epi read-out are severely distorted (c, d). The Mullerian duct cyst ((b), white arrow) can be seen only on images acquired using TSE read out.
The use of non-zero b-values
The strength of diffusion weighting in DWI is controlled by b-value:

The issue of using non-zero b-values for prostate DWI has already been addressed using simulations (14), repeated quantitative measurements (14,17,26) as well as visual evaluation (27). Due to presence of intravoxel incoherent motion at low b-values (28,29), in multiple publications (27) authors suggested the use of non-zero b-values for the monoexponential qualification of prostate DWI signal decay.
The intravoxel incoherent motion imaging model (IVIM) addresses diffusion behavior and DWI signal decay at low b-values (28). Based on IVIM, the blood flow in the capillaries causes a dephasing of the blood magnetization when motion-encoding gradients are applied. This means that the motion of water molecules due to microcirculation of blood in the randomly oriented capillaries has a similar impact on the resulting MRI signal as their motion due to molecular diffusion (intra- and extracellular diffusion). It is important to stress that “pseudo-diffusion,” due to the microcirculation of blood in the capillary network, is not directly proportional to the tissue perfusion (30,31). IVIM can be expressed by the following biexponential equation:

In our previous studies which included 50 patients (18,32) undergoing two repeated MRI examination (DWI performed using 12 b-values in the range of 0–2000 s/mm2, diffusion time of 20.3 ms), a non-normalized monoexponential model was used. We did not find any evidence to support the use of non-zero b-values for the monoexponential quantification of prostate DWI. Furthermore, a study evaluating DWI data of 81 patients with histologically confirmed prostate cancer obtained using 14 b-values in the range of 0–500 s/mm2 and diffusion time of 19.004 ms did not demonstrate any added values of IVIM over the monoexponential quantification (14). Median “pseudo-diffusion” fraction values were < 8.00%. To quantify such a small deviation from the monoexponential decay, a high SNR is required as demonstrated using Monte-Carlo simulations (14). Thus, there is no evidence to support the use of non-zero b-values for prostate DWI.
B-values distribution
The issue of optimizing b-value distribution is partly an ill-posed problem since the optimal distribution depends on the post-processing method (14,18,26,33). Ensuring sufficient SNR at each b-values is the most important step (Fig. 8). B-value distribution for the monoexponential quantification (ensuring sufficient SNR) has a limited role. “Wrong b-value distributions” (e.g. containing only b-values < 100 s/mm2 or only b-values in the range of ∼1500–2000 s/mm2), which demonstrated low diagnostic performance and repeatability (18), should not be used. The highest b-value with sufficient SNR will provide the best performance for visual evaluation due to increasing signal difference between cancer and normal tissue with increasing b-values (Figs. 9–11). The use of “calculated high b-values,” linear or non-linear extrapolation of DWI signal from “low b-values,” for visual evaluation of prostate cancer has been addressed by multiple authors. However, extrapolation of DWI signal does not lead to increase in information consent of the system and it merely acts just as image windowing. Thus, “calculated high b-values” cannot lead to an increase in quantitative parameters of prostate cancer detection or characterization (34).
An example of four repeated DWI data acquisitions performed using an optimized b-value distribution for the biexponential function of one healthy volunteer with placement of ROIs (a–d). The DWI signal decay curve of mean signal intensity (SI) of ROI in red color is shown (e–h). Bi-exponential model has the smallest sum of squares of the vertical distance of the points from the curve (“fitting residuals”). Mono, monoexponential function; Stretched, stretched exponential function; Kurt, Kurtosis function; Biex, biexponential function; SI, signal intensity. Axial T2W image ((a), arrow points to prostate cancer lesion) and trace DWI images of b = 0 (b), 200 (c), 400 (d), 600 (e), 800 (f), 1000 (g), 1200 (h), 1400 (i), 1600 (j), 1800 (k), and 2000 (l) s/mm2 of a patient with histologically confirmed Gleason score 4 + 3 prostate cancer demonstrate increasing contrast between the cancer lesion and benign tissue with increasing b-values. All trace DWI images have the same windowing setting. The MR acquisition protocol is provided in the Supporting Material (D_2000_b11.txt). Axial T2W image ((a), arrow points to prostate cancer lesion) and trace DWI images of b = 0 (b), 300 (c), 600 (d), 900 (e), 1200 (f), 1500 (g), 1800 (h), 2100 (i), 2400 (j), 2700 (k), and 3000 (l) s/mm2 of a patient (the same patient as in Fig. 9) with histologically confirmed Gleason score 4 + 3 prostate cancer demonstrate increasing contrast between the cancer lesion and benign tissue with increasing b-values. All trace DWI images have the same windowing setting. The MR acquisition protocol is provided in the Supporting Material (D_3000_b11.txt). An example of signal decay in prostate cancer and normal tissue as a function of b-values (x-axis) fitted using the monoexponential, stretched exponential, kurtosis, and biexponential functions. Mono, monoexponential function; Stretched, stretched exponential function; Kurt, Kurtosis function; Biex, biexponential function; SI, signal intensity.


Normalization of signal
Quantification of DWI signal decay can be performed using normalization of signal by signal intensity at a b-value of 0 s/mm2 which results in one less parameter to fit (Fig. 11). However, noise from b-value of 0 s/mm2 is propagated to other b-values by this normalization. The magnitude images with b-value of 0 s/mm2 (no diffusion weighting) have the highest SNR and the effect of noise propagation from b-value 0 s/mm2 to higher b-values appears to be limited (18).
Prostate DWI quantification
As previously demonstrated (19,35), several issues need to be addressed in the process of development and validation of mathematical models/fitting methods/functions for clinical DWI datasets: (i) fitting quality; (ii) repeatability of fitted parameters; (iii) robustness against measurement noise: and (iv) clinically useful information.
Prostate DWI signal decay is most commonly quantified using the monoexponential function (36):

Kurtosis function has been repeatedly applied to model prostate DWI and is defined as follows (40):

The other function previously applied to model prostate DWI is the stretched exponential function (43,44):
The biexponential function (46) is applicable not only for DWI acquired using low b-values (IVIM model) but to DWI acquired using high b-values as well:

The limitations and challenges of prostate DWI modeling have been excellently reviewed by Bourne and Panagiotaki (38). It is important to mention that modeling of prostate DWI signal depends on large number of parameters such as diffusion time (diffusion time (Δ–δ/3), TE, b-values and it cannot be generalized to one model fits all. Thus, it is very important to report all details of DWI acquisition protocol to allow comparison between studies.
Moreover, the difference between a biophysical model, such as IVIM, mathematic function, and a fitting method should be appreciated. A biophysical model has parameters with a clear biophysical meaning and assumptions. Mathematical functions such as stretched exponential function or kurtosis function lack clear biophysical meaning of the fitted parameters (40,43,44,50). Furthermore, the same biophysical model or mathematical functions can be fitted using different fitting procedures (51–54).
Repeatability of prostate DWI
Repeatability of DWI scans depends highly on acquisition protocol (SNR, imaging artifacts, etc.) and patient population so repeatability from one study cannot be directly applied to other studies even if identical acquisition protocol is used. Extensive evaluation of repeatability of various models (14,17–19,26,32,55) using different methods have already been performed aiming mainly at “relative comparison” of DWI models/fitting methods/functions and ways how to optimize b-value distribution. The repeatability of prostate ADCm was shown to be approximately in the range of 5–20% depending on DWI acquisition and post-processing method which is in a rough agreement with a study by Gibbs et al. (56).
Discussion
As shown in this review, strict adherence to PI-RADs guidelines is not sufficient to ensure the best image quality with an acceptable acquisition time. The current PI-RADs guidelines (PI-RADs version 2) recommend performing T2W imaging, DWI, and dynamic contrast-enhanced MRI (DCE-MRI) in all exams regardless of clinical set-up. However, the added value of DCE-MRI in men with a clinical suspicion of prostate cancer remains questionable (57). Adding DCE-MRI to T2W imaging and DWI increases acquisition times and cost (58) and requires the use of intravenous contrast media. Thus, optimization of DCE-MRI acquisition protocol and modeling is not being addressed in this review. A more rapid and less expensive MRI protocol with shorter imaging times, no endorectal coil and no intravenous contrast would be desired. Such MR protocol was validated in a prospective single institutional clinical trial (IMPROD [IMPROved prostate cancer Diagnosis] – combination of Magnetic Resonance Imaging and biomarkers; free public access to all datasets: http://mrc.utu.fi/mri/improd). Biparametric prostate MRI, T2W imaging and multiple DWI acquisitions, demonstrated a high sensitivity and a high negative predictive value in the detection of clinically significant prostate cancer. In this review fundamentals of MR acquisition and post-processing protocols are being discussed. Moreover, this review provides an access to importable MRI protocol of two major MR vendors (Philips Medical Systems, Best, The Netherlands; Siemens, Erlangen, Germany) allowing the dissemination of the MRI acquisition protocol to multiple vendor healthcare systems.
Footnotes
Acknowledgements
The author thank the team at Turku University Hospital/University of Turku involved in prostate imaging (in alphabetic order): Department of Radiology – Hannu J Aronen, Aida Kiviniemi, Harri Merisaari, Marko Pesola, Jani Saunavaara, Janne Verho; Department of Pathology – Markku Kallajoki, Pekka Taimen; Department of Urology – Peter J Boström, Otto Ettala, Esa Kähkönen, Kari Syvänen; Department of Oncology and Radiotherapy – Heikki Minn. The author also thank Jan Weis (Department of Radiology, Uppsala University Hospital) for fruitful discussions concerning MR protocol optimization.
Declaration of conflicting interests
The author declared no potential conflicts of interest with respect to the research, authorship, and/or publication of this article.
Funding
The author(s) disclosed receipt of the following financial support for the research, authorship, and/or publication of this article: Finnish Cultural Foundation, TYKS-SAPA Research Fund, Finnish Cancer Society, Instrumentarium Research Foundation, Sigrid Jusélius Foundation.
References
Supplementary Material
Please find the following supplemental material available below.
For Open Access articles published under a Creative Commons License, all supplemental material carries the same license as the article it is associated with.
For non-Open Access articles published, all supplemental material carries a non-exclusive license, and permission requests for re-use of supplemental material or any part of supplemental material shall be sent directly to the copyright owner as specified in the copyright notice associated with the article.