
Abstract
We report the 18F-fluorodeoxyglucose (FDG) positron emission tomography (PET)/computed tomography (CT) findings of sclerosing angiomatoid nodular transformation (SANT) of the spleen. The patient was a 37-year-old woman with a splenic mass incidentally found on abdominal ultrasound. FDG-PET/CT showed weak FDG accumulation (maximum standardized uptake value = 3.65). An unenhanced CT scan showed a low density and well-circumscribed splenic tumor that demonstrated weak enhancement from the arterial to delayed phase. Although hemangioma or hamartoma of the spleen was preoperatively diagnosed, histopathological examination revealed SANT. Therefore, when a splenic tumor with weak contrast medium enhancement and low FDG accumulation is observed, SANT should be considered as a differential diagnosis. Although CT and magnetic resonance imaging features of SANT have been reported, there are few reports on FDG-PET/CT findings. We report the radiological features of SANT, including FDG-PET/CT, and review the literature on SANT.
Keywords
Introduction
Sclerosing angiomatoid nodular transformation (SANT) of the spleen is a rare, benign vascular tumor (1). Although computed tomography (CT) imaging and magnetic resonance imaging (MRI) features of SANT have been reported (2–5), we found only 10 cases in the English literature (6–12) of 18F-fluorodeoxyglucose (FDG) positron emission tomography (PET)/CT findings. Here we report CT, MRI, and PET findings of a case of SANT.
Case report
Abdominal ultrasonography (US) of a 37-year-old woman during a routine health examination incidentally revealed a 5-cm hypoechoic mass in the spleen. She underwent contrast-enhanced CT and MRI at a local hospital. She then presented to our hospital for further diagnostic workup and possible treatment of a suspected splenic benign vascular tumor. FDG-PET/CT was performed to determine if the mass was a hemangioma, hamartoma, or a malignant lymphoma of the spleen, as initially suspected. A maximum intensity projection (MIP) image showed a weak FDG uptake in the tumor (Fig. 1a). FDG accumulation in the tumor was low and heterogeneous with a maximum standardized uptake value (SUVmax) of 3.65 (Fig. 1b and c). No abnormal FDG accumulation was found elsewhere in the body. Considering these findings, a splenic benign vascular tumor was suspected; thus, we decided to perform a follow-up examination.
Low FDG accumulation in the splenic tumor on maximal intensity projection and (b) axial CT and (c) PET/CT images. The SUVmax value of the tumor was 3.65 (a, c, arrows).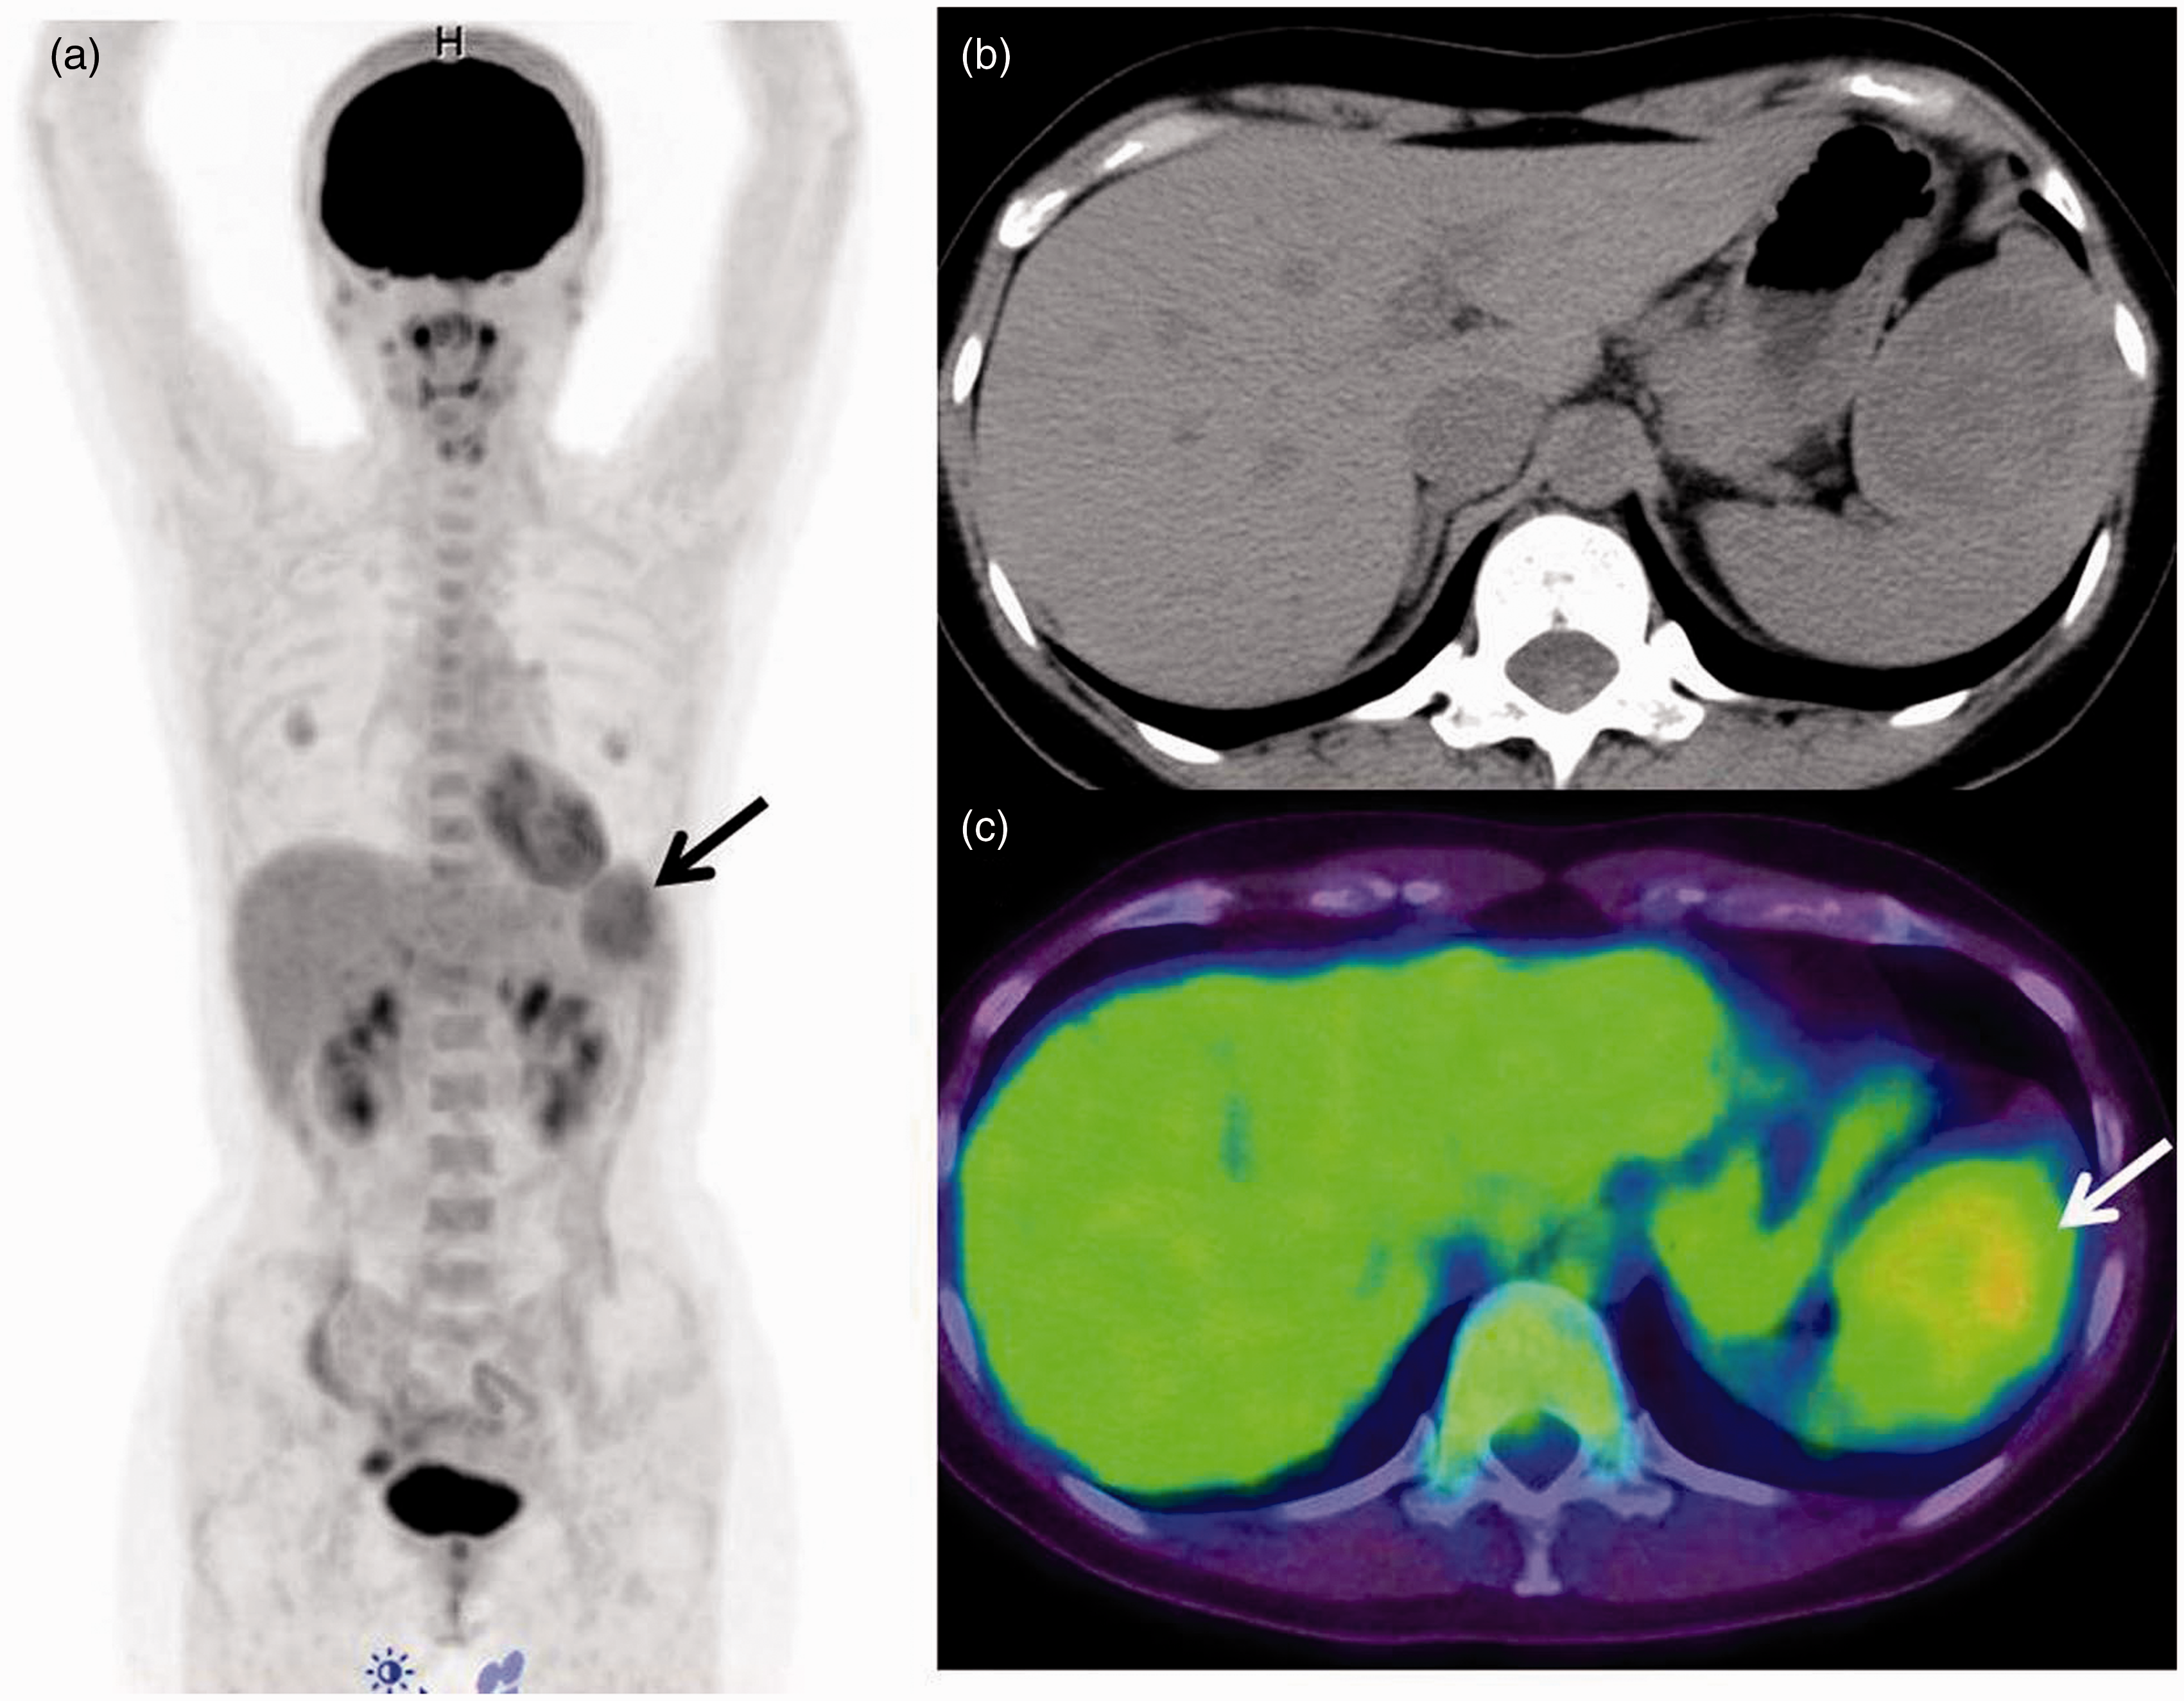
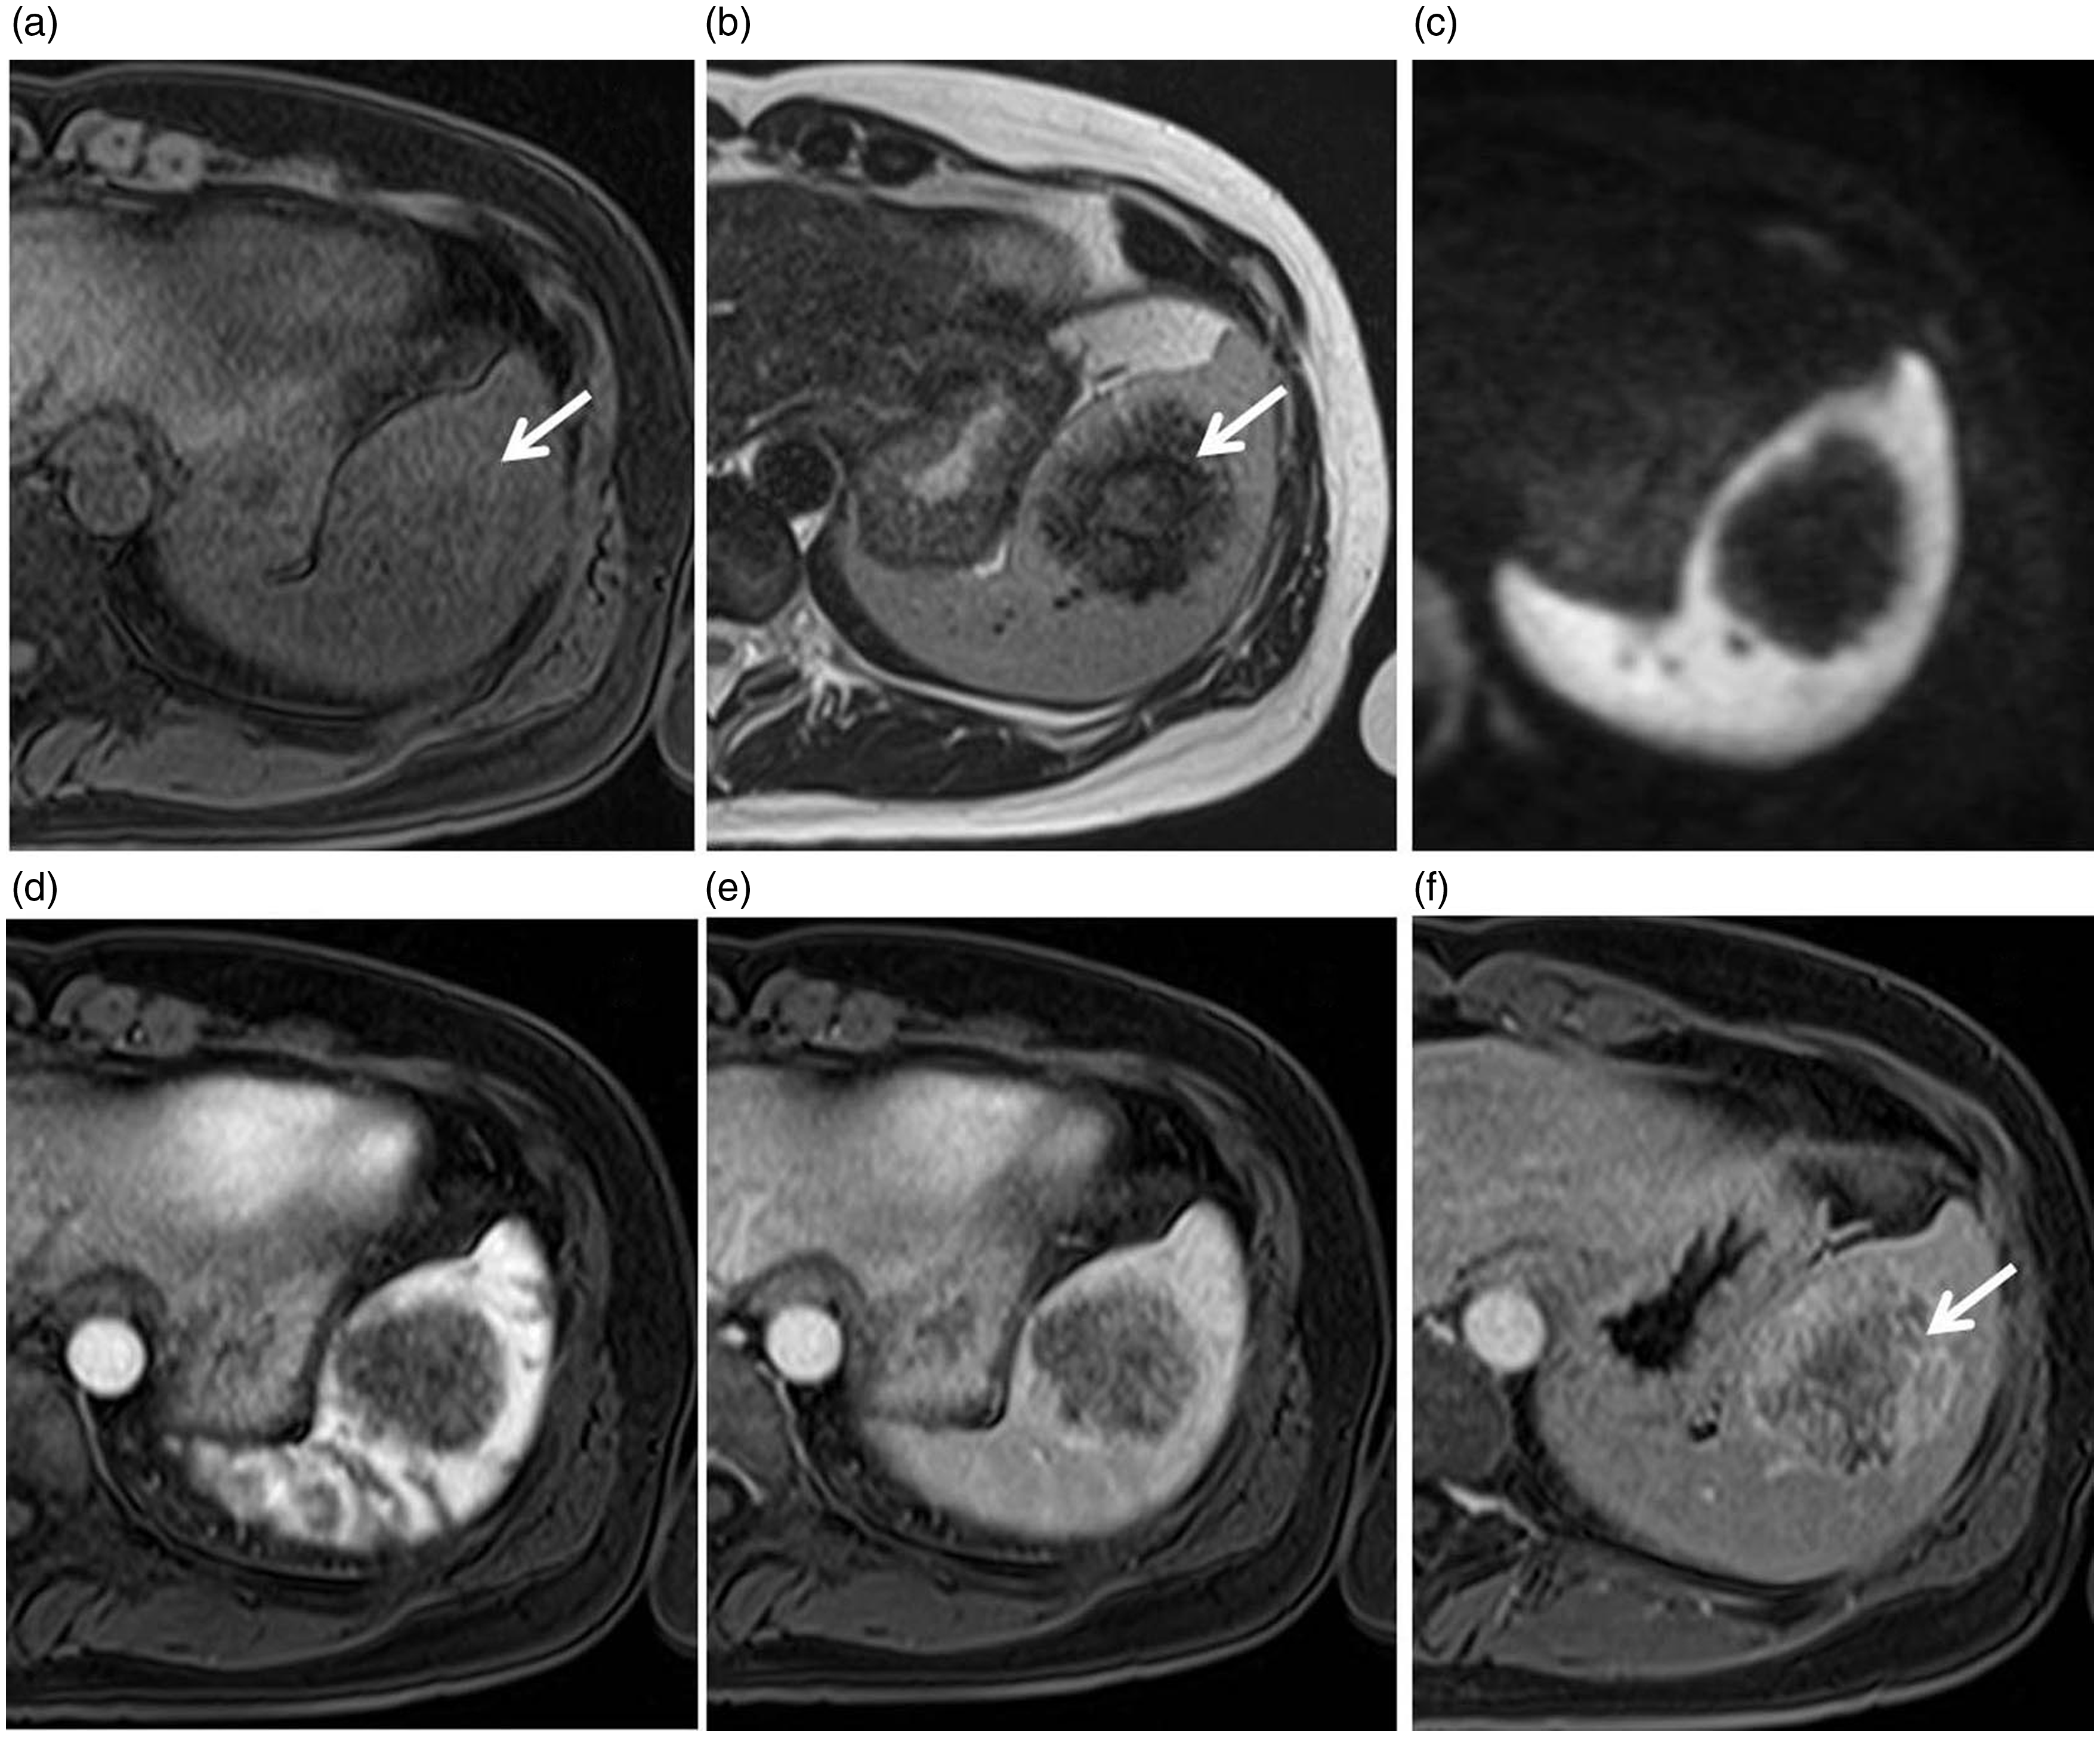
After 8 months, dynamic CT was performed. CT images revealed a low-attenuation, well-circumscribed splenic tumor (Fig. 2a) measuring 4.5 × 5 cm, with peripheral enhancements on the arterial phase image (Fig. 2b) and heterogeneous enhancements on the portal venous and delayed phase images (Fig. 2c and d). The delayed phase images showed that the lesion was progressively enhancing toward the center, and the central “scar” remained visible (Fig. 2d). MRI was simultaneously performed, which showed predominantly decreased signaling on T1-weighted (T1W) and T2-weighted (T2W) images with small areas of hyperintensity on both sequences (Fig. 3a and b). A diffusion-weighted image also showed hypointensity of the mass (Fig. 3c). Following intravenous administration of gadolinium contrast medium (gadopentetate dimeglumine, Magnevist, Bayer, Osaka, Japan), peripheral enhancement and delayed central filling of the lesion was seen with a persistent non-enhancing central hypointense focus (Fig. 3d–f). Although follow-up radiological images showed no changes in tumor characteristics or size and with a preoperative diagnosis of a benign vascular tumor, laparoscopic splenectomy was performed.
At 8-month follow-up. (a) Axial unenhanced, (b) arterial phase, (c) portal venous phase, and (d) delayed enhanced imaging of the abdomen show that (a) the splenic lesion is initially mildly hypodense compared with the normal spleen. (b) Arterial phase imaging shows marked enhancement of the periphery of the lesion with a few faintly visible septae (arrow) penetrating the center of the lesion from the periphery. (c) The portal venous phase image again shows the hypervascular rim of the lesion. (d) Delayed enhanced imaging shows that the lesion became progressively enhanced toward its center. However, the central “scar” remained visible (arrow). At 8-month follow-up. (a) T1W and (b) T2W MR images showing a lesion that is hypointense to the splenic parenchyma with a central increasingly hyperintense stellate focus (arrows). (c) Diffusion-weighted image showing also hypointense. MR images following the administration of an intravenous contrast medium. (d) Arterial phase post-contrast enhanced T1W, fat-saturated MR image showing early peripheral enhancement. (e) Portal phase showing centripetal filling. (f) Delayed phase showing progressive centripetal filling, with a persistent non-enhancing central hypointense focus (arrow).
The gross splenectomy specimen was a well-circumscribed 4.5 × 4 cm mass weighing 280 g, which was found in the anterior, upper portion of the spleen. The cut surface of the tumor was white (Fig. 4a).
(a) The cut surface of the tumor (4.5 × 4 cm) is shown. The main part of the tumor was white. The splenic lesion consisted of multiple angiomatoid nodules surrounded by variable fibrous bands (b, H&E, original magnification × 4). Immunostaining for CD34 (c, original magnification × 10), CD31 (d, original magnification × 10), and CD8 (e, original magnification × 20) is shown. Selective staining of narrow capillaries in the angiomatoid nodules is shown. Immunohistochemically, the tumor cells were weakly positive for CD68 (f, original magnification × 20).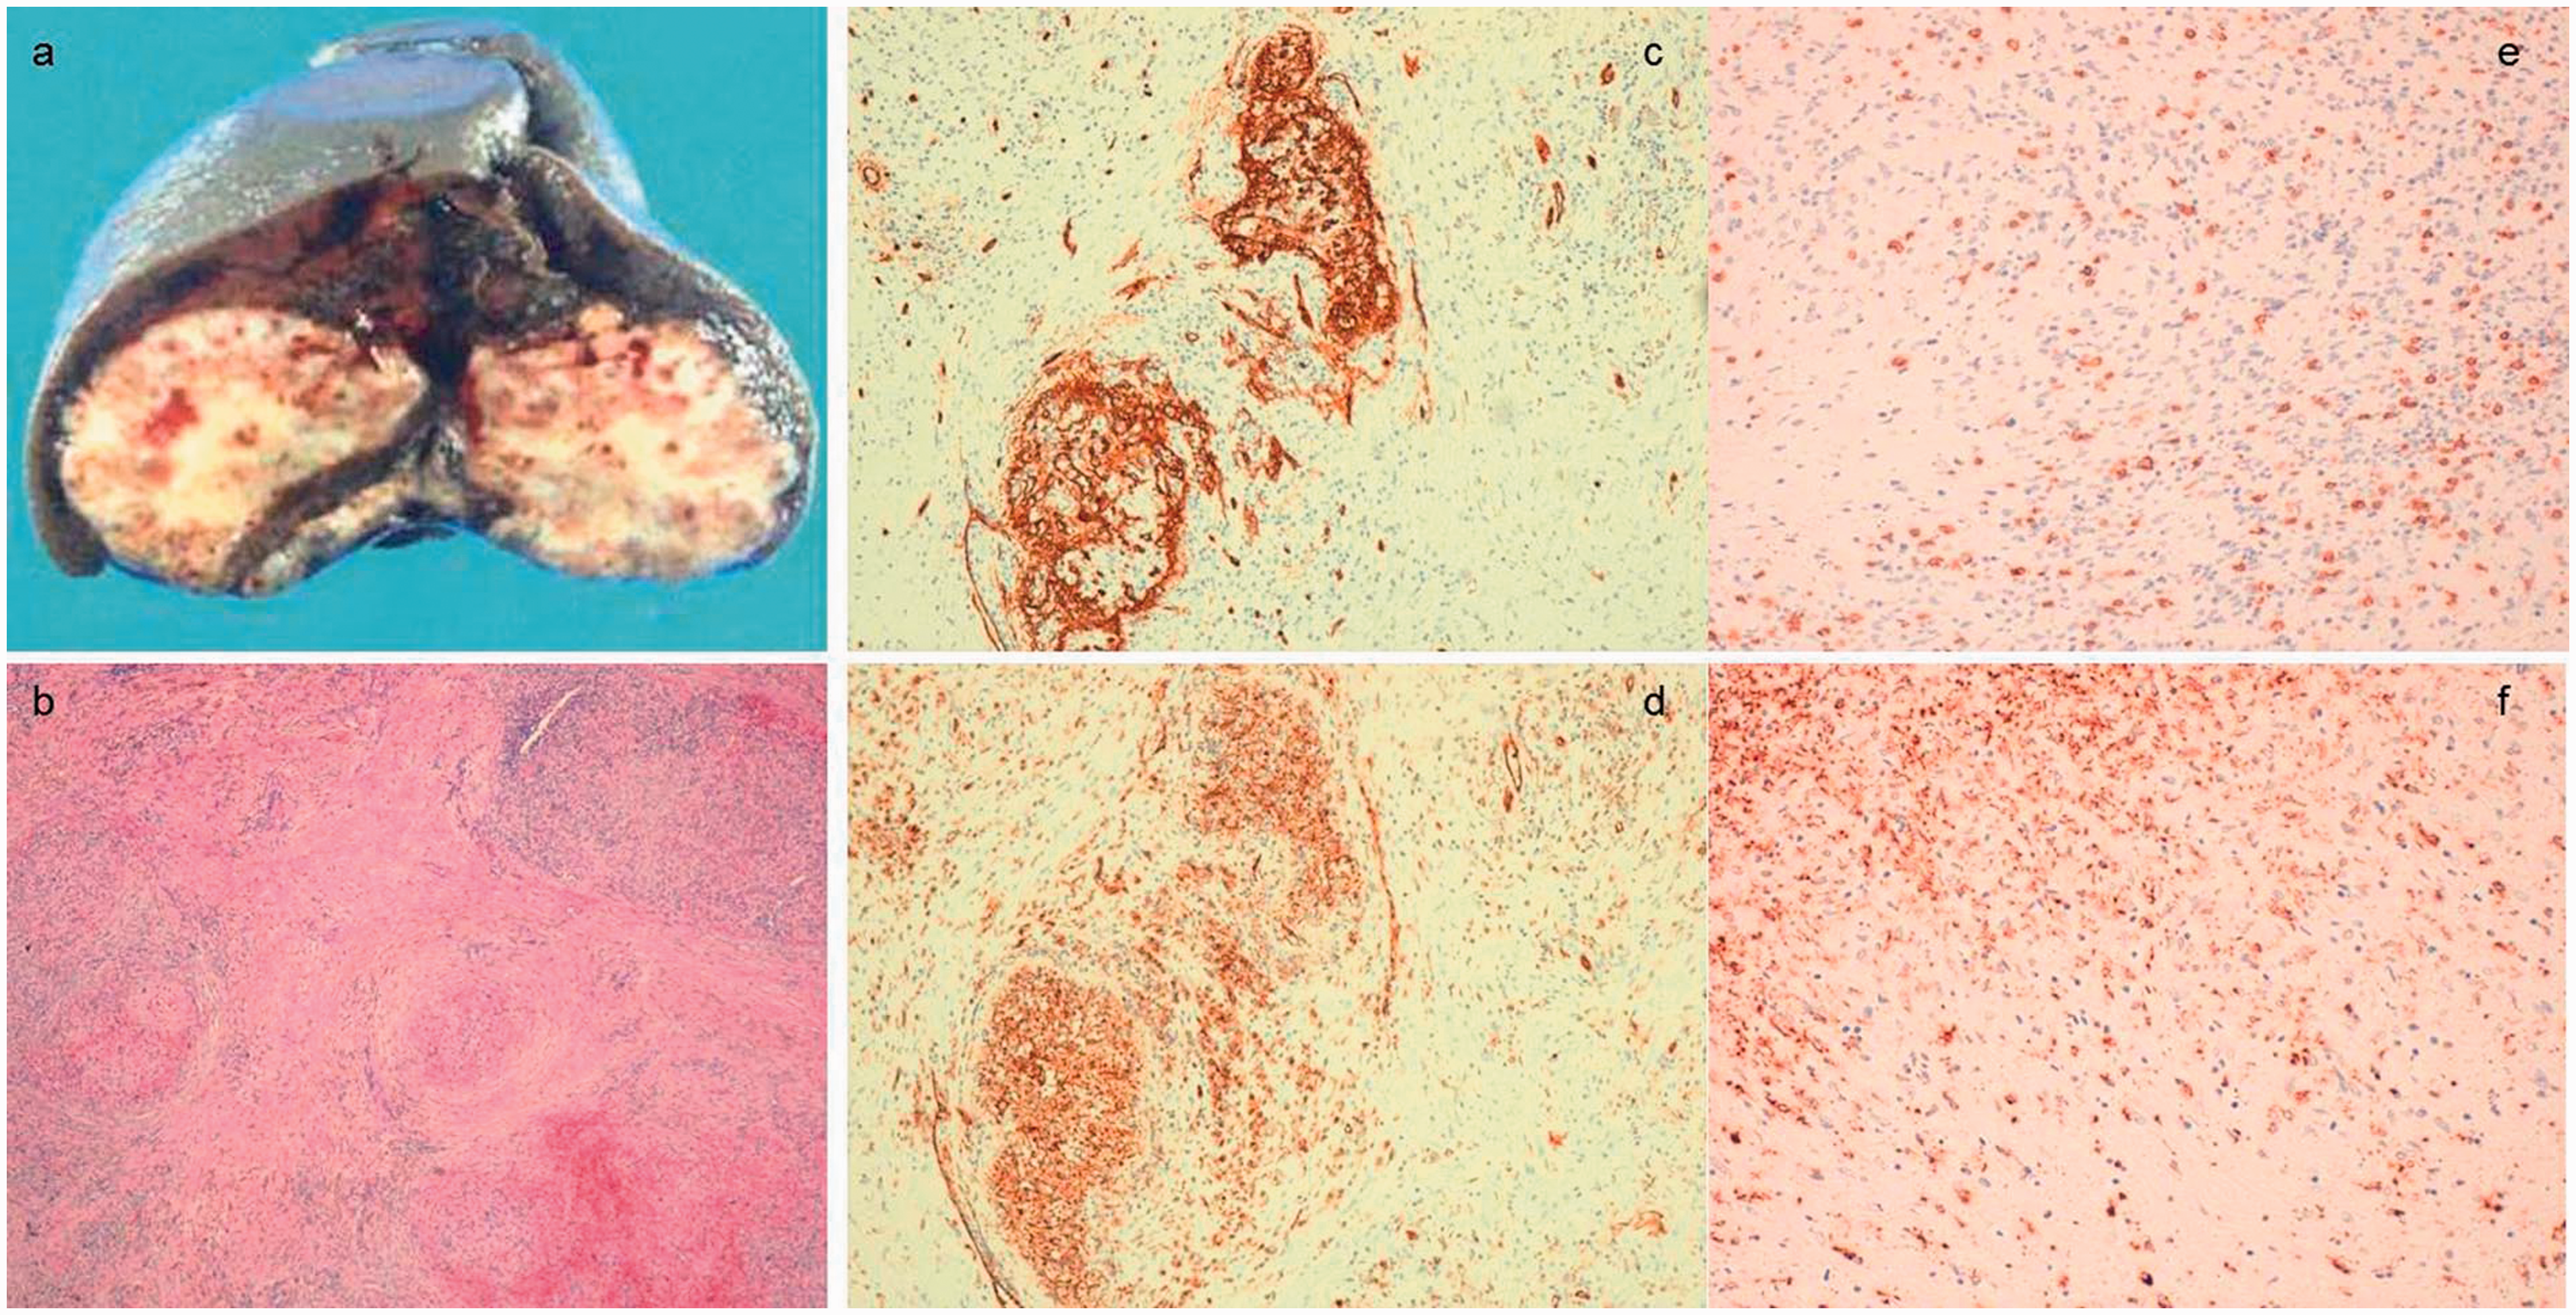
Microscopically, the tumor was composed of multiple angiomatoid nodules separated by fibrosclerotic stroma. Inflammatory cells and extravasated red blood cells were observed in the angiomatoid nodules. The fibrosclerotic stroma contained many immature myofibroblasts (Fig. 4b). Immunohistochemically, the tumor cells were positive for CD34, CD8, and CD31 (Fig. 4 c–e), weakly positive for α-smooth muscle-specific actin and CD68 (Fig. 4 f), and negative for cytokeratin and immunoglobulin G4 in angiomatoid nodules. Therefore, we diagnosed the mass as SANT. The patient is currently disease-free after 12 months of follow-up.
Discussion
Summary of the 18F-FDG/PET findings of SANT in previous reports.
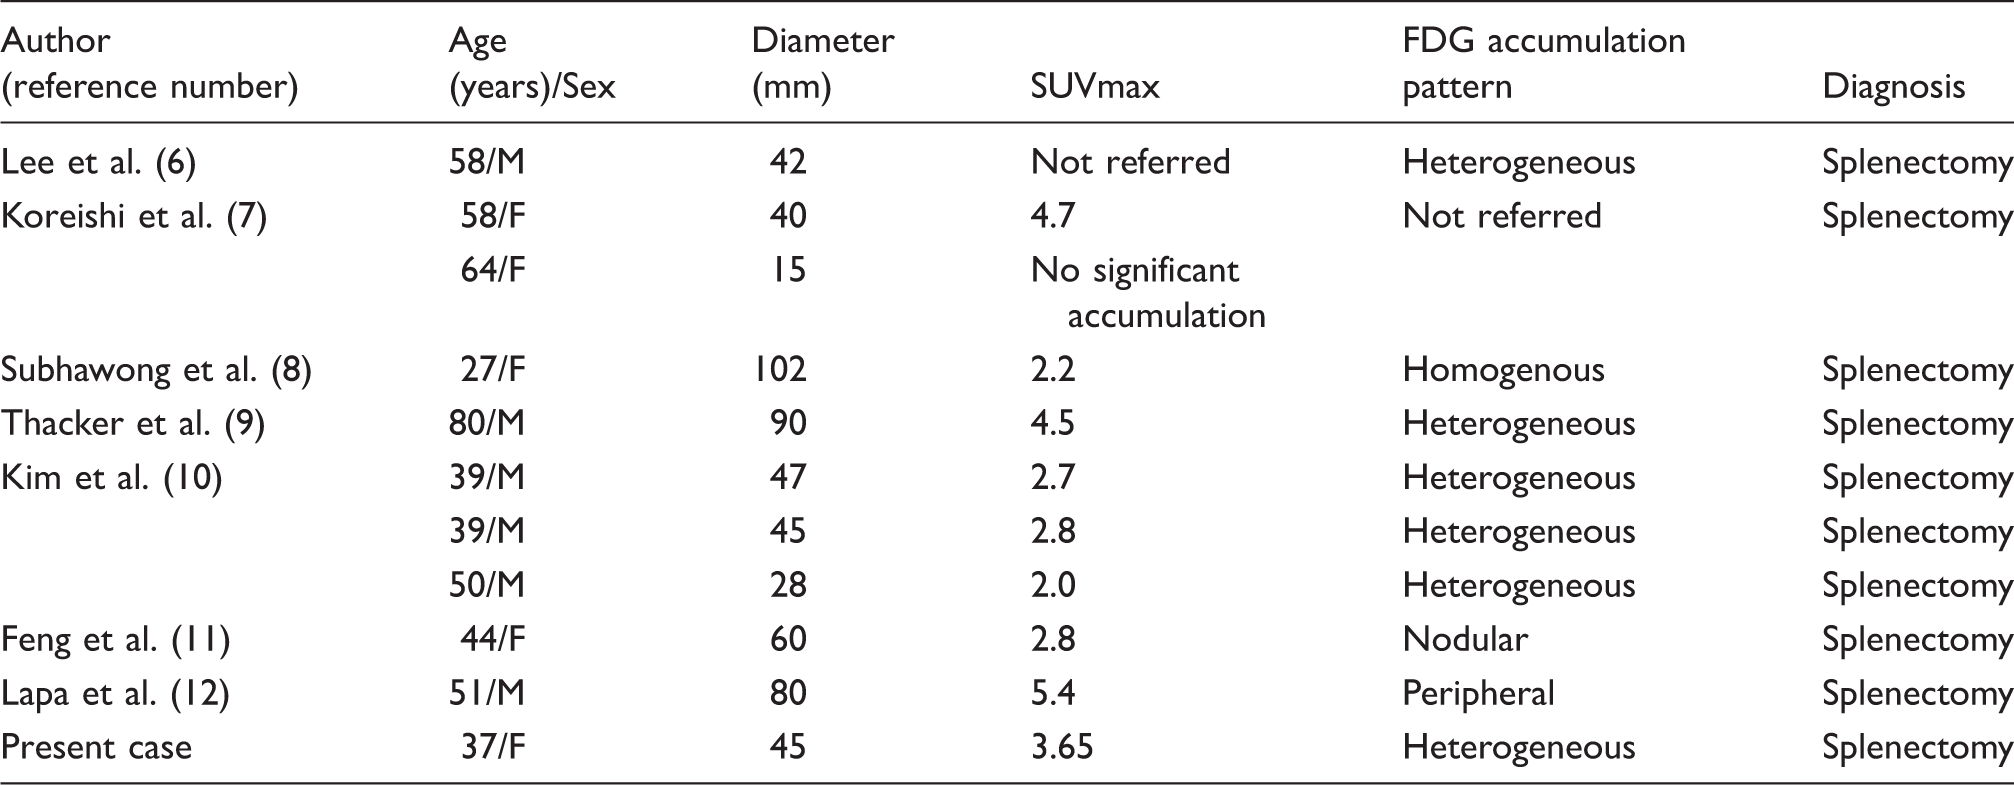
In our patient, FDG accumulation in the tumor was low and heterogeneous, with a SUVmax of 3.65, similar to that in previous reports (6–12). The low degree of FDG accumulation is reflected by the number of inflammatory cells and hemosiderin-laden macrophages in angiomatoid nodules. In fact, the mass in the present case was weakly positive for CD68 (Fig. 4f), a marker of histiocytes.
The differential diagnosis includes other benign lesions, such as hamartomas, hemangiomas, hemangioendotheliomas, littoral cell angiomas, inflammatory myofibroblastic lesions, malignant lesions, such as metastatic tumors, angiosarcomas, and lymphoma. In general, FDG uptake is high in malignant tumors and inflammatory myofibroblastic lesions; thus, the degree of FDG accumulation can be used to differentiate SANT from other malignant tumors. However, SANT cannot be easily distinguished from other benign splenic tumors based on FDG-PET/CT findings only.
Tissue samples can be obtained by either splenectomy or percutaneous biopsy. Most previous cases of SANT were diagnosed by splenectomy. The diagnosis of SANT may be established by percutaneous biopsy; however, due to the potential for an increased rate of complications associated with percutaneous biopsy of vascular lesions of the spleen and concerns regarding the possibility of spontaneous rupture of a large vascular splenic lesion, splenectomy is often the modality of choice for diagnosis and management of SANT of the spleen. However, Gutzeit et al. (13) reported the use of ultrasound-guided core needle biopsy for the diagnosis of SANT, although greater caution is required because of the higher incidence of complications associated with percutaneous biopsy of vascular spleen lesions. A meta-analysis by McInnes et al. (14) reported a major complication rate of 2.2% for biopsies performed with an ≤ 18-gauge needle, which is similar to that reported for biopsies of the liver and kidney. Moreover, image-guided percutaneous biopsy demonstrated a high degree of diagnostic accuracy (sensitivity, 87.0%; specificity, 96.4%).
SANT is benign with no recurrence or malignant alteration in cases reported thus far. Image-guided biopsy might be a potential diagnostic option.
In conclusion, we report a case of a SANT of the spleen and its features on FDG-PET/CT. When a patient presents with a splenic tumor with low FDG accumulation, SANT should be considered in addition to other vascular tumors. Familiarity with cross-sectional imaging findings will help the clinician to make an accurate diagnosis.
Footnotes
Declaration of conflicting interests
The author(s) declared no potential conflicts of interest with respect to the research, authorship, and/or publication of this article.
Funding
The author(s) received no financial support for the research, authorship, and/or publication of this article.