
Abstract
Background
18F-2-fluoro-2-deoxy-D-glucose (FDG) positron emission tomography (PET)/ computed tomography (CT) imaging demands guidelines to safeguard sufficient image quality at low radiation exposure. Various FDG dose regimes have been investigated; however, body weight-adapted dose regimens and related image quality (IQ) have not yet been compared in the same patient.
Purpose
To investigate the relationship between FDG dosage and image quality in PET/CT in the same patient and determine prerequisites for low dosage scanning.
Material and Methods
This study included 61 patients undergoing a clinically indicated PET/CT imaging study and follow-up with a normal (NDS, 5 MBq/kg body weight [BW]) and low dosage scanning protocol (LDS, 4 MBq/kg BW), respectively, using a Discovery VCT64 scanner. Two blinded and independent readers randomly assessed IQ of PET using a 5-point Likert scale and signal-to-noise ratio (SNR) of the liver.
Results
Body mass index (BMI) was significantly lower at LDS (P = 0.021) and represented a significant predictor of SNR at both NDS (P < 0.001) and LDS (P = 0.005). NDS with a mean administered activity of 340 MBq resulted in significantly higher IQ (P < 0.001) and SNR as compared with LDS with a mean of 264 MBq (F-value = 23.5, P < 0.001, mixed model ANOVA adjusted for covariate BMI). Non-diagnostic IQ at LDS was associated with a BMI > 22 kg/m2.
Conclusion
FDG dosage significantly predicts IQ and SNR in PET/CT imaging as demonstrated in the same patient with optimal IQ achieved at 5 MBq/kg BM. PET/CT imaging at 4 MBq/kg BW may only be recommended in patients with a BMI ≤ 22 kg/m2 to maintain diagnostic IQ.
Keywords
Introduction
The increasing use of 18F-2-fluoro-2-deoxy-D-glucose (FDG) positron emission tomography (PET)/ computed tomography (CT) imaging in cancer staging revealed a rising demand for guidelines in order to guarantee procedure safety and diagnostic quality (1). Regarding dosage regimens, different approaches exist recommending either the administration of absolute (2) or relative, i.e. body weight (BW)-adapted FDG dosages (3). The latter approach factors the need for higher administered activities in patients with an elevated body mass index (BMI) (4). Diagnostic image quality (IQ) is guaranteed and paralleled by a radiation burden which is “as low as reasonably achievable” according to the ALARA principle.
Many studies have not only explored into different acquisition parameters (5–8) but also compared the IQ of a wide range of FDG dosages (9,10). All of the aforementioned studies are, however, biased by the inter-individual variability among different patient cohorts. Last but not least, there is limited agreement on the relative FDG dosage that has to be administered in BW-adapted FDG dosage regimens (3).
The aim of this study was to investigate into the relationship between FDG dosage and IQ in PET/CT in the same patient and to determine prerequisites for low dosage scanning.
Material and Methods
This single center observational cohort study was approved by the review board of our institution, and informed consent was waived due to the retrospective nature of the study.
Patients
Imaging studies obtained between November 2012 and August 2013 were reviewed to
identify patients who had undergone PET/CT with normal dosage scanning (NDS),
i.e. FDG-dosage of 5 MBq/kg BW (n = 167) and low dosage
scanning (LDS), i.e. FDG-dosage of 4 MBq/kg BW (n = 86) during
follow-up (time interval, 133 ± 63days). Patients were included when neither
electronic patient chart (i.e. abnormal laboratory findings, ultrasound,
magnetic resonance imaging) nor PET/CT imaging (i.e. PET with NDS, low-dose CT
for attenuation correction, and/or additional contrast-enhanced abdominal CT
studies) indicated any evidence of focal or diffuse hepatic disease
(n = 73). Patients were excluded when suffering from
diabetes mellitus (n = 11), incidental paravenous injections
(n = 0), or when follow-up PET/CT imaging with LDS newly
demonstrated hepatic disease (n = 1). The final sample size
consisted of 61 patients (27 women; mean age, 60 ± 14 years; age range, 25–84
years; Fig. 1). Patients
suffered from head-and-neck (n = 15), breast
(n = 10), lung (n = 9), or
gastrointestinal (n = 7), gynecological
(n = 3), urological cancer (n = 1), or
melanoma (n = 7), lymphoma (n = 5), and
sarcoma (n = 4). Flowchart of the study
design.
PET/CT imaging
After 4 h of fasting prior to PET/CT, BW, height, and glucose levels were measured. After the intravenous injection of FDG, patients were resting for 60 min. Data were acquired on a Discovery VCT64 scanner (GE Healthcare, Milwaukee, WI, USA) employing bismuth germanate (BGO) scintillators. The patient was in supine position with arms overhead.
Low-dose CT was acquired with the following parameters: tube voltage, 140 kVp; tube current time product, 10–80 mAs/slice; pitch, 1.4; collimation, 64 × 0.625 mm; rotation time, 0.5 ms; and field of view (FOV), 50 cm; reconstructed slice thickness, 3.75 mm; increment, 3.0 mm. PET data were acquired using the three-dimensional (3D) mode with a fixed scan duration of 2 min per bed position. Emission data were corrected for randoms, dead time, scatter, and attenuation; reconstruction was performed using a standard iterative ordered subset expectation maximization (OSEM, 8 iterations, 16 subsets) 3D algorithm; matrix size, 256 × 256.
Subjective IQ
Anonymized images were evaluated by two experienced readers (with 10 and 4 years of experience). Both readers blinded to patient data (i.e. glucose levels, reason of referral, dosage regimens) independently evaluated all studies in random order on a dedicated workstation (Advantage Windows, version 4.6; GE Healthcare).
Subjective IQ of axial and coronal PET/CT was rated on maximum intensity projection (MIP) of PET. Semi-quantitative assessment was performed with a 5-point Likert scale (9): score of 5, excellent IQ without any apprehensible image noise and with completely homogenous PET signal in the liver; score of 4, good IQ but locally non-uniform PET signal; score of 3, moderate IQ with image noise leading to a globally non-uniform signal reducing the confidence in the diagnostic assessment; score of 2, poor IQ with patchy signal interspaced with reduced background activity mimicking focal hepatic disease; score of 1, deficient IQ with massive signal inhomogeneity considered inadequate for any diagnostic use. Scores of 5 and 4 were considered valid for diagnostic purposes, whereas scores of 1–3 were considered of non-diagnostic quality. Exams were not repeated due to the retrospective nature of evaluation.
Objective IQ
Objective IQ readout was performed 2 weeks after the subjective quality ratings. Both readers blinded to patient data and results of subjective IQ analyses independently assessed the objective IQ. Mean activity and corresponding standard deviation (SD) were measured using electronic calipers. Spherical shaped volumes of interest (VOI, 195 ± 74 mL; 51–470 mL) were placed within the liver. Maximum VOI volume and placement was confirmed on 3D reformats (11). Signal and image noise were defined as the mean activity concentration and corresponding standard deviation (SD), respectively (12). Signal-to-noise ratio (SNR) was calculated as the ratio of mean activity concentration to SD (10). SUV was not used for objective IQ measurements to avoid the effect of normalization to BW as we used a BW-adapted dose regimen.
Statistical analysis
Continuous variables were expressed as mean ± SD, categorical variables as frequencies and percentages. The Student’s t-test for related samples was used to assess for any change in patient demographics.
To test for inter-reader agreement, measurements of both readers were compared. Consensus reading was appended in any case of disagreement. To test for intra-reader agreement of subjective and objective IQ-ratings, respectively, the first author re-evaluated 20 randomly selected imaging studies 6 weeks after the initial readout to avoid memory bias. Because of the excellent inter-reader agreement, mean measurements were taken for further analysis. The intra- and inter-reader agreements regarding subjective and objective IQ were analyzed by kappa-statistics and intra-class correlation coefficients (ICC), respectively (13).
Subjective IQ between NDS and LDS was compared with using the Wilcoxon signed rank test. Differences in objective IQ were assessed using the Student’s t-test for related samples. Correlation between subjective IQ and SNR was evaluated using the Spearman’s rank test.
A mixed model ANOVA was performed to assess the dependency of SNR from FDG dosage before and after adjustments for significant covariates (i.e. BMI as demonstrated during univariate testing) and the patient as a random factor.
A P value of < 0.05 was considered statistically significant. Statistical analyses were performed using commercially available software (IBM SPSS Statistics, Version 21.0. IBM Corp., Armonk, NY, USA). Relationships of SNR and BMI at NDS and LDS were evaluated using smooth functions with automatic smoothing parameter selection using package mgcv for R (14).
Results
Patients
Patient and protocol parameters at normal (NDS) and low dosage scanning (LDS).

BMI, body mass index; FDG, 18F-2-fluoro-2-deoxy-D-glucose; n.a., not applicable.
Subjective IQ reading
The intra-reader agreement was high (kappa = 0.84, P < 0.001), inter-reader agreement was substantial (kappa = 0.68, P = 0.002).
NDS resulted in excellent imaging quality in 40/61 patients (66%) and good IQ in
21/61 patients (34%, Fig.
2). LDS resulted in an excellent IQ in 10/61 patients (16%), good IQ
in 37/61 patients (61%), moderate IQ in 13/61 patients (21%), poor IQ in 1/61
patients (2%). IQ was significantly (P < 0.001) better at
NDS as compared with LDS. All of the studies had diagnostic IQ at NDS, whereas a
total of 14/61studies (23%) at LDS demonstrated non-diagnostic IQ (Fig. 3) with all of the
latter occurring in patients with a BMI > 22 kg/m2
(n = 29, 48%). In all patients with
BMI < 21.8 kg/m2, IQ was diagnostic at LDS (Fig. 4). Bar chart demonstrating percentage
distribution of image quality of positron emission tomography at
normal (NDS) and low dosage scanning (LDS). Note the significant
(P < 0.001) decrease of image quality at
LDS. A 55-year-old female patient suffering from
gastric cancer having a BMI of 27 kg/m2 at NDS and
23 kg/m2 at LDS. (a) Axial PET image, (b) PET coronal
maximum intensity projection, and (c) fused PET/ CT image acquired
at 5 MBq/kg BW (i.e. NDS) similarly demonstrate diagnostic image
quality. Corresponding (d) axial PET image, (e) coronal maximum
intensity projection, and (f) fused PET/CT image acquired at 4
MBq/kg BW (i.e. LDS) indicate non-uniform signal distribution that
is most pronounced in the center and the left hepatic lobe. Note
focal signal inhomogeneity mimicking focal uptake (f, arrowhead)
that may reduce the confidence in diagnostic
assessment. A 51-year-old female patient with the history
of esophageal cancer and body mass index of 16 kg/m2 at
NDS and 19 kg/m2 at LDS. (a) Axial PET image, (b) coronal
maximum intensity projection, and (c) fused PET/CT image acquired at
5 MBq/kg BW (i.e. NDS) demonstrate excellent image quality.
Corresponding (d) axial PET image, (e) coronal maximum intensity
projection, and (f) fused PET/CT image acquired at 4 MBq/kg BW (i.e.
LDS) similarly demonstrate excellent image quality with completely
homogenous PET signal in the liver. Note that the diagnostic image
quality is maintained with a
BMI < 22 kg/m2.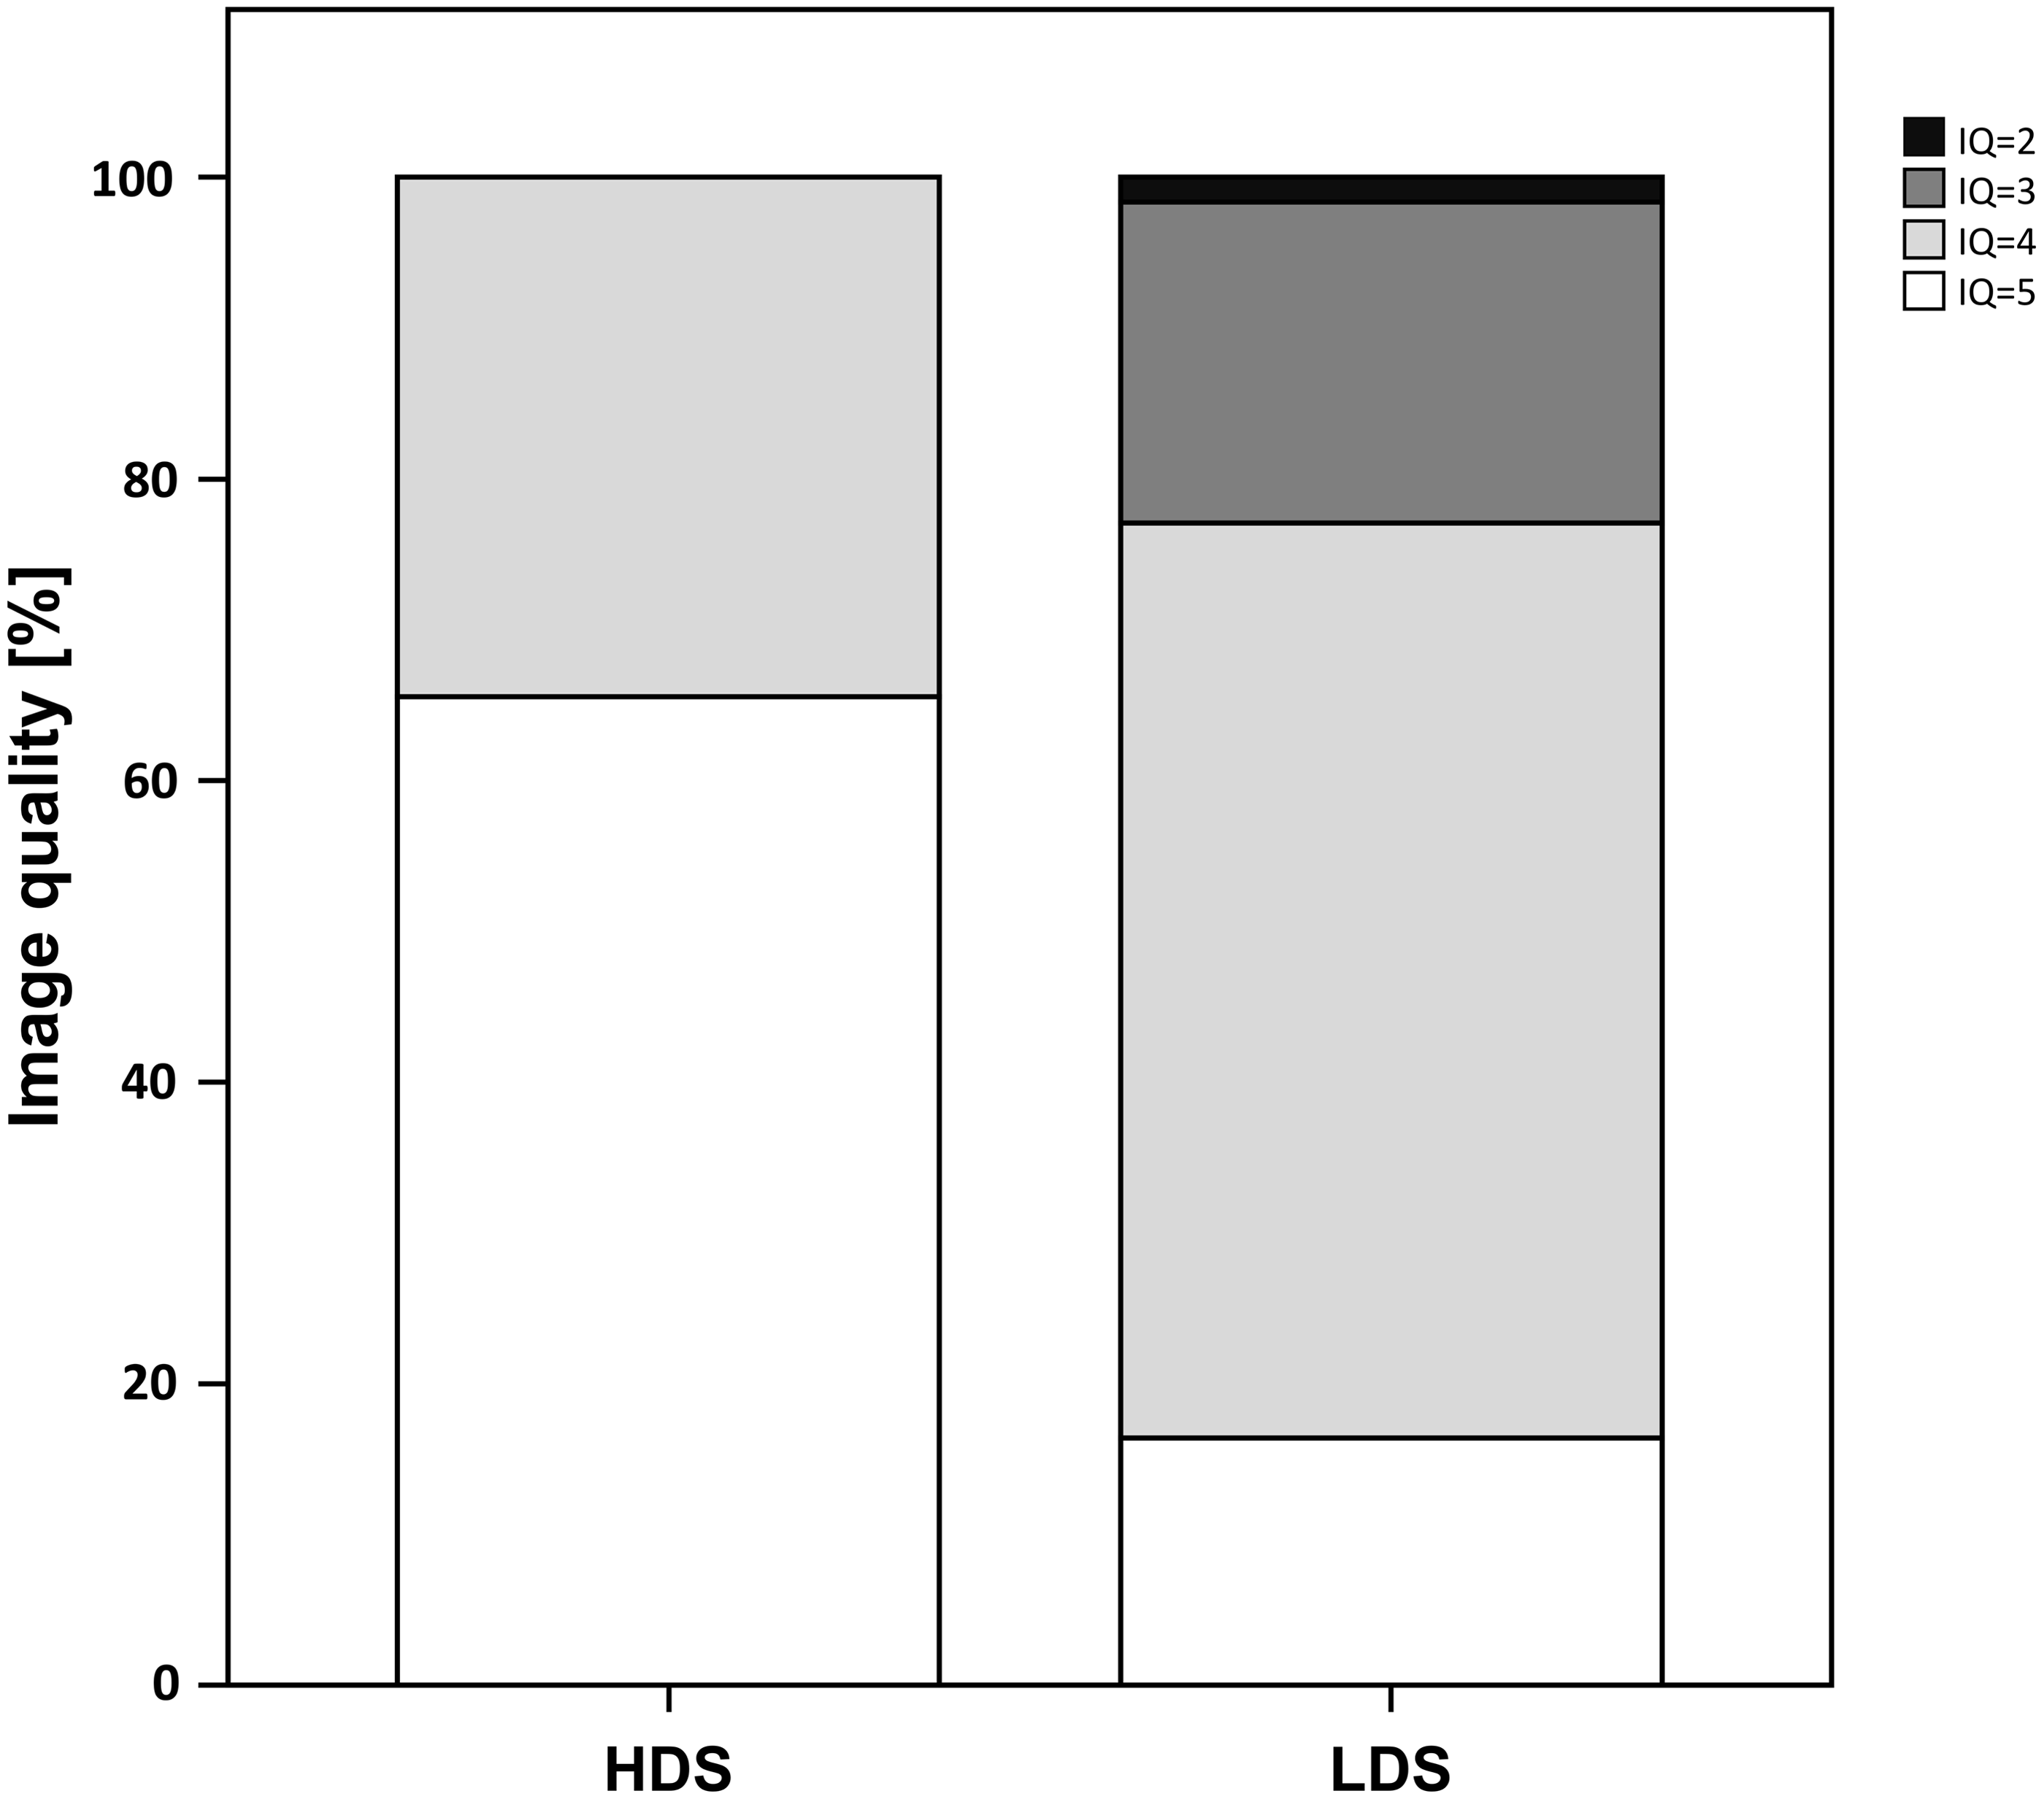


Objective IQ
Both intra- and inter-reader agreement was excellent regarding signal (both ICC = 0.99, P < 0.001) and noise measurements (ICC = 0.95 and ICC = 0.90, respectively, both P < 0.001).
There was a significant (P < 0.001) correlation between subjective IQ and SNR (rho = 0.32).
The mean signal was 7.1 ± 1.4 kBq/mL (range, 4.0–11.4 kBq/mL) at NDS and
5.7 ± 1.2 kBq/mL (range, 3.1–8.8 kBq/mL) at LDS. Mean noise was 1.0 ± 0.1 kBq/mL
(range, 0.7–1.3 kBq/mL) at NDS and 0.9 ± 0.2 kBq/mL (range, 0.5–1.2 kBq/mL) at
LDS. The mean SNR was 7.4 ± 1.3 (range, 4.8–10.7) at NDS and 6.8 ± 1.1 (range,
4.1–9.6) at LDS (Fig.
5). Signal and SNR were significantly (both
P < 0.001) higher at NDS than at LDS. The correlation
between SNR and BMI was significant at NDS (P < 0.001) and
LDS (P = 0.005). Box plots demonstrating
the signal-to-noise ratio at NDS and LDS. Note the significant
(P < 0.001) higher SNR with NDS as compared
with LDS.
Multivariate analyses demonstrated FDG dosage regimens to significantly predict
SNR in PET/CT imaging. The F-value for LDS vs. NDS increased after adjustments
for the significant covariate of BMI was performed (Table 2). When plotting the SNR to the
BMI, flattening curves were noted with minimal turning points at a BMI of
24.3 kg/m2 and 22.1 kg/m2 at NDS and LDS, respectively
(Fig. 6a and b).
Scatter plots with smoothed functions (solid
curves) and 95% confidence intervals (dashed curves) demonstrating
the relationship between SNR and BMI at (a) NDS and (b) LDS.
Δsignal-to-noise ratio represents the difference from the mean
signal to noise and allows for a valid comparison of dependencies of
SNR on BMI and thus optimal comparison among groups. Note the
flattening curves with increasing body mass indices and minimal
turning points (dotted lines) at 24.3 kg/m2 at NDS and
22.1 kg/m2 at LDS. Multivariate models for the prediction of
objective image quality in PET. Higher F-value after adjustment for the covariate body mass index
that decreased significantly after high and prior to low dosage
scanning.

Discussion
Our results demonstrate an optimal IQ at NDS with 5 MBq/kg BW. IQ at LDS was significantly inferior but maintained in smaller patients. This is underlined by the fact that the BMI represents a significant predictor of IQ. Therefore, we suggest a cutoff level of a BMI smaller than 22 kg/m2 to use a LDS protocol with 4 MBq/kg BW. This similarly minimizes the number of PET/CT studies with non-diagnostic IQ as well as the radiation burden due a by 20% reduced administered activity.
Although IQ has been demonstrated to behave dosage dependent (10), to the best of our knowledge, there are no studies which factored the high inter-subject variability of patients. In our study, the same patient underwent both NDS and LDS for a valid comparison of different dosage regimens.
Subjective IQ was significantly improved with NDS as compared with LDS. This subjective IQ was significantly correlated with the objective IQ measurements. This, however, may only hold true within certain ranges since the human eye fails to appreciate reduced noise levels beyond certain thresholds. Therefore, images were evaluated by means of both objective and subjective parameters.
A significant decrease in BMI was noted between NDS and LDS. Thus, statistical testing was corrected for BMI. When plotting the SNR to BMI, flattening of curves were found at both NDS and LDS with minimal turning at 24 kg/m2 and 22 kg/m2, respectively. These turning points represent the more than linear increased attenuation of photon transmission in larger patients (10). As a cutoff, we suggest a BMI value of 22 kg/m2 to change from LDS to NDS on the bases of subjective and objectives IQ.
The suggested cutoff value represents a valid suggestion for daily practice; however, several factors impacting on PET IQ have to be considered (1,9,15,16). Scanner performance may for instances be enhanced by improved system geometry and novel non-photomultiplier based detectors (17) and time-of-flight imaging (7,18). Different reconstruction parameters exist and IQ may further be improved by applying modifications to raw data or changing properties in the image domain (19).
Finally, the noise equivalent count rate (NECR) represents a machine dependent quality measure of PET raw data (20) that is strongly related to image noise and SNR in the reconstructed image (21,22). This allows for a comparison of IQ among PET machines, which is facilitated when the NECR is plotted to activity concentrations (23). In detail, a distinct NECR is found at different activity concentrations when various machines are used. If equal reconstruction parameters are selected, the recommended activity cutoff values for the Discovery VCT machine may be corrected for other target scanners accordingly (23).
We acknowledge the following limitations. We did not adjust for potential longitudinal scanner variability but routinely performed quality assurance and control procedures (24). We did not consider increasing acquisition times per bed position as a parameter for noise reduction as examination times are valuable and cannot be overly extended (25). Respiratory gating is known to attenuate PET/CT imaging artifacts (26), improves IQ which may translates into improved detection of lung and liver lesions (27), but is not routinely performed. Lesion detection or conspicuity was not assessed as patients with liver lesions were excluded from our study to overcome bias from confounding factors, e.g. tumor progression and/or treatment. Therefore, the risk of missing lesions at LDS could not be assessed and has to be put in relation to benefits of a reduced risk for secondary cancer from radiation dose exposure. No in-vivo dosimetry was performed to quantify the patient’s radiation exposure at LDS and NDS. Last but not least, our results are derived from a certain scanner type only but we provide a theoretical method for transferability by means of NECR to other machine types.
In conclusion, administered FDG activity significantly predicts subjective IQ and SNR in PET/CT as demonstrated in the same patient. Our data derived from both subjective and objective measurements both suggest BMI-based cutoff values for choosing FDG dosages to maintain diagnostic IQ. Given the used imaging setting, an optimal IQ was achieved at 5 MBq/kg BW, whereas PET/CT imaging at 4 MBq/kg BW can only be recommended in patients with a BMI smaller than 22 kg/m2.
Footnotes
Conflict of interest
The authors disclose that Patrick Veit-Haibach received IIS Grants from Bayer Healthcare and Siemens Medical Solutions as well as speaker fees from GE Healthcare. Gaspar Delso is an employee of GE Healthcare, Waukesha, WI, USA. Gustav von Schulthess is a grant recipient from GE Healthcare, and received speaker fees from GE Healthcare. These authors did not have control of data.