
Abstract
In Norway, all children are entitled to receive regular health checks. Child health centres for children 0–5 years old (CHC) provide these check-ups and are one of many health services that Norwegian municipalities have to offer. The aim of this study was to examine parents’ satisfaction with CHCs, and to identify predictors for the overall evaluation of the service. The sample comprised 1654 parents who visited a CHC with their children. A hierarchical multiple regression analysis was conducted to predict the overall evaluation of the service with four user satisfaction scales (i.e. User participation, Public health nurse, Accessibility, and Information). The STROBE checklist was applied. Most users were satisfied with the service (95%) and with the help they received from it (91%). All four user satisfaction scales were significant in the prediction of the overall evaluation of the service. Users of the CHC seem to be very satisfied with the service, especially with the public health nurse.
Introduction
Child health centres for children 0–5 years old (CHC) are low-threshold, free of charge, and universal health services for children and their families that every municipality in Norway has to offer to their inhabitants. 1 The purpose of the service is to carry out health-promoting and preventive work for children aged 0–5 years and their parents or caregivers, including pregnant women. The aim of the service is to contribute to promoting mental and physical health and good social conditions. It aims to prevent social inequalities, illness, and injuries. Another task of this service is to contribute to the prevention and detection of abuse and neglect. 2
According to national guidelines, each CHC offers 14 age-specific consultations from the time a child is born until they are five years old. 3 There are, for example, instructions about which health examinations and vaccines must be carried out at each consultation, and which health information and guidance should be given to the parents or caregivers. Physical examinations are conducted to see whether the child is developing as expected and include, for example, the measurement of the child’s weight and height but also sight and hearing tests in addition to language development and oral examinations. Furthermore, public health nurses should provide guidance within topics such as diet, psychomotor development, and tobacco and alcohol use. In Norway, public health nurses are nurses with an additional education in health promotion and disease prevention aimed at children and their families. Some of their tasks include conducting physical examinations and giving advice regarding health and upbringing to children and their families. 4 As the parents’ or caregivers’ mental health can affect their ability to care for the child, they will be asked about their mental health. In addition to the public health nurse who usually conducts the consultations, a medical doctor at the health centre examines the child’s physical health at six weeks, six months, one year, and two years. 3
CHC are one of several universal health services every municipality in Norway has to offer for the follow-up of children’s health and development from before the child is born until they turn 20 years old. 1 This health-promoting and preventive work also includes working with the child’s family to ensure the best home environment that facilitates healthy development. The other services include maternity care, school health service, and health centres for young people up to the age of 20 years. In addition to the universal health services for children and their families, Norwegian municipalities have to offer educational-psychological services for children with special needs in kindergartens and schools 5 , 6 and child protection services. 7
While the above-mentioned municipal health services are required by law, municipalities can decide themselves how they want to organize these services. One model for organizing these services is the Family House model, which has a strong focus on interdisciplinary collaboration between services and occupational groups. The most common services included in the Family House model are the health centre, maternity care, educational-psychological services, and child welfare services but the composition of services can vary from municipality to municipality. 8 The model can be described as a house consisting of a foundation and three floors. The foundation is based on professional competence. The first floor consists of universal, health-promoting and preventive health services such as the open kindergarten, the health centre, and maternity care. Families who are at increased risk will be discovered here and referred to the second or third floor. The second floor is a selective offer for families with a slightly increased risk, where they can, for example, participate in group offers for young mothers or where they receive closer follow-ups of children with mentally sick parents. The families who are at high risk, show early symptoms or need for follow-up are referred to the third floor, where they will get an indicated offer based on their needs. 8
Like the other municipal health services, the CHC are required to systematically work on improving their service quality. 9 , 10 According to the Norwegian Directorate of Health, ‘Services of good quality are effective, safe and secure, involve users and give them influence, are coordinated and characterized by continuity, utilize resources in a good way, are available and distributed fairly’. 9 Service quality can be assessed through quality indicators, self- or third-party evaluations, supervision or inspections, and through user satisfaction surveys. 11 The latter is a useful tool to assess, to some extent, the effectiveness of the service and the users’ experiences of their involvement and influence, coordination and continuity, and availability of services. From the user’s perspective, service quality is the extent to which their expectations match the actual received service. 12 Users’ expectations include the ‘result of the treatment, absence of unwanted events or injuries, waiting time, geographical proximity to the services, options, information, possibility of participation, the behaviour of the health and care personnel, other matters related to service’. 11 While some municipalities conduct user satisfaction surveys locally in their CHC, there is, to the best of our knowledge, no research published. The lack of research in this field indicates the need for conducting the current study, especially because of the potential importance of this topic as indicated by related studies. 13 While two studies found a relationship between parental satisfaction and treatment outcome in a child and adolescent mental health service 14 and in a child psychiatric hospital, 15 another study did not find such a relationship in children’s mental health clinics. 16 A review states ‘Patient satisfaction with hospital services is one of the most important indicators of effectiveness and quality of hospital services’. 17 (p.1460) Similarly, a study conducted in Mexico found a relationship between patient satisfaction and service quality. 18 Another study found that patients are more satisfied with the nursing care than with the information they were given. 19 The findings from these studies may be less relevant to our target group as they include adult patients and not parents of children from the general population. A user satisfaction study of caregivers who visited open kindergartens in 11 municipalities in Norway that is part of the current study, found that the physical environment, the staff at the open kindergarten, and the benefits for the child and the caregivers at the open kindergarten, were significant predictors for the overall satisfaction with the service. 20 These findings are relevant for the current study since both the CHC and open kindergartens are low-threshold universal services with overlapping user groups.
Study aim
The aim of this study was to examine parent or caregiver satisfaction with the CHC in Norwegian municipalities. Another aim of the study was to identify predictors of the overall evaluation of the CHC.
Method
The current study uses cross-sectional data and is based on questionnaires that were filled out by 1654 users of 46 participating CHC in 27 municipalities in Norway. The STROBE checklist for cross-sectional studies was followed. 21
Participants and procedure
The current study is part of a larger study called ‘Collaboration and service quality in municipal services for children, adolescents, and their families in Norwegian municipalities’ (the SKO Study). The SKO Study is a longitudinal study that examines employee well-being, service collaboration and quality by conducting employee surveys as well as user satisfaction surveys in different municipal health services for children and their families in Norway. One of the aims of the SKO Study is to examine how satisfied parents or caregivers are with the services the municipalities provide to children and families. The current study uses data from all user satisfaction surveys that were conducted at 46 health centres for children 0–5 years old in 27 municipalities in the whole of Norway that participated in the SKO Study. 20 , 22
Participating CHC received the necessary materials including employee information letters about the SKO Study with recommendations or instructions about the practical execution of the user satisfaction surveys. The materials also included general information material for users such as posters, in addition to prepared user envelopes containing the survey, an information letter, and a pre-paid envelope addressed to the university. 20 All parents or caregivers of children who were followed up by the CHC in 27 participating municipalities were asked to fill out a questionnaire on paper or online. Data collection took place between September 2015 and January 2020 in the different municipalities or services. A total of 11 municipalities had two or more health centres for children 0–5 years old. In most cases, the CHC was part of a Family House, representing one of many health services for children and their families. Each data collection period lasted on average approximately five weeks per service. Of the 27 municipalities, 23 provided information about the response rate. The response rate varied from 22% to 92% between the municipalities. The total number of questionnaires that were distributed in the different services was about 2941, and 1654 users filled in the questionnaire (response rate = 56%; Table 1).
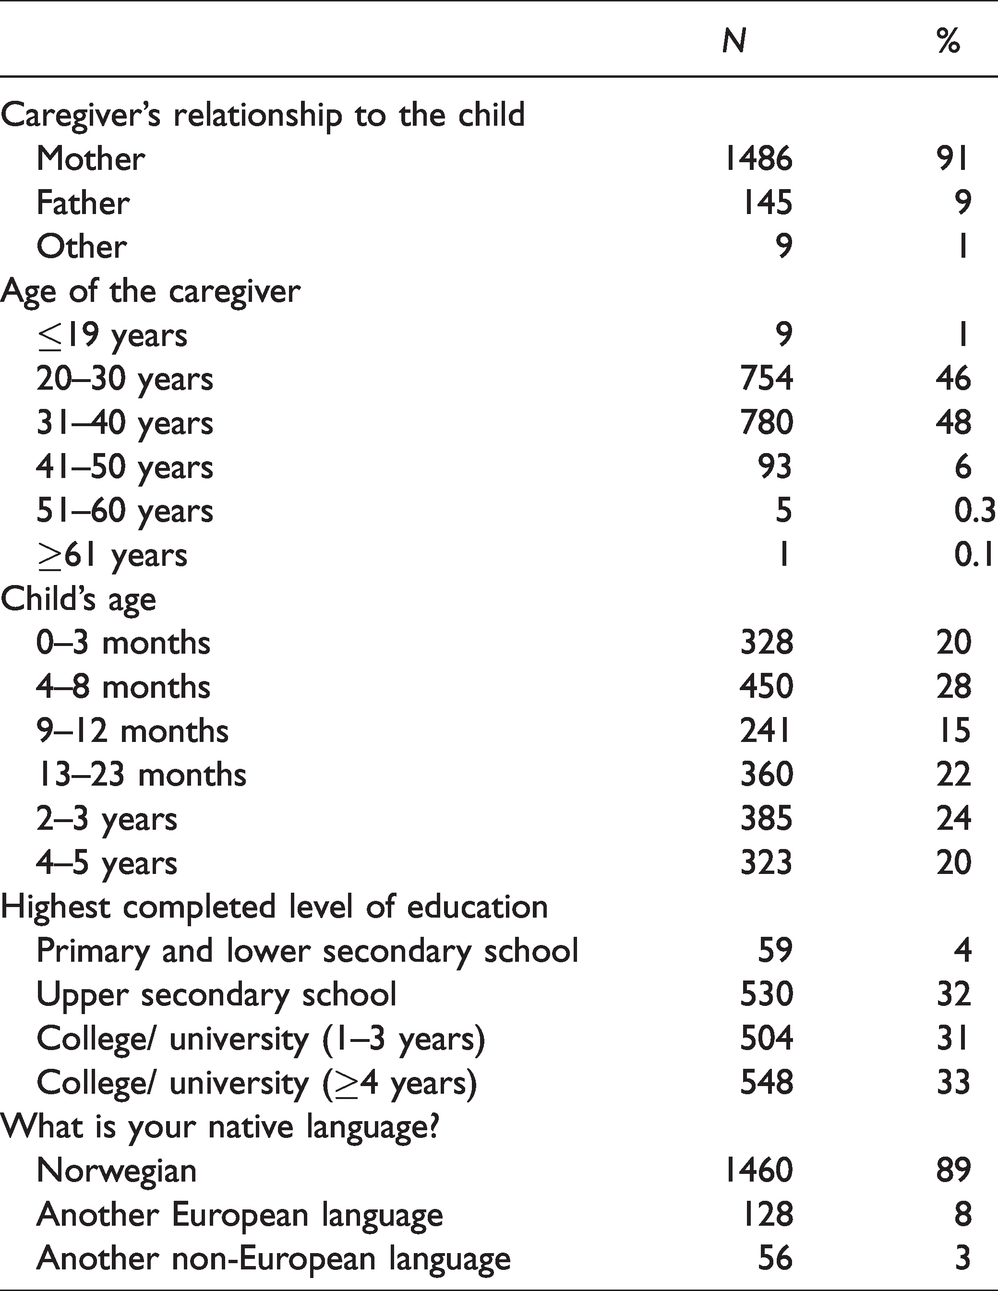
Characteristics of the study sample (N = 1640–1644).
This article is based on a previously conducted master’s thesis that examined parental satisfaction with the child health centres for children 0–5 years old in the 12 northernmost municipalities that participated in the SKO Study. 23
Ethical considerations
The questions used in the user survey are not know to lead to discomfort. The SKO Study was approved by NSD (Norwegian Centre for Research Data). Participants received the questionnaire together with an information letter that was in accordance with the recommendations from NSD. The information letter included information about the background of the survey, the fact that study participation was voluntary and anonymous, and about how the collected data would be handled.
Instruments
The questionnaire consisted of 52 questions in addition to a comment field and was available in Norwegian and English. The survey items were adapted from the National Knowledge Centre for the Health Service (Kunnskapssenteret), a questionnaire developed by Vedeler 24 in connection with a user survey of open kindergartens, and a digital tool, www.bedrekommune.no, developed by the Norwegian Association of Local and Regional Authorities (KS) and Kommuneforlaget.
Of the 52 questions the first three were used to identify the service (e.g. name of municipality). A total of 25 questions were theoretically grouped into five topics around 1) user participation, 2) accessibility, 3) public health nurse, 4) information, and 5) overall evaluation of the service. An exploratory factor analysis (principal components analysis with varimax rotation) was conducted and identified four factors that reproduced the four scales User participation, Accessibility, Public health nurse, and Information. We chose to keep the fifth scale ‘Overall evaluation of the service’ because it consisted of two questions that loaded relatively low and on multiple scales.
The scale User participation consisted of two items (e.g. ‘To what extent is the public health nurse receptive to your needs/wishes?’), with a five-point rating scale ranging from 1, ‘Not at all’ to 5, ‘To a very great extent’. The scale Accessibility consisted of five items (e.g. ‘To what extent are you satisfied with the opening hours of the child healthcare clinic?’), with a five-point rating scale ranging from 1, ‘Not at all’ to 5, ‘To a very great extent’. The scale Public health nurse consisted of 11 items (e.g. ‘When you visit the child healthcare centre, to what extent do you feel that you are met with courtesy and respect by the public health nurse?’), with a five-point rating scale ranging from 1, ‘Not at all’ to 5, ‘To a very great extent’. The scale Information consisted of five items (e.g. ‘To what extent are you satisfied with information about your child's development?’), with a five-point rating scale ranging from 1, ‘Not at all’ to 5, ‘To a very great extent’. The scale Overall evaluation of the service consisted of two general questions, that is ‘Overall, how dissatisfied or satisfied are you with the child healthcare centre?’ answered on a five-point scale from 1, ‘Very dissatisfied’ to 5, ‘Very satisfied’, and ‘Overall, to what extent would you say that you receive the help you need from the child healthcare centre?’ with a five-point rating scale ranging from 1, ‘Not at all’ to 5, ‘To a very great extent’.
There were also two questions about collaboration, that is ‘Has your child received help from other public services (e.g. pedagogic-psychological services, physiotherapist, child and adolescent mental health services, etc.)?’ with the answer categories ‘yes’ and ‘no’ and a follow-up question, ‘If yes, to what extent are you satisfied with the child healthcare centre’s cooperation with the relevant services?’, answered on a five-point scale from 1, ‘Very dissatisfied’ to 5, ‘Very satisfied’.
Finally, there were ten demographic questions asking about the participant’s role related to the child (mother, father, other), gender (male, female), age (19 years or younger, 20–30 years, 31–40 years, 41–50 years, 51–60 years, 61 years or older), number of children in the household, the child’s age (0–3 months, 4–8 months, 9–12 months, 13–23 months, 2–3 years, 4–5 years), marital status (married/cohabiting or not), completed education (‘primary and lower secondary school’, ‘upper secondary school’, ‘college/university (1–3 year)’, or ‘college/university (4 years or longer)’), mother tongue (Norwegian, other European language and non-European language, as well as specification of mother tongue no. 1 and 2), and occupational status (‘employed’, ‘on leave’, ‘in education’, ‘unemployed, off sick, on disability allowance or rehabilitation’, or ‘homemaker’).
Statistical analyses
SPSS 26 was used to conduct the statistical analyses, which included frequency distributions for the different survey items, correlations between variables, and Cronbach’s alpha for survey scales. To improve the readability of the results of the frequency distributions, answer categories 1 and 2, and 4 and 5 were combined. In accordance with the guidelines from the European Federation of Psychologist Associations, 25 Cronbach’s alpha values of .70 or above were considered adequate.
Hierarchical regression analysis was conducted to predict the user’s overall evaluation of the service. There was no need to use a multilevel approach since the intraclass correlation coefficient was .02, indicating that only a small proportion of the variance was explained by the grouping variable (i.e. municipality). In a first step, selected demographic characteristics were entered to the model, that is, role in relation to child (mother = 0 and father = 1), age of the caregiver, at least one child younger than 2 years (no = 0 and yes = 1), education of the caregiver (lower education = 0 and higher education = 1) and language (other than Norwegian = 0 and Norwegian = 1). In a second step, the four predictors, that is, User participation, Accessibility, Public health nurse, and Information, were added to the demographic characteristics.
Results
Among the users of the CHC who filled in a user survey were 1486 mothers (91%) and 145 fathers (9%; see Table 1 for an overview of demographic information). Most of the participants were aged 20–40 years (n = 1534; 66%), accompanied children under the age of 2 years to the child health centre (n = 1379; 85%), and had a university degree (n = 1052; 64%).
Satisfaction with the child health centres
Almost all users found that the information they receive at the child health centre is easy to understand and that the public health nurse meets them with courtesy and respect (98%, respectively; see Table 2). Also, almost all users state that the public health nurse shows consideration towards the child (97%) and that the public health nurse cooperates well with them (96%). Fewer users have asked the public health nurse for advice regarding the upbringing of the child (54%), and only 64% state that they could influence the support from the child health centre. When it comes to the overall evaluation of the child health care centre for children 0–5 years old, however, over 90% are satisfied with the service and feel that they receive the help they need.
Frequency distribution of responses to survey items by user satisfaction scales.
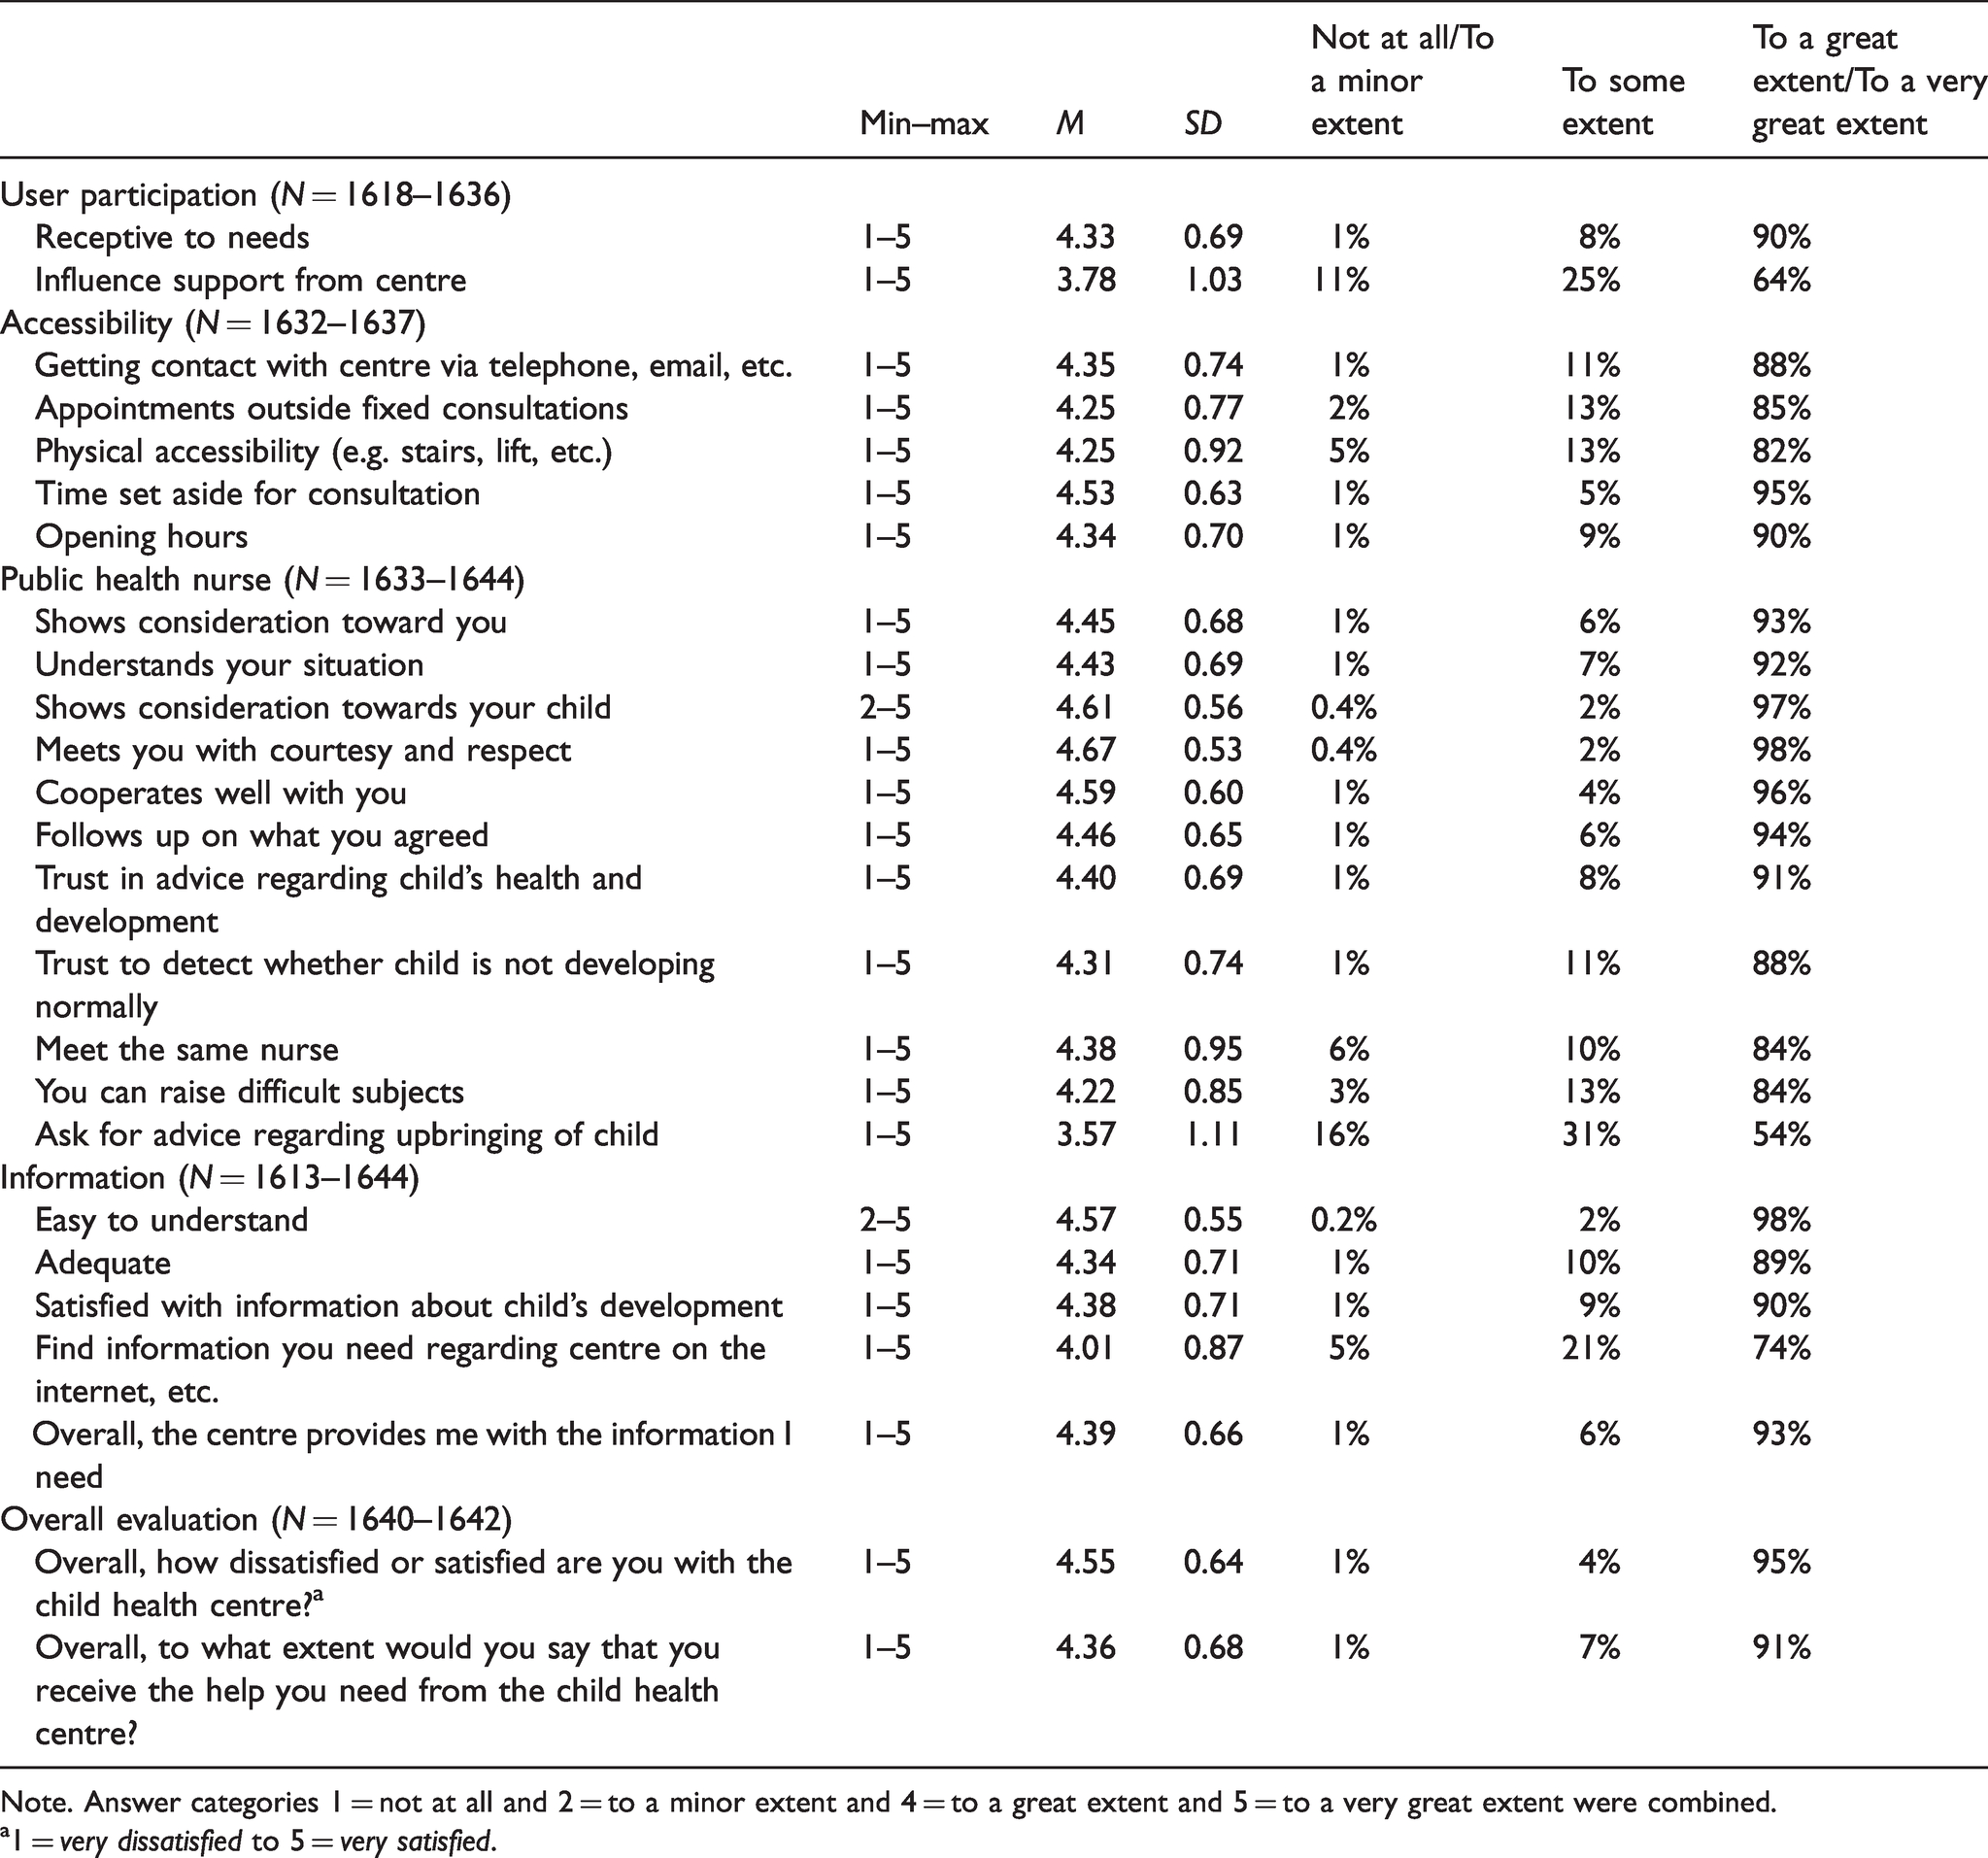
Note. Answer categories 1 = not at all and 2 = to a minor extent and 4 = to a great extent and 5 = to a very great extent were combined.
a1 = very dissatisfied to 5 = very satisfied.
The user satisfaction scales
The mean scores for the four user satisfaction scales are generally high, with the lowest score for User participation (M = 4.06; SD = 0.77) and the highest score for the Overall evaluation of the service (M = 4.45; SD = 0.59; see Table 3). Correlations for the demographic characteristics with each other and with the user satisfaction scales are overall small and partly not significant. The user satisfaction scales themselves correlate significantly and positively with each other. Cronbach’s alphas for the five scales ranged from .69 (User participation) to .89. (Public health nurse).
Descriptive statistics (N = 1609–1652).
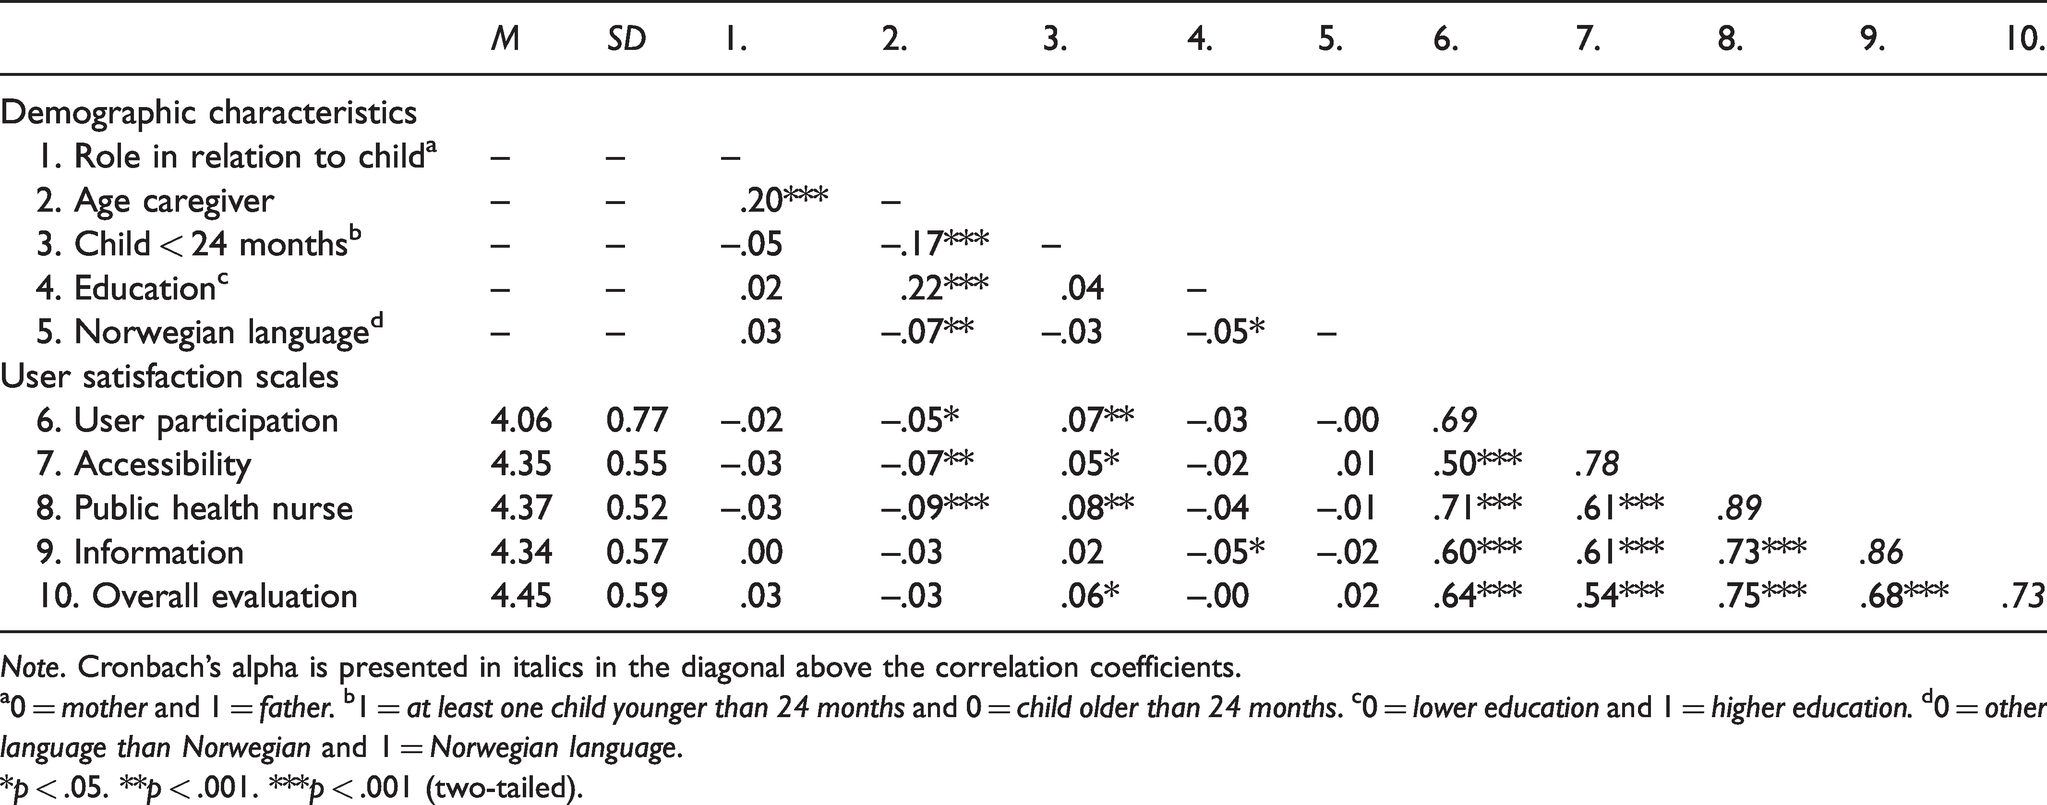
Note. Cronbach’s alpha is presented in italics in the diagonal above the correlation coefficients.
a0 = mother and 1 = father. b1 = at least one child younger than 24 months and 0 = child older than 24 months. c0 = lower education and 1 = higher education. d0 = other language than Norwegian and 1 = Norwegian language.
*p < .05. **p < .001. ***p < .001 (two-tailed).
Predicting the overall evaluation of the service
The results of the hierarchical regression analysis are presented in Table 4. In step 1 the R2 was .01 and not significant. Fathers seem to be more satisfied with the service compared to mothers. In step 2 all four user satisfaction scales were significant. The R2 was .62 and significant. The model explained a total of 63% of the variance in the overall evaluation of the service.
Hierarchical regression analysis predicting the overall evaluation of the service (N = 1590).
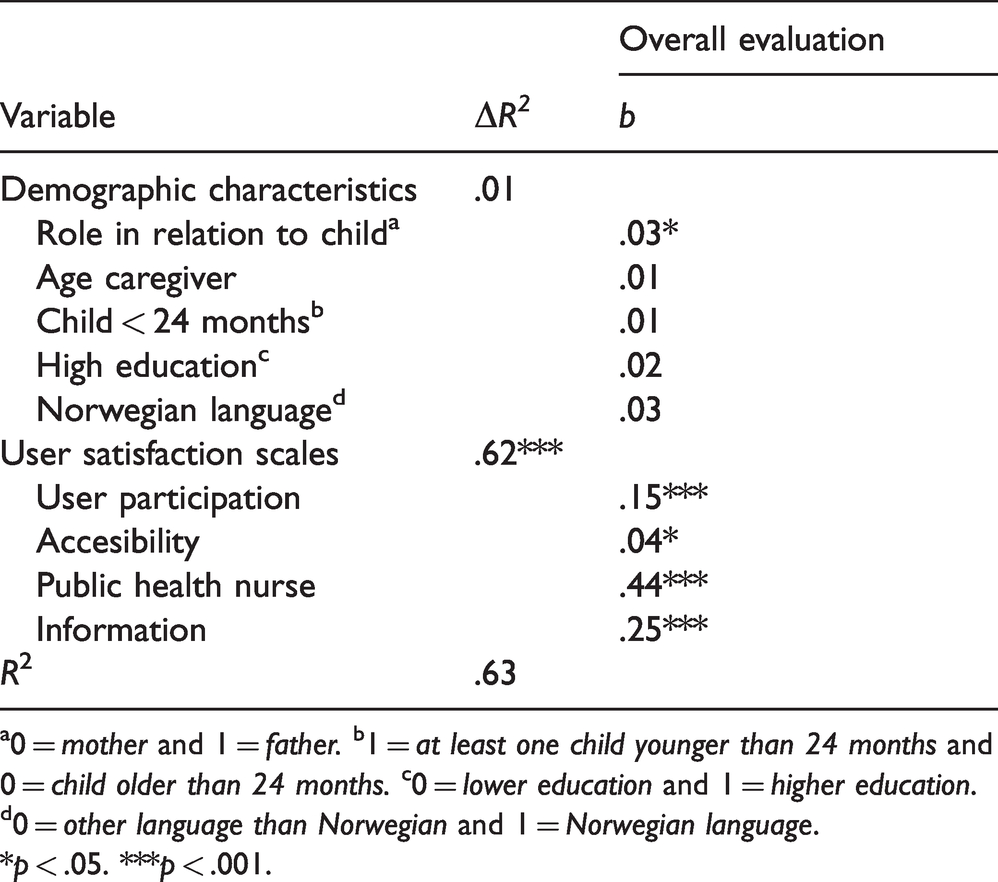
a0 = mother and 1 = father. b1 = at least one child younger than 24 months and 0 = child older than 24 months. c0 = lower education and 1 = higher education. d0 = other language than Norwegian and 1 = Norwegian language.
*p < .05. ***p < .001.
Cooperation with other services
A total of 1332 (81%) answered that their child had not received help from other public services, while 312 (19%) answered that they had. Of those who had received help 12 (4%) were dissatisfied, 44 (14%) answered ‘Both/and’, and 248 (79%) were satisfied with the child healthcare centre’s cooperation with the relevant services.
Discussion
Child health centres for children 0–5 years old (CHC) are one of many health services that Norwegian municipalities have to offer to children and their families. Examining user satisfaction with the CHC is important as it provides knowledge about how the users perceive the service they receive and about possible areas that can be improved. This study is, to our knowledge, the first study that reports findings of user surveys conducted at multiple CHC in Norway.
As expected, far more mothers than fathers visit CHC in Norway. This might be related to the distribution of parental leave. Mothers often take the longest leave, including unpaid leave, and will thus be the ones with the opportunity to accompany the child to most consultations. 26 Also, the finding that most users were between the age of 20 and 40 years is not surprising, since the average age of birth for mothers is 31 years and for fathers 34 years in Norway. 27
The distribution of responses to the survey items shows that, overall, users are satisfied with CHC in Norway. This finding is also reflected in the overall assessment of the service. A total of 95% of the users were satisfied with the service and 91% felt that they received the help they needed from the CHC. The high overall satisfaction may indicate that CHC meet parents’ expectations of the service. 12 The results are comparable to the findings from the open kindergarten study, where 96% of the users were satisfied with the service. 20
When taking a closer look at the single user satisfaction scales, users were most satisfied with the public health nurse. This could indicate that the public health nurses are good at building relationships with the parents and manage good collaboration with them during the consultations. Sanders and Roach 28 found that the relationship between the service user and the healthcare professional is of great importance to the user perception of the service quality. Relationship building is based on trust between the public health nurse and the parent. The parent’s trust in the public health nurse will, among other things, be linked to their trust in the public health nurse’s competence. 29 The high satisfaction with the public health nurse may be an indication that the parents feel safe with the competence of the public health nurse. This is essential for the professionals in order to provide help. 29
Overall, there were three items in the survey that received more varied answers than the others. The question that achieved the lowest agreement in the whole survey was related to whether the users ask the public health nurse for advice regarding the upbringing of the child. The current findings are comparable with findings from the open kindergarten study. 20 It might, on the other hand, indicate a lack of trust in the competence of the public health nurse or, more likely, that users are used to using other sources to look for health-related information such as the internet or family and friends. 24 This may be because these sources are more accessible in everyday life. A lack of trust in the competence of the public health nurses at CHC would also be reflected in the other questions (i.e. ‘trust in advice regarding child’s health and development’ and ‘trust to detect whether child is not developing normally’). However, around 90% are satisfied with those two questions. A meta-analysis found that trust in healthcare professionals was related to subjective health outcomes and patient satisfaction. 30
The second question with more varied answers was part of the User participation scale. A total of 64% answered that they could influence the support from the CHC to a great extent, 25% stated to some extent, and 11% not at all. This result may be linked to the CHC guidelines that regulate the public health nurses in which type of examination they have to or can provide. 3 However, there might be more possibilities for public health nurses to include parents in the consultations and in the decisions about further follow-ups for themselves and their child that might be worth examining.
The third question with more varied answers was part of the Information scale. The question to what extent users can find information they need regarding the CHC on, for example, the internet or in information brochures, was answered by 5% not at all, by 21% to some extent, and by 74% to a great extent. To improve the quality of the service it would therefore be beneficial for each CHC to examine what can be done to improve so that users can find the relevant and sufficient information more easily.
Another aim of the study was to identify predictors of the overall evaluation of CHC. All four user satisfaction scales were significant, and the strongest relationship was found for Public health nurse, followed by Information, User participation, and Accessibility. This underlines once more the importance of the public health nurse that work at CHC. Satisfaction with the staff was also found to be the strongest predictor for the overall satisfaction with the open kindergarten. 20
Limitations
The current article used a cross-sectional design and it is not possible to make causal conclusions regarding the predictors of parent satisfaction. 31 The study is based on a questionnaire and the average response rate was 56%, which is relatively high compared to other response rates in user surveys conducted in mental healthcare, where rates between 23% and 38% are reported. 32 Another limitation is related to how the participants were recruited to the study. The questionnaire was distributed during the consultations at CHC, and thus we did not get answers from those who did not use the service in the period in which the study was conducted, or from those who do not visit CHC at all. The latter might constitute a more vulnerable group that may for various reasons be cause for concern. 33 This may constitute a group who may be less satisfied with the CHC. Even though the CHC has a high degree of coverage some consultations lack a higher percentage of attendance. 33 For example, in 2018 5% did not attend to the four-year check-up compared to the 99% who attended to the eight-week consultation. However, there were no indications that those who did not attend the check-ups constitute a special group. 33
Cronbach’s alphas for the different scales were adequate to good, except for the scale User participation which was slightly below the cut-off of .70. 25 However, this scale consisted of only two items and its exclusion from the analysis would not have changed the conclusions. The average response rate was 56%, which is in accordance with a weighted average response rate found in a meta-analysis of survey responses. 34 In the current study, more participants had completed higher education (64%) compared to lower education (36%). In the general Norwegian population, 62% have lower education and 35% higher education. 35 However, education was not a significant predictor in the regression analysis, indicating that there is no difference in the overall evaluation between service users with lower and higher education. Furthermore, there was a bias regarding the sex of the respondents as 91% of the users who filled in the questionnaire were women. However, this was expected as it might be related to the distribution of the parental leave between mothers and fathers in Norway. Regarding the responses themselves, there was a ceiling effect, which makes it difficult to differentiate between individuals.
Conclusion
In Norway, all children are entitled to receive regular health check-ups and most families are users of this service. The consultations children and their families receive at CHC are regulated according to national guidelines. This study highlights important factors for maintaining satisfaction among users of CHC. Focus should be placed on the public health nurse, as they are the main professional that the children and families interact with during the consultations at CHC. Leaders of CHC can use the public health nurse as a resource in the process of service improvement. Overall, the parents indicated a high degree of satisfaction with the service and in particular with the public health nurse. The findings also indicated room for improving the services, for example in terms of improving the information provided online, and also by facilitating user participation in terms of possibilities for the parents to influence the support provided.
Footnotes
Data availability statement
Participants in this study did not agree for their data to be shared publicly, so supporting data are not available.
Conflict of interest
The authors declare that there is no conflict of interest.
Author contributions
MM and SK designed the study; KJ and MBH helped with the data acquisition and the recruitment of the municipalities, and SK and CCL conducted the analysis and interpreted the results. SK and CCL drafted the article and MM, KJ, and MBH revised it critically. All authors approved the final version of the manuscript.
Funding
The author(s) disclosed receipt of the following financial support for the research, authorship, and/or publication of this article: The study was funded by UiT The Arctic University of Norway and the Norwegian Directorate of Health.