
Abstract
With the development of urbanization during the past few decades, municipal solid waste generated in urban areas has posed serious challenges to the local environment in many cities around the world, such as Macao. Residential and touristic activities are the two primary sources of solid waste in Macao; however, it is still unclear how to predict solid waste generation and which indicators of these two sources could be used to do so. Taking advantage of data published by government agencies in Macao from 2010 to 2021, our study explores the possibility of using publicly available data to predict the trend of monthly municipal solid waste generation in Macao. In particular, we adopt a machine learning strategy and compare six predictive models that implement both conventional and state-of-the-art machine learning methods. Our results indicate that the generalized additive model outperformed the rest of the models in predicting municipal solid waste generation in Macao and is more suitable when data present strong seasonality and potential domain shift. Consistent with the previous literature, both population-level and household-level factors contribute to municipal solid waste generation, including population density, income level, household energy consumption, and household size. In addition, our results confirm that tourism activities—especially tourists’ spending on non-tradable goods and services—positively affect municipal solid waste generation.
Keywords
Introduction
With rapid population growth and urbanization, the past few decades have witnessed an increased standard of living in most parts of the world. Consequently, solid waste generated during this process has posed serious challenges to the local environment across countries. Many countries and regions have adopted waste management policies to promote reduction, reuse, and recycling in response to the rapid increase in solid waste. In particular, municipal solid waste (MSW) prediction, utilizing predictive models based on key influencing factors for the amount of MSW generated, has been widely used as the basis for policy development and implementation.
Macao, a Special Administrative Region (SAR) of China, is one of the most densely populated cities in the world, with a population density of around 20,700 people per square kilometer by the end of 2021. Benefiting from its gaming industry and gambling-related tourism, the city has experienced rapid economic growth in the past 20 years. However, the booming gaming and hospitality industries have also brought a surge of MSW due to the high levels of consumption (Environmental Protection Bureau of Macao (DSPA), 2017). For instance, the amount of MSW generated increased by 57% within a few years, from 321,000 tons in 2010 to 504,000 tons in 2016 (DSPA, 2017). Compared with neighboring cities, such as Hong Kong and Guangzhou, Macao's daily per capita waste production of 2.22 kg/day was much higher than that in Hong Kong (1.47 kg/day) and Guangzhou (1.37 kg/day) in 2019.
Due to little arable land and few natural resources, Macao has little industry and the whole economy heavily relies on gaming-related tourism. For example, the gaming industry (50.9% of gross domestic product (GDP)) and tourism-related sectors such as wholesale and retail, hotels, and restaurants (11.8% of GDP) were the two largest contributors to Macao's economy in 2019, whereas industrial production was the smallest sector, accounting for only 1.2% of GDP (Macao Statistics and Census Bureau, 2019). As such, tourism-related sectors (e.g. shops, restaurants, and hotels) and households are the two major contributors to solid waste generation in Macao. Previous studies have shown that population growth is closely related to the increasing volume of MSW generation, and tourism activities are linked to the seasonal fluctuations in MSW generation (Dangi et al., 2011; Li et al., 2011; Mateu-Sbert et al., 2013). Therefore, researchers have proposed several models, such as time series models, linear regression models, and machine learning models, in which population and tourism-related variables are enclosed as major factors in order to predict MSW generation (Adamović et al., 2017; Chung, 2010; Martins and Cró, 2021). However, how to model seasonal fluctuation is still very challenging in forecasting MSW generation, especially for tourist destinations (Arbulú et al., 2016).
Therefore, to fill this gap, this study aims to propose a model that can predict the trend of monthly waste generation in Macao using publicly available data published by governmental agencies from 2010 to 2021. In particular, this study focuses on the effects of household dynamics and tourism-related factors on MSW generation. The findings of this study not only provide a basis for further development of MSW management policies in Macao but also shed light on MSW forecasting and management in municipalities with large numbers of tourists and high residential densities.
The remainder of this paper is organized as follows. First, we introduce the MSW generation and management problems in Macao and summarize previous work on the effects of household-level and tourism-related factors on MSW generation. Then, a brief description of data sources and modeling strategies is presented, followed by results and discussion. We conclude with a summary of our findings, limitations, and suggestions for future studies.
Background
MSW generation and management in Macao
Any industrial, commercial, mining, or agricultural operations and household and community activities produce solid waste. In Macao, the domestic sector has been the primary source of MSW since the early 2000s, followed by the industrial and commercial sectors, which contribute roughly one-fifth of the total MSW (Jin et al., 2006). Incineration, supplemented by landfilling, has been the major method for disposing of MSW since the first incineration plant in the territory was built in 1992 (DSPA, 2006). MSW generated from domestic, industrial, and commercial activities is sent to the incineration plant, and the discharge from incineration (e.g. fly ash and slag) and construction waste is sent to landfill areas for disposal (Jin et al., 2006; Zheng et al., 2017).
However, with the tremendous increase in MSW brought by rapid economic and population growth, Macao has faced substantial solid waste management challenges related to waste disposal (i.e. waste incineration and landfilling) and waste recycling. Limited by its available storage and overall space, the incineration plant has reached its daily capacity almost every day since 2006, handling about 784 tons of solid waste per day (DSPA, 2006; Zheng et al., 2017). Therefore, to increase waste disposal capacity, the Macao SAR government started an expansion project in 2009—the Macao Refuse Incineration Phase (MRIP) II—to double the plant's incineration capacity (DSPA, 2010). Further expansion—MRIP III—has also been initiated and is planned to be completed by 2024 (DSPA, 2022).
Unfortunately, due to high labor costs and limited space available for recycling and storage, a sufficient recycling infrastructure has not been established; hence, the recycling rate in Macao remains low. For example, a recent survey found that the majority of respondents (56.23%) did not separate recyclable materials for recycling in Macao, thereby hindering the government's efforts in MSW management (Song et al., 2019).
To promote waste recycling, the Macao SAR government has issued several policies in recent years, such as the “Macao Solid Waste Management Programme (2017–2026)” (DSPA, 2017), and has launched social campaigns to reduce the amount of MSW generation and increase the recycling rate with special focus on “waste reduction at source”. A three-stage action plan for MSW policy implementation was proposed in the 2017–2026 program to reduce the amount of MSW per capita daily by 30%, a reduction from 2.11 kg in 2016 to 1.48 kg by 2026.
By directly imposing charges and fees, the short-term action plan (implemented in 2017–2019) specifically targeted reducing construction waste and excessive use of plastic bags. The mid-term plan (implemented in 2020–2022) involved expanding the current recycling network for food waste, improving the waste separation system, and establishing producer responsibility schemes for glass goods and electronics. The long-term plan aims to build a recycling and reuse industry in Macao and a fee-for-service system for MSW handling within a proper legal and regulatory framework. With the success of the short-term plan and the initiation of the mid-term and long-term plans, empirical evidence has shown that local residents’ behavior has changed (e.g. using fewer plastic bags) (Xu et al., 2022). However, the booming gaming industry and growing population size have been putting tremendous pressure on MSW management in Macao, despite local residents paying more attention to MSW issues (Zheng et al., 2017).
MSW generation: Population, household, and tourism-related variables
Previous studies have highlighted the role of population-level and household-level factors in domestically produced solid waste, such as population density (Saladié, 2016; Thanh et al., 2010), the unemployment rate (Chen, 2010; Namlis and Komilis, 2019), GDP per capita (Gui et al., 2019; Namlis and Komilis, 2019), household size (Suthar and Singh, 2015; Trang et al., 2017), household income (Liu et al., 2019; Ojeda-Benítez et al., 2008), and the average level of education in a region (Chen, 2010; Zhang et al., 2019). Although the size of the population and the number of households have been used extensively as predictors for modeling the total amount of solid waste, household-level indicators have also been utilized in explaining household solid waste generation. For example, using individual-level survey data, studies explored the impact of population dynamics on MSW generation and showed that socioeconomic status and family size are positively correlated to the quantity of solid waste generated at the household level (Dangi et al., 2011; Li et al., 2011; Thanh et al., 2010; Trang et al., 2017; Wang et al., 2020). Specifically, Suthar and Singh (2015) reported that, on average, households with five family members generate more waste than other types of households, and there is no significant difference between two-person households and seven-person households. However, large variations exist across households with different sizes, especially between two-person (at the low end) and six- and seven-person (at the high end) households. Household size and socioeconomic status are also linked to the composition of solid waste. For instance, household size is positively related to the amounts of organic, plastic, polyethylene terephthalate (PET) bottle, and paper waste generated by households, although not for glass and other types of waste (Trang et al., 2017). Meanwhile, a higher income level is linked to more plastic, paper, and PET bottle waste and less organic, glass, and other types of waste, which reflects different household consumption patterns related to socioeconomic status (Trang et al., 2017). An analysis of census data also reveals that household expenditure on food has a significant positive effect on MSW generation, whereas household expenditure on housing plays the opposite role (Liu J et al., 2019). In addition, other factors, such as public awareness (Liu T et al., 2015; Omran et al., 2009; Trang et al., 2017; Wang et al., 2020), willingness to separate generated waste (Afroz, 2011; Meng et al., 2019) and to pay for disposal (Liang et al., 2021; Song et al., 2019), seasonal variation, and daily variation (Jadoon et al., 2014) have also been investigated.
Furthermore, prior research has focused on tourism activities, such as food consumption, shopping, and accommodation, as key drivers for MSW generation in cities (Altinay and Hussain, 2005; Diaz-Farina et al., 2020; Oribe-Garcia et al., 2015; Pham Phu et al., 2019). Previous research shows that tourism-related waste comes mainly from the hospitality industry (Diaz-Farina et al., 2020), and food preparation is the major source of solid waste generated by the hospitality sector (Filimonau and De Coteau, 2019; Pirani and Arafat, 2014). In cities with booming tourism sectors, the hospitality industry produces more food than local households (Liu, 2014; Papargyropoulou et al., 2016). Since the number of tourists and the length of stay vary dramatically by season, the amount of generated solid waste also fluctuates accordingly, with a strong pattern of seasonality (Greco et al., 2018). In peak seasons, the surge of MSW is brought by the influx of visitors, putting tremendous pressure on local waste management. For example, Arbulú et al. (2016) examined waste management costs incurred by tourism activities in the island of Mallorca, Spain, and found that the seasonal tourism pattern resulted in a significant increase in MSW treatment costs. Similarly, Greco et al. (2018) analyzed a sample of 68 Italian cities. They revealed that the number of tourists, the number of overnight hotel stays, and tourists’ spending amount are associated with a significant increase in the cost of collecting municipal waste.
Although previous studies have reviewed policies and the challenges that Macao SAR is facing (e.g. Jin et al., 2006) and evaluated the effect of attitudes (e.g. Liang et al., 2021) regarding MSW management, little research has been conducted to develop empirical models for predicting MSW generation in Macao. Therefore, the current study aims to develop reliable models that provide accurate predictions for the monthly amount of MSW generated in Macao, which is heavily influenced by household dynamics and seasonality due to the influx of visitors. Furthermore, the COVID-19 outbreak, which led to a global travel ban that severely impacted tourism, offers a unique opportunity to explore the mechanisms of MSW generation in Macao by separating domestic and tourism-related contributions and evaluate the performance of the proposed models, which include state-of-the-art machine learning models and more conventional ones.
Data and methods
Data source
The current study utilizes data gathered from public sources, including official statistics, governmental reports, and the DSPA database from 2010 to 2021. For instance, general demographic and economic information that reflects the demographic transition (e.g. changes in household composition and population density) and socioeconomic development (e.g. median monthly income of the employed population) during the research period were collected from governmental reports, such as Macao in Figures and the Macao Economic Bulletin. Variables related to household energy consumption (e.g. petroleum gas and electricity) were coded from official statistics, such as Energy Statistics, and tourism-relevant information (e.g. the average occupancy rate of hotels, gross gaming revenue, and tourists’ consumption) was obtained from the Macao Monthly Bulletin of Statistics and the Visitor Expenditure Survey conducted by the Department of Statistics and Census Services (DSEC).
In response to the increasing public concern for the local environment, besides releasing official guidelines such as the “Macao Solid Waste Management Programme (2017–2026)” and the “Environmental Protection Planning of Macao (2010–2020)”, the DSPA publishes monthly environmental data such as the amount of solid waste sent to the incineration center. According to the company in charge of the operation and maintenance of the incineration center, solid waste generated in residential areas constitutes the majority of incinerated waste at approximately 60.2%, followed by commercial waste (18%), industrial waste (11.8%), and bulk waste (10%) (ECOVE Environment Corporation, 2019). Hence, the monthly data on MSW generation in this study comprise solid waste produced mainly by households and touristic activities. By linking information released by the DSPA and other sources, the final dataset contains 144 observations of the monthly MSW in tons along with household size (HH), population density in persons per square km (PopDen), median monthly income (Income) in Macanese patacas, residential electricity in millions of KWh (Power) and gas usage in tons (Gas), the average proportion of hotel occupancy (Hotel), monthly gaming revenues in millions of patacas (Gaming), tourists’ consumption of non-tradable goods and services (TCS), and tourists’ consumption of products (TCP) in millions of Patacas over the study period.
Methods
Four types of models have been widely used in MSW forecasting, namely conventional regression models, system dynamics models, artificial intelligence models, and time series models (Xu et al., 2013). Conventional regression models, such as multiple linear regression (MLR) models, have been applied in MSW forecasting partially because of their well-established theory and algorithmic simplicity (Xu et al., 2013). However, MLR models often produce poor predictions when data are not measured accurately (Thanh et al., 2010) or the trends in waste generation are too complicated to be summarized by a linear model (Noori et al., 2010). Time series models, such as autoregressive integrated moving average (ARIMA) models, are another popular choice (Chung, 2010) due to their superiority in predicting short-term MSW generation (Beigl et al., 2008; Navarro-Esbrı́ et al., 2002; Rimaitytė et al., 2012). However, they do not provide satisfactory predictions when the data cover long time periods because of sensitivity to varying trends over time.
In recent years, various machine learning techniques, such as support vector machines (SVMs) (Abbasi et al., 2013, 2014), artificial neural networks (ANNs) (Adamović et al., 2017; Azadi and Karimi-Jashni, 2016; Kumar et al., 2018; Oliveira et al., 2019), decision tree (DT) (Kannangara et al., 2018; Solano Meza et al., 2019), and random forest (RF) (Cha et al., 2020; Rathod et al., 2020; Uganya et al., 2022), have been given higher priority than conventional approaches because of their superior performance in providing more accurate predictions and capturing the non-linear pattern of MSW generation.
Compared to traditional models, such as MLR and ARIMA, the primary purpose of machine learning techniques is to find a suitable model through a data-driven search with few assumptions about the data. Little interest is paid to formulating a testable hypothesis. Despite their good performance, these machine learning models are considered “black boxes” because it is hard to elaborate on specific effects and find a meaningful interpretation (Faraway and Chatfield, 1998). Due to limited information, the traditional models that rely on distributional assumptions and structural relationships between predictors and response might not be appropriate for capturing the process of solid waste generation. However, evaluating the effects of household dynamics and touristic activities on MSW generation requires a structural component that is interpretable.
Therefore, the current study adopts a generalized additive model (GAM) that provides a good combination of flexibility and interpretability. For example, it incorporates flexible non-parametric components, such as splines, to address seasonality, and parametric components, such as linear effect, to assess the effects of specific predictors. The GAM technique offers accurate predictions because it can detect non-linear effects and summarize both parametric and non-parametric components for seasonal variation. It also provides interpretable and meaningful evaluation for specific variables regarding the changes in MSW generation.
We trained six models to predict the amount of MSW generated between 2010 and 2021 using population, tourism, and household-related indices as key indicators. Besides GAM, machine learning models—namely SVM, ANN, and RF models, as well as the conventional MLR and ARIMA models—were utilized as benchmarks for comparison. Because variables included in the analysis were measured in different scales and substantial skewness existed for some variables, such as MSW, Income, Power, Gas, Gaming, TCS, and TCP, log transformation was applied to place them in a similar range.
Since the COVID-19 outbreak resulted in a travel ban and interrupted regular activities, we split the dataset into a training set with 120 data points from January 2010 to December 2019 and a test set with 24 data points from January 2020 to December 2021, with the test set data points covering the period in which COVID-19-related travel restrictions were issued by the government (Macao Special Administrative Region (MSAR), 2021). Two metrics, the root mean square error (RMSE) and mean absolute error (MAE), were used to quantify the performance of each of model:
Results
Descriptive statistics
Descriptive statistics for the response variable (log of MSW) and predictors in the training and test datasets are shown in Table 1. Since the test dataset covers a period of time in which travel restrictions that strongly influenced both tourism and household-related indices were implemented, salient discrepancies are shown between the two datasets. For example, the average hotel occupancy rate dropped substantially from 84.8% to 38.9%, and the monthly gaming revenue slumped by 76.85% (or 16.15% in the log scale) from an average of 8.57 billion Patacas to 1.98 billion Patacas in the training and test datasets, respectively. Noteworthily, COVID-19 also changed tourists’ expenditures. For instance, although the consumption of non-tradable goods and services remained the same (6.840 vs. 6.877), the consumption of products increased by almost 8% (6.740 vs. 7.275) in the log scale of billion Patacas.
Summary statistics for the variables included in the training and test datasets.
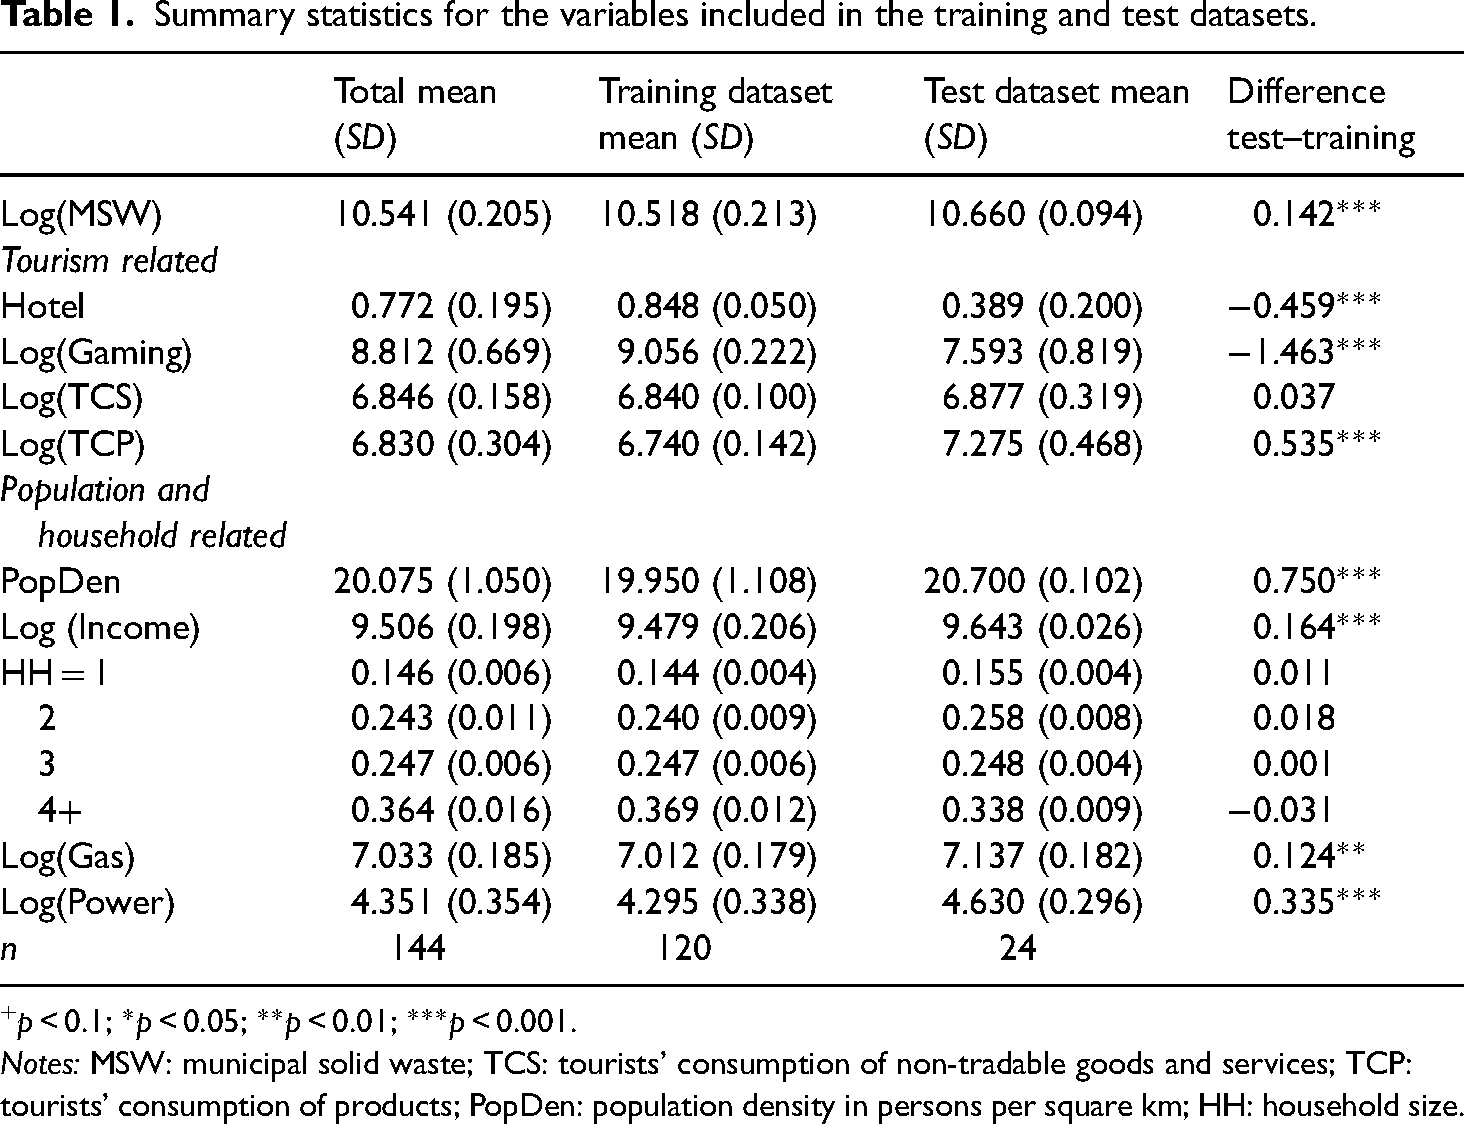
p < 0.1; *p < 0.05; **p < 0.01; ***p < 0.001.
Notes: MSW: municipal solid waste; TCS: tourists’ consumption of non-tradable goods and services; TCP: tourists’ consumption of products; PopDen: population density in persons per square km; HH: household size.
For household-related indices, the t-test indicates that the population density and the log of median income between the training and test datasets are significantly different. However, this is probably due to the long-term increasing trends in these indices driven by the booming economy in the recent decades rather than the impact of the COVID-19 pandemic. Significant differences are also reported for household-level electricity and gas usage—both were higher in the test dataset. As a result, we examined whether these differences were due to overall increasing trends in these indices. According to the analysis of variance (ANOVA) results, there is little evidence to support a long-term increasing trend of household gas usage whereas electricity usage has increased over the years. The increased gas usage in the test dataset could be explained by changes in behavioral patterns during the pandemic, such as less dining out and more cooking at home, which might also have been a factor contributing to increased MSW production during the pandemic—the amount of MSW increased by 15.26% (or 1.35% in log scale) for the test dataset. Little variation was found in the size of households between the training and test datasets, which is not surprising because the information on household size was obtained from statistical yearbooks, and measures were only available on yearly bases. Since the variables included in the analysis were measured at different scales, except for household size, we applied standard normalization for all variables in the rest of the analysis to avoid numeric issues.
The differences between the training and test datasets could create challenges for the models and negatively affect their performance. Domain shift or distributional shift happens when the training and test datasets are drawn from different distributions, and the models built in the training dataset will not necessarily continue to hold in the test dataset (Quiñonero-Candela et al., 2008). With the domain or distributional shift, the estimates of the expected loss on the test dataset may be biased, which can lead to large prediction errors (Branco et al., 2016).
As mentioned in previous studies, seasonality is one of the unique features of MSW generation. Figure 1 shows the monthly MSW generation in log scale over a year along with the hotel occupancy rate from 2010 to 2021. The monthly MSW generation shows a clear seasonal fluctuation within each year. In each year, the amount of MSW usually declined in the first quarter, followed by an upward trend; the peaks appear in specific months, such as July, August, and December, which coincide with the peak tourism season in Macao, whereas the lowest points normally occur in February, after Chinese New Year. Although not exactly matched, the hotel occupancy rate is consistent correlated to the amount of MSW generated.
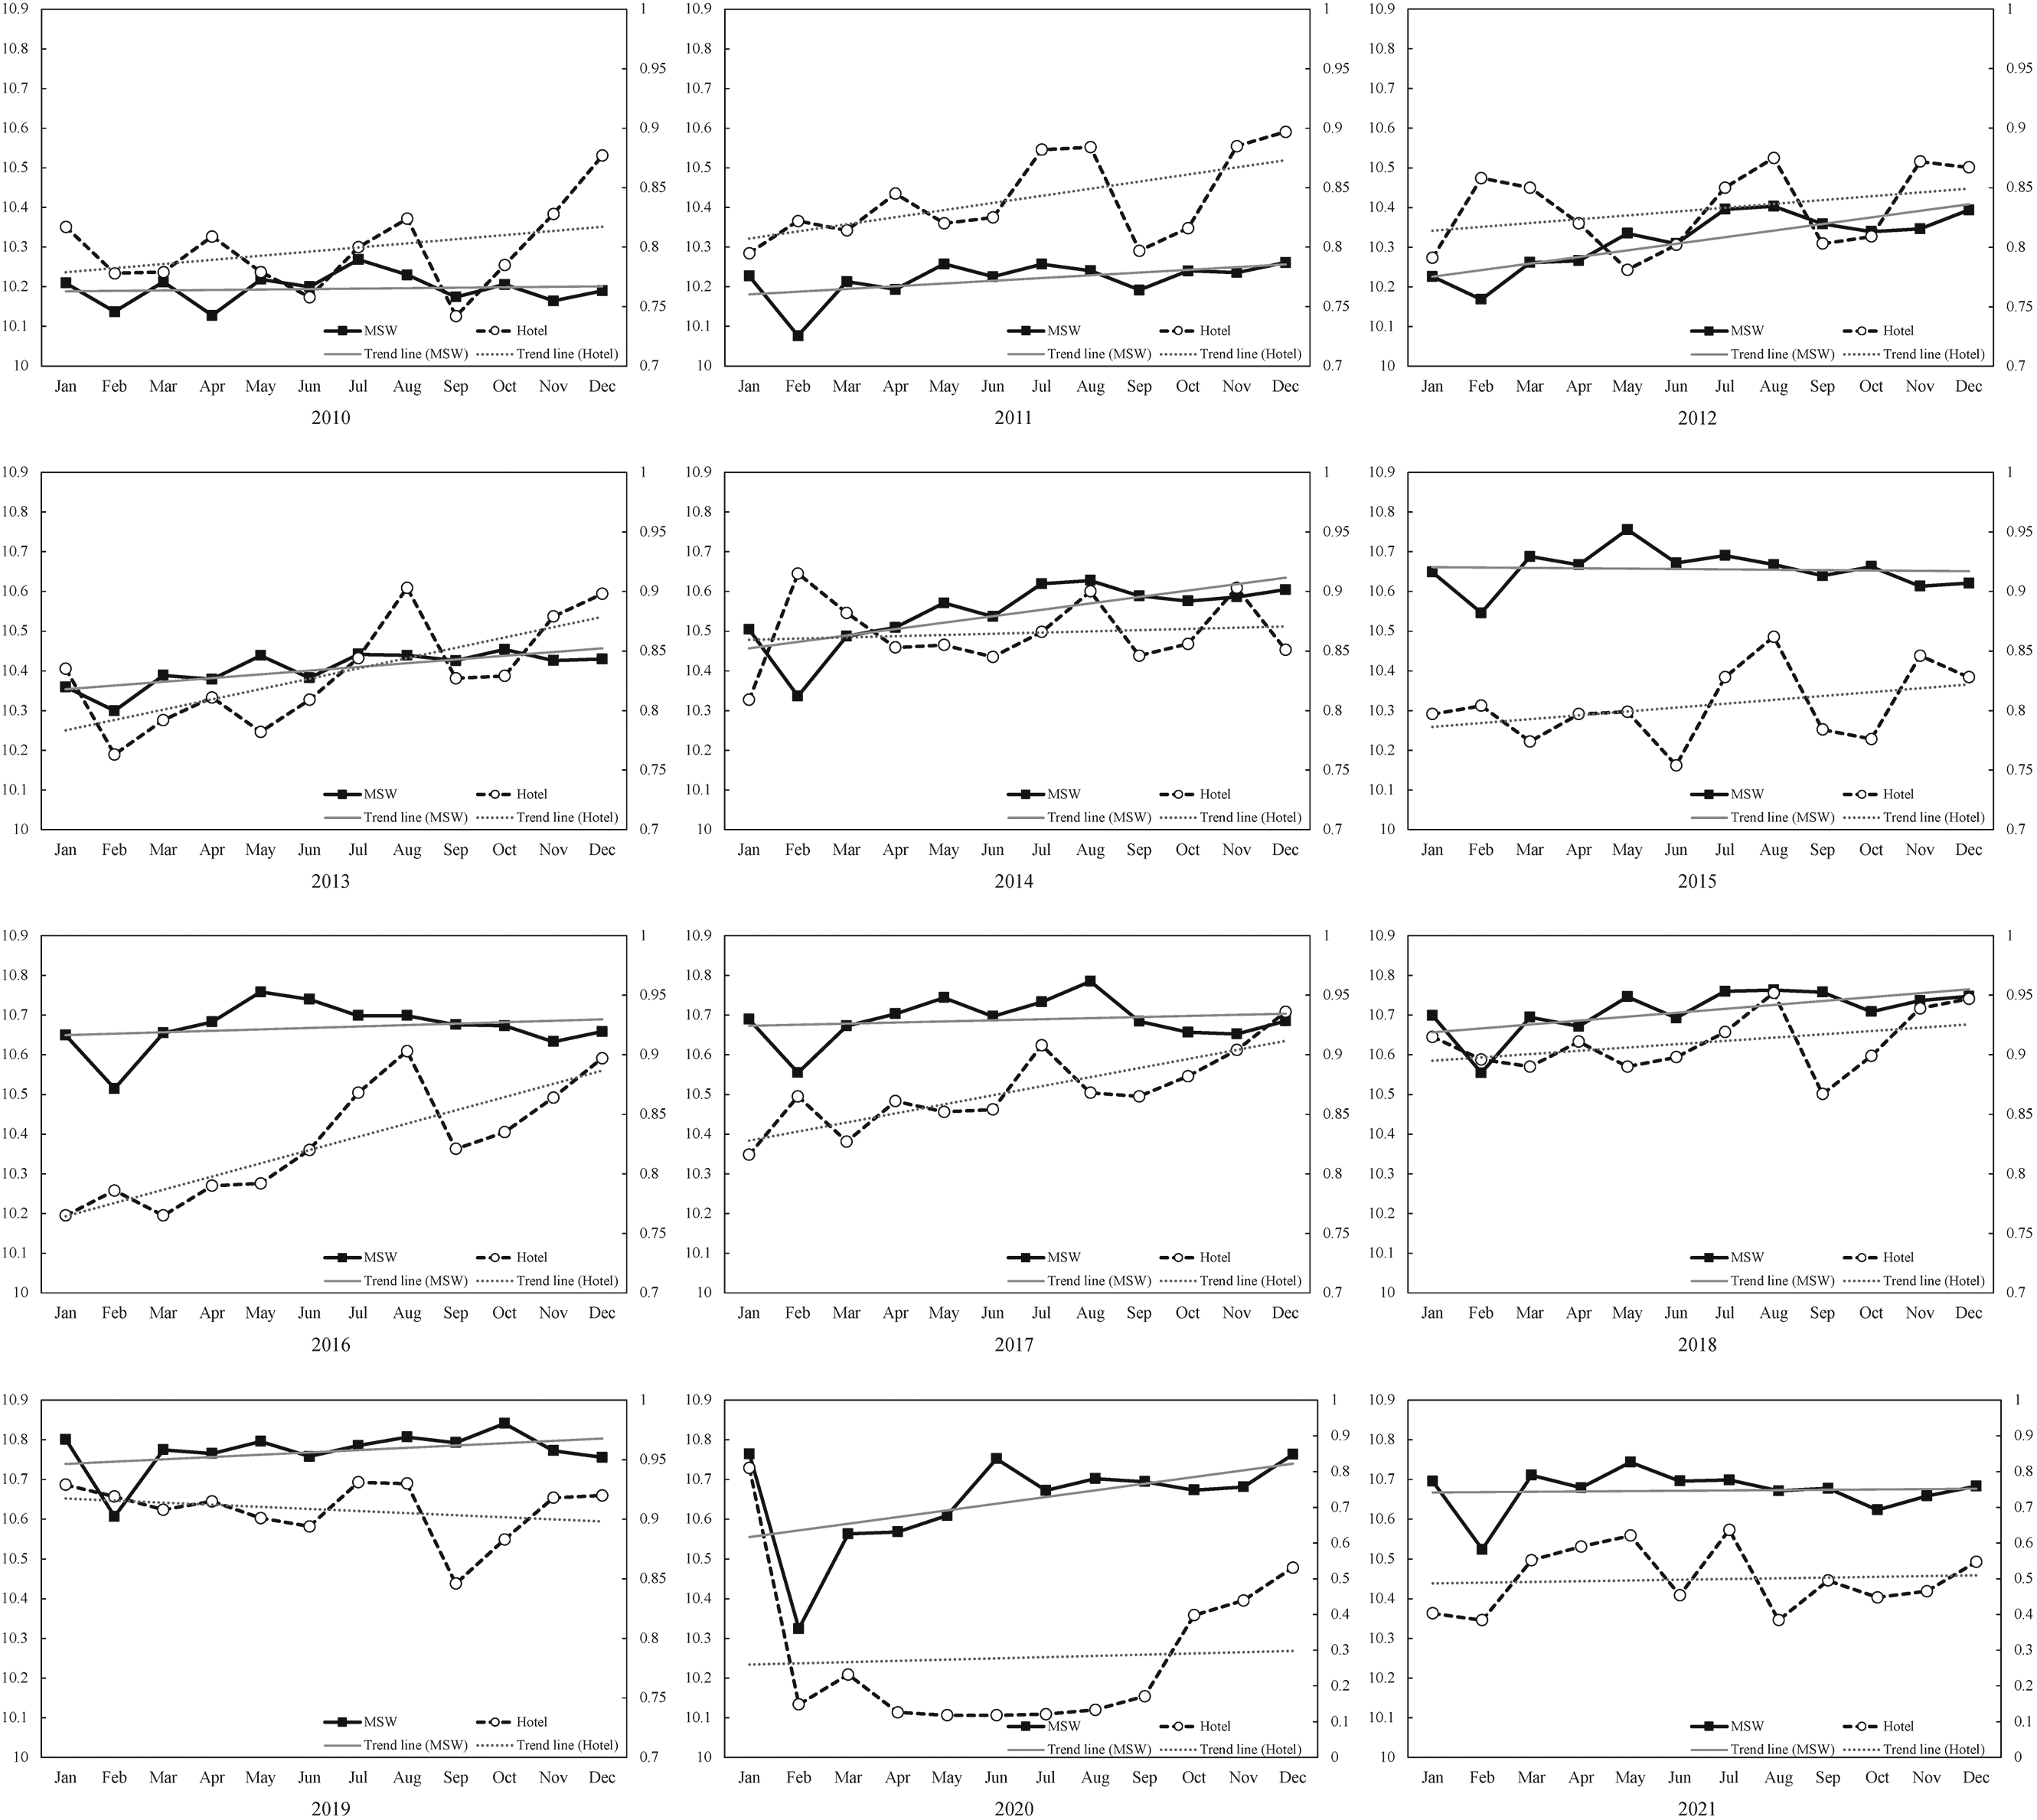
The trends of monthly municipal solid waste (MSW) generation and hotel occupancy rates from 2010 to 2021.
In addition, there is an overall increasing trend of MSW generation across the period. The volume of MSW generation steadily increased annually from 2010 to 2019. However, the pandemic briefly disrupted the increasing trend. In particular, February 2020 saw the sharpest declines in MSW generation and hotel occupancy in recent years, which is likely due to COVID-19 travel restrictions imposed by the Chinese Mainland. Although the figures gradually returned to pre-pandemic levels in the third quarter of 2020, the monthly MSW generation and hotel occupancy rate still did not exceed those of previous years, indicating a slow recovery of tourism from the impact of the COVID-19 pandemic.
Predicting MSW generation in Macao
To provide satisfactory MSW predictions, we employed six models that utilized both conventional (e.g. MLR and ARIMA) and state-of-the-art machine learning (e.g. SVM, ANN, RF, and GAM) methods, which were constructed with a focus on addressing two data features—potential domain shift due to the COVID-19 pandemic and seasonal tourism fluctuation. Table 2 summarizes their performance using RMSE and MAE metrics. For the traditional models, compared to MLR, the ARIMA model provided lower values of RMSE and MAE, indicating a better fit in the training dataset; however, the results were reversed in the test dataset—the indices tended to favor MLR over ARIMA. Among the machine learning models, ANN outperformed all other models in the training dataset with the lowest RMSE and MAE, at 0.033 and 0.020 respectively. Meanwhile, SVM ranked at the bottom, and RF was slightly better than GAM in terms of the two indices. In the test dataset, the traditional methods did not work as well as the machine learning models. For example, ARIMA and MLR ranked lowest in terms of prediction accuracy. Among the machine learning methods, GAM and RF were the top two methods in terms of the accuracy of their predictions. GAM was even slightly better, according to MAE, whereas ANN did not provide accurate predictions as it did in the training dataset. Studies have noted that ANN can fail if trained with limited data (Otchere et al., 2021), which might be particularly relevant to our case. Since the COVID-19 pandemic led to a deep drop in MSW generation, the ANN model trained using the information before the COVID-19 pandemic was not generalizable to the test dataset due to possible overfitting. Notably, SVM did not surpass any machine learning models, thereby ranking at the bottom.
Summary of performance of the six models using the training and test datasets.
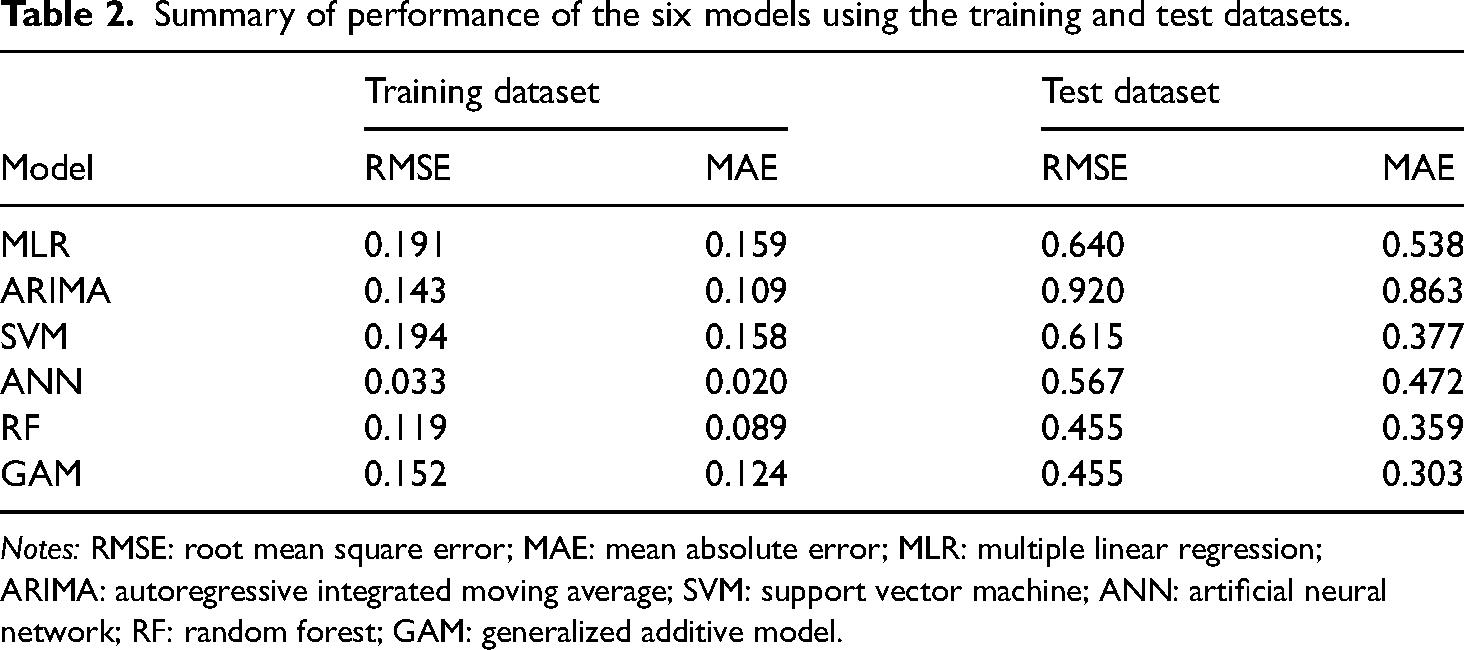
Notes: RMSE: root mean square error; MAE: mean absolute error; MLR: multiple linear regression; ARIMA: autoregressive integrated moving average; SVM: support vector machine; ANN: artificial neural network; RF: random forest; GAM: generalized additive model.
Although a single fit index, such as RMSE and MAE, provides useful information for assessing overall performance, it oversimplifies a model's capacity to address two different data features: domain shift and seasonal fluctuation. It also ignores the uncertainties of predicted values. Thus, we visualized the predictions along with their 95% confidence intervals produced by each model against their observed values to further evaluate our models regarding their prediction accuracy, as shown in Figure 2. Panels (a) and (b) show that neither of the traditional models—MLR and ARIMA—captured the drop of MSW in February 2020 due to travel restrictions. Although most observed values fell within the 95% confidence intervals generated by MLR, a systematic pattern of bias existed over time—positive bias turned negative after June 2020. The performance of ARIMA was even worse than MLR—most of the observed values were not included in the 95% confidence intervals with positive biases, though the seasonal fluctuation was captured.
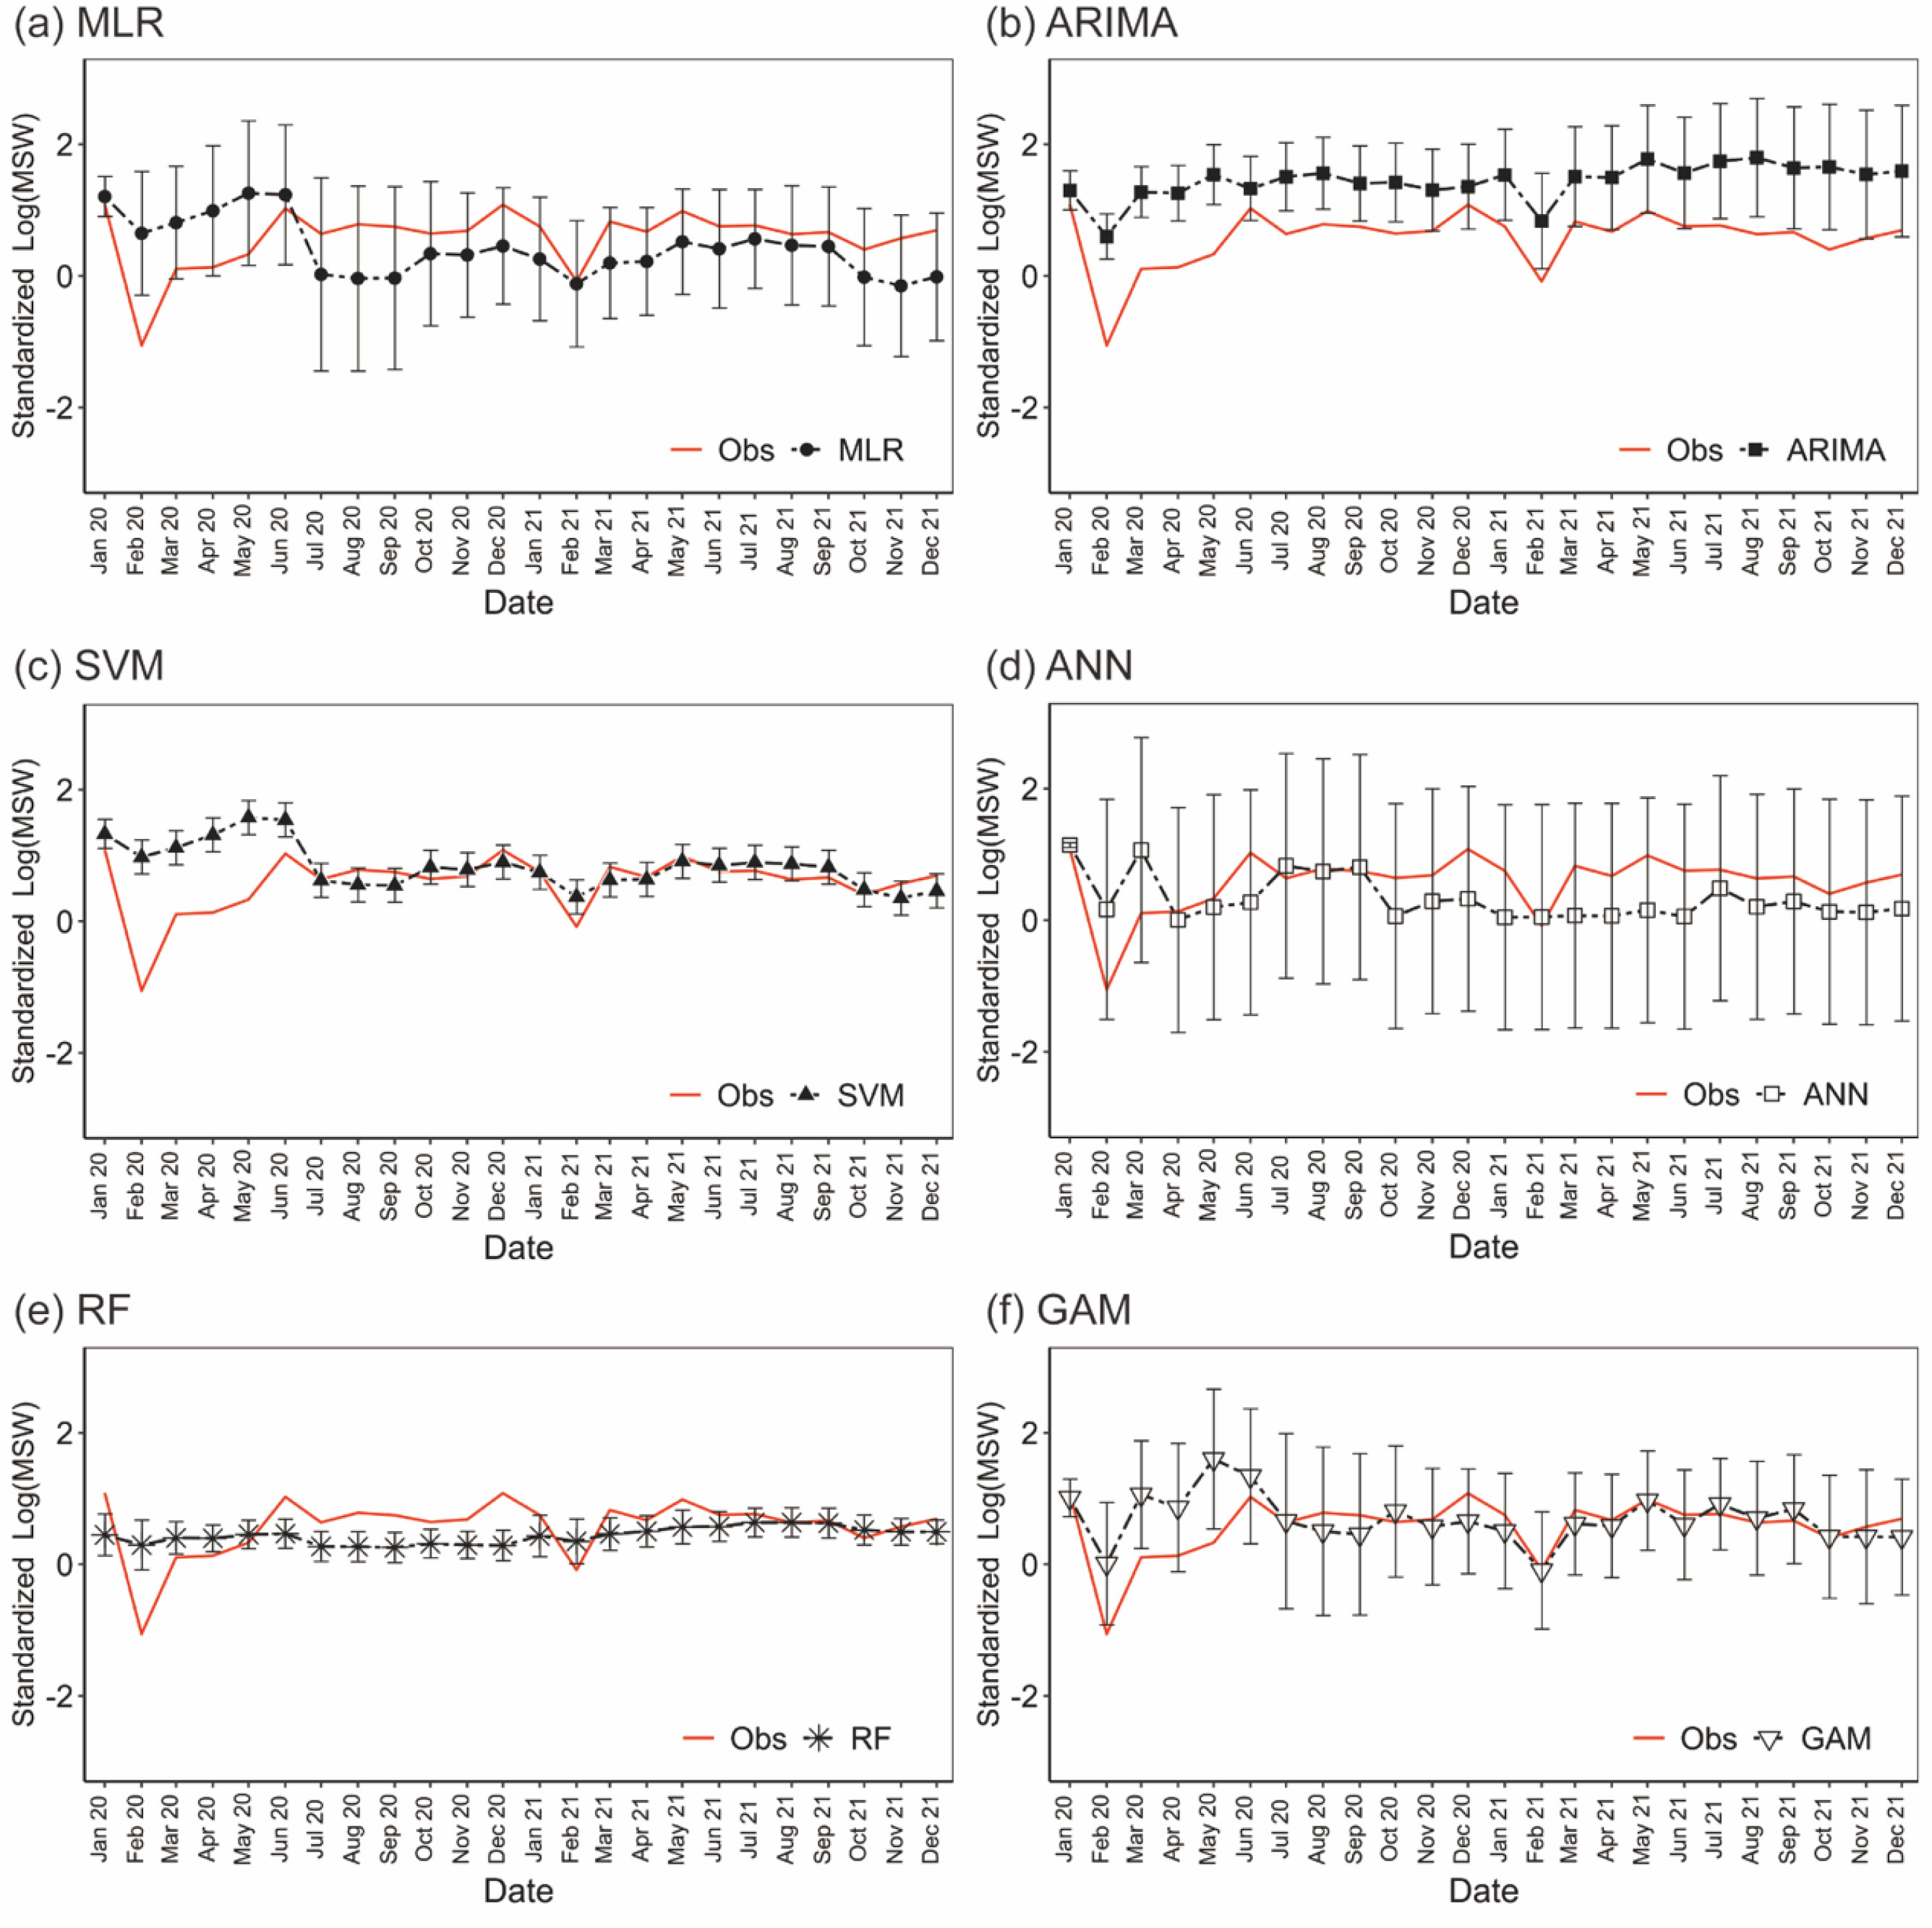
Observed versus predicted monthly municipal solid waste (MSW) in the test dataset for each of six models.
For the machine learning models, the predictions generated by SVM showed a similar pattern to those produced by MLR, with positive bias before July 2020. In addition, due to its narrow confidence intervals, none of the observed values before July 2020 were covered. However, the predictions after June 2020 were very close to the observed values, and many of the observed values were covered in narrow confidence intervals. This finding indicates that although SVM did not capture the impact of COVID-19, it performed well in handling the seasonal fluctuation, and the large RMSE and MAE values were due to the biases related to the domain shift. Consistent with the fit indices, the predictions of ANN were relatively poor in terms of large bias and prediction error despite the deep drop of MSW in February 2020 and the seasonal fluctuation being covered because of the wide confidence intervals. RF was one of the top two models evaluated by RMSE and MAE in the test dataset. However, the predictions were not satisfactory because the predicted values were very close with little variation, and neither the domain shift nor the seasonal fluctuation was captured well, suggesting that the assessment of RF based on RMSE and MAE could be misleading. As shown in panel (f), GAM gave the best predictions that not only reflect the seasonal fluctuation but capture the deep drop of MSW with relatively reasonable width of confidence intervals.
To summarize, the traditional models did not perform well in predicting MSW generation. For the machine learning models, GAM offered good predictions that properly reflect the impact of the COVID-19 pandemic and the seasonal fluctuation with a well-balanced confidence interval. In addition, caution needs to be taken when using a single index to assess the model performance because it may overlook the complex data generation process by averaging biases, as shown in the SVM and RF cases.
Effects of population, household, and tourism on MSW generation in Macao
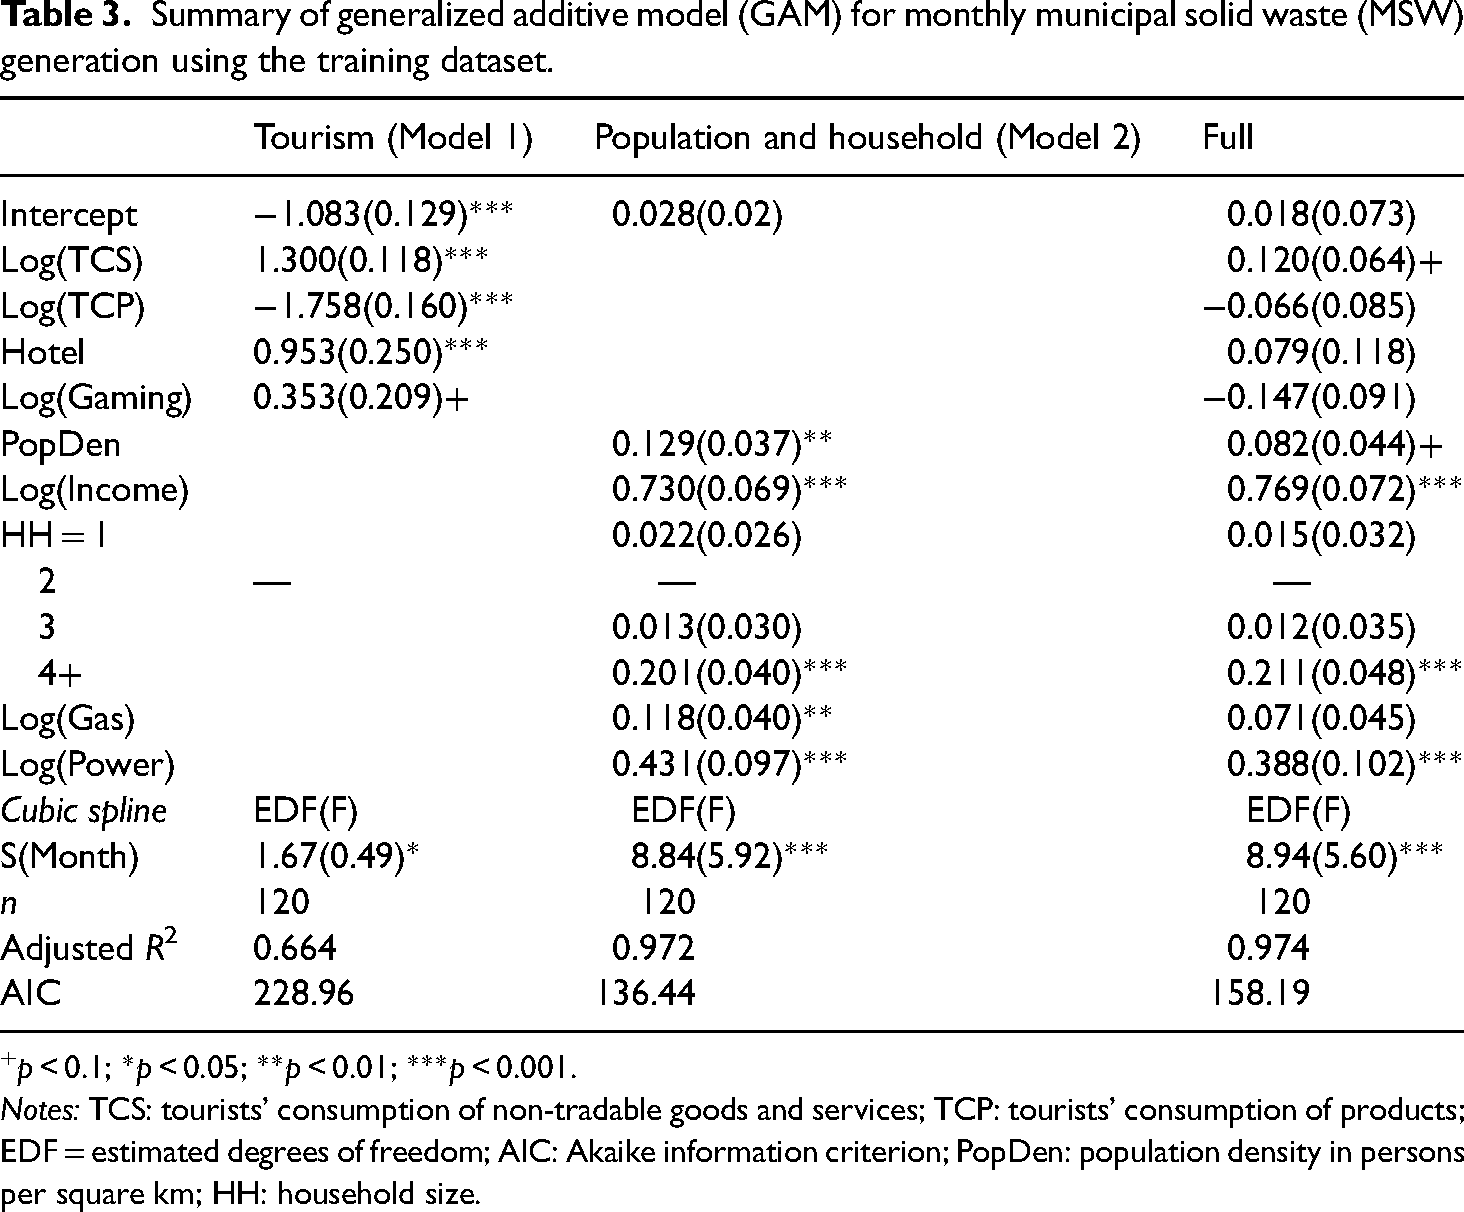
Table 3 reports the effects of population, tourism, and household-related variables on MSW generation estimated by GAM using the training data. To avoid numeric issues, all variables, except for household size, were standardized and a cubic spline constructed from the centered month was included to model seasonal fluctuation within a year. Model 1 only includes the tourism-related variables. Among the tourism-related variables, the tourists’ consumption of non-tradable goods and services (logged value) and the average proportion of hotel occupancy were positively associated with MSW. On the other hand, tourists’ product consumption was negatively linked to MSW. Model 2 contains the household and population-related variables. The effects of population density, median income (logged value), and residential electricity and gas usage were positive. Compared to two-member households, households with four or more members generated more MSW; the rest (i.e. single-member households and three-member households) did not significantly differ from the two-member households in terms of MSW generation.
Summary of generalized additive model (GAM) for monthly municipal solid waste (MSW) generation using the training dataset.
p < 0.1; *p < 0.05; **p < 0.01; ***p < 0.001.
Notes: TCS: tourists’ consumption of non-tradable goods and services; TCP: tourists’ consumption of products; EDF = estimated degrees of freedom; AIC: Akaike information criterion; PopDen: population density in persons per square km; HH: household size.
When all variables are entered into the full model, the proportion of hotel occupancy and tourists’ product consumption loses significance. Nevertheless, all other variables are consistent with the previous models—tourists’ consumption of non-tradable goods and services, household size, household-level energy consumption (gas and electricity), median income, and population density are significant in predicting MSW generation.
To further examine the model fit, we plotted the partial effect of the cubic spline term and the fitted values generated by the full model against the observations in Figure 3. Indicated by the solid line, panel (a) shows the partial residuals of the cubic spline term when holding other predictors constant. The estimated value of the degree of freedom, at 8.94, implies a strong non-linear relationship between the month and the log of MSW generation, which reflects the seasonal variation of MSW generation. Further, the well-balanced scattering pattern around the estimated value indicates a good fit for our model (Wood, 2017), where a clear seasonal fluctuation is present. Panel (b) also pinpoints a good match between the observed and the fitted values. For example, the observed values are well aligned with the predicted ones, with an increasing trend of MSW generation over time.
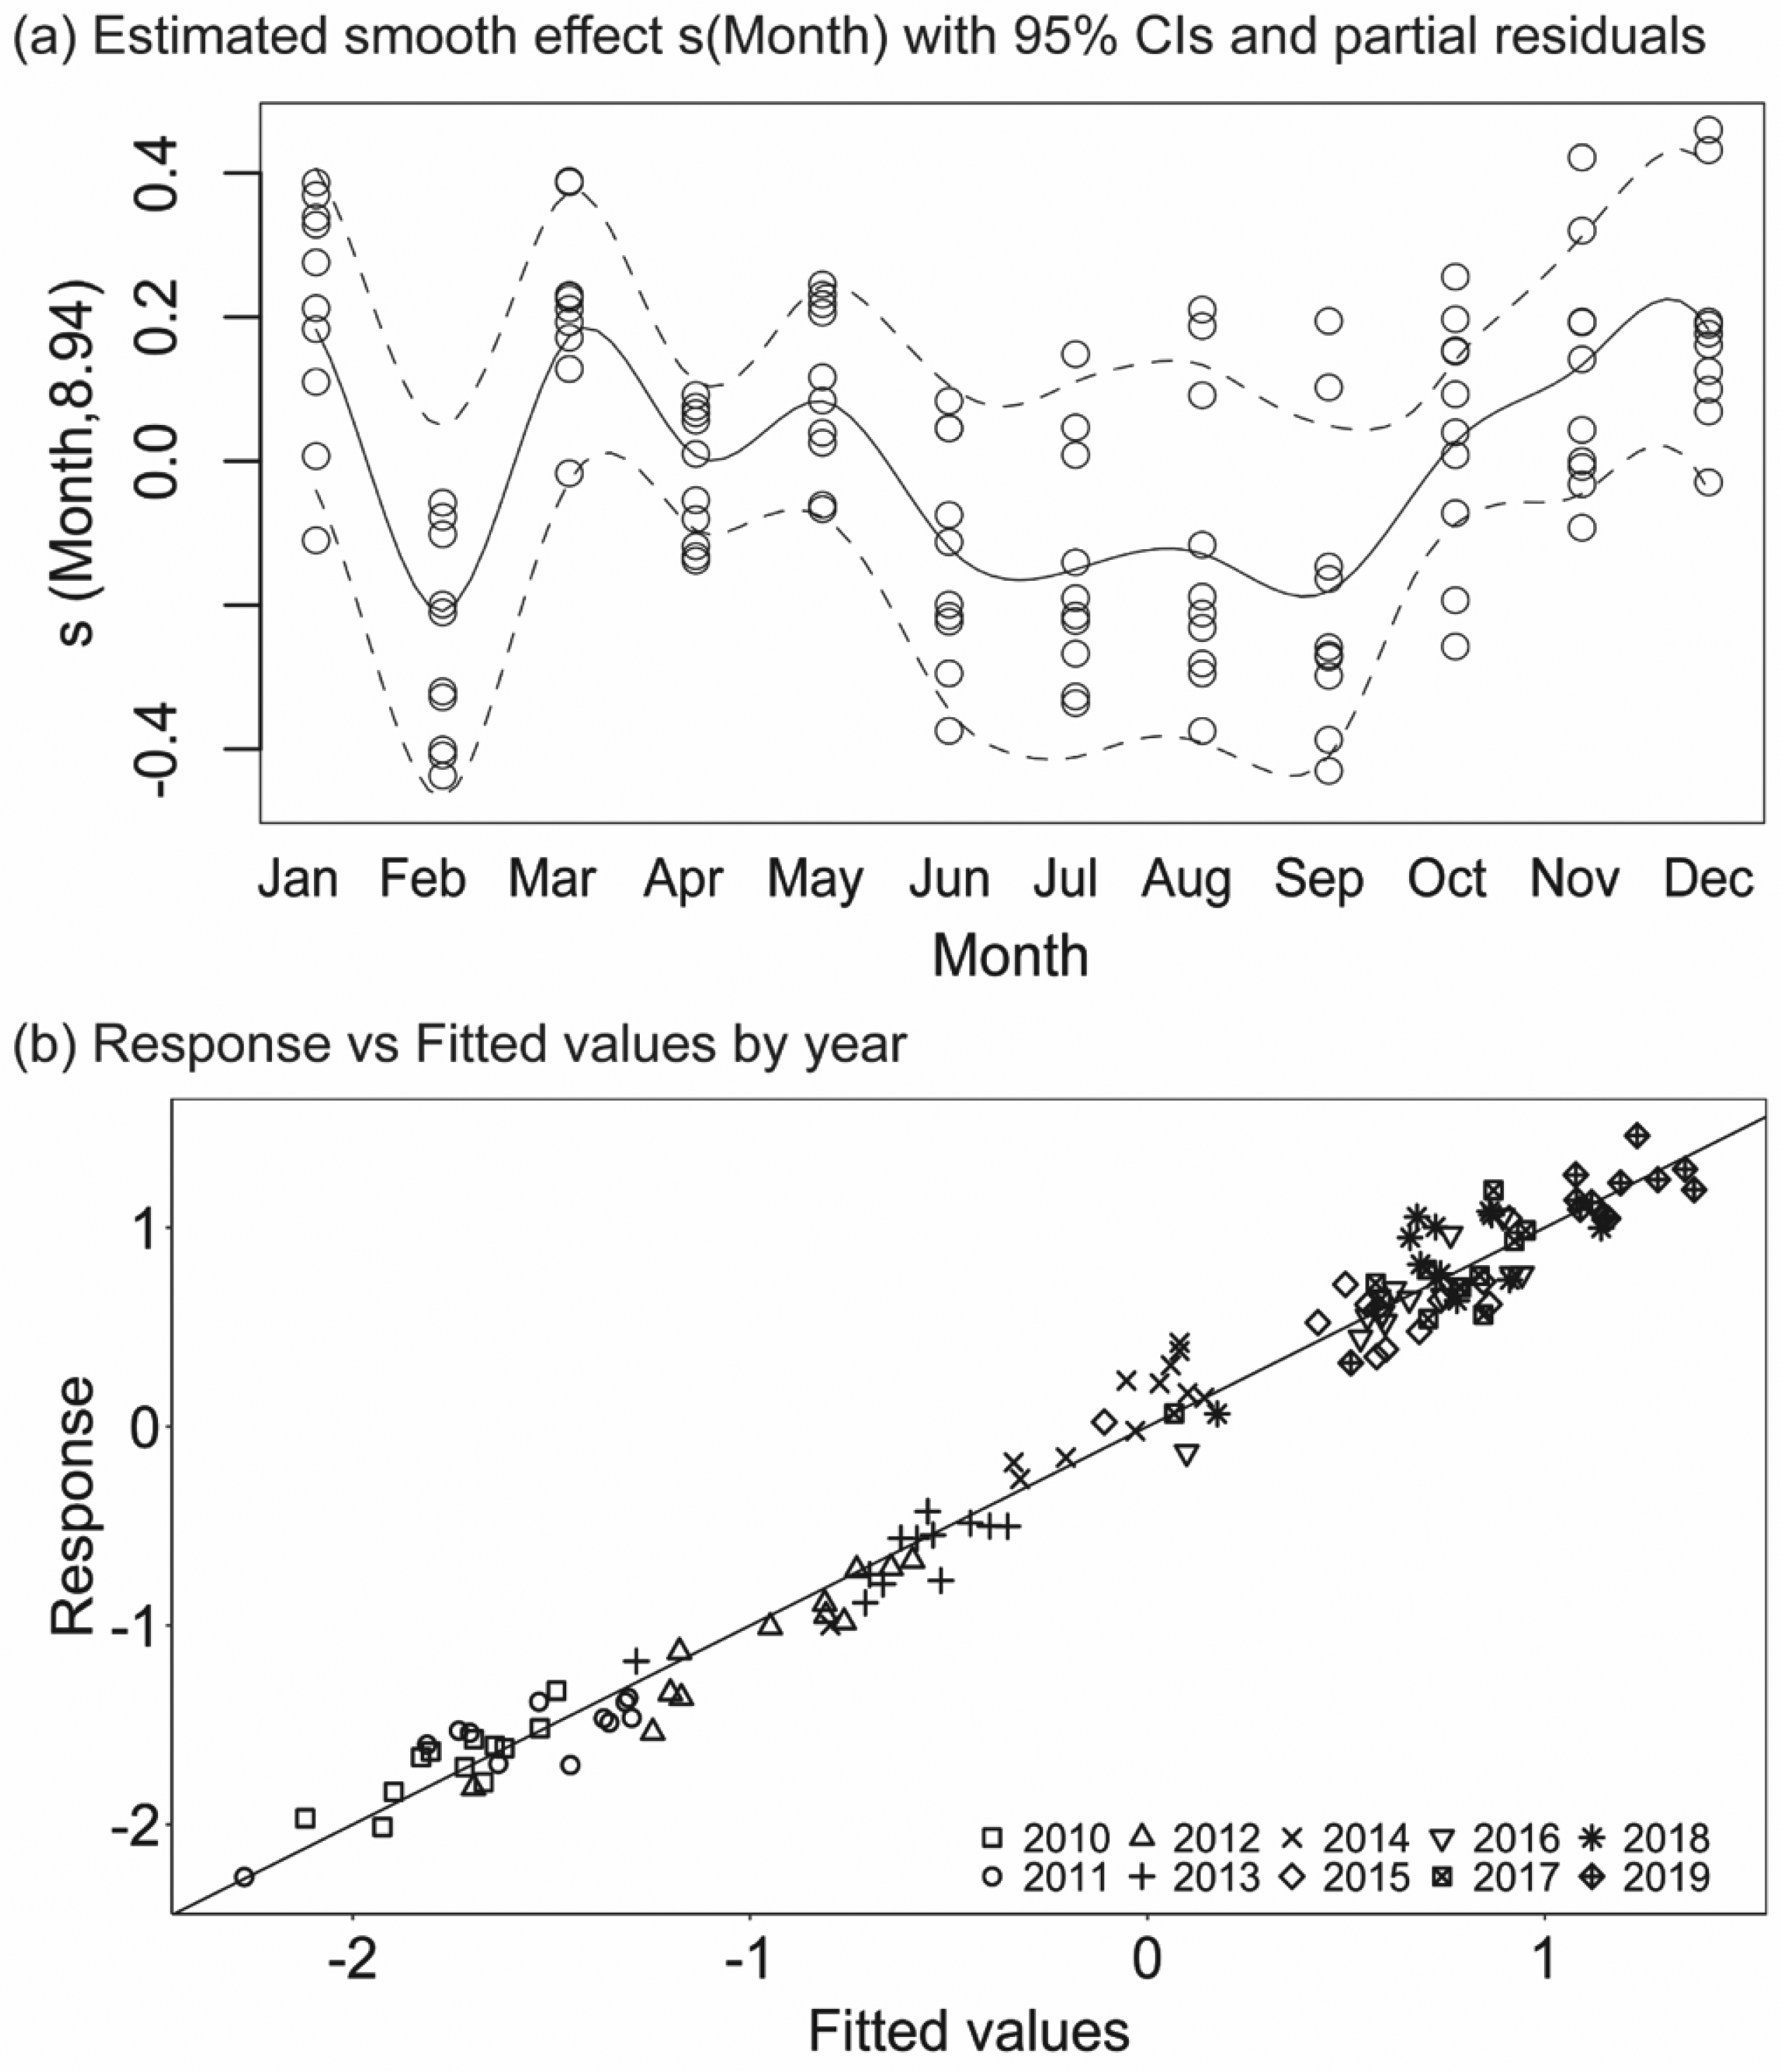
Goodness of fit for the full model.
Discussion and conclusion
Using data published by governmental agencies in Macao, our study explored the possibility of using publicly available data to predict the trend of monthly MSW generation in Macao. In particular, we adopted a machine learning strategy and compared six predictive models that implement both conventional (MLR and ARIMA) and state-of-the-art machine learning (SVM, ANN, RF, and GAM) methods. Our results contribute to the existing literature in two ways. First, we found that GAM outperformed the rest of the models in predicting MSW generation in Macao. Although prior research has suggested that machine learning models, such as ANN and SVM, could provide more accurate predictions than other modeling techniques (Abbasi et al., 2014; Kannangara et al., 2018; Kumar et al., 2018; Oliveira et al., 2019), GAM could be more suitable when data present strong seasonality and potential domain shift. Second, we estimated the effects of population, tourism, and household-related variables on MSW generation. Consistent with the previous literature, both population-level and household-level factors contributed to MSW generation, such as population density, income level, and household energy consumption. In particular, we identified a positive relationship between the proportion of large households (i.e. those with four or more members) and MSW generation. In addition, in line with the previous findings on the influence of tourism activities (e.g. food consumption, shopping, and accommodation) on MSW generation (Altinay and Hussain, 2005; Oribe-Garcia et al., 2015), our results support that tourism activities, especially tourists’ spending on non-tradable goods and services, positively affected MSW generation.
However, the current study is limited in several aspects. First, due to data limitations, we could not elaborate on the mechanisms of MSW generation. Although GAM showed a positive relationship between the proportion of large households and MSW generation, we could not determine which aspect of household consumption influences MSW generation along with their mechanisms. For instance, do they generate more organic waste related to cooking, or more plastic, paper, and PET bottle waste related to ordering takeout? Hence, further study is needed to collect behavioral data at the household level to understand the effects of household-level factors on MSW generation, which can be useful for policy intervention. Second, since the predictive model was built using limited information specific to Macao, it might not be generalizable to other places. On the one hand, although all available MSW data covering more than 10 years were collected, our dataset is still very limited, and many machine learning methods (e.g. ANN) can fail when trained with limited data. On the other hand, Macao's tourism sector heavily relies on tourists from the Chinese Mainland, and the influx of visitors is largely determined by the latter's seasonal travel and holiday patterns, which might not be true for other cities with different patterns of seasonality. Furthermore, the robustness of GAM in predicting monthly MSW generation needs to be assessed with forthcoming data. The model could be further updated because modeling MSW generation should be a dynamic and adaptive process.
Despite those limitations, to the best of our knowledge, our study is the first that attempts to understand the process of MSW generation and build a predictive model for the amount of MSW generated, which could be the basis for the future development of MSW management policies in Macao. Our results indicate that households with four or more members produce significantly more MSW than those with three members or fewer. Further studies are needed to understand patterns of household consumption, especially for large-sized households. New policy interventions could be developed to encourage people to participate in domestic waste reduction, reuse, and recycling. Furthermore, the identified pattern of seasonality provides a good starting point for understanding the fluctuation of MSW within a year, which could be useful for allocating and optimizing resources for MSW management. We hope our study could be a stepping stone for more studies in this field to guide MSW management in municipalities with seasonal influxes of visitors.
Footnotes
Contributorship
Tianji Cai designed the study, while Qing Lan was responsible for collecting the data. Both Qing Lan and Haonan Guo carried out the analysis, and Qing Lan, in collaboration with Tianji Cai, took charge of writing and revising the paper. All authors have reviewed the paper before its submission.
Data availability
Data will be made available upon request.
Declaration of conflicting interests
The authors declared no potential conflicts of interest with respect to the research, authorship, and/or publication of this article.
Funding
The authors received no financial support for the research, authorship, and/or publication of this article.