
Abstract
This paper examines the trends in life expectancy and life disparity among the older population in China and its sub-national regions based on China National Population Census data from 1981 to 2020, using the life disparity indicator developed by Zhang and Vaupel. It is shown that, first, the life expectancy of the older population in both China and its sub-national regions has experienced a significant upward trend; however, the growth is uneven across regions. Second, life disparities due to deaths among the elderly in China and its sub-national regions followed a downward trend, but life disparities due to deaths among the elderly as a ratio of total life disparities increased, indicating an increasing importance of deaths among the elderly in life disparities amid overall mortality improvements. Third, multiple linear regression models indicate that variations in life expectancy and life disparity among the older population across regions in China may stem from uneven development in the health transition process and resulting disparities. The eastern region of China has experienced a faster health transition compared to the western region, as evidenced by the greater impact of investments in medical facilities and economic development levels on increasing old-age life expectancy and reducing old-age life disparities in the eastern region. This paper reveals that the life expectancy and life disparity of China's older population has improved considerably over the past four decades, and its relatively lagging improvement compared to that of developed countries over the same period may be related to the relatively lagging health transition in the western region of the country.
Introduction
As the most populous country globally, China is grappling with a swiftly expanding older population, posing continual challenges to the sustainability of population health not only within China and East Asia but also globally. By 2035, as per the United Nations Population Division's medium scenario in World Population Prospects 2022, China's population aged 60 years and older is projected to constitute 30.31% of the total population, in contrast to the global proportion of 18.07% (United Nations, 2022). Therefore, understanding the well-being of China's sizable older population is a crucial issue warranting ongoing academic scrutiny.
Presently, numerous scholars have engaged in noteworthy discussions regarding the mortality levels of and changing trends among China's older population. These analyses commonly concur that the life expectancy of China's older population demonstrates a consistent upward trajectory (Huang and Sha, 2023; Qiao, 2023; Wang and Mi, 2013; Zhang and Fu, 2022). Nevertheless, its growth rate has not exhibited a definitive trend of catching up with that of developed countries, as typically anticipated based on life expectancy at birth. Instead, it has shown a widening trend compared to developed countries, characterized by a delayed pace of growth (Guo et al., 2020). Additionally, some researchers argue that, when considering equivalent life expectancy levels, the life expectancy of China's female older population historically displays a more rapid growth rate compared to that of developed countries (Zhang and Sun, 2023).
As research has progressed, the discussion of life expectancy for the older population has gradually extended in recent years from a single discussion of the average and the degree of dispersion to a discussion of the disparities in deaths among the older population. In short, mortality disparity or life disparity can be reflected by the degree of variation in age-specific mortality rates within a population, which can be used to examine the degree of inequality in the likelihood of survival of the members of a society. In this regard, the studies that have been conducted on life disparities in China show that China has reduced life disparities to very low levels at the global level over the same level of income, but this reduction is mainly due to the contribution of the rapid decline in mortality for the youngest age groups (Zhang, 2016). In contrast to the dramatic reduction of infant mortality, China's old-age mortality remained concentrated in early old age until 2015, suggesting the potential for high life disparities in China's elderly population (Guo et al., 2020).
In comparison to the in-depth studies of mortality among the older population at the national level in China, the level of mortality and its disparities among the older population in China's sub-national regions are inadequately discussed at present. Earlier research has indicated a declining trend in old-age mortality across China's sub-national regions, with patterns of variation observed between the eastern, central, and western regions, and has identified possible factors affecting the differences between regions, encompassing family structure, demographic composition, economic development, healthcare, and environmental pollution, among others (Li and Yan, 2023; Wu and Qiao, 2023). Furthermore, mortality in China's rural older population has been found to be notably concentrated in relatively early old age, highlighting substantial urban–rural discrepancies (Peng et al., 2021). Nevertheless, two issues persist within the current regional studies of old-age mortality in the Chinese mainland.
First, most have focused only on the increase in life expectancy of the older population across regions or on differences between regions, and few scholars have analysed whether life disparities in old age have risen or fallen within regions. Indeed, similar to the great variation in life expectancy and life disparities that exist at the state level in the United States (Brown et al., 2023). China is likely to have large cross-regional differences in mortality levels, and in particular large life disparities at older ages, which have not yet been carefully discussed by scholars at the regional level in China.
It has been revealed that increases in life expectancy are strongly associated with compression of the age-at-death distribution. Several studies have argued that increases in life expectancy parallel increases in life disparities, that is, the distribution of deaths tends to expand with increasing life expectancy (Smits and Monden, 2009). However, follow-up studies have pointed out that, after 1960, as life expectancy increases beyond a certain point, life disparities do not also increase, and that, in general, the lower the level of life disparities, the higher the life expectancy, implying that growth and equity are compatible with each other (Vaupel et al., 2011). Consequently, life expectancy and life disparity in the older population cannot be viewed separately and in isolation from each other, but rather need to be examined simultaneously. For instance, when comparing two societies with the same life expectancy, the one with lower life disparity will have a higher potential for sustainable growth. By observing both the life expectancy and life disparity of the older population, it is possible to gain a deeper understanding of the changes in old-age mortality in China overall, as well as in its sub-national regions.
Second, the present debates on the utility of different influencing factors on old-age mortality in different regions of the Chinese mainland are lacking a temporal transition perspective, and thus fail to establish a unified explanatory framework on why a certain factor has a stronger effect in a certain region and a weaker effect in another, and remaining at the descriptive level of the discussion. This hinders our understanding of the deeper reasons for the variations in life expectancy and life disparities among older populations across regions, namely, uneven development in terms of the health transition.
Within the theoretical framework of the health transition, the process has been segmented into three stages: the “vanquishing of infectious diseases”; the “cardiovascular revolution”; and the “fight against aging”. Of these, the “vanquishing of infectious diseases” stage is further delineated into a three-stage epidemiological transition, namely: the “age of pestilence and famine”; the “age of receding pandemics”; and the “age of degenerative and man-made diseases” (Omran, 1971). Compared to Omran's initial framework, a new framework, however, was developed in response to the renewed widening of the gap in life expectancy between developing and developed countries in the 1990s due to the collapse of the Soviet Union, the acquired immune deficiency syndrome pandemic in Africa, and so on. It introduces the sub-stages of dispersion and convergence, arguing that within each major stage, there exists a sub-stage of dispersion followed by convergence. Health disparities across populations arise from differences in the degree of diffusion between the accessibility of medical technology and the prevalence of healthy lifestyles among individuals (Vallin and Meslé, 2004).
Follow-up studies further revealed that the health transition, especially in late-developing countries, is also highly time-compressed, meaning that multiple stages of transition may take place in the same place and at the same time and that different dynamics may be at work at the same time, which further extends the explanatory force of the health transition theory (Soares, 2007). In other words, changes in life expectancy and life disparities across regions are closely linked to the stage of the health transition that each region is in. Similar increases in life expectancy may stem from declines in mortality at different ages, while increases or decreases in intra-regional differences in life expectancy and life disparities may stem from whether the population is in a sub-stage of expansion or convergence. The framework thus provides this paper with a well-explained path for the horizontal differences and vertical variations in the levels of life expectancy and life disparities across regions.
Accordingly, to respond to the above two questions, this study quantifies the life expectancy and life disparity among China's older population by gender, province, and region spanning from 1981 to 2020, and discusses the corresponding mechanisms of the changes in the life expectancy and life disparity of China's older population by region within the framework of the health transition through the healthcare and economic data at the provincial level in China.
Data and methods
Data
To achieve the objectives of this paper, aimed at delineating alterations in life expectancy and life disparity among the older population in China overall and in its sub-national regions, data sourced from the 1981, 1990, 2000, 2010, and 2020 National Population Censuses of China have been employed. These censuses offer requisite mortality rate data categorized by province or municipality, sex, and age for the purpose of this research. With the exception of Tibet, Chongqing, and Hainan in 1982, and Chongqing in 1990, this paper obtained a total of 312 original life tables for the nation of China, encompassing 31 provinces and municipalities (Hong Kong, Macao, and Taiwan were not included), categorized by sex. It is important to note that due to substantially higher life expectancies attributed to distinct socio-economic differences in Hong Kong, Macao, and Taiwan compared to the Chinese mainland, the analysis in this paper excludes these special economic zones and will not revisit them in subsequent sections.
Meanwhile, to understand the different mechanisms of health effects in different regions, based on the assumptions of the health transition theory, this paper introduces additional provincial-level data, mainly covering the level of investment in medical facilities and the level of economic development. The assessment of medical facilities encompasses the number of beds and physicians per 1000 people while evaluating economic development involves the gross domestic product (GDP) per capita adjusted by the 1981 GDP index and the disposable income per capita adjusted by the 1981 consumer price index (CPI) for both urban and rural areas. These data were sourced from the online query system available on the National Bureau of Statistics of China (NBSC) website and the China Statistical Yearbooks. In this paper, the factors are extracted as principal components based on the aforementioned two dimensions for convenient interpretation. Furthermore, to account for geographical variations among provinces, the paper incorporates the annual average temperature. These data are derived from the daily observations of the National Climatic Data Center's Integrated Surface Database-Lite basic meteorological elements at stations across China and calculated as the provincial and annual averages. Finally, this paper also introduces the 2020 regional data on causes of death released by the Chinese Center for Disease Control and Prevention (China CDC) to gain a deeper understanding of the health transition stage of each region.
Methods
In terms of methods, this paper uses model life tables to adjust the mortality rate and then calculates the life expectancy of the older population as a measure of the level of mortality in the older population. At the same time, this paper uses the “life lost due to death” indicator developed by Zhang and Vaupel (2009) (hereafter “life loss”) as an indicator of life disparity in the older population, which is used in light of two main considerations. First, the loss of life has a clear demographic meaning, that is, the loss of life expectancy due to death in a population, and the smaller the value, the more concentrated the distribution of age at death in the population and the less disparity, and vice versa, the more disparity; meanwhile, the indicator has a strong correlation with the various measures of disparity that have been developed, with good mathematical properties. Second, the indicator has been widely used by the international community, such as the United States, India, Iran, Japan, and other countries, and could be incorporated into a broader international comparative analysis (Bayati and Kiadaliri, 2023; Brown et al., 2023; Pal et al., 2022; Zheng et al., 2021).
Initially, considering the substantial prevalence of death underreporting in census data across various countries, revising the raw mortality data becomes essential prior to commencing the analysis. Numerous studies on death underreporting in China have indicated that conventional assessment methods such as Brass-Logit and the United Nations model life table lack adequacy in rectifying death underreporting among the Chinese population, primarily due to the rapid health transition occurring over the past four decades. In contrast, models such as the life table developed by Wilmoth and other scholars, notably the flexible two-dimensional mortality model, have exhibited superior adaptability (Li et al., 2022). Hence, this paper employs the flexible two-dimensional mortality model to adjust the provincial mortality data extracted from censuses, utilizing 991 life tables sourced from the September 2023 update of the Human Mortality Database. This model functions by estimating empirical values derived from accessible historical data, thereafter fitting the age-specific mortality rates using two parameters (Wilmoth et al., 2012). Owing to space limitations, specific model details are not elaborated upon in this paper. Concerning particular parameter configurations, this study utilizes the life expectancy by province for all available years outlined in the 2021 China Population and Employment Statistics Yearbook (National Bureau of Statistics of China, 2021). Additionally, it incorporates the probability of death between the ages of 15 and 49, deemed relatively accurate within the raw life tables, as the input parameters for the model life tables. Utilizing these inputs, this study constructs 312 life tables for China, encompassing both national and sub-provincial levels, covering the period from 1981 to 2020, and subsequently calculates the respective life expectancy figures.
Subsequently, based on the revised life table data, this paper was then able to measure the indicator of life loss by period and province, denoted as
Here,
Also, for any modern population, there exists an old-age threshold age, denoted as
Death before
Nonetheless, with the continuous increase in life expectancy, the significance of late disparity becomes more pronounced. This is notably the case in Japan, where late disparity prevailed from 1990 to 1995, leading to an upsurge in the overall disparity (Zhang and Li, 2020). Hence, to more accurately depict the comparative significance between early disparity and late disparity, this paper calculates the ratio of late disparity (the expansion component) to total disparity, denoted as
Analytical strategy
Building on the preceding work, this paper conducts its analysis through two primary approaches. First, it describes and analyses the changes in life expectancy in China in general and in its sub-national regions, especially in the eastern, central, western, and north-eastern regions. The changes are described at the regional level rather than in provinces and cities, mainly because of the large number of provinces in China, the strong homogeneity within regions, and weak homogeneity between regions, thereby discussing the aggregation at the regional scale. For detailed information on changes in provinces and municipalities, please refer to Appendix Tables A1 and A2. Then, the description of the changes in each region can be further divided into two parts, beginning with a description of the changes in the average life expectancy of the older population in each region, followed by a description of the changes in old-age disparity and the ratio of old-age disparity to total disparity in each region. At the same time, this study employs corresponding demographic decomposition methods as necessary supplements to further understand the convergence phenomenon among various indicators. The above work provides a comprehensive overview for understanding the changes in life expectancy and life disparity among the older population in China and its regions over the past four decades.
Second, multiple linear regressions are used to analyse the mechanisms affecting life expectancy and life disparity among the older population in China's sub-national regions, and for the same reason, provinces and municipalities are grouped into four regions for ease of discussion. Under the framework of health transition theory, the differences in mechanisms in turn reflect the different stages of the health transition of the older population in different regions of China. Moreover, the discussion of the cause-of-death data further confirms this judgment, providing a theoretical discussion for understanding the relative lag of improvement in the older population's survival status within the context of the significant increase in life expectancy in China.
Results
Descriptive statistics
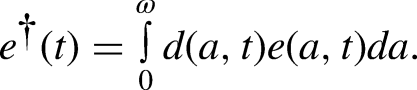
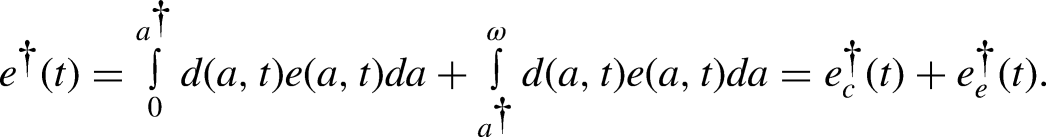
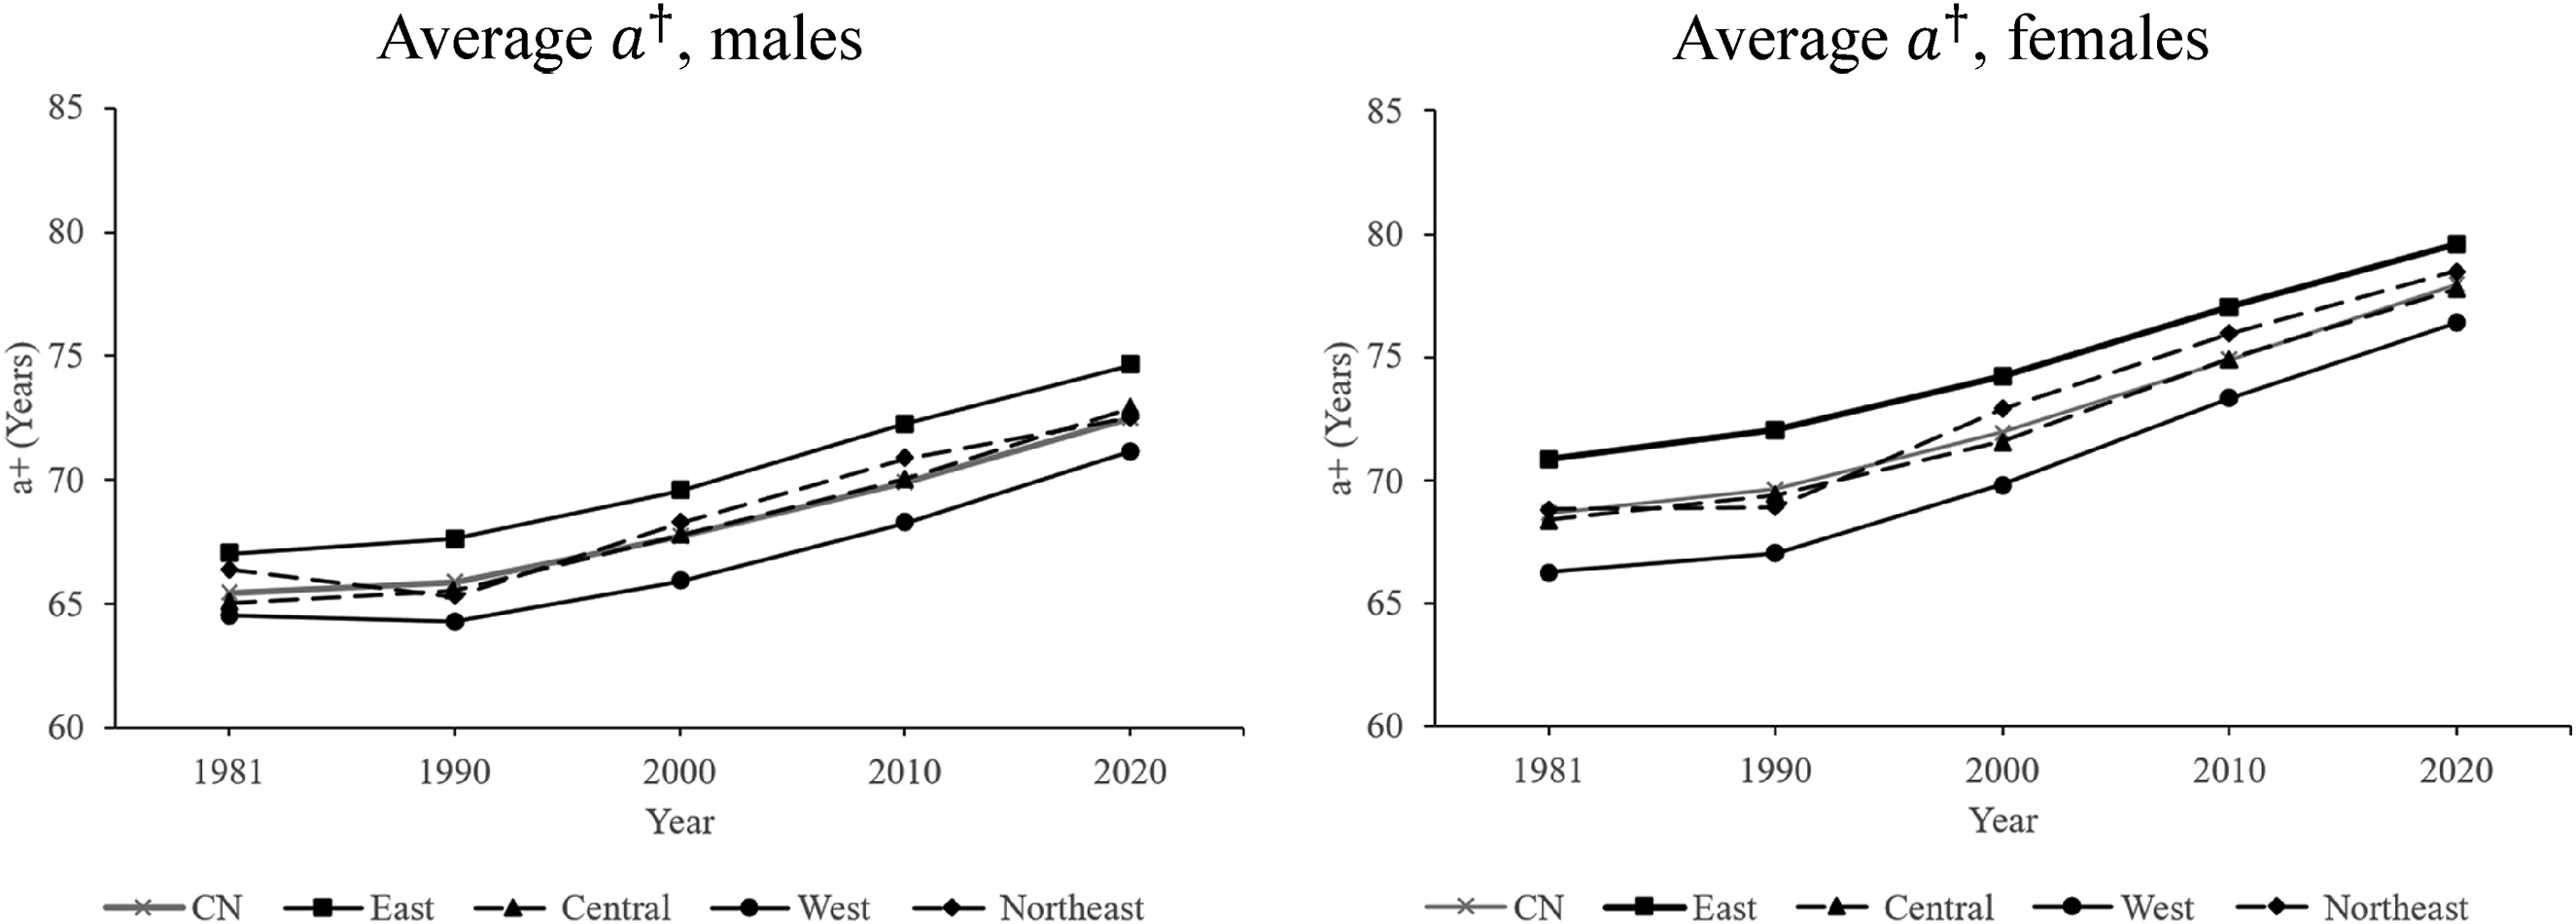
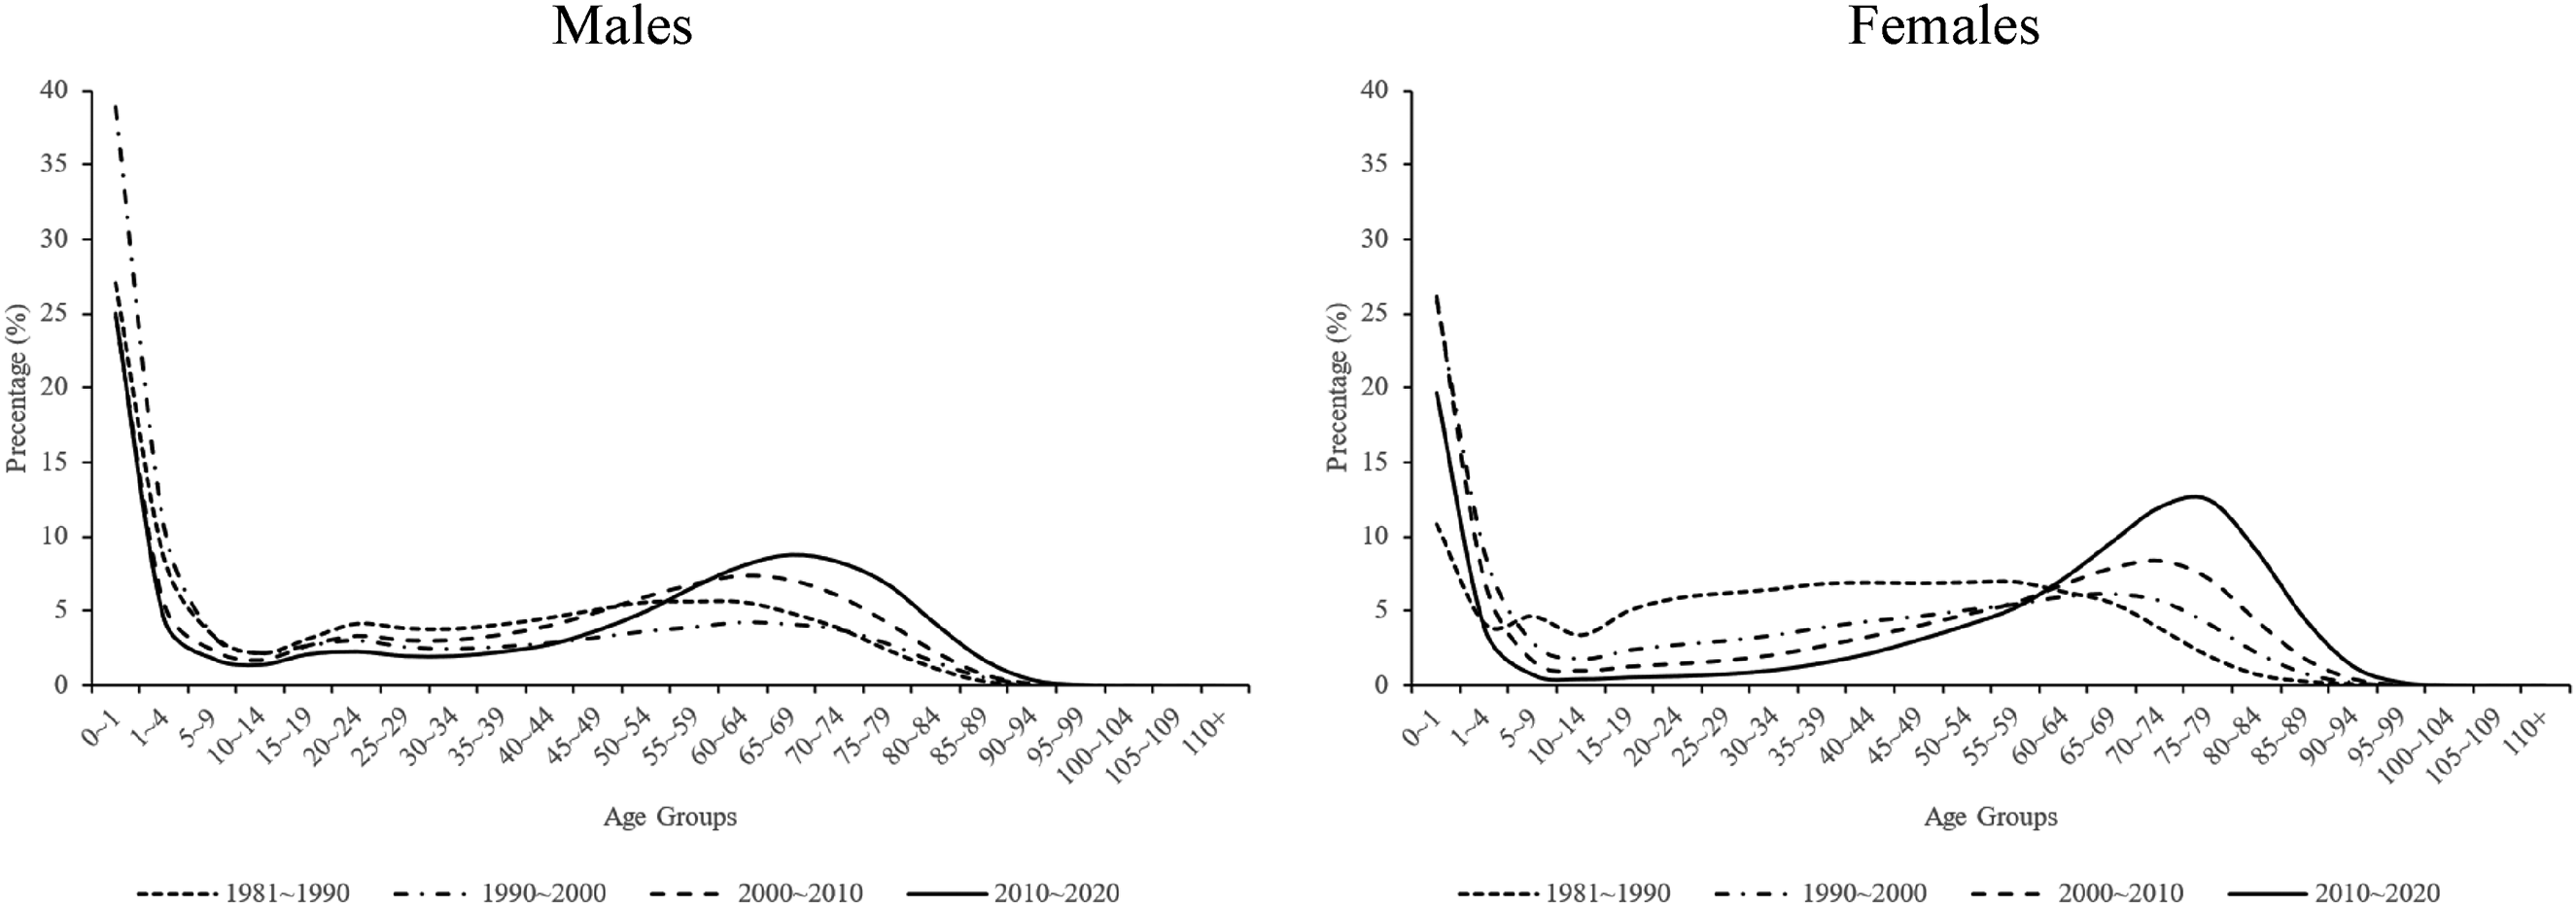
For a clearer depiction of changes in life expectancy within the older age group, this paper selects the population aged 60–64 as representative of early old age and the population aged 80–84 as representative of late old age. Subsequently, it illustrates the changes in average life expectancy for these two age groups across genders and regions.
In terms of the average life expectancy, as shown in Figures 1 and 2, overall, during the period from 1981 to 2020, the life expectancy of the older population in China has shown a significant upward trend, regardless of whether it is for males or females, and whether it is in the early-old-age group or the late-old-age group. In 1981 and 2020, respectively, life expectancy for the early-old-age group was 15.99 years and 19.29 years for males, 17.85 years and 23.07 years for females, and in the late-old-age group, life expectancy was 5.35 years and 6.51 years for males, and 5.91 years and 7.92 years for females. For the early-old-age group, the average annual increases were 0.53% and 0.75% for males and females, respectively, and for the late-old-age group, the average annual increases were 0.56% and 0.87% for males and females, respectively.
Trends in average life expectancy (LE) for both genders aged 60–64 in China and its four sub-national regions over the period 1981–2020.
Trends in average life expectancy (LE) for both genders aged 80–84 in China and its four sub-national regions over the period 1981–2020.
Between 1981 and 2020, except in the north-eastern and western regions, which experienced a slight decline between 1981 and 1990, life expectancy in all regions of China increased significantly. The rate of the increase in life expectancy declines in the order of the eastern, north-eastern, central and western regions, excepting that the rate in the central region is slightly higher than the north-eastern region in the early-old-age group of males. In terms of the average annual increase, the western region has the lowest growth rate for both males and females and both the early- and late-old-age groups. Considering the higher level of initial mortality in the western region, the gap between the average life expectancy of the eastern region and the western region has widened over the past four decades. In the early-old-age group, the gap between the eastern and western regions for men and women widened from 0.57 and 1.76 years in 1981 to 1.95 and 2.28 years in 2020, and in the late-old-age group, the gap between east and west for men and women widened from 0.31 and 0.63 years in 1981 to 0.63 and 1.06 years in 2020.
As mentioned earlier, however, the significant rise in the average life expectancy across regions does not determine whether life disparities across regions are growing or declining, or whether this increase is equitable and the growth in life expectancy in old age has reached the majority of the population. To respond to this question, this paper first plots the trend in the old-age threshold by gender and by region on average, as shown in Figure 3.
Trends in average old-age threshold age (
Figure 3 shows that between 1981 and 2020, China's overall old-age threshold has continued to shift upward, increasing from 65.42 and 68.68 years in 1981 to 72.51 and 77.98 years in 2020 for males and females, respectively. This is mainly due to the rapid decline in China's infant and adolescent mortality rates, which has shifted the threshold age upward (Wang et al., 2016); in other words, as overall mortality has declined, the threshold age at which one is considered old has risen.
Regional observations reveal that, except in the western and north-eastern regions, where there was a slight decline between 1981 and 1990, the old-age threshold increased significantly in all regions of China, and regardless of gender the threshold age was the highest in the eastern region and the lowest in the western region, which is highly consistent with the trends established in previous discussion on life expectancy. However, unlike the previous observations, in terms of average annual increases, the western region has the highest average annual increase for females between 1981 and 2020, at 0.39%, which is slightly higher than the eastern region's 0.31%. In conjunction with previous studies, this may be related to the faster decline in the western region in the context of higher initial infant mortality levels (Li and Yan, 2023), whereby the more rapidly declining infant and adolescent mortality rates have led to a relatively more rapid increase in threshold age in the western region.
Next, in the context of declining mortality across the general population, Figures 4 and 5 indicate trends in old-age disparity in China generally, as well as across regions, and variations in the relative contribution of old-age disparity.
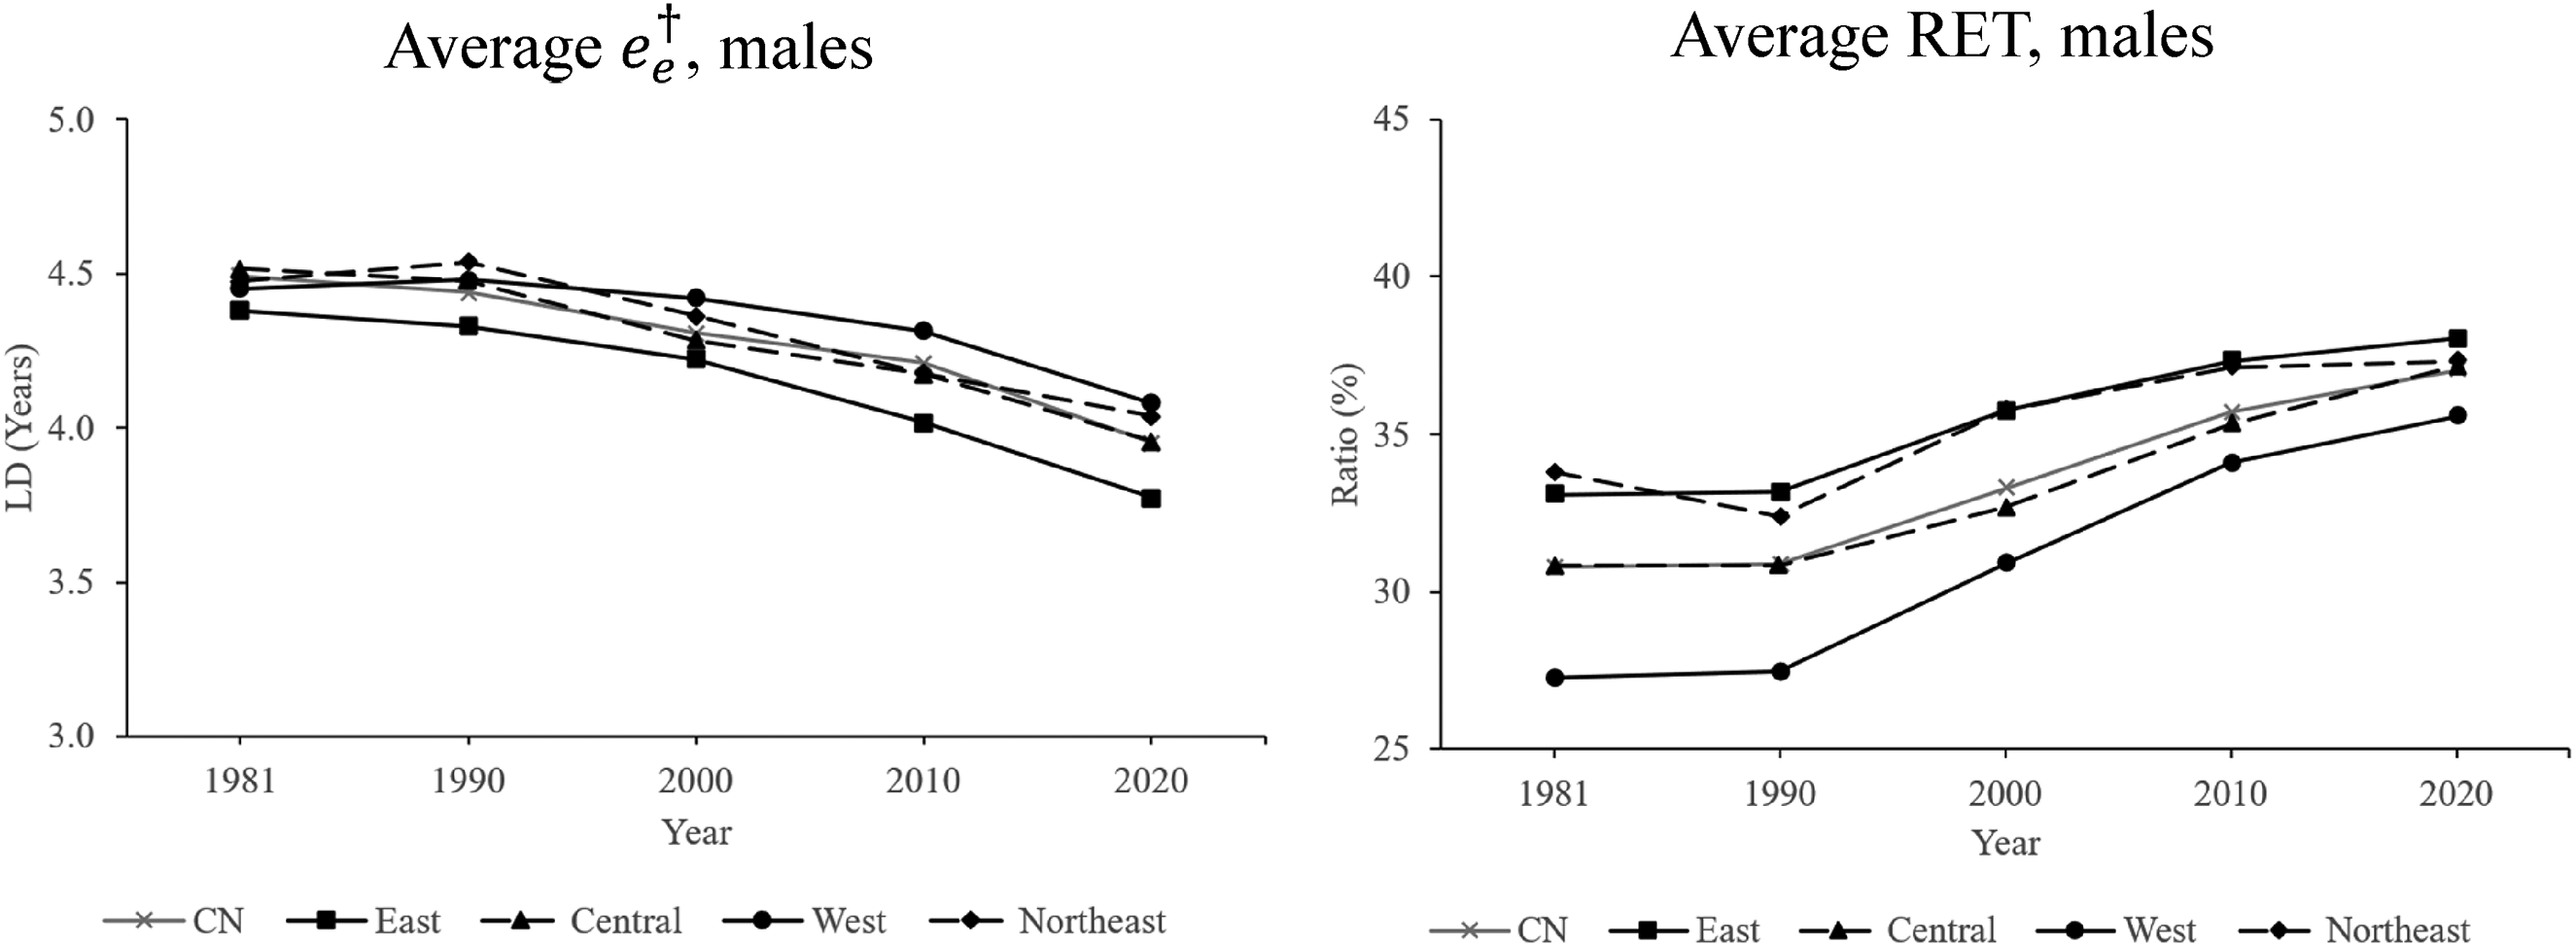
Trends in average male old-age disparity (
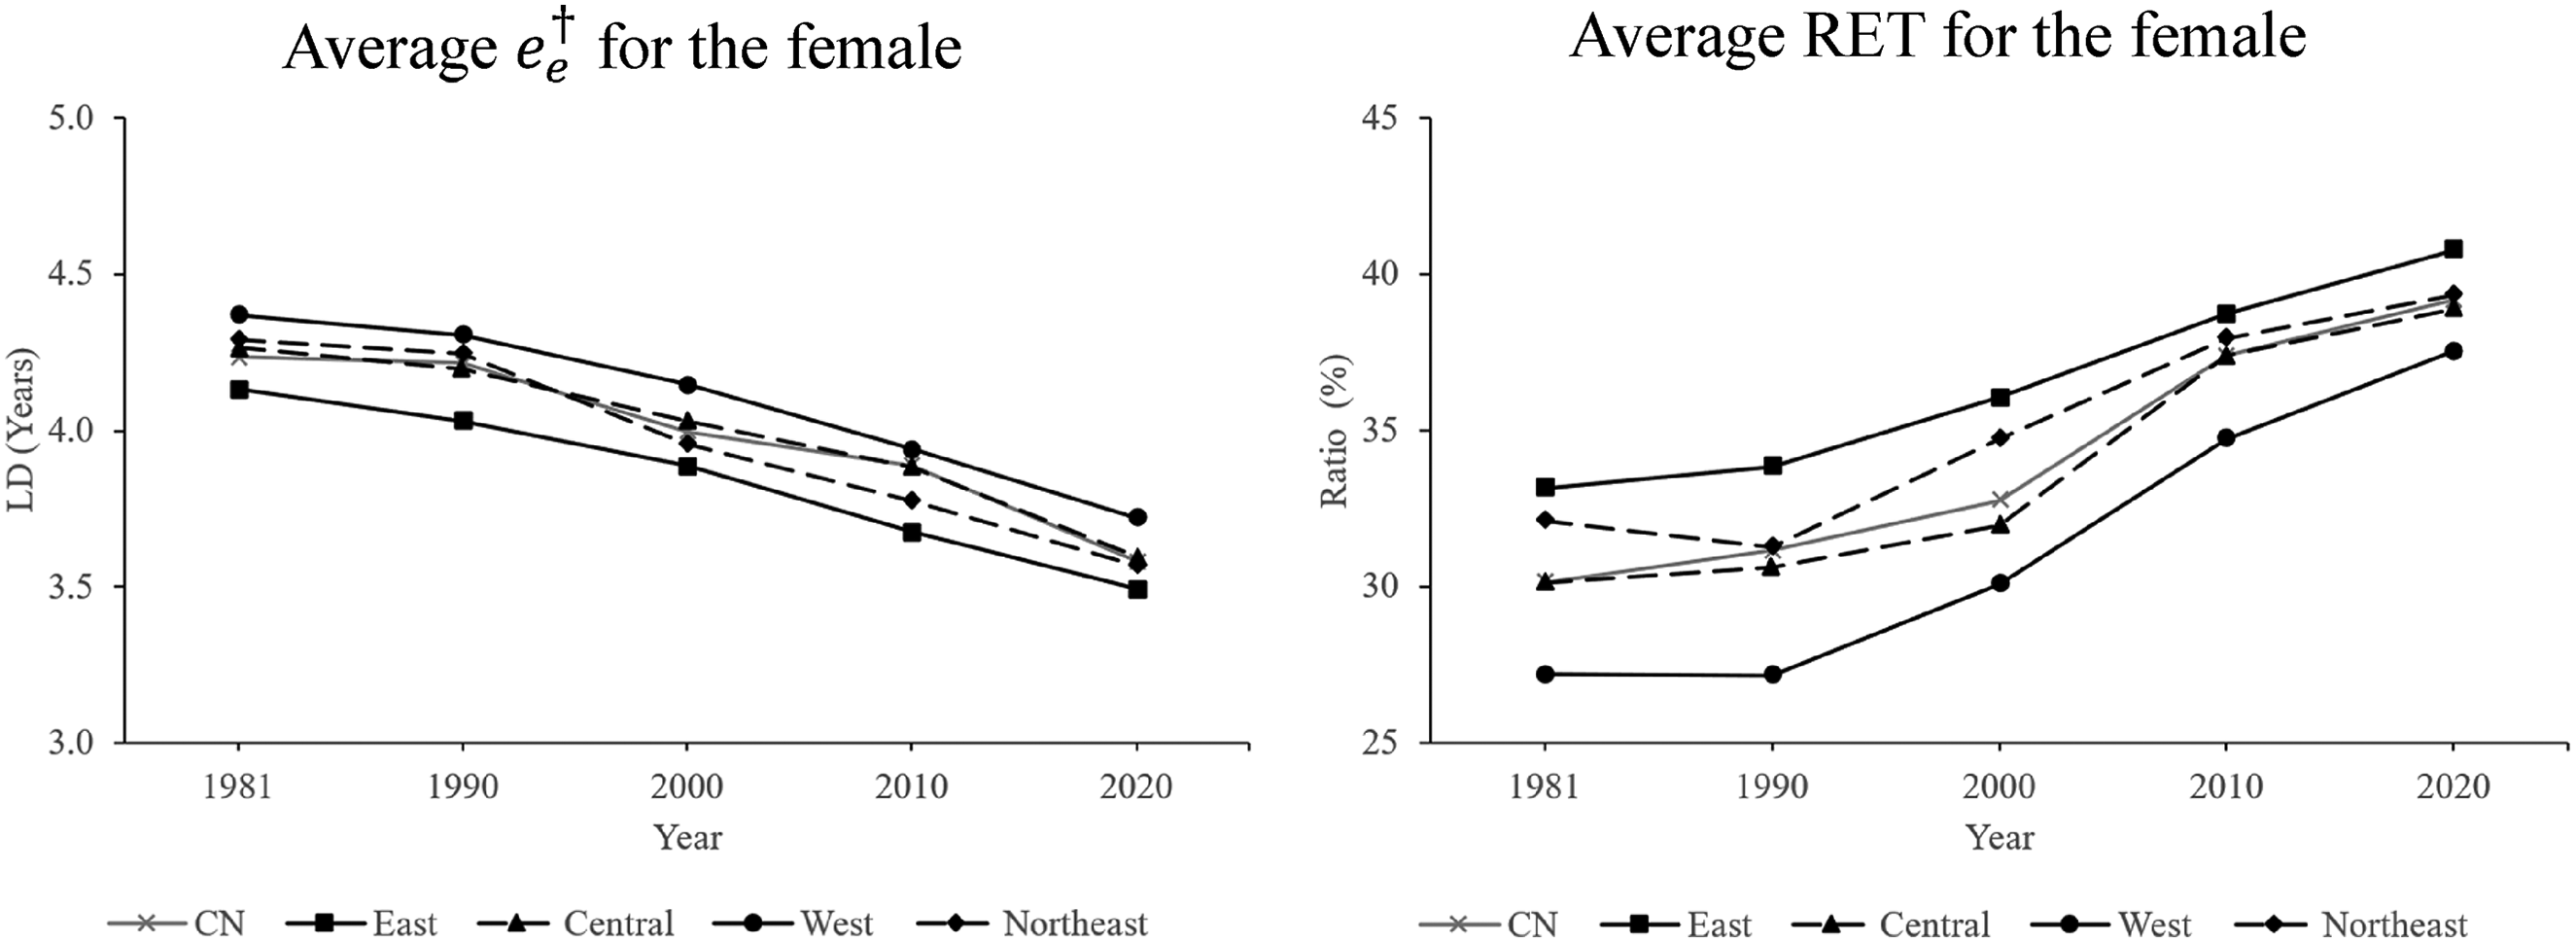
Trends in average female old-age disparity (
Concerning variations in old-age disparity for males, between 1981 and 2020, China's overall old-age disparity declined from 4.49 to 3.95 years, with an average annual rate of decline of 0.31%. At the same time, the ratio of old-age disparity to total disparity increased from 30.78% to 37.05%, with an average annual increase of 0.52%. These two opposite trends show that old-age disparity in China has been relatively improved, but the impact of old-age disparity has risen comparatively.
Observing the old-age disparity among males by region, it can be seen that if old-age disparities are ranked in descending order by region, between 1981 and 2020, the western region (4.45 years in 1981) moved from being only higher than the eastern region to being the highest of all the regions (4.08 years in 2020), except the eastern region, which consistently has the lowest disparities (4.38 years in 1981 and 3.77 years in 2020). Similarly, if the ratio of old-age disparity to total disparity in each region is ranked in descending order, between 1981 and 2020, except for the north-eastern region, which was higher in 1981, the eastern region is consistently the highest (33.09% in 1981 and 38.04% in 2020), and the western region is consistently the lowest (27.27% in 1981 and 35.59% in 2020). The above data show persistent and stable regional differences in old-age disparity in the context of continued improvement in overall old-age disparity in China, and reflect, in particular, a relative disadvantage in the western region and a relative advantage in the eastern region. More specifically, the western region, with its high total life disparity, also has the highest loss of life due to death in old age. However, the relative contribution of old-age disparity to total disparity in the western region is, instead, the weakest among the regions, and the western region also had the lowest average annual decline in old-age disparity (0.21% in the west and 0.36% in the east). But as the health transition deepens in China, as well as in each region, the relative contribution of old-age disparity is increasing, as reflected in the data that the western region has the highest average annual increase in the ratio of old-age disparity to total disparity among the regions between 1981 and 2020 (0.78%). Thus, the western region is rapidly approaching the stage of the health transition that is dominated by improvements in mortality levels among the elderly, but remains different from the eastern, north-eastern, and central regions because it is experiencing the slowest decline in absolute old-age disparity.
Similarly, concerning variations in old-age disparity among women, between 1981 and 2020, the overall old-age disparity declined from 4.24 years to 3.58 years, with an average annual rate of decline of 0.40%. Meanwhile, the ratio of old-age disparity to total disparity rose from 30.14% to 39.17%, with an average annual increase of 0.77%. In line with the previous observations on male old-age disparities, inter-regional observations reveal that the relative disadvantage of the western region and the relative advantage of the eastern region still exist and that there are no significant gender differences in terms of the ratio of old-age disparity to total disparity.
The above data show that China and its sub-regions exhibit significant differences in various indicators. However, the regions also demonstrate an essentially consistent pattern characterized by a highly synchronized trend: an increase in life expectancy in old age; a decrease in old-age disparity; and an increase in the ratio of old-age disparity to total disparity.
How can we interpret this phenomenon? First, increases in life expectancy are universally associated with declines in life disparity. This paper plots the correlation between life expectancy and the total, early, and late disparity in China's provinces and municipalities from 1981 to 2020, with no distinction between genders, as shown in Figure 6. It can be seen that life expectancy shows a significant negative correlation pattern with the total disparity, young-adulthood disparity, and old-age disparity in China, which is very consistent with the negative correlation patterns of countries around the world (Vaupel et al., 2011). Meanwhile, while young-adulthood disparity has remained dominant, it is clear that as life expectancy increases, total disparity and young-adulthood disparity are declining rapidly, and the contribution of old-age disparity is becoming more and more important.
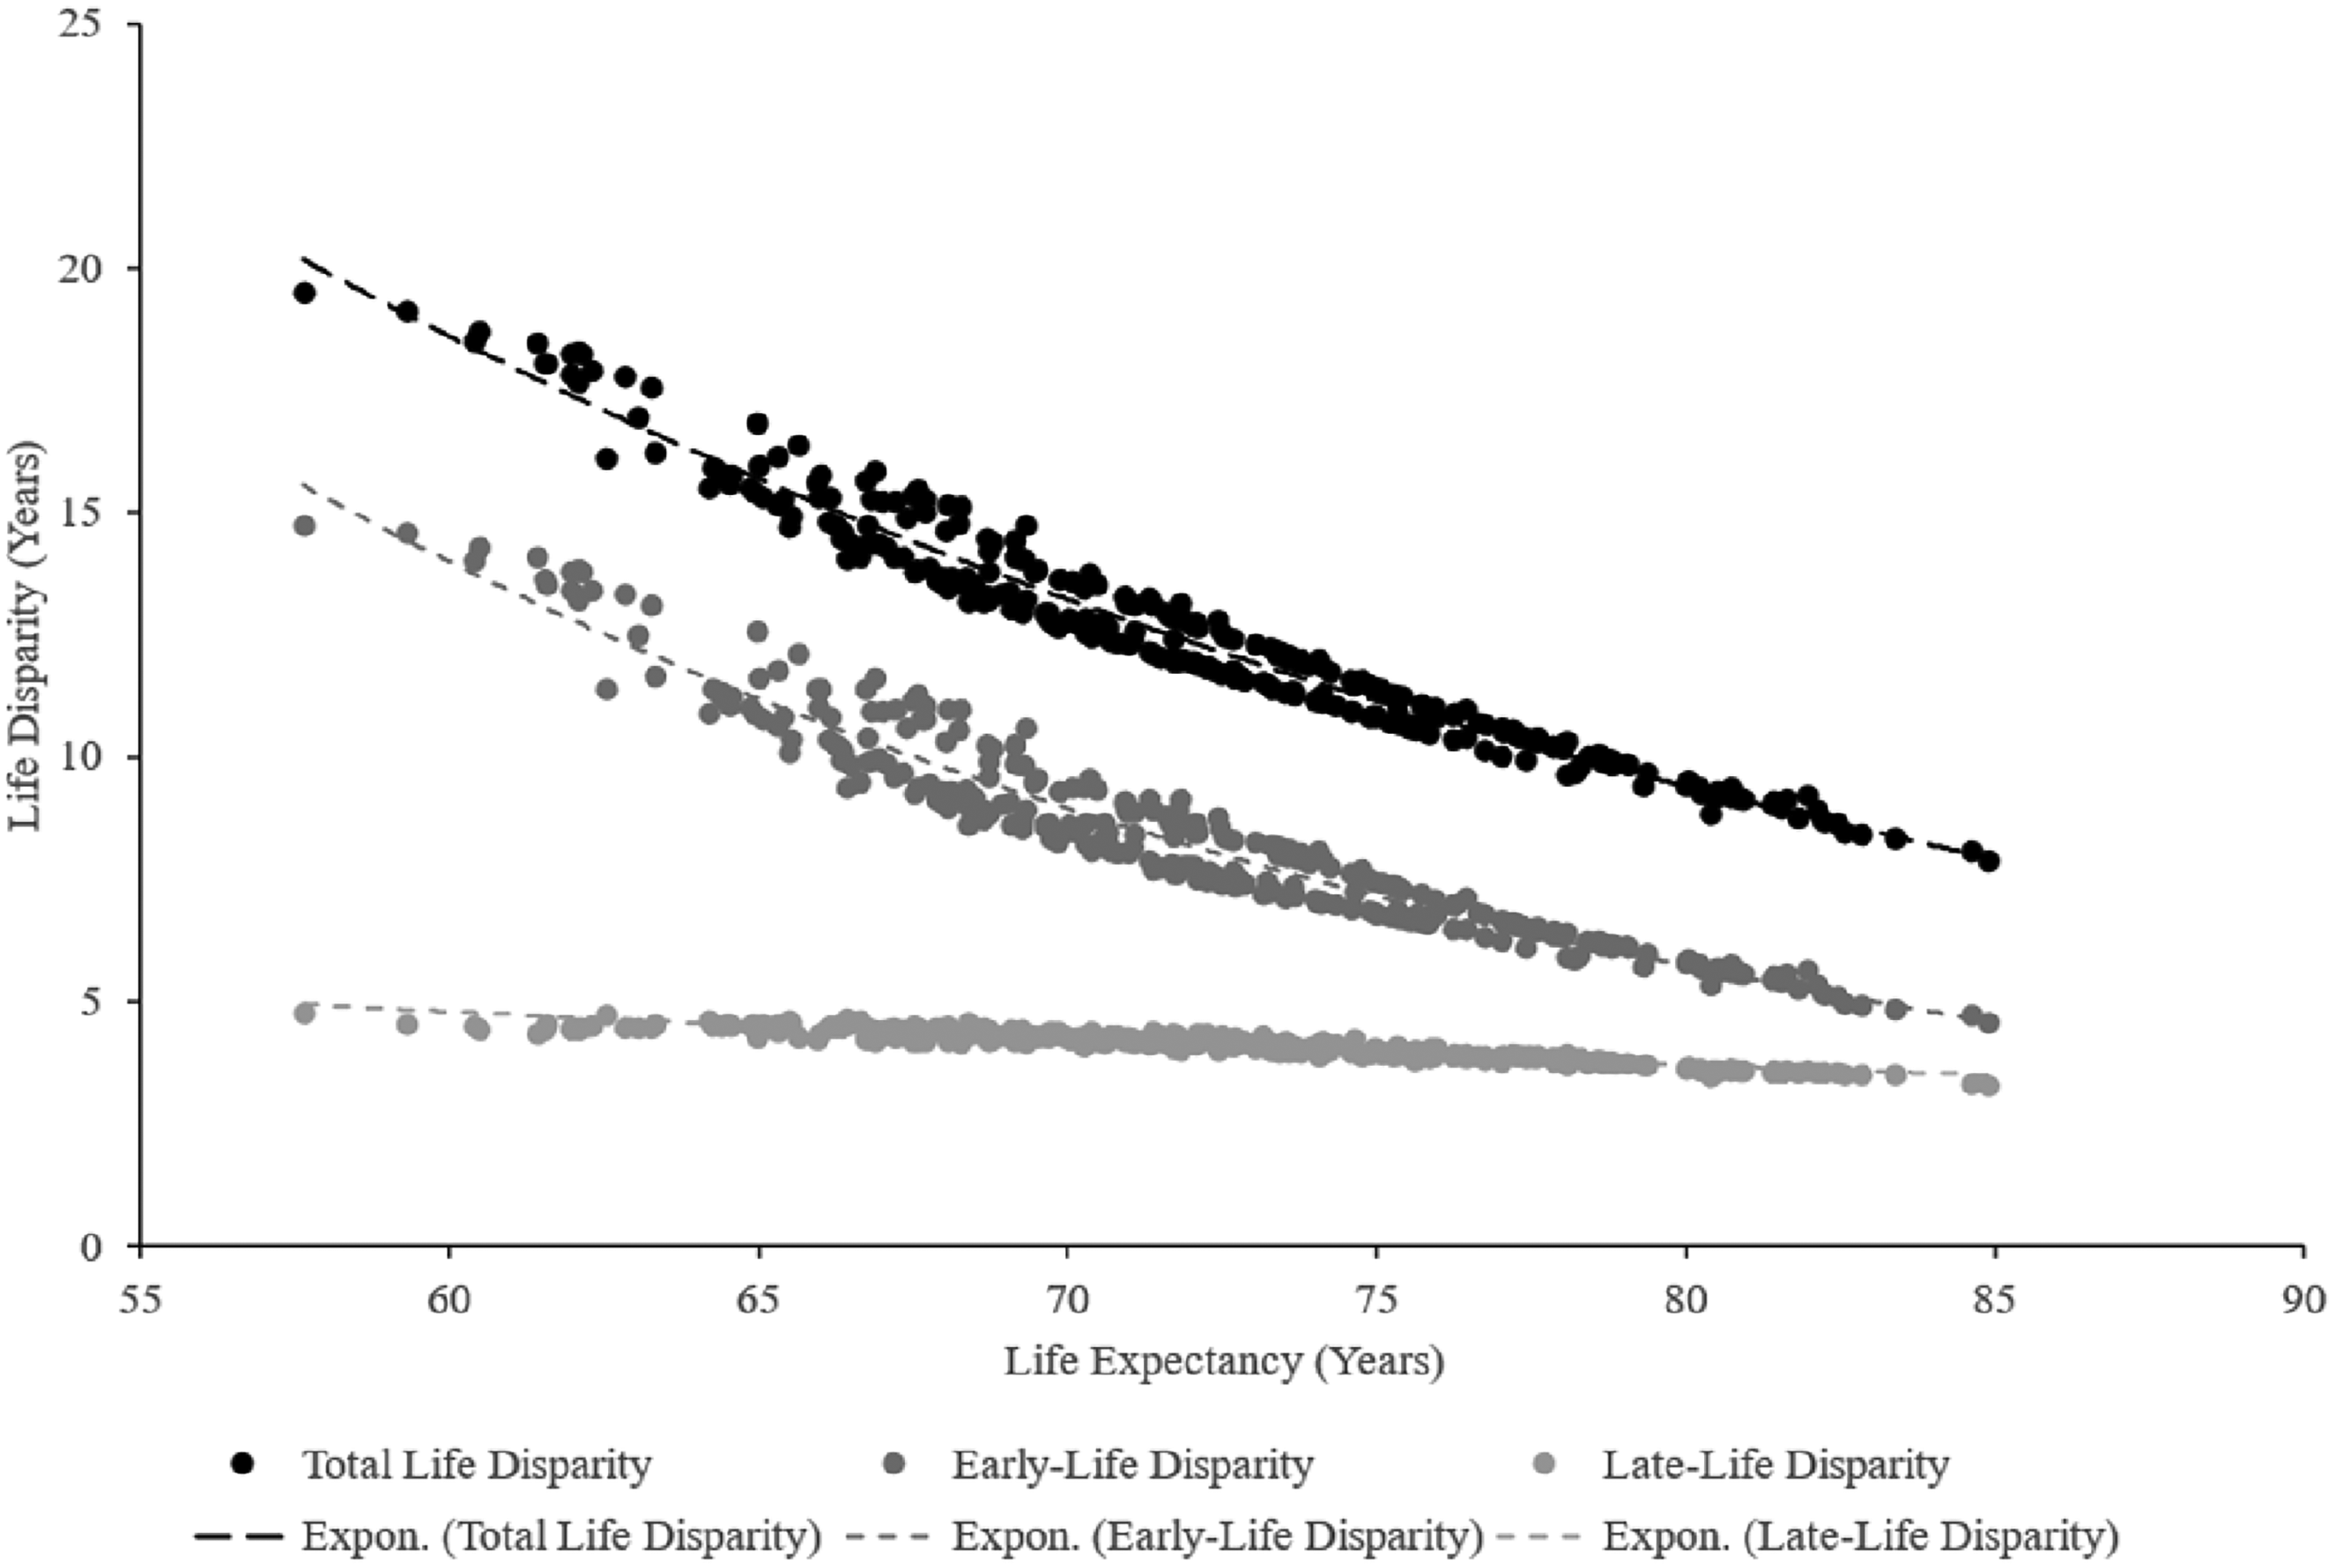
The relationship between life expectancy and life disparity by province and municipality in China between 1981 and 2020.
Second, in Chinese society, the decline in mortality among the early-old-age population is gradually becoming the main force behind the increase in life expectancy and the improvement in life disparity for the overall population. However, the improvement in mortality levels among the late-old-age population is serving as an increasing impediment to improvements in total life disparity, thus undermining the decline in old-age disparity. This phenomenon explains the simultaneous growth of old-age life expectancy and the ratio of old-age disparity to total disparity. To elucidate this, this paper decomposes the contribution of age-specific mortality rates to the growth of life expectancy and the contribution of age-specific mortality rates to life disparity in China between 1981 and 2020. This is done based on the Arriaga (1984) method and the Shkolnikov and Andreev (2010) method, respectively, as depicted in Figures 7 and 8.
Contribution of age-specific mortality rates to the increase in life expectancy in China between 1981 and 2020.
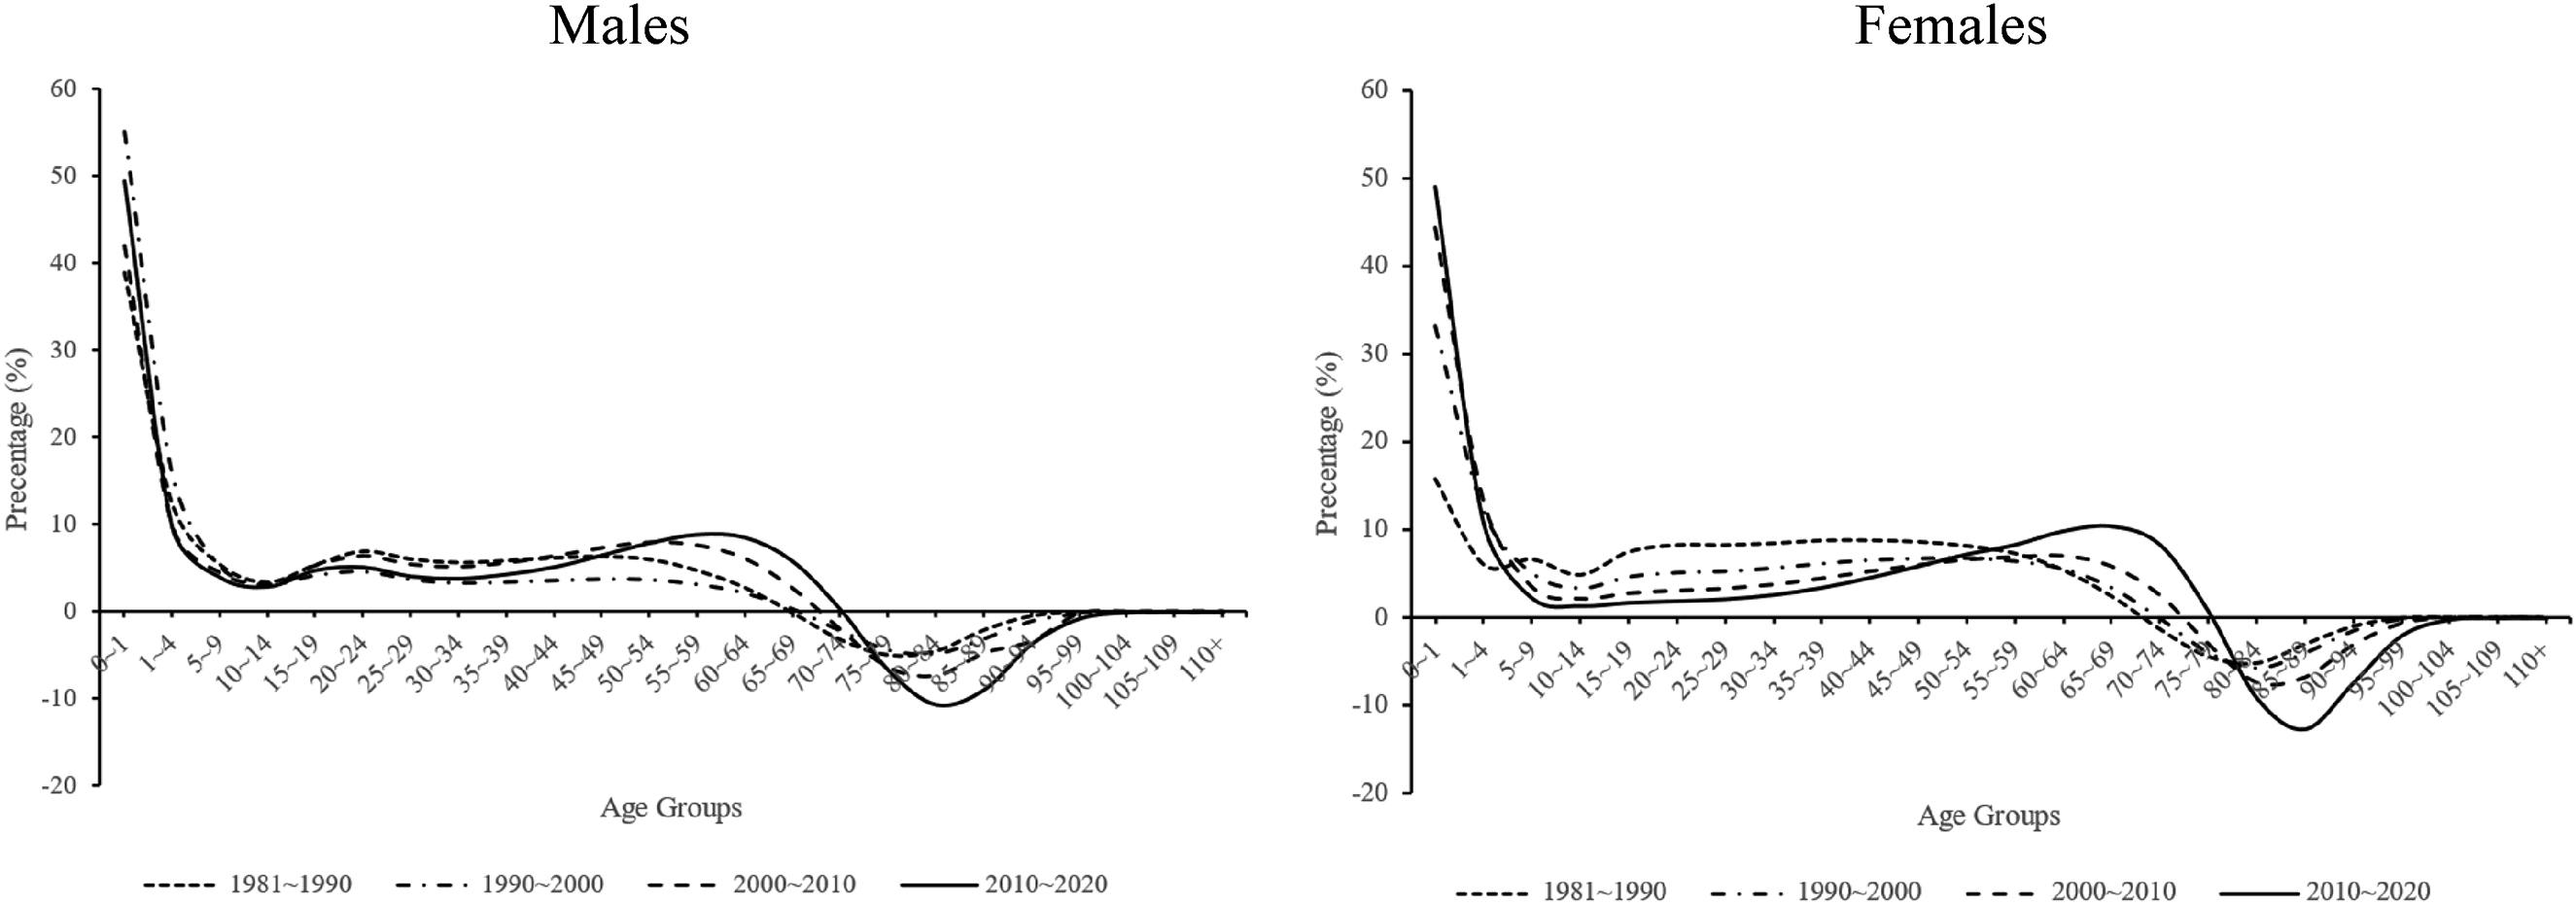
Contribution of age-specific mortality rates to the decline in life disparity in China between 1981 and 2020.
Figure 7, based on China's census data, indicates that the contribution of infant and child mortality to the increase in life expectancy is rapidly declining. Concurrently, the contribution of the early-old-age population to the increase in life expectancy is rapidly increasing, which accounts for the large increase in life expectancy for the population as a whole and the elderly. For instance, in the case of males, the contribution of the decline in infant mortality to the increase in life expectancy falls from 38.86% between 1990 and 2000 to 24.98% between 2010 and 2020. In contrast, the contribution of the decline in mortality among the early-old-age population, aged 60 to 79, to the increase in life expectancy rose from 15.05% between 1990 and 2000 to 31.96% between 2010 and 2020. Similarly, the contribution from mortality improvement among the late-old-age population, aged 80 to 99, rose from 2.31% to 6.36% over the same period. Therefore, while the mortality improvement of China's early-old-age older population has been relatively slow, as mentioned earlier, its impact on the increase in life expectancy for the whole population has significantly exceeded that of the infant group, and life expectancy in old age has improved significantly, owing to the larger decline in absolute numbers.
Figure 8 shows that the contribution of declining infant mortality to the improvement of total life disparity is diminishing, whereas the contribution of the early-old-age population is increasing. For instance, in the case of males, the contribution of infant mortality to the improvement of life disparity declines from 55.10% between 1990 and 2000 to 49.48% between 2010 and 2020. Concurrently, the contribution of the early-old-age population increases from −3.99% to 7.74% over the same period, shifting from a negative to a positive contribution. In contrast, over the same period, the contribution of the late-old-age population to the overall reduction in life disparity declines further from −9.02% to −24.13%.
Thus, the data indicate that the old-age threshold has consistently risen in China and its sub-regions, enabling a growing proportion of the elderly to survive to advanced ages. This trend expands the range of age groups considered in the calculation of young-adulthood disparity. Additionally, the increased mortality rate among the early-old-age population has contributed significantly to further reducing the young-adulthood disparity. On the other hand, while the threshold age has continued to move up, the loss of life expectancy due to deaths in the late-old-age population has acted as an increasing barrier to the decline in life disparity and may have thereby weakened the decline in life disparity produced by the improved mortality level in the late-old-age population. As a result, the relatively slower decline in old-age life disparity at a time of rapid decline in total life disparity and young-adulthood disparity has led to an increase in its ratio to total life disparity instead.
The descriptive discussion above has sketched out the increasing trend in life expectancy, the decreasing trend in life disparity for the older population, and the increasing trend in the ratio of old-age disparity to total disparity in China overall and across its regions from 1981 to 2020. Although there are relatively large differences in mortality levels across China's regions, all of China's regions have generally kept in line with the overall pattern of change, with the eastern region experiencing faster changes than the western region. However, the descriptive analysis has not yet addressed the reasons for regional variations in these indicators among the older population, and in particular, why there are large differences in old-age mortality between the eastern and western regions. To answer this question, it is necessary to introduce the discussion in the subsequent sub-section, on uneven development in the health transition across regions. In particular, the improvement in the mortality levels of the older population has been asynchronous across regions, which is reflected in the fact that the same health improvement mechanisms will show differences in their effects in different regions. Furthermore, this judgment is further supported by data on causes of death at the regional level.
Regression results
Initially, this sub-section examines health mechanisms across diverse regions to observe the sequential stages of the health transition, offering vital insights into regional disparities in old-age health levels. Aligned with the descriptive analysis sub-section, this segment focuses on life expectancies of individuals aged 60–64 and 80–84, alongside old-age disparity indicators. Additionally, to underscore the relative significance of old-age disparity within the total disparity framework, this study includes young-adulthood disparity for comparative purposes. These four indicators serve as dependent variables, while the associated influence mechanisms function as independent variables to construct a multivariate linear model. The outcomes of this model are depicted in Table 1.
Models of the impact mechanisms of life expectancy (
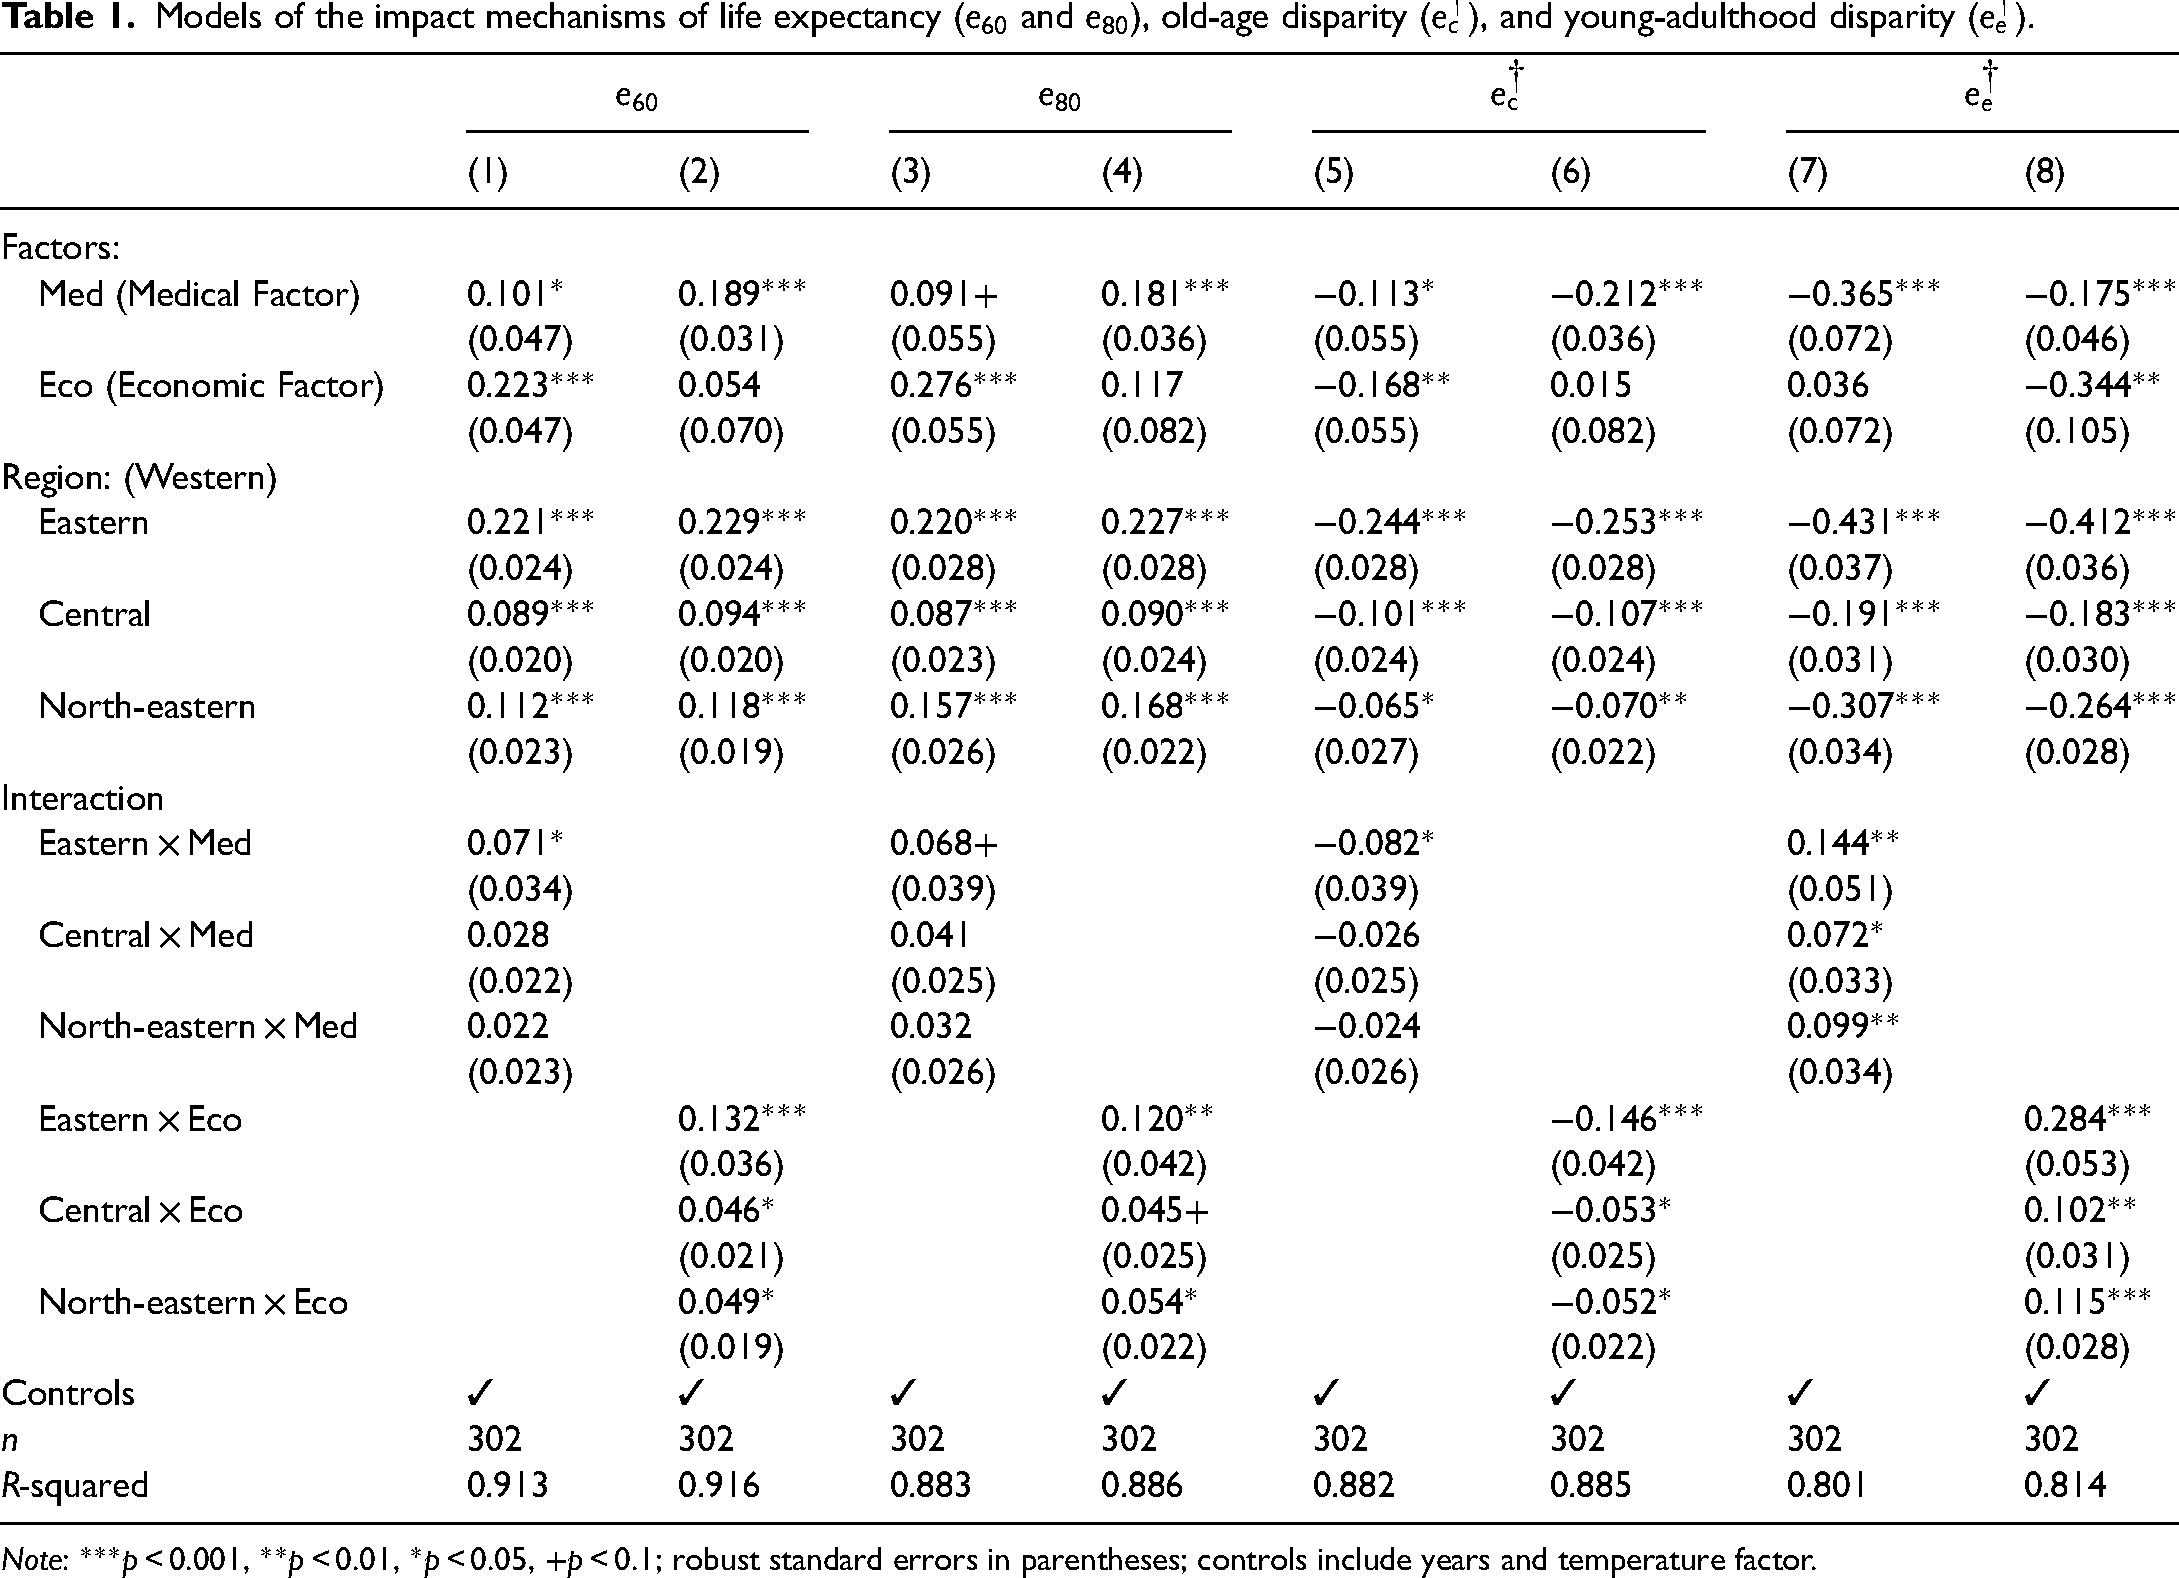
Note: ***p < 0.001, **p < 0.01, *p < 0.05, +p < 0.1; robust standard errors in parentheses; controls include years and temperature factor.
First, life expectancy, as shown in Models 1 to 4 in Table 1. In general, medical facility investments have a significant effect on increasing the life expectancy of the older population aged 60–64 and 80–84, while the effect of the level of economic development shows some fluctuations due to the interaction term. At the regional level, life expectancy in old age is consistently higher in the eastern region than in the western region, and observing the regional interaction terms, it was found that for life expectancy at 60–64 and 80–84, both medical facility investments and the level of economic development are significantly more effective in increasing life expectancy in the eastern region compared to the western region.
Differences in the effects of the above impact mechanisms can be well understood in the context of the health transition framework. In general, both medical facility investments and the level of economic development significantly contribute to reducing mortality. However, it is important to note that variations exist in the targeted age groups for these mechanisms. Specifically, in the stage of the vanquishing of infectious diseases, the decline in infant and child mortality, which was the main force behind the increase in life expectancy of the population as a whole, was very much dependent on investments in basic health facilities. But after the stage of the cardiovascular revolution, when the main force of mortality reduction transitions from infancy and adulthood to old age, the role of medical facility investments gradually weakens, as opposed to the level of economic development, which becomes the more important influencing force. This is mainly because basic medical facilities have limited effectiveness in addressing deaths from cardiovascular and cerebrovascular diseases, and whether advanced medical technology can be spread among the older population depends on local economic development and the average education level.
In terms of the results of this study, on the one hand, this is reflected in the standardized coefficients, where the level of economic development generally has a stronger influence on life expectancy in the elderly population compared to the basic medical facility investments. On the other hand, at the regional level, considering that life expectancy in old age is higher in the eastern region, the mechanisms of the medical facility investments and the level of economic development have a stronger effect on the increase of life expectancy of the older population in the eastern region, which is also a reflection of a faster health transition in the eastern region than in the western region (Li and Yan, 2023).
Second, regarding life disparity, as indicated in Models 5 and 6 presented in Table 1, broadly speaking, investments in medical facilities exhibit a significant impact on old-age life disparity, whereas the effect of economic development levels fluctuates, influenced by the interaction term. At the regional scale, old-age life disparity consistently exhibits lower levels in the eastern region compared to the western region. Further observation of the regional interaction terms reveals that both investments in medical facilities and the level of economic development demonstrate a significantly greater influence on reducing old-age life disparity in the eastern region than in the western region.
Meanwhile, in Models 7 and 8, the life disparity in young adulthood is lower in the eastern region, while the efficacy of the two mechanisms – medical facility investments and economic development level – exhibits a weaker impact in the eastern region compared to the western region. In other words, these mechanisms do not demonstrate a proportionally stronger impact in improving conditions in the eastern region, as observed in the context of old-age life expectancy and old-age life disparity.
The underlying reason for this disparity in mechanism effects requires further exploration within the health transition framework. It has been noted that a sub-stage of initial divergence followed by eventual convergence prevails at all stages of the health transition. Moreover, the decline in life disparity, as an indicator of the concentration of the age distribution of deaths in a population, suggests a compression or convergence of the distribution of deaths within the framework of the health transition. Although life disparity has continued to decline in China and its sub-regions, with all regions showing a convergence trend, each region is at a different stage of the health transition, and the improvements in their mortality levels have focused on different age groups. While the eastern region has transitioned to a stage of health transition characterized by declining deaths among the older population, the western region, with persistently high mortality levels among infants and young children as well as adults, is still lagging behind the country as a whole.
Therefore, as outlined in the descriptive analysis, regarding the life disparity in young adulthood, the rate of decline in the western region is significantly higher than that in the eastern region, indicating a catching-up trend between the western and eastern regions. Conversely, regarding the life disparity in old age, the rate of decline in the western region is significantly lower than that in the eastern region, indicating a diverging trend between the western and eastern regions. The mechanism effect also reflects this difference, considering that infant and child deaths are mainly attributed to infectious diseases, that universal access to basic medical facilities is effective in ameliorating inequality across regions, and that inexpensive and easily accessible basic medical facilities are effective in reducing higher levels of life disparity among young adults in the western region. Meanwhile, deaths among middle-aged and older people are mainly attributed to degenerative diseases, and their access to medical technology is heavily reliant on local economic factors. China's uneven economic distribution, in turn, further exacerbates the differences in old-age life disparity between the east and west. Nevertheless, since health transitions in late-developing countries are often multi-stage and overlapping, investment in medical facilities and the level of economic development are not mutually exclusive for the eastern and western regions but rather work in tandem.
Subsequently, for further understanding of the differences in mechanism effects across regions, this paper introduces data on causes of death for individuals aged 65 years and over in each region, as shown in Figure 9. These data strongly suggest that behind the differences in mechanism effects is an asynchronous decline in the level of deaths among the older population in each region, and that the older population in each region is at different stages of the health transition.
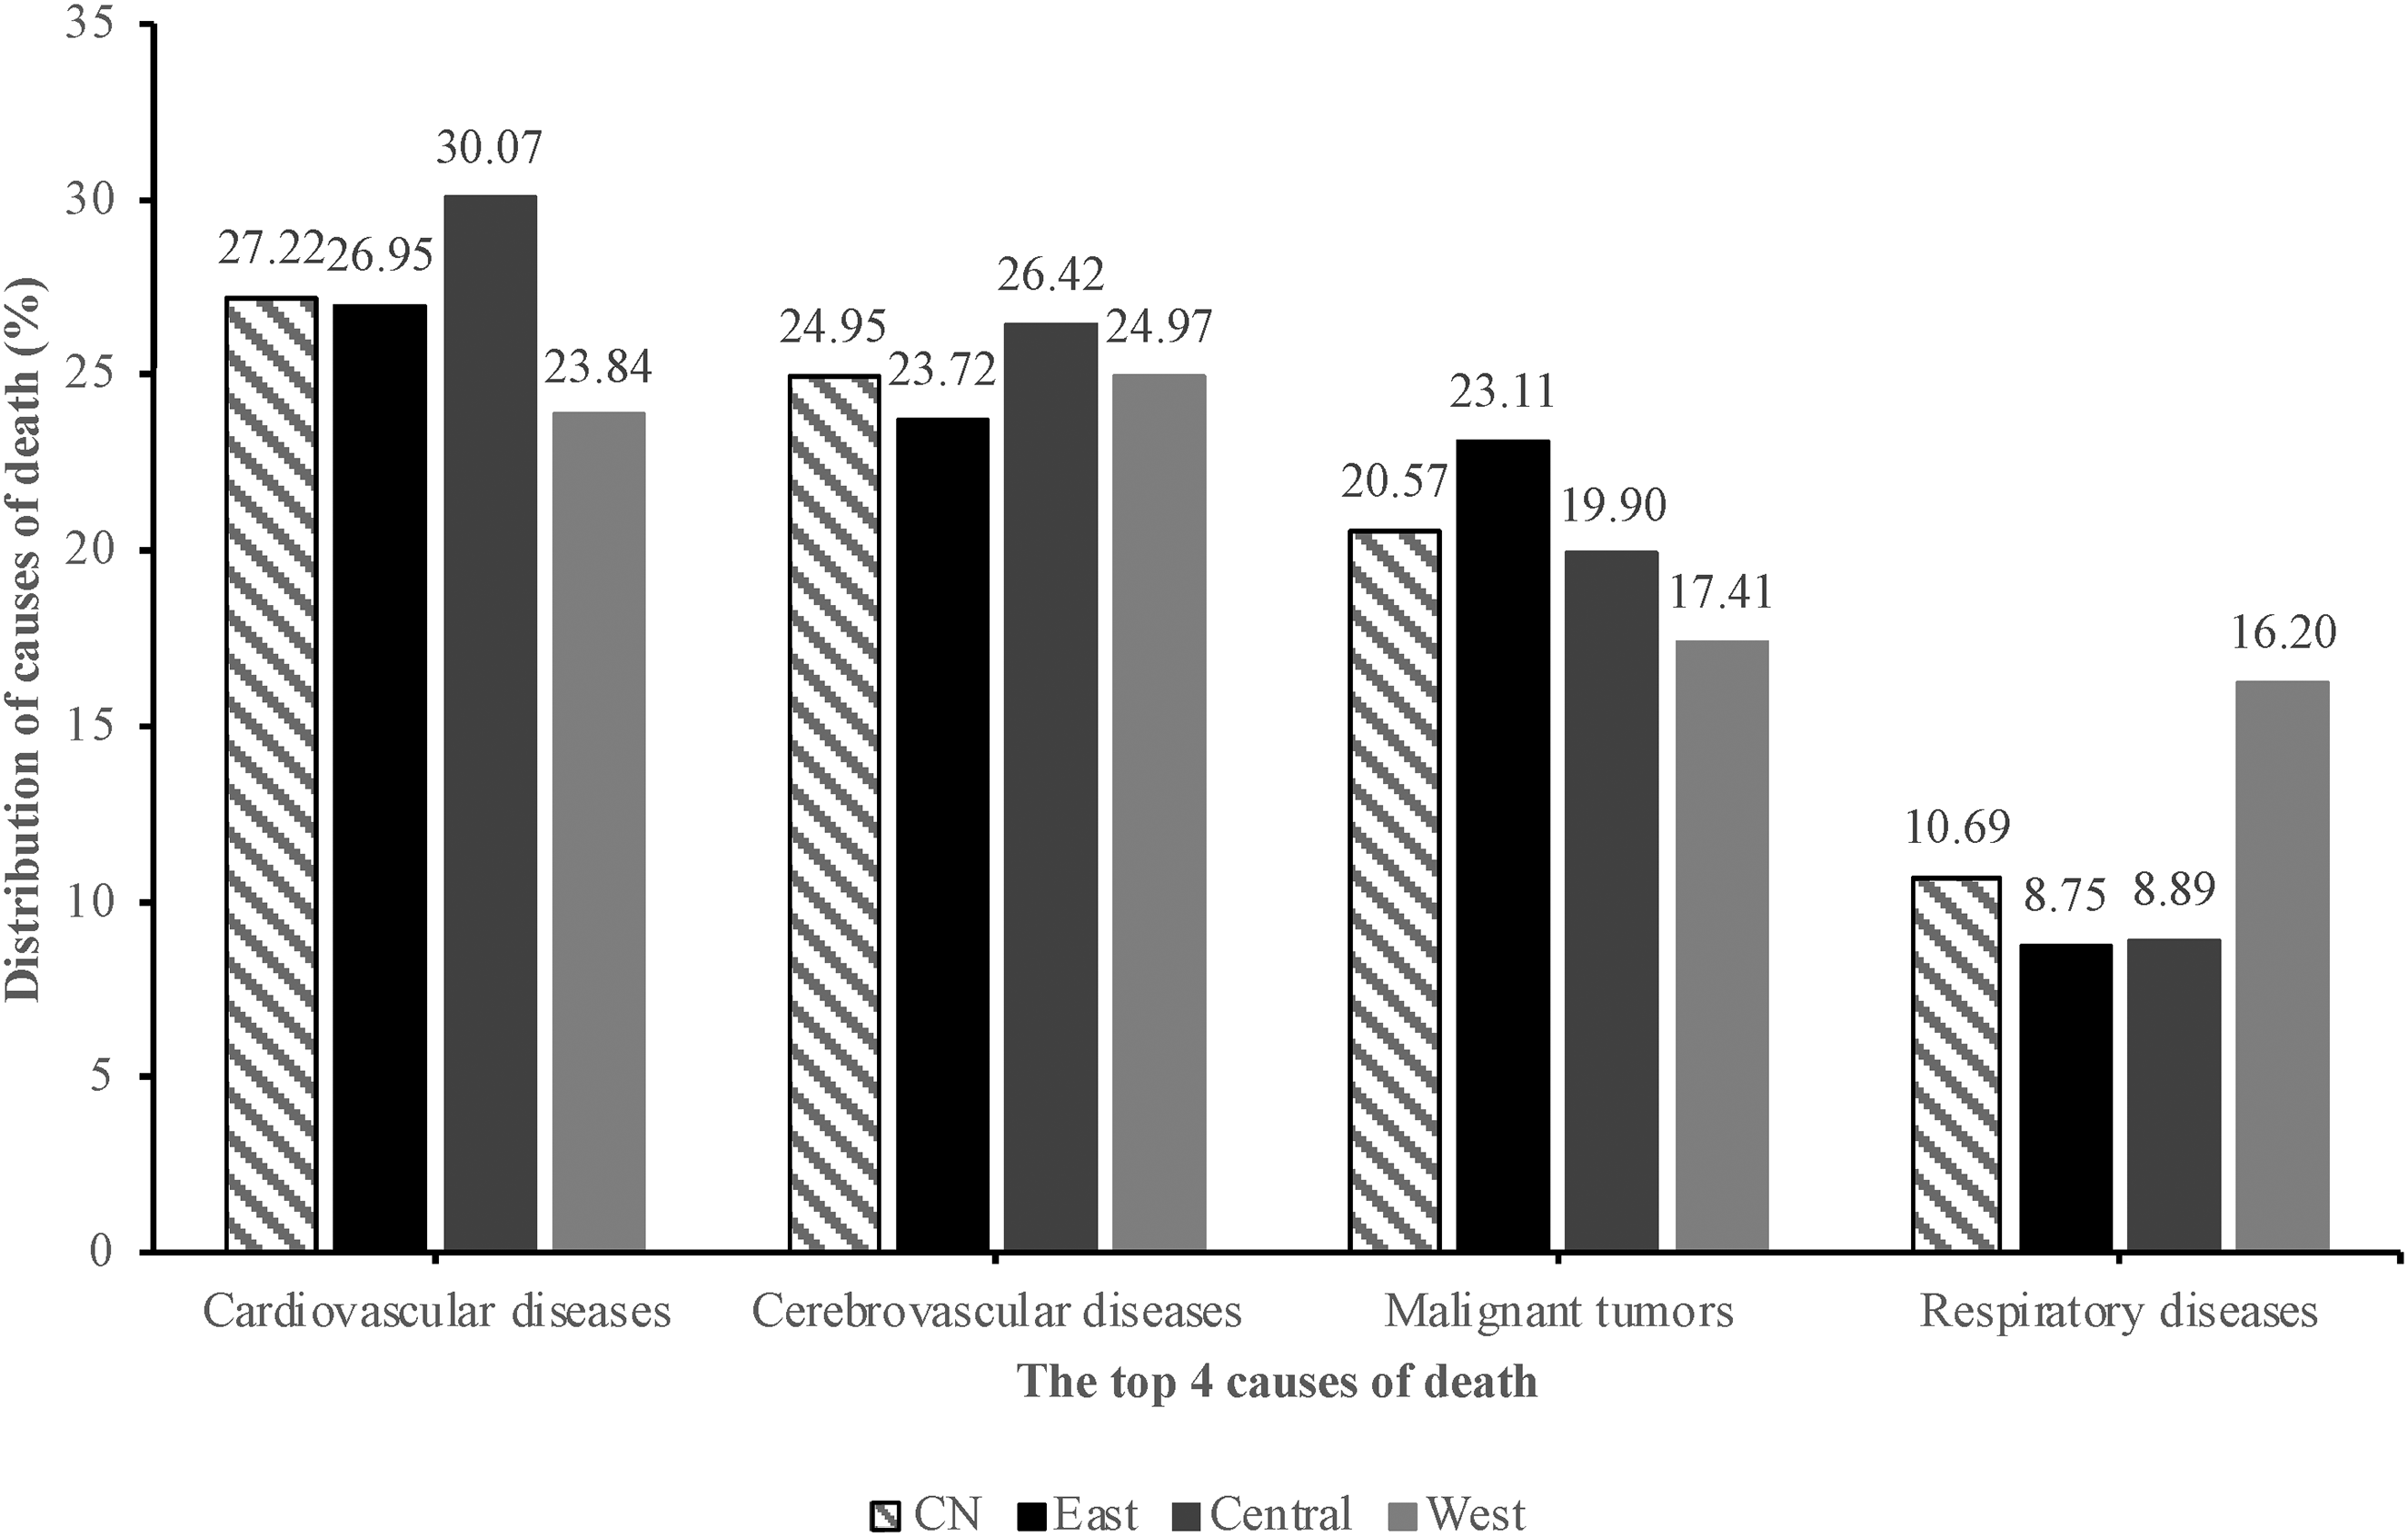
Composition of the top four causes of death of the older population aged 65 and over by region in China, 2020 (%).
On the one hand, in terms of the mortality level, the probability of death between the ages of 60 and 79 is much lower in the eastern region than in the western region, decreasing from 63.38% and 66.65% in 1981 to 45.32% and 54.28% in 2020 for males, respectively. Regarding the mortality level of the early-old-age population, Gansu in the western region lags behind Shanghai in the eastern region by about 20 years in absolute value, and the gap continues to widen due to the difference in the rate of decline (Lu et al., 2019). On the other hand, when it comes to causes of death, the available data on the top four causes of death for those aged 65 years and older show that the western region has a significantly higher proportion of respiratory diseases in the distribution of causes of death. Given that respiratory diseases, as published by the China CDC based on the International Classification of Diseases, Tenth Revision (ICD-10), include infectious diseases J00–J22, these data suggest that the older population in the western region still faces significant infectious diseases. In contrast, the eastern region exhibits a significantly higher composition of deaths due to malignant tumours and a relatively lower composition of deaths due to cardiovascular diseases at a lower mortality level. The regional cause-of-death data suggest that the older population in the eastern region has progressively transitioned to a more advanced stage of the health transition. This is very much in line with recent research indicating that, with technological advances, malignant tumours have replaced cardiovascular disease as the leading cause of death among middle-aged and older people in middle- and high-income regions, unlike low-income regions that are still plagued by cardiovascular disease (Caselli, 2015; Dagenais et al., 2020). Interestingly, the distribution of causes of death in the central region remains high for cardiovascular and cerebrovascular diseases, but the share of respiratory diseases has decreased significantly, which indicates that the central region is in a stage of the health transition that is between those of the eastern and western regions.
Thus, in combination with the data already discussed in the previous descriptive sub-section, that the western region has the lowest life expectancy, the highest old-age disparity, and the lowest old-age disparity as a ratio to total life disparity among the regions shows that it is significantly lagging behind the eastern region in the health transition. The discussion in the sub-section on mechanisms of health effects and the components of causes of death reaffirms this assertion and is consistent with existing research indicating that the western region is in a stage of the health transition characterized by a significant improvement in mortality at older ages, yet there are still significant gaps between it and the eastern region (Chen et al., 2018). In this sense, the lagging health improvement of China's older population is strongly related to the uneven development of the health transition in different regions, and the relatively lagging health transition in the western region may partly explain the relatively slow improvement in China's overall old-age mortality.
Conclusion and discussion
Building on previous research, this paper derives two primary conclusions. First, through an examination of life expectancy and life disparity among the older population, this paper notes a consistent upward trend in life expectancy across China and its various regions. Throughout the period spanning 1981 to 2020, despite earlier studies suggesting a delayed growth in life expectancy among China's older population, this paper acknowledges significant efforts by the Chinese government to enhance old-age health, evident in the life expectancy data presented herein. Within the 60–64 age group, life expectancy for males and females has risen from 15.99 to 19.29 years and from 17.85 to 23.07 years, respectively, between 1981 and 2020; and within the 80–84 age group, life expectancy for males and females increased from 5.35 to 6.51 years and from 5.91 to 7.92 years, respectively, during the same period. Nevertheless, the increase in life expectancy has been uneven across regions. Among the older population aged 60–64 years, the gap between the eastern and western regions for males and females has widened from 0.57 years and 1.76 years in 1981 to 1.95 years and 2.28 years in 2020, respectively; and among the older population aged 80–84 years, the gap between the eastern and western regions for males and females has widened from 0.31 years and 0.63 years in 1981 to 0.63 years and 1.06 years in 2020, respectively.
At the same time, the examination of old-age disparity reveals that old-age disparity within China and its regions has been declining year by year and that the ratio of old-age disparity to total disparity has been rising year by year. For China as a whole, old-age disparity for males and females has declined from 4.49 and 4.24 years in 1981 to 3.95 and 3.58 years in 2020, respectively, and the ratio of old-age disparity to total disparity ratios has risen from 30.78% and 30.14% in 1981 to 37.05% and 39.17% in 2020, respectively. Across all years, excluding 1981, the eastern region consistently exhibits the lowest absolute level of old-age disparity across genders. Moreover, the eastern region consistently maintains the highest ratio of old-age disparity to total disparity among all regions, while the western region consistently records the lowest figures among all regions. The descriptive analyses presented above show the persistent inter-regional differences in the levels of old-age mortality and old-age life disparity in China.
Second, the discussion of the effects of medical facility investments and the level of economic development in different regions under the health transition framework finds that the same mechanisms have different intensities of effects in different regions: relative to the western region, medical facility investments and the level of economic development both improve the life expectancy of the elderly and old-age disparity to a greater extent in the eastern region, whereas they improve infant, child, and young-adult disparities to a lesser extent. The differences in the intensity of the effects of the same mechanism in different regions are largely the result of the stage-specific characteristics of China's overall health transition, and the regional data on causes of death reaffirm this judgment, indicating that while the eastern region has already advanced to the stage of improving health in old age, the western region may not yet formally have advanced to this stage, or the central and western regions are still in the transitional stage, which may have delayed the overall improvement in the level of mortality of the older population in China. This paper reveals that although all regions of China have experienced high rates of life expectancy growth among the elderly, this growth has not been balanced or synchronized at the same rate across regions, and due to the vastness of the territory of China, its health transition is a multi-stage process taking place in parallel.
Undoubtedly, certain limitations persist within this paper, particularly evident being that the discussion of the health transition solely relies on mortality and socio-economic data as a peripheral approach to understanding health transition stages and investment in fundamental medical facilities, as represented by the number of beds, may have underestimated the role of private medical care in the health of the older population. Moving forward, a more comprehensive understanding can be achieved by integrating data on more detailed cause-of-death data, bio-health data, and relevant indicators that reflect the specificities of the older population. Recent research on global health disparities reveals that as global life expectancy increases, the root causes of health disparities are shifting from death-related disparities to disparities centred on illness and disability (Permanyer et al., 2023). With the substantial growth of China's aging population, ensuring a long and good quality life for the elderly will emerge as a fresh challenge in maintaining health equity within Chinese society. Consequently, academics should persist in monitoring the emerging health trends among the older population, while the government ought to prioritize accounting for regional disparities to tailor and implement more targeted, region-specific health policies.
Footnotes
Declaration of conflicting interests
The author declared no potential conflicts of interest with respect to the research, authorship, and/or publication of this article.
Funding
The author received no financial support for the research, authorship, and/or publication of this article.
Appendix
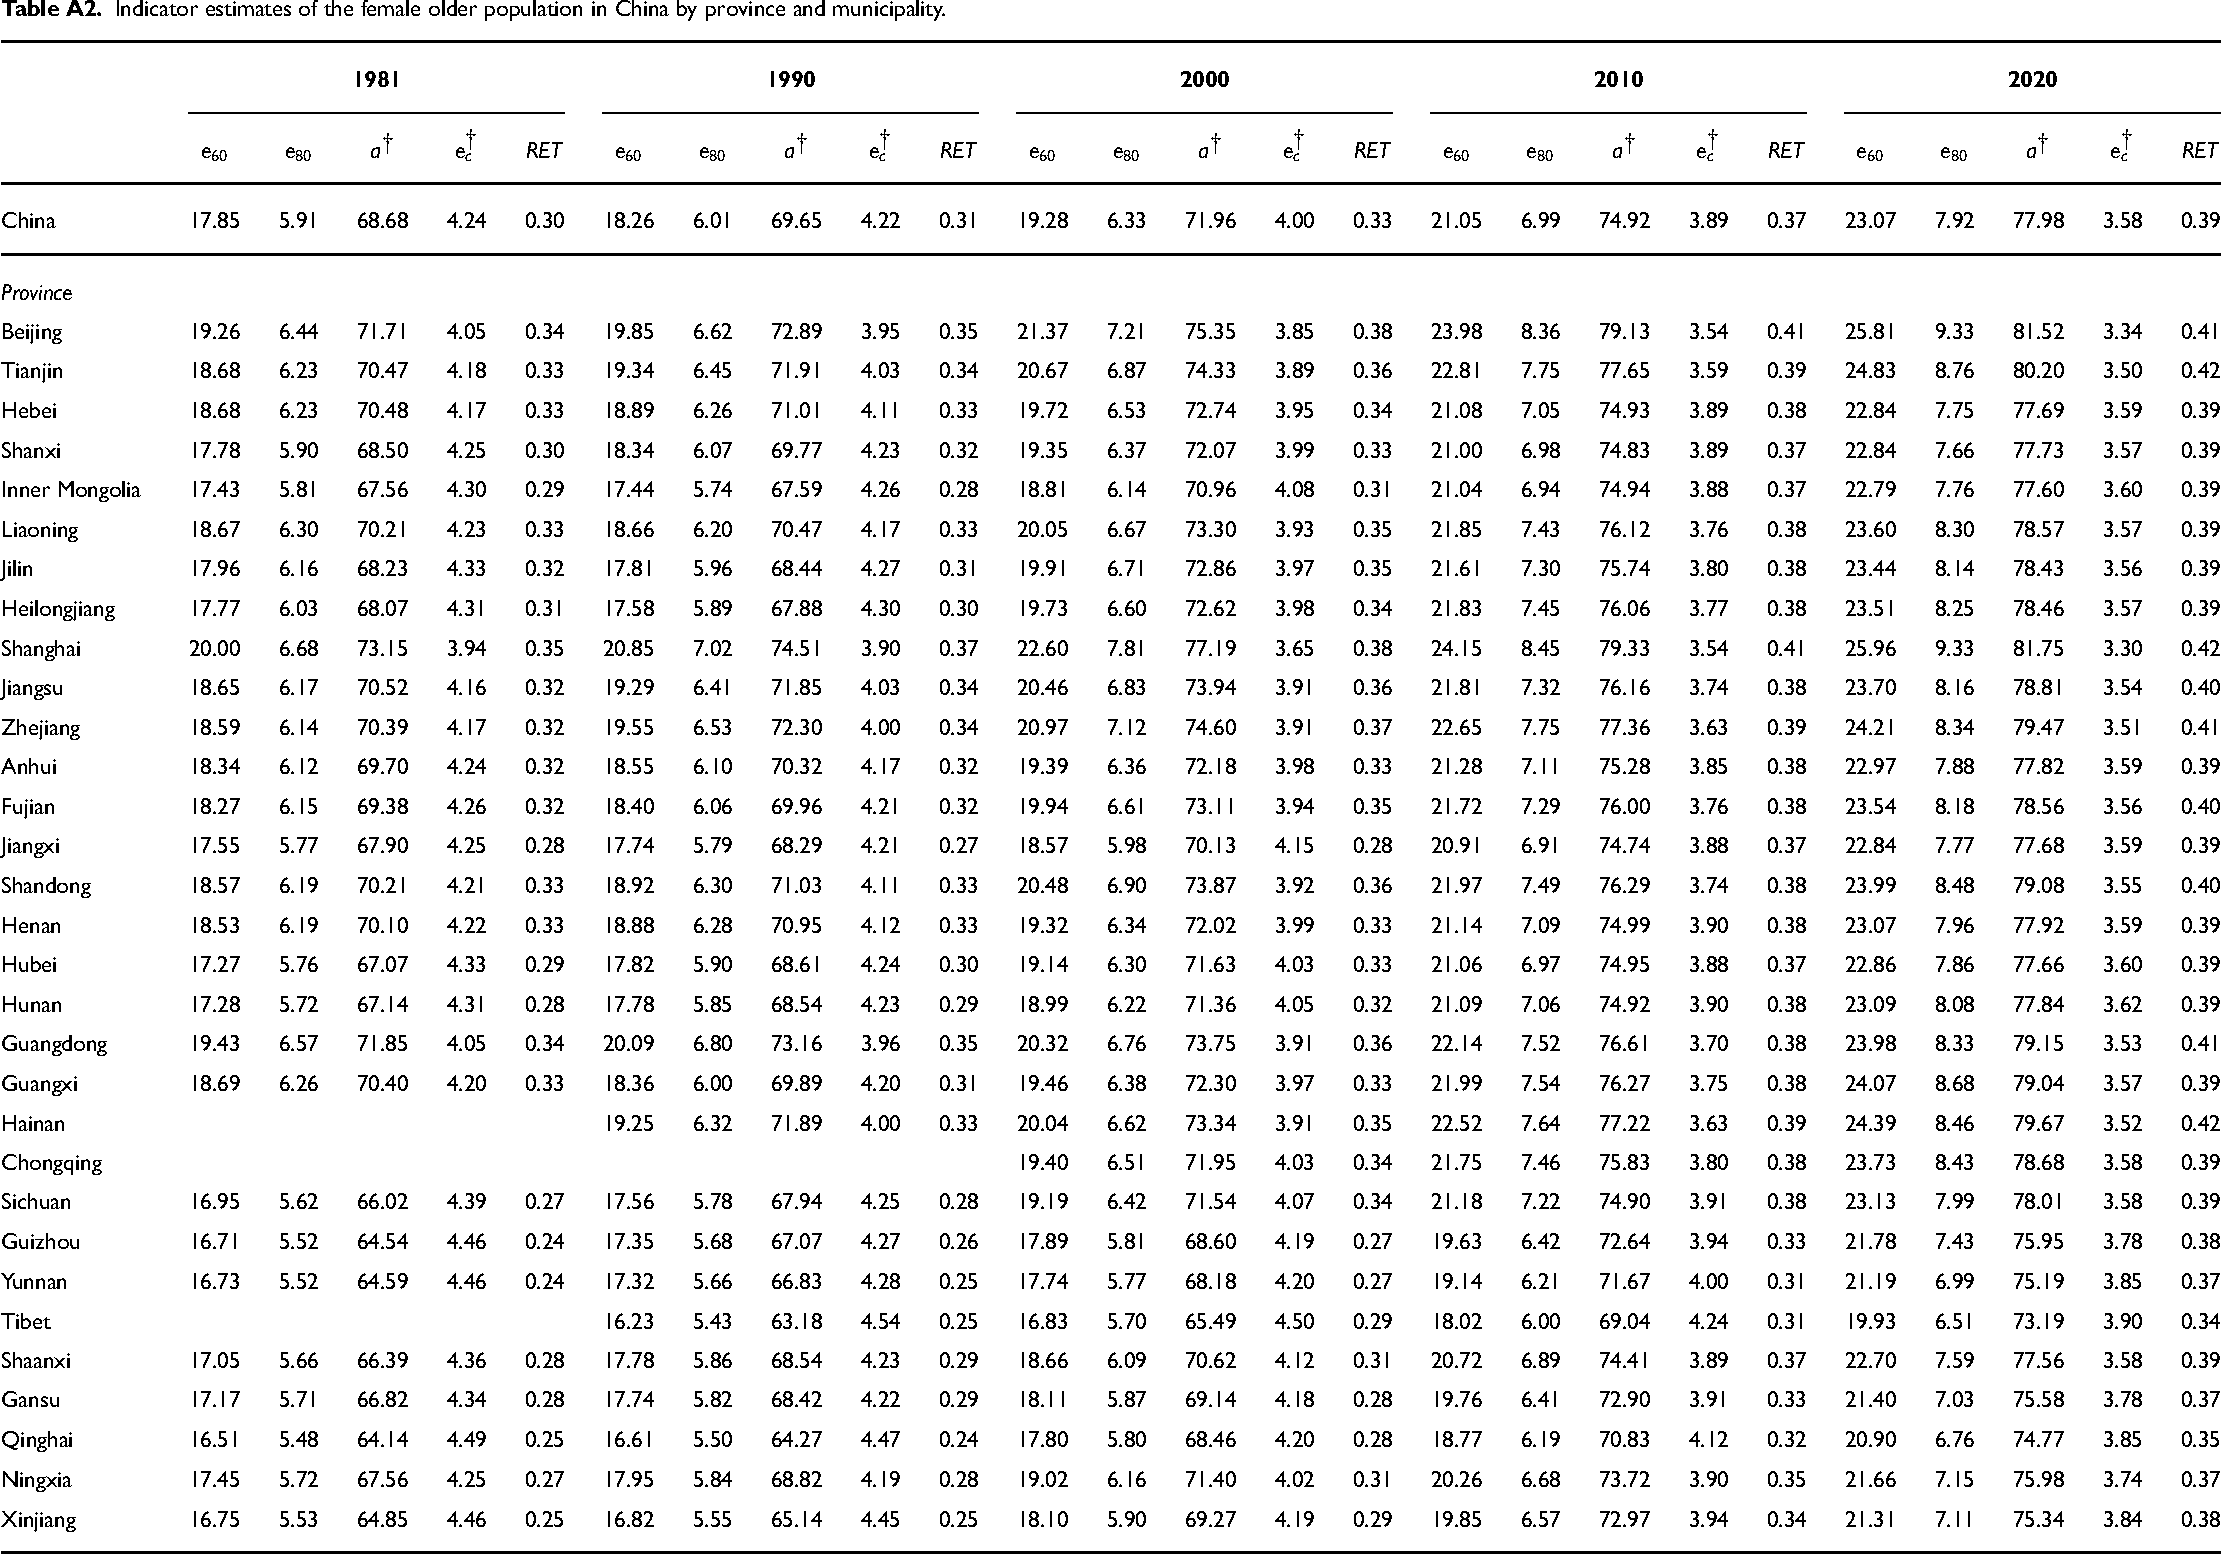
Indicator estimates of the female older population in China by province and municipality.
|
|
|
|
|
|
|||||||||||||||||||||
|---|---|---|---|---|---|---|---|---|---|---|---|---|---|---|---|---|---|---|---|---|---|---|---|---|---|
|
|
|
|
|
|
|
|
|
|
|
|
|
|
|
|
|
|
|
|
|
|
|
|
|
|
|
| China | 17.85 | 5.91 | 68.68 | 4.24 | 0.30 | 18.26 | 6.01 | 69.65 | 4.22 | 0.31 | 19.28 | 6.33 | 71.96 | 4.00 | 0.33 | 21.05 | 6.99 | 74.92 | 3.89 | 0.37 | 23.07 | 7.92 | 77.98 | 3.58 | 0.39 |
| Province | |||||||||||||||||||||||||
| Beijing | 19.26 | 6.44 | 71.71 | 4.05 | 0.34 | 19.85 | 6.62 | 72.89 | 3.95 | 0.35 | 21.37 | 7.21 | 75.35 | 3.85 | 0.38 | 23.98 | 8.36 | 79.13 | 3.54 | 0.41 | 25.81 | 9.33 | 81.52 | 3.34 | 0.41 |
| Tianjin | 18.68 | 6.23 | 70.47 | 4.18 | 0.33 | 19.34 | 6.45 | 71.91 | 4.03 | 0.34 | 20.67 | 6.87 | 74.33 | 3.89 | 0.36 | 22.81 | 7.75 | 77.65 | 3.59 | 0.39 | 24.83 | 8.76 | 80.20 | 3.50 | 0.42 |
| Hebei | 18.68 | 6.23 | 70.48 | 4.17 | 0.33 | 18.89 | 6.26 | 71.01 | 4.11 | 0.33 | 19.72 | 6.53 | 72.74 | 3.95 | 0.34 | 21.08 | 7.05 | 74.93 | 3.89 | 0.38 | 22.84 | 7.75 | 77.69 | 3.59 | 0.39 |
| Shanxi | 17.78 | 5.90 | 68.50 | 4.25 | 0.30 | 18.34 | 6.07 | 69.77 | 4.23 | 0.32 | 19.35 | 6.37 | 72.07 | 3.99 | 0.33 | 21.00 | 6.98 | 74.83 | 3.89 | 0.37 | 22.84 | 7.66 | 77.73 | 3.57 | 0.39 |
| Inner Mongolia | 17.43 | 5.81 | 67.56 | 4.30 | 0.29 | 17.44 | 5.74 | 67.59 | 4.26 | 0.28 | 18.81 | 6.14 | 70.96 | 4.08 | 0.31 | 21.04 | 6.94 | 74.94 | 3.88 | 0.37 | 22.79 | 7.76 | 77.60 | 3.60 | 0.39 |
| Liaoning | 18.67 | 6.30 | 70.21 | 4.23 | 0.33 | 18.66 | 6.20 | 70.47 | 4.17 | 0.33 | 20.05 | 6.67 | 73.30 | 3.93 | 0.35 | 21.85 | 7.43 | 76.12 | 3.76 | 0.38 | 23.60 | 8.30 | 78.57 | 3.57 | 0.39 |
| Jilin | 17.96 | 6.16 | 68.23 | 4.33 | 0.32 | 17.81 | 5.96 | 68.44 | 4.27 | 0.31 | 19.91 | 6.71 | 72.86 | 3.97 | 0.35 | 21.61 | 7.30 | 75.74 | 3.80 | 0.38 | 23.44 | 8.14 | 78.43 | 3.56 | 0.39 |
| Heilongjiang | 17.77 | 6.03 | 68.07 | 4.31 | 0.31 | 17.58 | 5.89 | 67.88 | 4.30 | 0.30 | 19.73 | 6.60 | 72.62 | 3.98 | 0.34 | 21.83 | 7.45 | 76.06 | 3.77 | 0.38 | 23.51 | 8.25 | 78.46 | 3.57 | 0.39 |
| Shanghai | 20.00 | 6.68 | 73.15 | 3.94 | 0.35 | 20.85 | 7.02 | 74.51 | 3.90 | 0.37 | 22.60 | 7.81 | 77.19 | 3.65 | 0.38 | 24.15 | 8.45 | 79.33 | 3.54 | 0.41 | 25.96 | 9.33 | 81.75 | 3.30 | 0.42 |
| Jiangsu | 18.65 | 6.17 | 70.52 | 4.16 | 0.32 | 19.29 | 6.41 | 71.85 | 4.03 | 0.34 | 20.46 | 6.83 | 73.94 | 3.91 | 0.36 | 21.81 | 7.32 | 76.16 | 3.74 | 0.38 | 23.70 | 8.16 | 78.81 | 3.54 | 0.40 |
| Zhejiang | 18.59 | 6.14 | 70.39 | 4.17 | 0.32 | 19.55 | 6.53 | 72.30 | 4.00 | 0.34 | 20.97 | 7.12 | 74.60 | 3.91 | 0.37 | 22.65 | 7.75 | 77.36 | 3.63 | 0.39 | 24.21 | 8.34 | 79.47 | 3.51 | 0.41 |
| Anhui | 18.34 | 6.12 | 69.70 | 4.24 | 0.32 | 18.55 | 6.10 | 70.32 | 4.17 | 0.32 | 19.39 | 6.36 | 72.18 | 3.98 | 0.33 | 21.28 | 7.11 | 75.28 | 3.85 | 0.38 | 22.97 | 7.88 | 77.82 | 3.59 | 0.39 |
| Fujian | 18.27 | 6.15 | 69.38 | 4.26 | 0.32 | 18.40 | 6.06 | 69.96 | 4.21 | 0.32 | 19.94 | 6.61 | 73.11 | 3.94 | 0.35 | 21.72 | 7.29 | 76.00 | 3.76 | 0.38 | 23.54 | 8.18 | 78.56 | 3.56 | 0.40 |
| Jiangxi | 17.55 | 5.77 | 67.90 | 4.25 | 0.28 | 17.74 | 5.79 | 68.29 | 4.21 | 0.27 | 18.57 | 5.98 | 70.13 | 4.15 | 0.28 | 20.91 | 6.91 | 74.74 | 3.88 | 0.37 | 22.84 | 7.77 | 77.68 | 3.59 | 0.39 |
| Shandong | 18.57 | 6.19 | 70.21 | 4.21 | 0.33 | 18.92 | 6.30 | 71.03 | 4.11 | 0.33 | 20.48 | 6.90 | 73.87 | 3.92 | 0.36 | 21.97 | 7.49 | 76.29 | 3.74 | 0.38 | 23.99 | 8.48 | 79.08 | 3.55 | 0.40 |
| Henan | 18.53 | 6.19 | 70.10 | 4.22 | 0.33 | 18.88 | 6.28 | 70.95 | 4.12 | 0.33 | 19.32 | 6.34 | 72.02 | 3.99 | 0.33 | 21.14 | 7.09 | 74.99 | 3.90 | 0.38 | 23.07 | 7.96 | 77.92 | 3.59 | 0.39 |
| Hubei | 17.27 | 5.76 | 67.07 | 4.33 | 0.29 | 17.82 | 5.90 | 68.61 | 4.24 | 0.30 | 19.14 | 6.30 | 71.63 | 4.03 | 0.33 | 21.06 | 6.97 | 74.95 | 3.88 | 0.37 | 22.86 | 7.86 | 77.66 | 3.60 | 0.39 |
| Hunan | 17.28 | 5.72 | 67.14 | 4.31 | 0.28 | 17.78 | 5.85 | 68.54 | 4.23 | 0.29 | 18.99 | 6.22 | 71.36 | 4.05 | 0.32 | 21.09 | 7.06 | 74.92 | 3.90 | 0.38 | 23.09 | 8.08 | 77.84 | 3.62 | 0.39 |
| Guangdong | 19.43 | 6.57 | 71.85 | 4.05 | 0.34 | 20.09 | 6.80 | 73.16 | 3.96 | 0.35 | 20.32 | 6.76 | 73.75 | 3.91 | 0.36 | 22.14 | 7.52 | 76.61 | 3.70 | 0.38 | 23.98 | 8.33 | 79.15 | 3.53 | 0.41 |
| Guangxi | 18.69 | 6.26 | 70.40 | 4.20 | 0.33 | 18.36 | 6.00 | 69.89 | 4.20 | 0.31 | 19.46 | 6.38 | 72.30 | 3.97 | 0.33 | 21.99 | 7.54 | 76.27 | 3.75 | 0.38 | 24.07 | 8.68 | 79.04 | 3.57 | 0.39 |
| Hainan | 19.25 | 6.32 | 71.89 | 4.00 | 0.33 | 20.04 | 6.62 | 73.34 | 3.91 | 0.35 | 22.52 | 7.64 | 77.22 | 3.63 | 0.39 | 24.39 | 8.46 | 79.67 | 3.52 | 0.42 | |||||
| Chongqing | 19.40 | 6.51 | 71.95 | 4.03 | 0.34 | 21.75 | 7.46 | 75.83 | 3.80 | 0.38 | 23.73 | 8.43 | 78.68 | 3.58 | 0.39 | ||||||||||
| Sichuan | 16.95 | 5.62 | 66.02 | 4.39 | 0.27 | 17.56 | 5.78 | 67.94 | 4.25 | 0.28 | 19.19 | 6.42 | 71.54 | 4.07 | 0.34 | 21.18 | 7.22 | 74.90 | 3.91 | 0.38 | 23.13 | 7.99 | 78.01 | 3.58 | 0.39 |
| Guizhou | 16.71 | 5.52 | 64.54 | 4.46 | 0.24 | 17.35 | 5.68 | 67.07 | 4.27 | 0.26 | 17.89 | 5.81 | 68.60 | 4.19 | 0.27 | 19.63 | 6.42 | 72.64 | 3.94 | 0.33 | 21.78 | 7.43 | 75.95 | 3.78 | 0.38 |
| Yunnan | 16.73 | 5.52 | 64.59 | 4.46 | 0.24 | 17.32 | 5.66 | 66.83 | 4.28 | 0.25 | 17.74 | 5.77 | 68.18 | 4.20 | 0.27 | 19.14 | 6.21 | 71.67 | 4.00 | 0.31 | 21.19 | 6.99 | 75.19 | 3.85 | 0.37 |
| Tibet | 16.23 | 5.43 | 63.18 | 4.54 | 0.25 | 16.83 | 5.70 | 65.49 | 4.50 | 0.29 | 18.02 | 6.00 | 69.04 | 4.24 | 0.31 | 19.93 | 6.51 | 73.19 | 3.90 | 0.34 | |||||
| Shaanxi | 17.05 | 5.66 | 66.39 | 4.36 | 0.28 | 17.78 | 5.86 | 68.54 | 4.23 | 0.29 | 18.66 | 6.09 | 70.62 | 4.12 | 0.31 | 20.72 | 6.89 | 74.41 | 3.89 | 0.37 | 22.70 | 7.59 | 77.56 | 3.58 | 0.39 |
| Gansu | 17.17 | 5.71 | 66.82 | 4.34 | 0.28 | 17.74 | 5.82 | 68.42 | 4.22 | 0.29 | 18.11 | 5.87 | 69.14 | 4.18 | 0.28 | 19.76 | 6.41 | 72.90 | 3.91 | 0.33 | 21.40 | 7.03 | 75.58 | 3.78 | 0.37 |
| Qinghai | 16.51 | 5.48 | 64.14 | 4.49 | 0.25 | 16.61 | 5.50 | 64.27 | 4.47 | 0.24 | 17.80 | 5.80 | 68.46 | 4.20 | 0.28 | 18.77 | 6.19 | 70.83 | 4.12 | 0.32 | 20.90 | 6.76 | 74.77 | 3.85 | 0.35 |
| Ningxia | 17.45 | 5.72 | 67.56 | 4.25 | 0.27 | 17.95 | 5.84 | 68.82 | 4.19 | 0.28 | 19.02 | 6.16 | 71.40 | 4.02 | 0.31 | 20.26 | 6.68 | 73.72 | 3.90 | 0.35 | 21.66 | 7.15 | 75.98 | 3.74 | 0.37 |
| Xinjiang | 16.75 | 5.53 | 64.85 | 4.46 | 0.25 | 16.82 | 5.55 | 65.14 | 4.45 | 0.25 | 18.10 | 5.90 | 69.27 | 4.19 | 0.29 | 19.85 | 6.57 | 72.97 | 3.94 | 0.34 | 21.31 | 7.11 | 75.34 | 3.84 | 0.38 |