
Abstract
This study analyzes the healthy life expectancy (HLE) of older adults in China since the 1990s, utilizing data from China's sixth (2010) and seventh (2020) National Population Censuses and the Chinese Longitudinal Healthy Longevity Survey (CLHLS), conducted from 1998 to 2018. By applying the Sullivan method for estimating HLE, the study examines trends in HLE and assesses the impacts of mortality and morbidity rates on HLE through counterfactual analysis. It differentiates measurements of health status: the census uses self-reported ability of living independently, while CLHLS uses the activities of daily living (ADL) scale. The results from both data sources indicate an increase in HLE as a proportion of overall life expectancy for the elderly in China since the 1990s, which suggests a “compression of morbidity”. The CLHLS findings align with those based on the census data. Monitoring HLE is crucial for tracking the health status of the elderly in China and can offer valuable insights for policymakers and healthcare providers in enacting strategies that enhance the health and overall well-being of the senior population.
Introduction
With the rapid decline in both mortality and fertility rates, population aging in China is occurring at a swift pace. Between 1953 and 2020, the percentage of the population aged 60 and above in China increased from 7.32% to 18.70%, with the proportion of those aged 65 and above reaching 13.50% in 2020. Projections indicate that by 2050 nearly 400 million people will be aged 65 or older, representing approximately 30% of the total population. Furthermore, at that time, the number of individuals aged 80 and above is expected to surpass 100 million, comprising over 30% of the population within the 65-and-over age bracket (Du and Li, 2021; United Nations, Department of Economic and Social Affairs, Population Division, 2022).
“Healthy aging” has become a strategic vision for proactively addressing the challenges of population aging. The World Health Report 1997 underscored the importance of quality of life, stating that “Increased longevity without quality of life is an empty prize. Health expectancy is more important than life expectancy” (World Health Organization, 1997). Life expectancy may indicate the length of life but does not sufficiently reflect health status or assess quality of life, as individuals may be living longer with illness and disability (Gruenberg, 1977; Kramer, 1980).
Healthy life expectancy (HLE) merges mortality and health status data, providing a measurement that captures both life quantity and quality. Estimating HLE for the elderly helps to reveal the complexity of health status as life expectancy increases. Defining and measuring HLE involves two critical aspects: mortality and health status. While estimating mortality is relatively straightforward, gauging health status is intricate and multifaceted. HLE serves as an umbrella term reflecting varied definitions and dimensions of health. Researchers have developed different HLE indicators corresponding to unique health measurements. For instance, when activities of daily living are used to measure health, HLE is often referred to as disability-free life expectancy.
The methodology for calculating HLE has evolved since Sullivan (1971) introduced a life-table-based approach in 1971. Subsequent research has given rise to three core hypotheses about health status trends:
(1) “Expansion of morbidity”: Gruenberg (1977) suggested that while medical advancements have lowered mortality from certain diseases, these conditions remain uncured, leading to increased survival but also a greater period of living with disease and disability as life expectancy lengthens.
(2) “Compression of morbidity”: This theory contends that the period of disability shortens as life expectancy increases. Premised on the belief in a fixed lifespan and the possibility of delaying chronic diseases through healthier lifestyles, this hypothesis envisions a “rectangular” survival curve (Fries, 1980).
(3) “Dynamic equilibrium”: According to this view, life expectancy may rise indefinitely, but the severity of diseases may decrease due to constant incidence rates and increased longevity, leading to improved quality of life. Manton (1982) argued for a non-fixed lifespan and the importance of slowing disease progression for reducing morbidity.
While there are empirical studies supporting each of these hypotheses (e.g. Crimmins et al., 2016; Martinez et al., 2021; Zhang et al., 2022), consensus remains elusive. This may result from varied study designs, including differences in data types, health dimension measurements, and population diversity across countries, regions, birth cohorts, and socioeconomic statuses.
With the availability of longitudinal data, numerous studies have investigated the long-term patterns of health status and disability. For example, Cai and Lubitz (2007) observed a trend in HLE among older Americans during 1992–2003 that matched both the “compression of morbidity” concept—where the time period of illness is reduced—and “dynamic equilibrium”, where the severity of diseases remains unchanged but their onset is delayed. Meanwhile, in Japan, Yong and Saito (2009) reported that self-rated HLE increased due to morbidities compressing between 1986 and 1995 and then expanding from 1995 to 2004. The pattern in Denmark, detailed by Jeune and Brønnum-Hansen (2008), showed the proportion of the expected lifetime without longstanding illness fluctuated over different periods for men and women aged 65. These diverse findings indicate that the health status of the elderly does not follow a consistent trend and may vary between three distinct morbidity patterns.
Chinese research into the HLE of the elderly, which started in the 1990s, shows no consensus on the pattern of change. Some studies endorse the “compression of morbidity” hypothesis while others suggest an “expansion of morbidity” (e.g. Du and Li, 2006; Li and Guo, 2023; Liu et al., 2009; Yang et al., 2012). Early research was constrained by data from just two points in time, potentially obscuring the true complexity of health status changes.
As longitudinal data in China have become more accessible, more nuanced patterns have emerged. Li et al. (2020) noted a shift from morbidity compression to expansion in Shanghai from 1998 to 2013. Other studies have suggested transitions from compression to dynamic equilibrium during 2002–2014 (Song and Yang, 2020), while Zhang et al. (2022) document a change from morbidity expansion to compression from 1994 to 2015. These findings highlight that interventions aimed at reducing mortality and improving health may not occur simultaneously, leading to independent paces of change in mortality and morbidity.
Recent national and international research highlights that examining various countries, age subgroups, and data sources uncovers inconsistent patterns of health changes. It is plausible that changes in the health status of the elderly evolve over time. This variability may stem from the fact that interventions aimed at reducing mortality and those designed to enhance health do not necessarily coincide; mortality and morbidity may thus change at different rates. This leads to populations across societies and time periods experiencing different stages of mortality and morbidity transitions.
The driving mechanism here is that if HLE increases due to a decline in mortality rather than health improvements, it may result in an expansion of morbidity. Conversely, if HLE increases because of health enhancements, it may lead to the compression of morbidity or a state of dynamic equilibrium. Consequently, different regional populations may find themselves at varying stages of the morbidity transition, leading researchers to diverse and sometimes contradictory conclusions.
Variations in HLE among the elderly illustrate the multifaceted and intricate nature of age-related health changes. Many studies in China regarding HLE rely on survey data, which are commonly critiqued for their limited representativeness and modest scale, factors that may compromise the studies’ credibility. This paper seeks to explore the long-term trends in HLE among China's older population by employing data from the sixth and seventh National Population Censuses, which took place in 2010 and 2020, and the Chinese Longitudinal Healthy Longevity Study (CLHLS), spanning from 1998 to 2018. This dual-dataset strategy integrates the broad coverage of the National Population Censuses and the detailed longitudinal data from CLHLS. The strength of using these two datasets lies not only in their complementary scales but also in the methodological richness they bring. While the censuses offer a wide-angle view of the entire elderly population at two critical points, CLHLS provides a closer, ongoing look at the health trajectories of older individuals over two decades. This deep dive into longitudinal data reveals patterns of change, resilience, and decline that a snapshot approach might miss. The multidimensional health assessments used by census and CLHLS bring to light different aspects of seniors’ health, challenging and broadening our understanding of what constitutes healthy aging.
Combining these diverse datasets, this study makes a significant scholarly contribution by examining long-term health trends in ways that isolated data sources cannot. By weaving together the extensive reach of national data with the granular detail of longitudinal research, this approach seeks to reveal the nuanced shifts in HLE. It surpasses previous research by potentially identifying emerging patterns and offering a more dynamic and sophisticated picture of the relationship between longevity and health among China's aged since the 1990s.
Methods
Data and measurements
The measurement of HLE incorporates both health data and mortality statistics. This paper utilizes mortality data from the United Nations World Population Prospects 2022 (WPP2022) and gathers health information from the National Population Census of China and CLHLS.
The National Population Censuses conducted in 2010 and 2020 assessed the health status of older individuals with the question “What is your health status?” The response options were “healthy”, “usually healthy”, “unhealthy but able to live independently”, and “partly disabled or worse”. For analytical purposes, the first three responses are grouped as “able bodied”, allowing the categorization of elderly individuals’ health statuses into two groups: “able bodied” and “disabled”.
CLHLS conducted its baseline survey in 1998 and has since performed seven follow-up surveys, in 2000, 2002, 2005, 2008, 2011, 2014, and 2018. The baseline survey covered 22 provinces, municipalities, and autonomous regions in China, which represent approximately 85% of the nation's total population. In 2008, Hainan province was also included. CLHLS has been recognized for its large sample size and high level of representativeness among the elderly population in China (Zeng, 2013).
CLHLS employs a multistage unequal proportional targeted random sampling method. Initially, half of the counties in 23 provinces were randomly chosen. The survey aimed to include all centenarians available for face-to-face interviews. In these locations, for every centenarian surveyed, one individual aged 80–89, one individual aged 90–99, and proportionally 1.5 individuals aged 65–79 were also interviewed, ensuring that the sample's size and gender composition closely mirrored the centenarian group. This approach helps to address the underrepresentation of the oldest males that often occurs with equal proportional sampling methods, thus reducing bias (Liu and Yuan, 2007).
Since 2002, the age range for the CLHLS respondents expanded to include those aged 65 and older, whereas previously it was limited to those aged 80 and above. The 2002 and 2005 surveys also included a questionnaire for adult children (aged 35–65) of the sampled elders residing in eight of the surveyed areas. To maintain consistency in the data, new participants were added in each survey round to replace those who had passed away, with the exception of the 2011 and 2014 rounds in regions beyond the eight longevity areas. Consequently, the data from each survey round can serve as a cross-sectional analytical sample. This present study focuses specifically on the HLE of persons aged 65 and older.
The CLHLS questionnaires collect comprehensive information, encompassing personal characteristics, family structure, socioeconomic status, health conditions, and lifestyle factors of the elderly population. In this study, the health status of the elderly is measured using the activities of daily living (ADL) scale. The ADL assessment includes six basic daily activities: bathing, dressing, using the toilet, indoor transfer (e.g. getting into and out of a bed or chair), continence, and eating. Each activity is scored based on the level of assistance required, with responses falling into one of three categories: “no assistance”, scored as 1; “requires some help”, scored as 2; and “requires partial or full help”, scored as 3. The scores from the six activities are summed, yielding a total score that ranges from 6 to 18 points, where a lower score indicates greater independence in self-care. Specifically, a score of 6 signifies full independence, a score between 7 and 17 indicates the need for varying degrees of assistance, and a score of 18 signifies a complete loss of ADL capabilities. For the purposes of this paper, the health condition of the elderly population is divided into two categorical distinctions: “self-care capable” and “partially or completely incapable of self-care”. The “self-care capable” group includes those seniors who exhibit full independence, quantified by a score of 6. On the other hand, the “partially or completely incapable of self-care” category is designated for older individuals who require considerable assistance or are wholly dependent on others, as indicated by a score ranging from 7 to 18.
Methods
First, the Sullivan method is used to estimate HLE (Sullivan, 1971). This method relies on life-table data, calculating life expectancy in various health states by incorporating both the proportion of people in different health states and the number of years that they live. To estimate the health rate by age and gender at different time periods, census and CLHLS health data for the elderly are utilized.
Furthermore, counterfactual analysis is employed to disentangle the effects of mortality and health rate changes on HLE over time. By assuming that the health status of the elderly remains constant over a specific period, we can estimate what the HLE would be, based on a stable health rate coupled with changing mortality rates. This hypothetical HLE is then compared to the actual observed figures to identify the impact of mortality changes on HLE. The effect of changes in health rate on HLE can be determined by subtracting the impact of mortality from the overall change in HLE over the period considered.
HLE of the elderly in China
Health rate in the National Population Census and CLHLS
Figure 1 illustrates the health rates estimated from the census and CLHLS data. According to the census data, between 2010 and 2020, the health rate for males aged 65–99 showed an increase, whereas it decreased for those in the 60–64 age group and for those aged 100 and over. For females, there was an increase in health rates across all age groups, with the exception of the 100-and-over age group, which exhibited a decline.
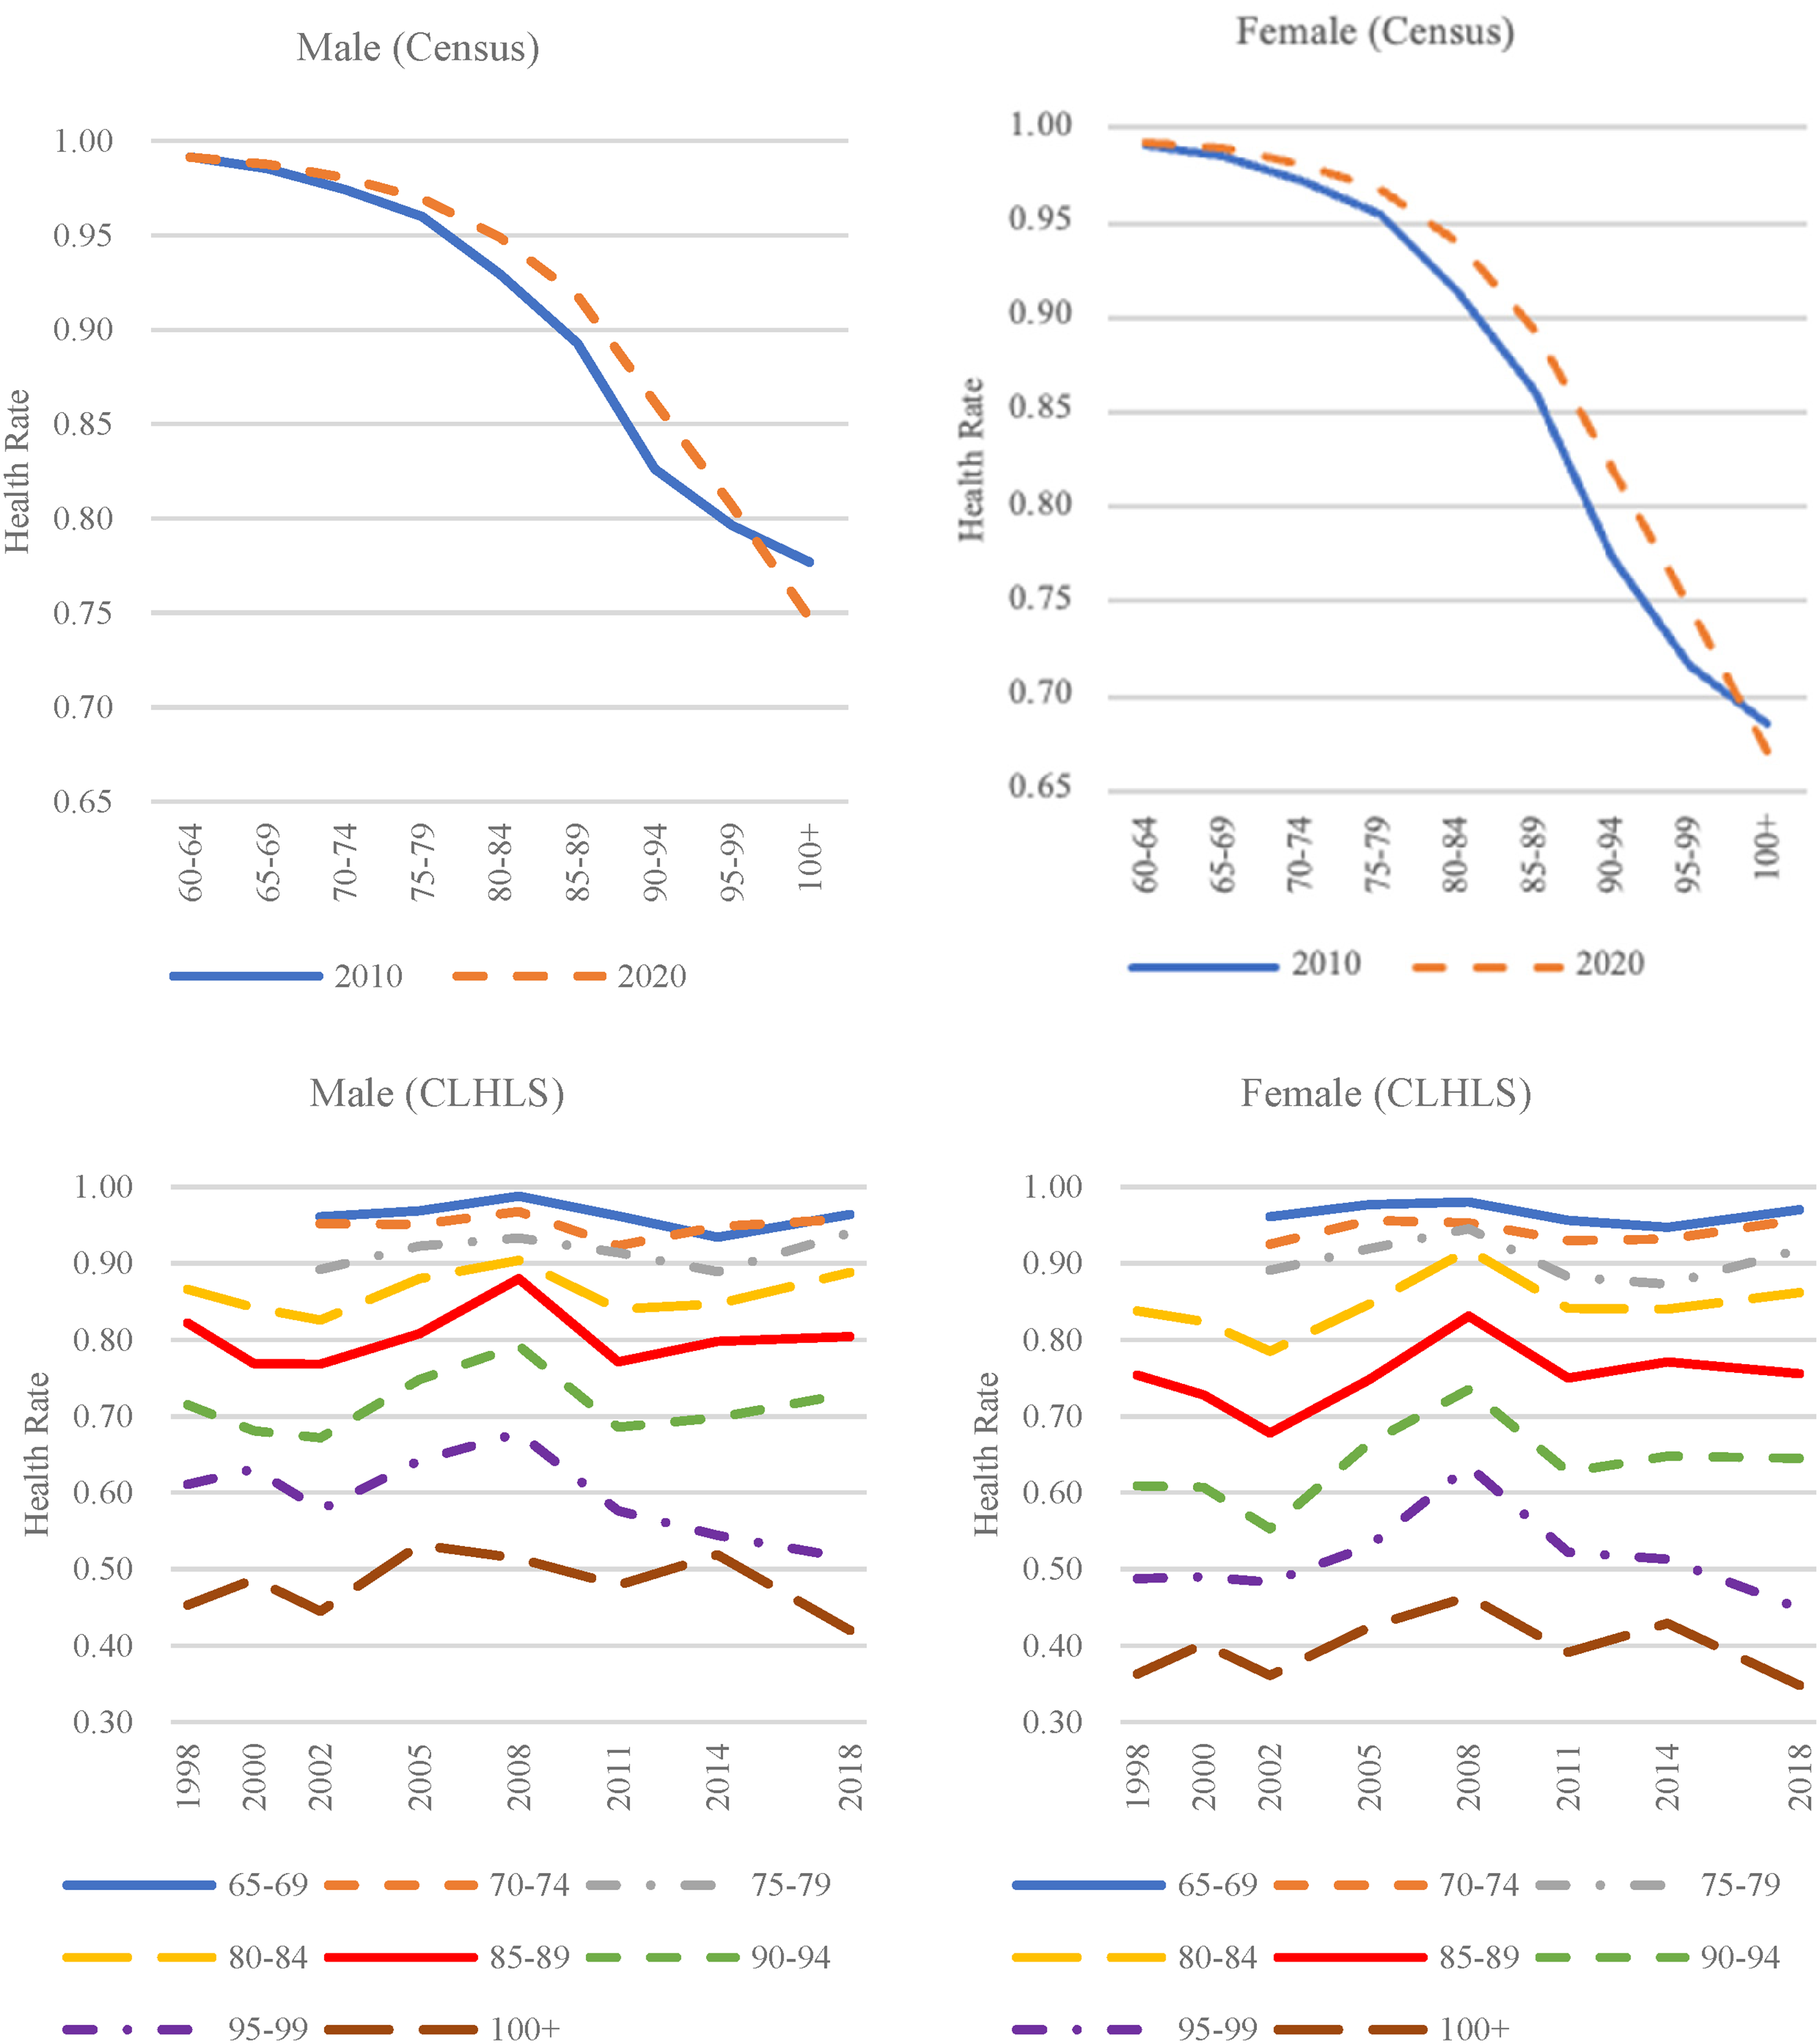
Estimated health rates of the elderly based on data from the National Population Census, 2010, 2020, and CLHLS, 1998–2018.
In contrast, the CLHLS data revealed that from 1998 to 2018 health rates for males aged 85–89 and for both males and females aged 95–99, and 100 and over decreased. For other age groups, both males and females experienced fluctuating trends in health rates. Specifically, there was a decrease from 1998 to 2002, an increase from 2002 to 2008, a subsequent decrease from 2008 to 2014, and finally an increase from 2014 to 2018.
The discrepancies in the health status estimates based on data from the census and CLHLS can be attributed to two main factors. First, there is a difference in the methodologies used to measure health status. The census gauges health status subjectively, asking respondents to self-assess their health with the question “Your health status is ____”. In contrast, CLHLS employs a more objective approach, evaluating the ability to perform the six ADL abilities outlined above. An individual is considered able to “take care of themselves” only if they can perform all of these activities without assistance. Consequently, the census's measurement of health status is more subjective, while CLHLS utilizes specific ADL criteria, potentially yielding a lower health rate due to stricter standards.
Second, the sample sizes and sampling methods differ between the two sources. The census employs a dual-questionnaire approach, using a short form for the entire population and a long form for a 10% sample, in which the sample sizes of health status information for the elderly that were included were 17.7 million in 2010 and 25.5 million in 2020. CLHLS, on the other hand, uses a multistage, disproportionate, stratified random sampling method. This leads to differences in sample representativeness and size between the two data sources.
HLE of the elderly, estimated based on the National Population Census
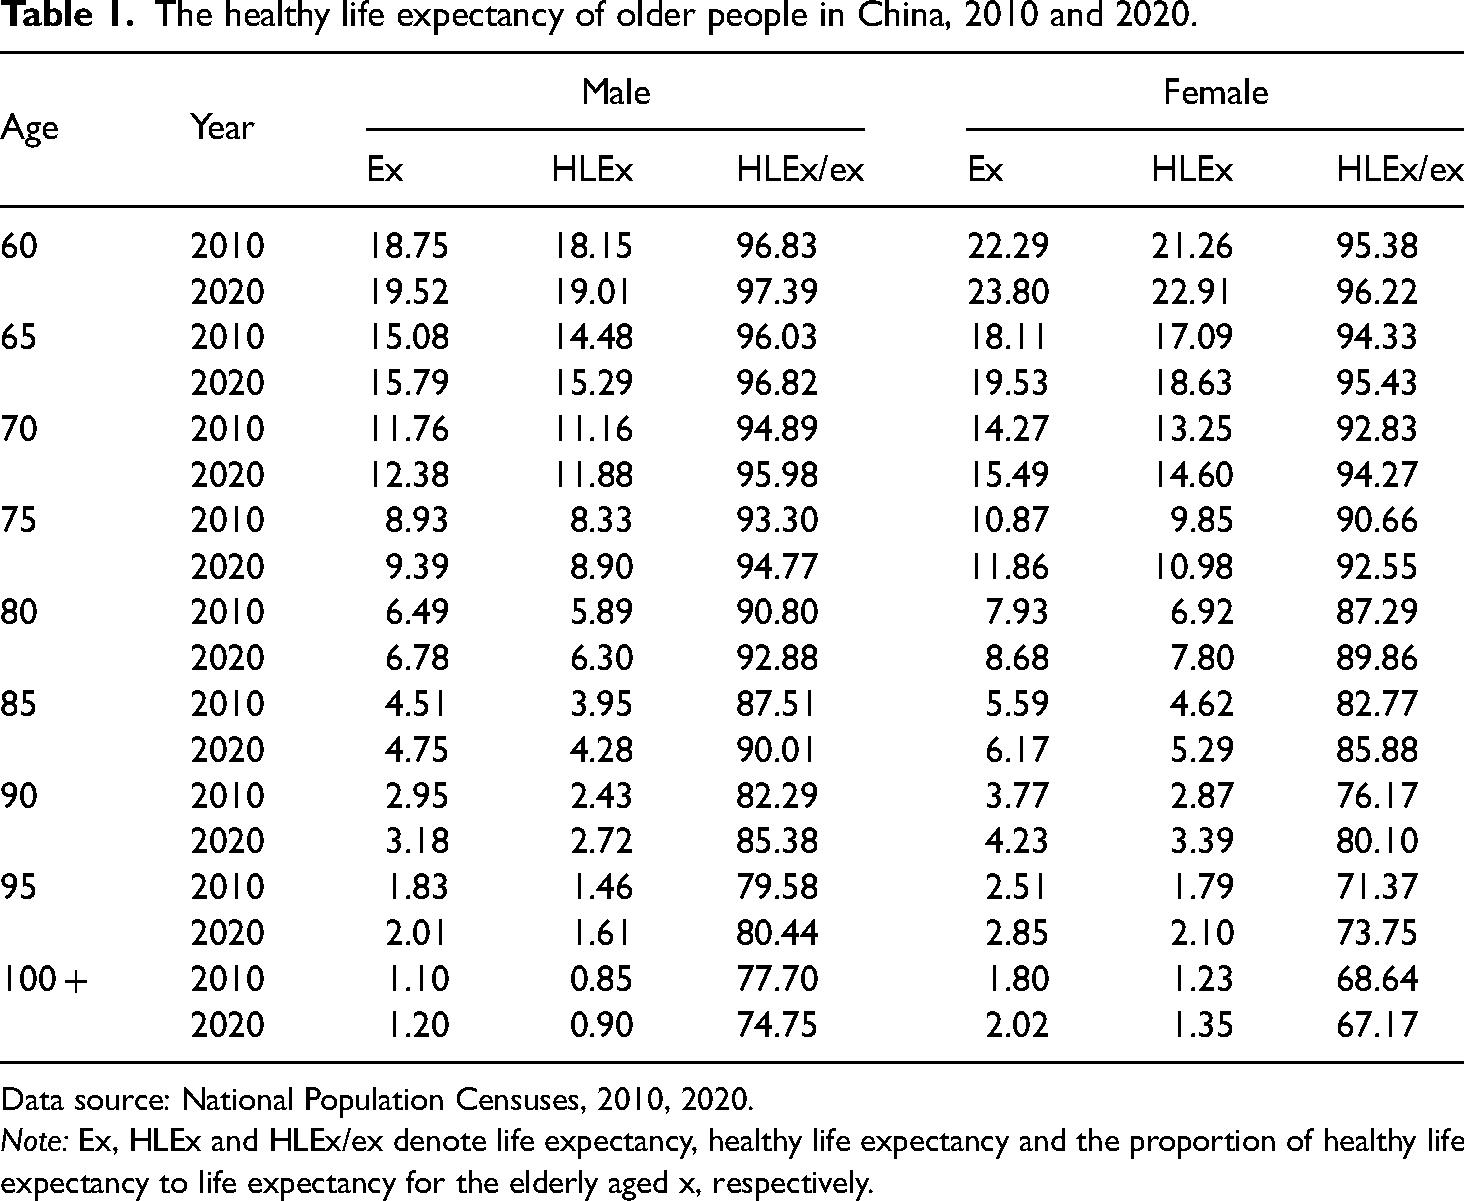
From 2010 to 2020, life expectancy and HLE for older adults in China were on the rise, as shown in Table 1. During this period, the life expectancy for men aged 65 increased by 0.71 years, and their HLE grew by 0.8 years. For women of the same age, life expectancy and HLE expanded by 1.41 and 1.55 years, respectively. Additionally, the life expectancies for 80-year-old men and women increased by 0.29 and 0.75 years, respectively, with corresponding increases in HLE of 0.4 and 0.88 years.
The healthy life expectancy of older people in China, 2010 and 2020.
Data source: National Population Censuses, 2010, 2020.
Note: Ex, HLEx and HLEx/ex denote life expectancy, healthy life expectancy and the proportion of healthy life expectancy to life expectancy for the elderly aged x, respectively.
Between 2010 and 2020, HLE as a proportion of total life expectancy among the elderly in China increased, which supports the “compression of morbidity” hypothesis. For males aged 65, this proportion rose from 96.03% to 96.82%, and for females, it increased from 94.33% to 95.43%. For 80-year-old males and females, the increases were 2.08 and 2.58 percentage points, respectively. However, for those aged 100 and over, the proportion declined during this decade. This could indicate an actual deterioration in health status for this age group or could be due to the smaller size of this age group, which might skew the results.
While life expectancy and HLE were both higher for females than for males, the latter exhibited greater HLE as a proportion of total life expectancy. As age increases, females generally live longer than males and spend less time living without disability. In the 60-year-old age group, HLE as a proportion of total life expectancy was approximately 96% for females and about 98% for males, a difference of only around 2 percentage points. However, this gap had widened to about 8 percentage points in the 100-and-over age group by 2020.
HLE of the elderly, estimated based on CLHLS
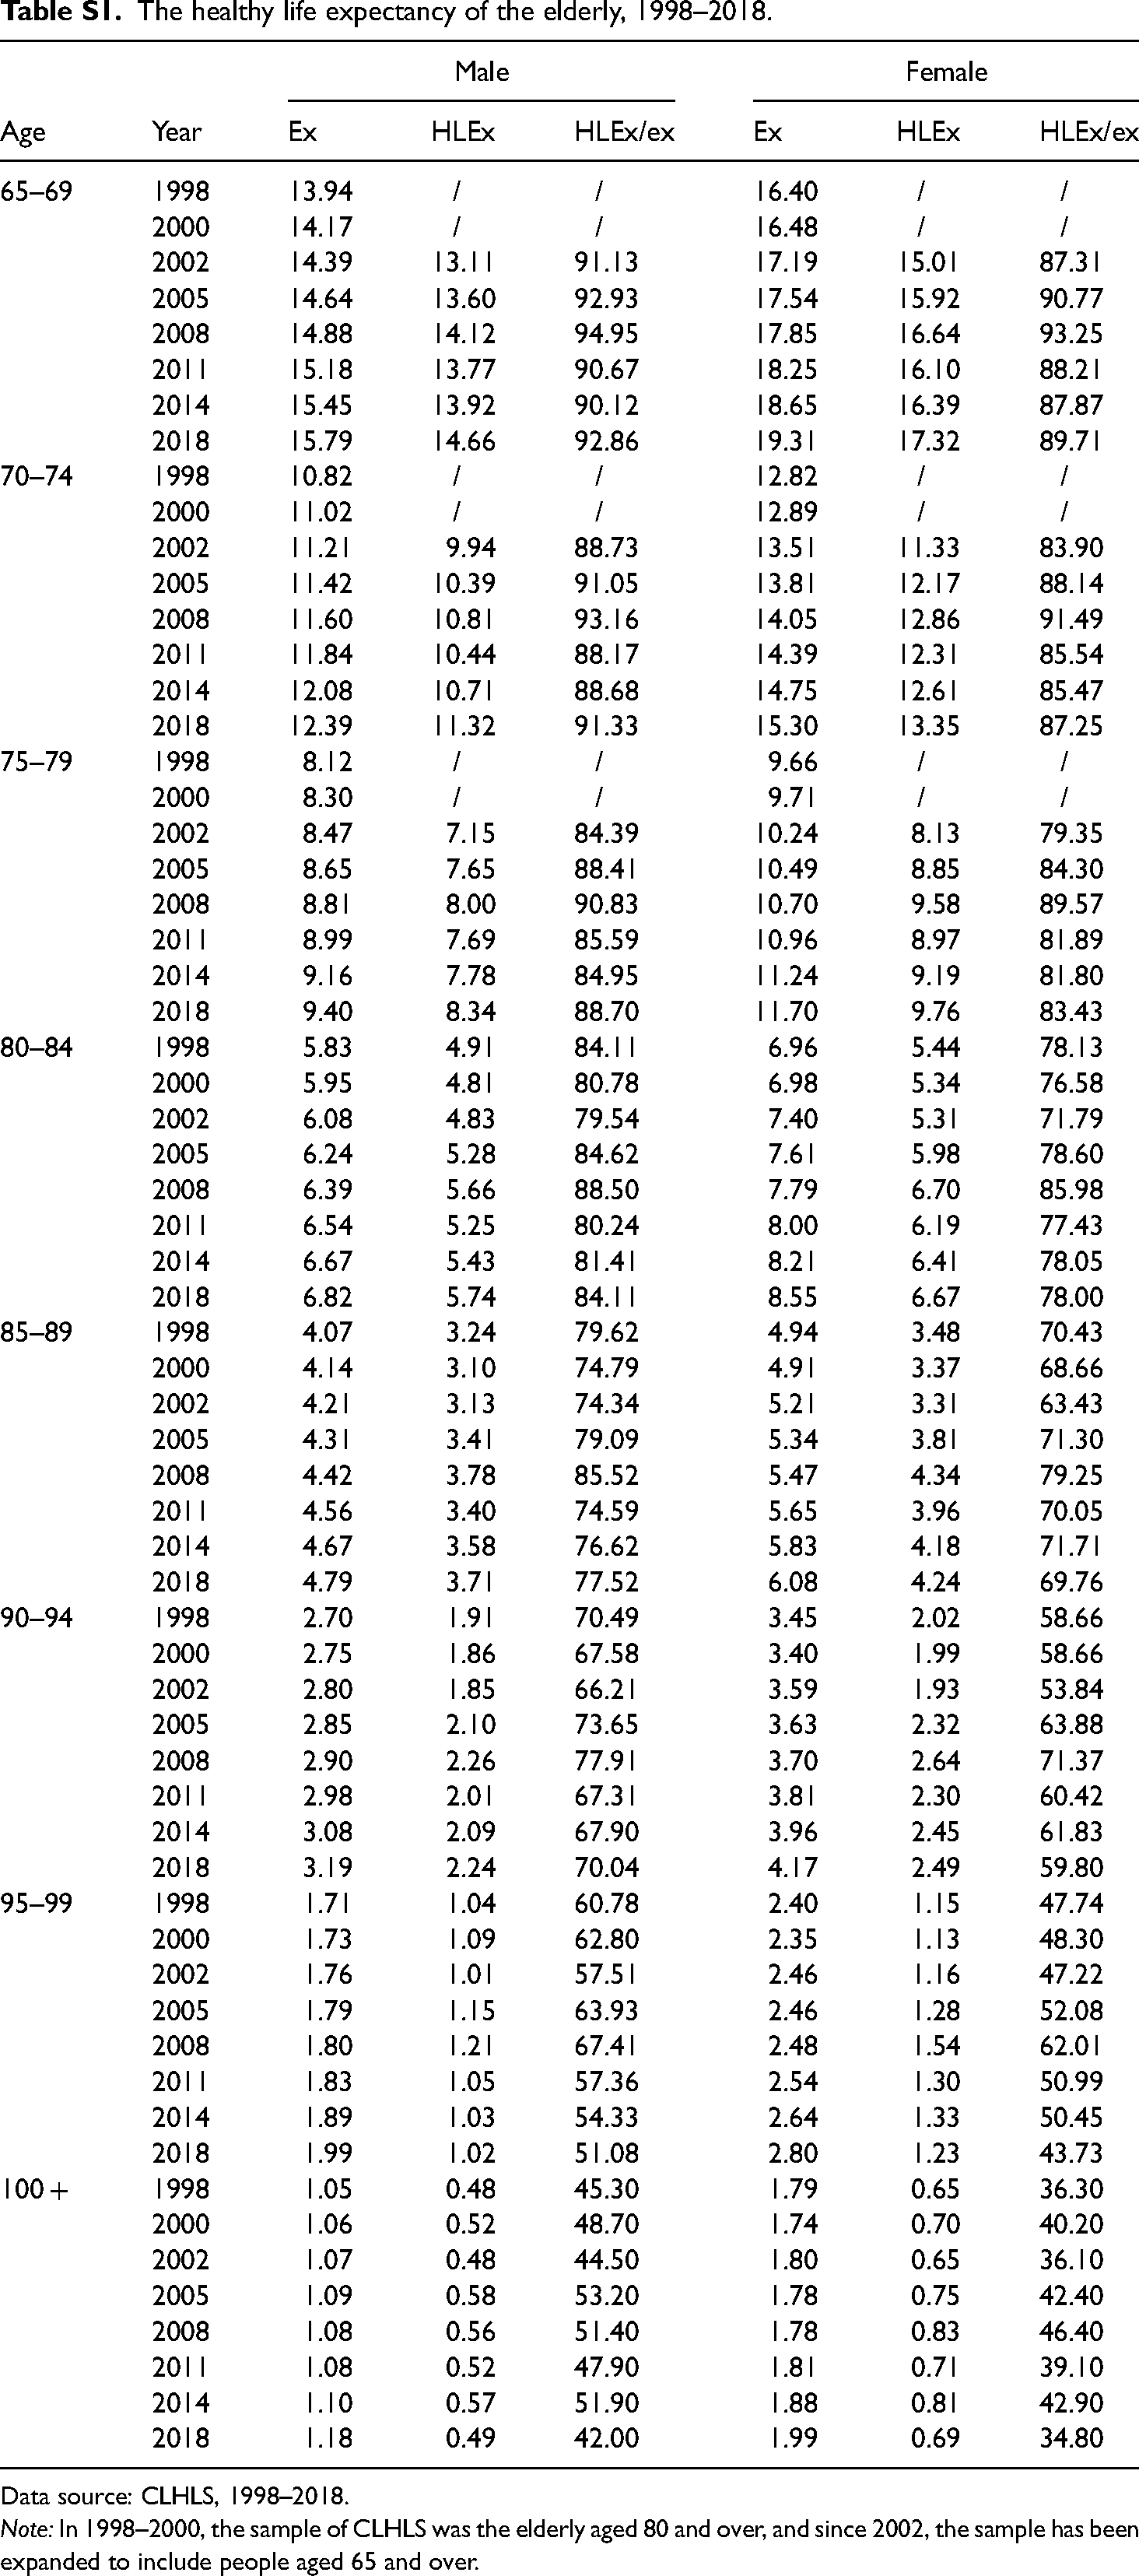
From 1998 to 2018, the life expectancy of older Chinese people continued to rise (see Table S1 and Figure 2). For men aged 65–69, life expectancy increased from 13.94 to 15.79 years—an increase of 1.85 years over 20 years. For women of the same age category, life expectancy grew from 16.40 to 19.31 years, an improvement of 2.91 years. At ages 80–84, life expectancy rose by 0.99 years for men and 1.59 years for women. Throughout this period, the gains in life expectancy were greater for women than for men.
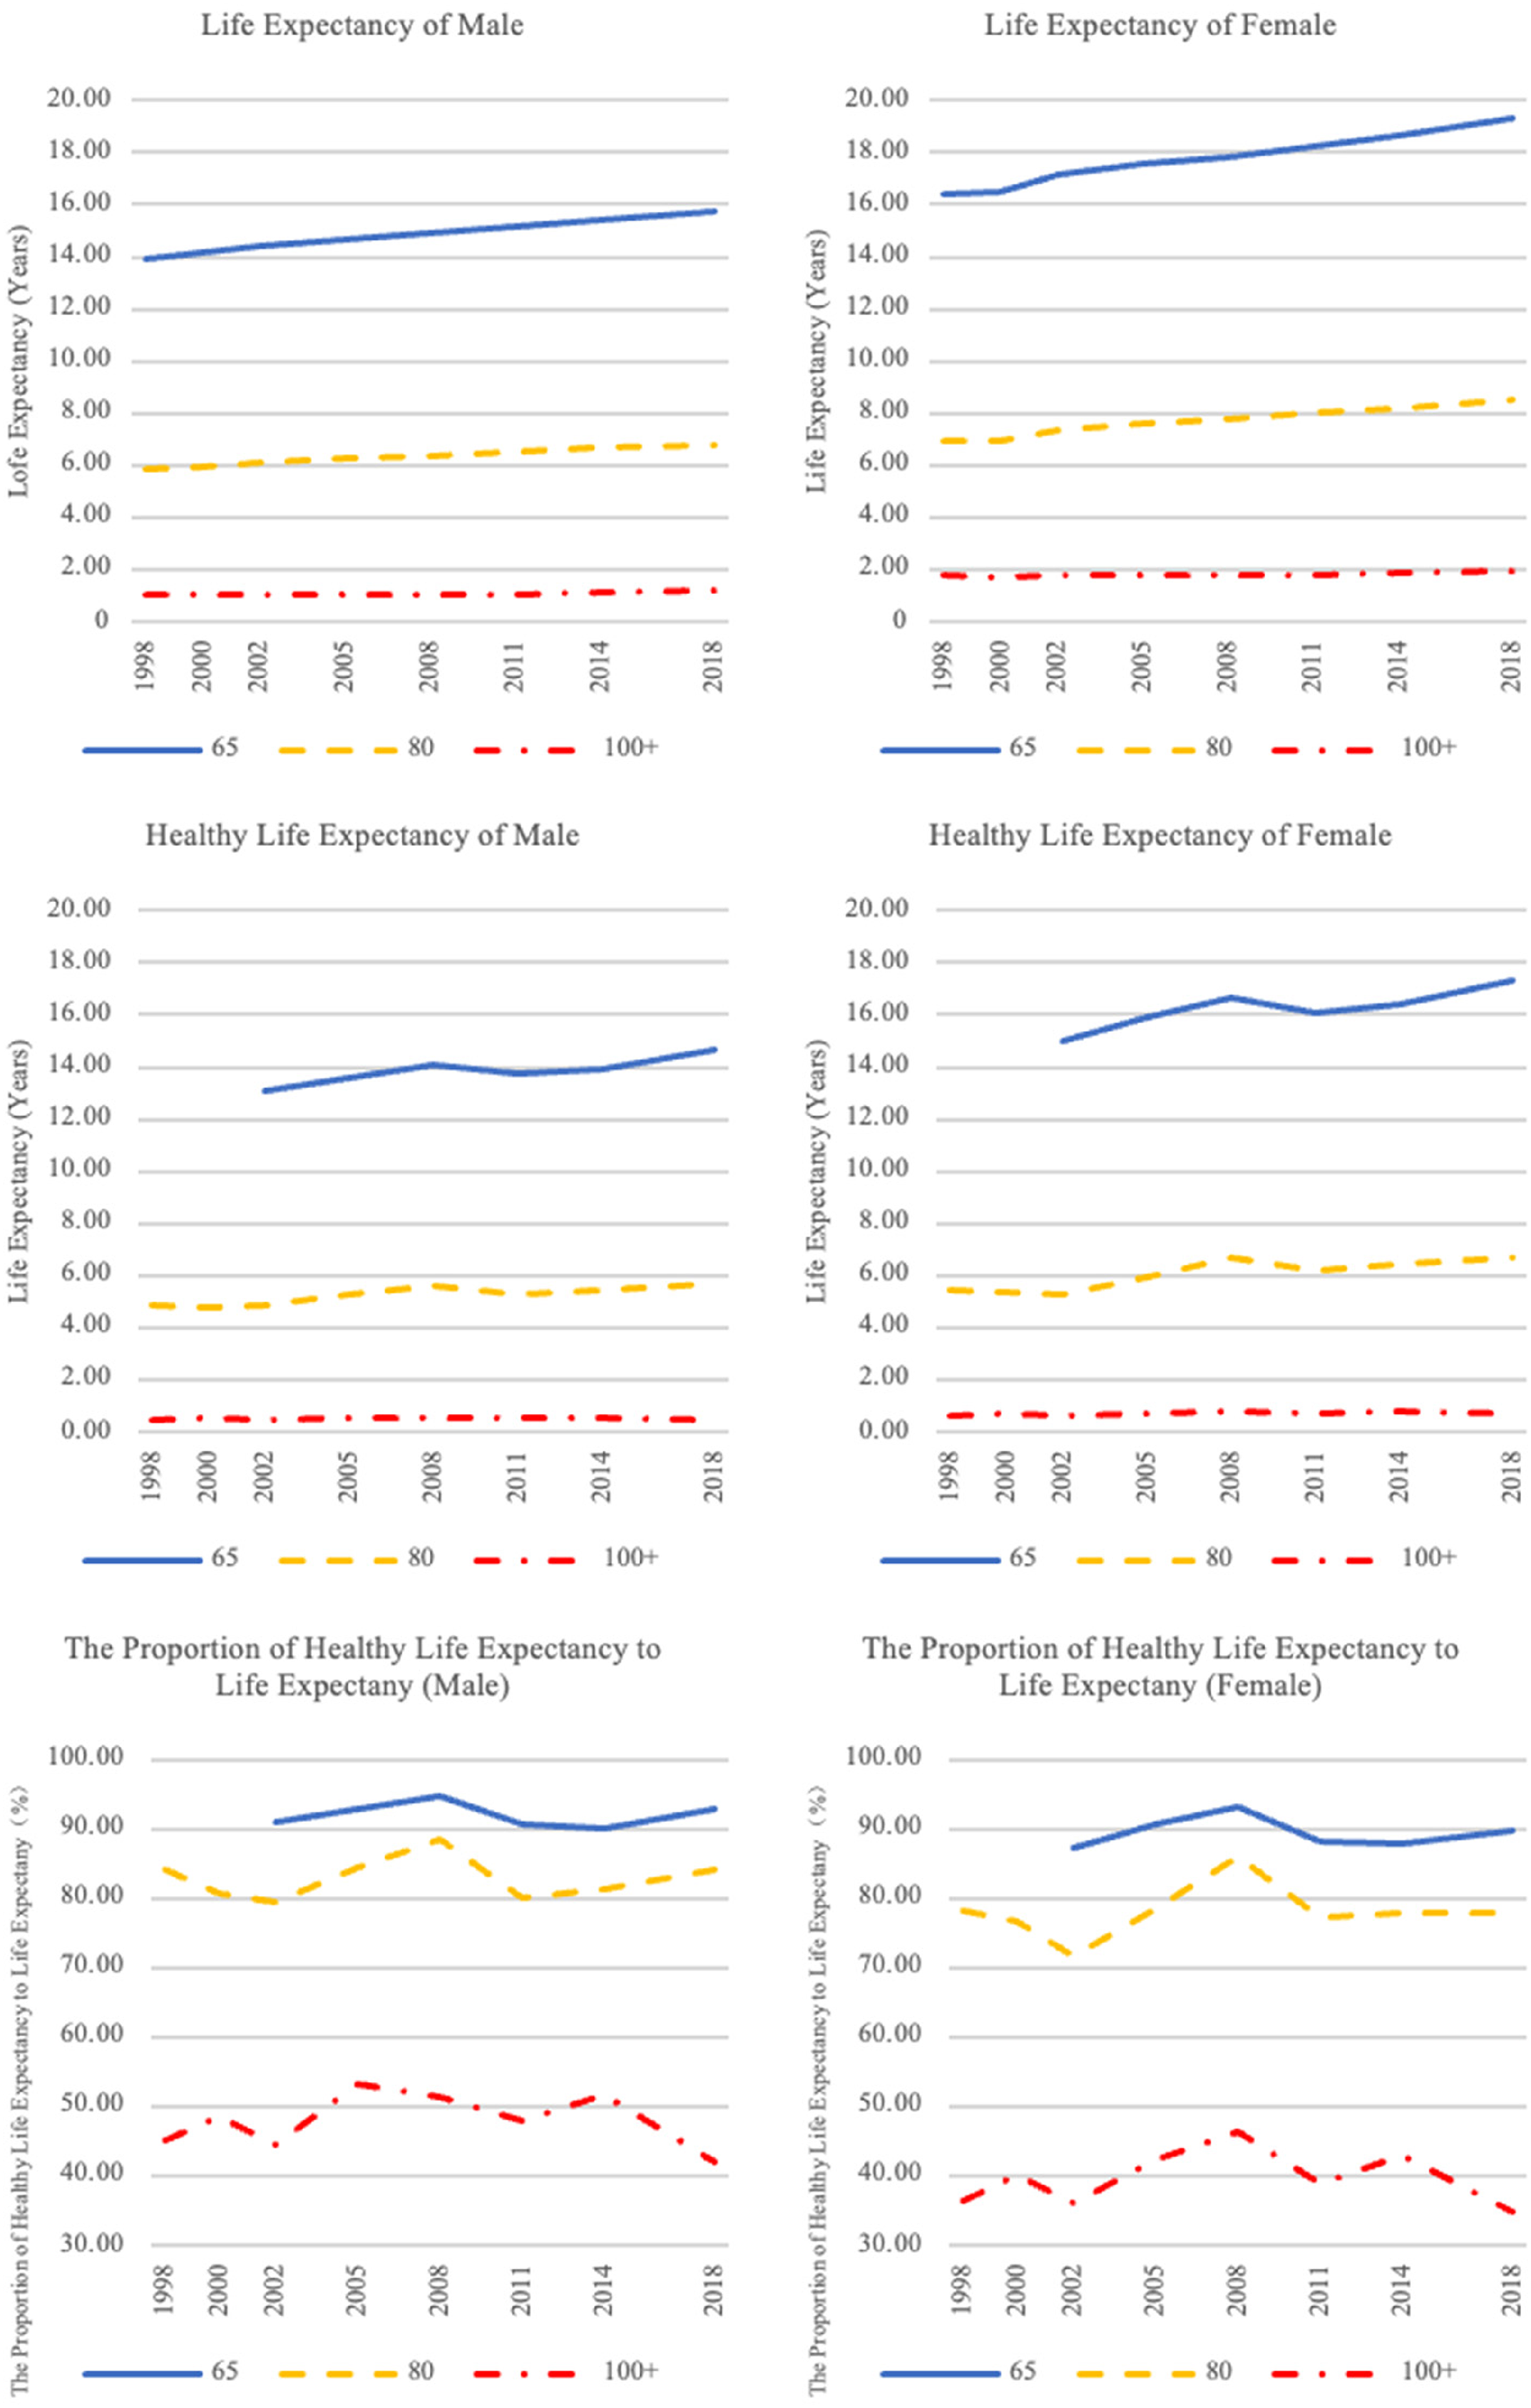
Healthy life expectancy and its proportion of life expectancy for the elderly aged 65–69, 80–84, over 100 during the period 1998–2018.
The HLE of 65–69-year-olds evinced three distinct phases from 2002 to 2018: an initial increase from 2002 to 2008, a decline from 2008 to 2011, and a subsequent rise from 2011 to 2018. For men, HLE rose from 13.11 years in 2002 to 14.66 years in 2018—an overall increase of 1.55 years, which consisted of a 1.02-year gain followed by a 0.36-year decrease and then an additional 0.89-year increase. For women, HLE grew from 15.01 years in 2002 to 17.32 years in 2018. This change occurred in three stages: a 1.64-year rise, a subsequent 0.54-year drop, and finally a 1.22-year rise, indicating more pronounced fluctuations for females compared to males.
During the same period, HLE as a proportion of life expectancy for those aged 65–69 generally increased, although it was marked by intermittent fluctuations. This trajectory is characterized by three phases: an increase from 2002 to 2008, a decline from 2008 to 2014, and another increase from 2014 to 2018. In the two periods of increase, HLE grew more rapidly than overall life expectancy, supporting the “compression of morbidity” theory. Conversely, during the decline phase, the slower growth of HLE relative to overall life expectancy was suggestive of the “expansion of morbidity” theory. Specifically, for 65–69-year-old men, HLE as a proportion of total life expectancy rose from 91.13% to 92.86%, with a 3.82-percentage-point increase initially, a 4.82-percentage-point decrease during the second phase, and a 2.73-percentage-point increase in the final phase. For women of the same age, the proportion climbed from 87.31% to 89.71%, progressing through a 5.94-percentage-point increase, a 5.38-percentage-point reduction, and then a 1.84-percentage-point increase.
HLE for 80–84-year-old elders saw a modest overall expansion from 1998 to 2018, but with fluctuations throughout the period. For men, HLE increased from 4.91 to 5.74 years, and for women, it rose from 5.44 to 6.67 years. The trends included a decrease from 1998 to 2000, a rise from 2000 to 2008, another decline from 2008 to 2011, and finally a resumption of growth from 2011 to 2018.
HLE as a proportion of total life expectancy for the 80–84 age group experienced a slight decline yet still displayed a pattern of multistage changes. For males, the trend in this proportion can be divided into four phases: a decrease from 1998 to 2002, an increase from 2002 to 2008, another decrease from 2008 to 2011, and finally an increase from 2011 to 2018. For females, the trend followed a similar zigzag pattern as that of males from 1998 to 2014, but it further decreased from 2014 to 2018. In broader terms, viewing the change in this index from 1998 to 2018, the figure for men aged 80–84 remained essentially unchanged, while for females there was a marginal decrease from 78.13% to 78%.
In summary, for elderly people aged 65–69, HLE as a proportion of total life expectancy increased from 2002 to 2018, albeit with fluctuations. This trend supports the “compression of morbidity” hypothesis. From 1998 to 2018, the HLE of 80–84-year-olds increased slightly, but as a proportion of total life expectancy it decreased, which supports the “expansion of morbidity” theory. Thus, over this period, the health patterns among the elderly alternated between the “compression of morbidity” and “expansion of morbidity” theories.
Comparison of findings: National Population Census versus CLHLS
Previous studies indicate that variations in research design can lead to differences in findings. This is exemplified by the contrasts between the National Population Census and CLHLS in aspects such as survey design, sample size, methods of health measurement, and data collection techniques, which have resulted in discrepancies in the estimated HLE and its proportion to the overall life expectancy of the elderly population.
When using census data, the estimated HLE for the elderly appears to be higher compared to estimates derived from the CLHLS data. Since mortality data sources are consistent, the discrepancy is attributed to variations in health rates. In particular, the 2010 census reported higher health rates among the elderly, with 98.53% for males and 98.45% for females aged 65, compared to 96.2% for males and 95.6% for females as established by the 2011 CLHLS. Consequently, the HLE for 65-year-olds based on the 2010 census was 0.71 years longer for males and 0.99 years longer for females than the CLHLS estimates for 2011. These differences in health rates may stem from the distinct approaches to measuring health status; the National Population Census employs a relatively simpler methodology, whereas CLHLS encompasses six dimensions of indicators and provides a more comprehensive evaluation of health status, potentially resulting in a lower health status.
The patterns indicating the proportion of HLE to overall life expectancy among the elderly, as deduced from the National Population Census and CLHLS, show convergence toward an increasing trend over time. Nonetheless, within the 2010–2020 timeframe, CLHLS conducted three survey rounds, compared to the two surveys (short form and long form) implemented by the National Population Census. As a result, the estimations based on the census data suggest a linear trend, whereas those from CLHLS capture more nuanced health status fluctuations due to the greater frequency of surveys. These observations allow for comparative analysis; for instance, there was a noticeable decline in the proportion of HLE for 65-year-olds between 2008 and 2014, followed by an increase, highlighting the variable nature of elderly health status. Although the overall trends from both data sources align, CLHLS, with its more frequent survey intervals, better reflects the dynamic shifts in health status over the period, thereby providing deeper insight into its evolving patterns through time.
The effect of mortality and health rates on changes in HLE
Analysis using National Population Census data
Table 2 presents the detailed steps that we took to evaluate how changes in mortality and health rates have influenced HLE over time, employing a counterfactual analysis approach. Our methodology involved the following steps: To isolate the impact of health rate changes between 2010 and 2020, we first computed a hypothetical HLE for the year 2020 (HLE2020S, shown in column 4 of Table 2), assuming that health rates remained the same as in 2010. This means we used the health rate from 2010 and applied it to the 2020 mortality data. Next, we determined the actual change in HLE over the decade by subtracting the HLE in 2010 from the HLE in 2020 (see column 5). This calculation provided us with the genuine overall difference in HLE.
The effects of mortality and health rates on the changes in healthy life expectancy, 2010–2020.
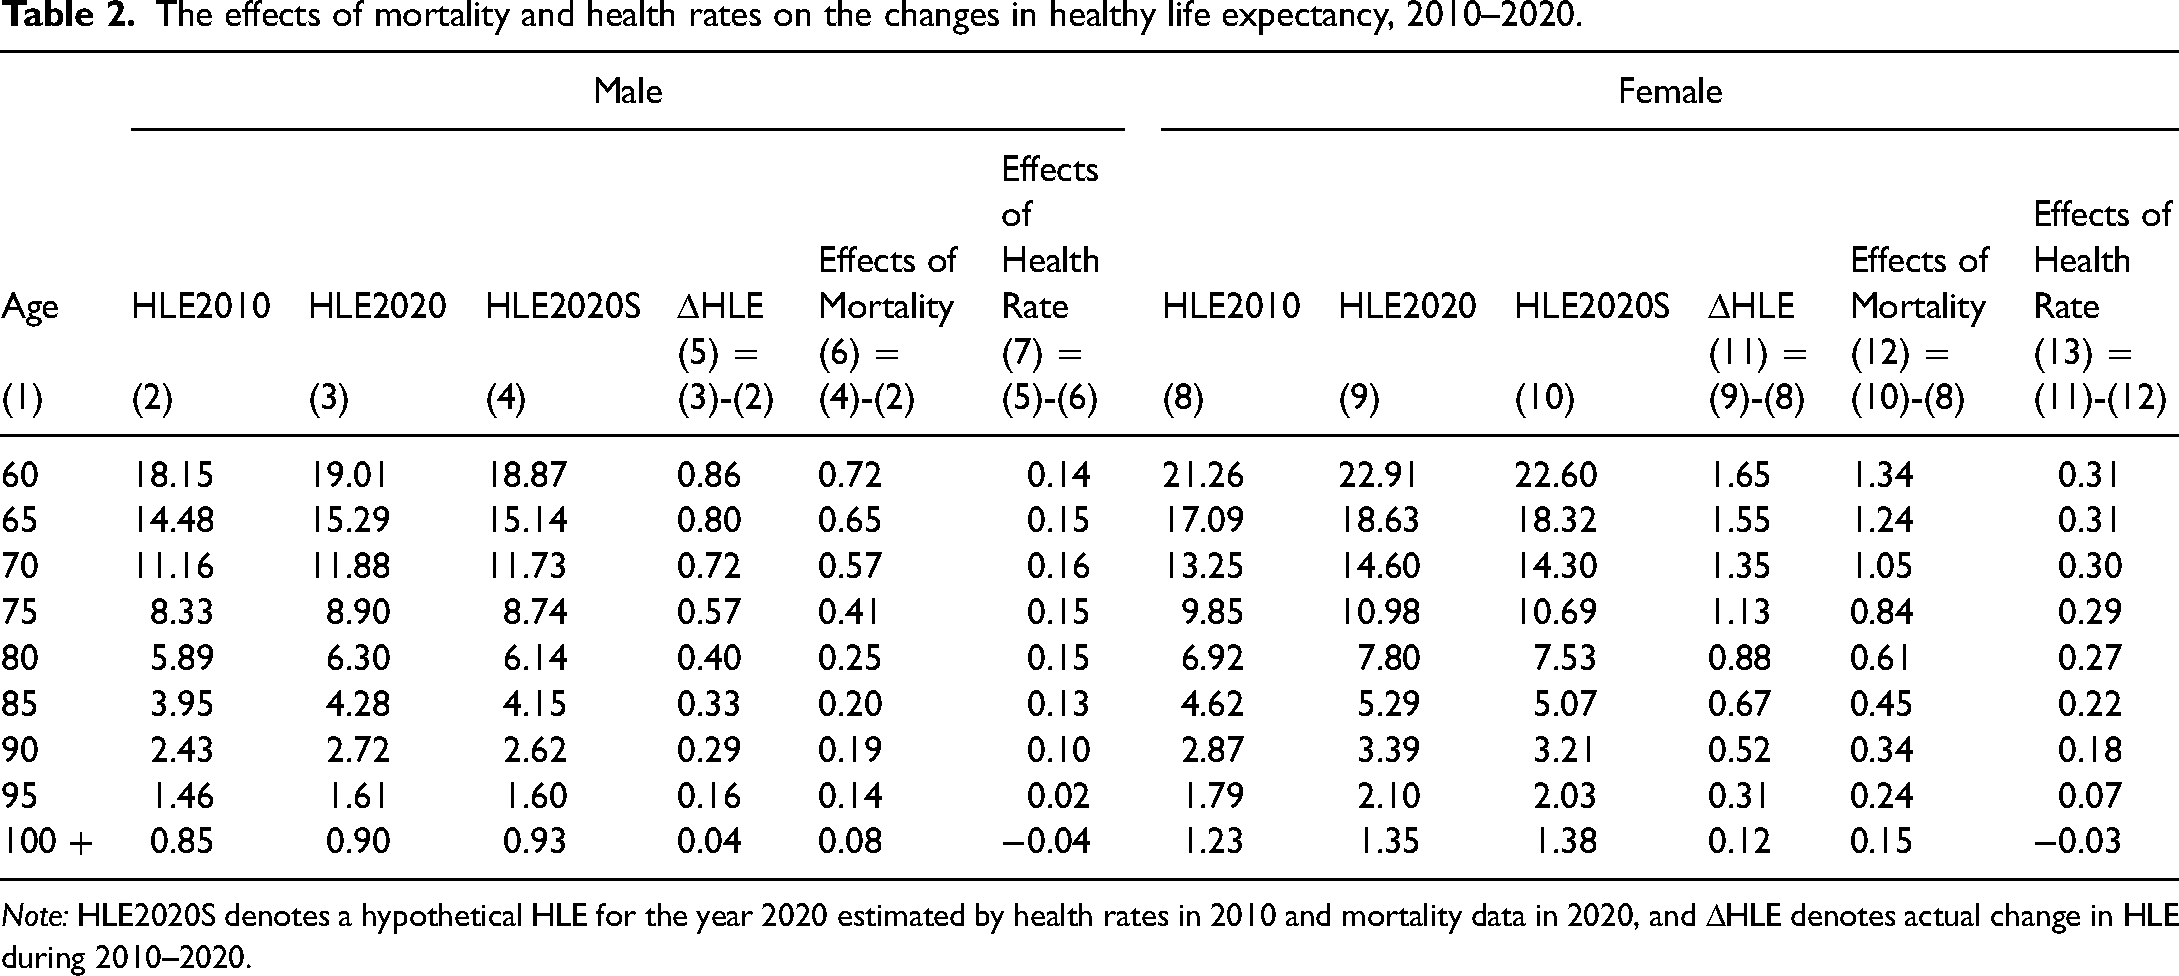
Note: HLE2020S denotes a hypothetical HLE for the year 2020 estimated by health rates in 2010 and mortality data in 2020, and ΔHLE denotes actual change in HLE during 2010–2020.
The contribution of improved mortality (i.e. reduced death rates) to the change in HLE was calculated by comparing the hypothetical HLE in 2020 (assuming constant health rates) to the actual HLE in 2010 (results in column 6). The difference between these two figures indicates the change in HLE solely due to decreases in mortality rates over the ten-year period.
Finally, to find out how much of the actual change in HLE can be attributed to shifts in health rates, we subtracted the change linked to mortality (from step 3) from the actual change in HLE (calculated in step 2). The remaining difference, displayed in column 7, represents the change in HLE that can be attributed to changes in health rates—apart from mortality improvements—between 2010 and 2020.
By systematically applying this counterfactual analysis, we can effectively disentangle the effects of mortality reduction and health rate variations on the HLE of the population, thereby providing insights into the underlying drivers of changes in population health over time.
Between 2010 and 2020, the increase in HLE among older Chinese individuals was primarily due to a decrease in mortality rates and, to a lesser extent, an improvement in the rates of good health. The reduction in mortality rates had a more notable effect on the increase in HLE, as detailed in Table 2. For 65-year-old males, HLE rose by 0.8 years. Of this, a 0.65-year rise (making up 81.32% of the total increase) is attributed to lower mortality rates, while the remaining 0.15-year rise resulted from improvements in health. A similar pattern was observed among females.
However, for centenarians, the situation was different. Health measures showed a decreasing trend, meaning that the health of the very old was not improving. Despite this, HLE for centenarians still increased, solely due to lower mortality rates. This decline in mortality was enough to offset the negative effect of declining health on their HLE.
Findings based on CLHLS
CLHLS initially focused on individuals aged 80 and above during the period 1998–2000. It then expanded to include those aged 65 and above from 2002 to 2018. Within this cohort, we observed that the HLE for those aged 80 and above declined between 1998 and 2002. However, for the group of individuals aged 65 and above, the trend was different: an increase in HLE from 2002 to 2008, a decrease from 2008 to 2011, and then an upward trend from 2011 to 2018. This study will examine the impacts of mortality and health rates on the HLE of the elderly during these distinct periods using counterfactual analysis approach (the calculation steps are the same as those shown in Table 2).
The effect of mortality and health rates on the HLE of the elderly aged 80 and above from 1998 to 2002
From 1998 to 2002, males in the 80-years-old-and-above cohort saw a 0.07-year decrease in HLE. The decline in mortality rates during this period led to a 0.198-year increase in HLE (as shown in Figure 3). However, the diminishing health rate caused a larger 0.268-year reduction in HLE for males (as indicated in Figures 1 and 3). Therefore, the negative impact of the declining health rate overshadowed the life expectancy gains due to the lower mortality rate.
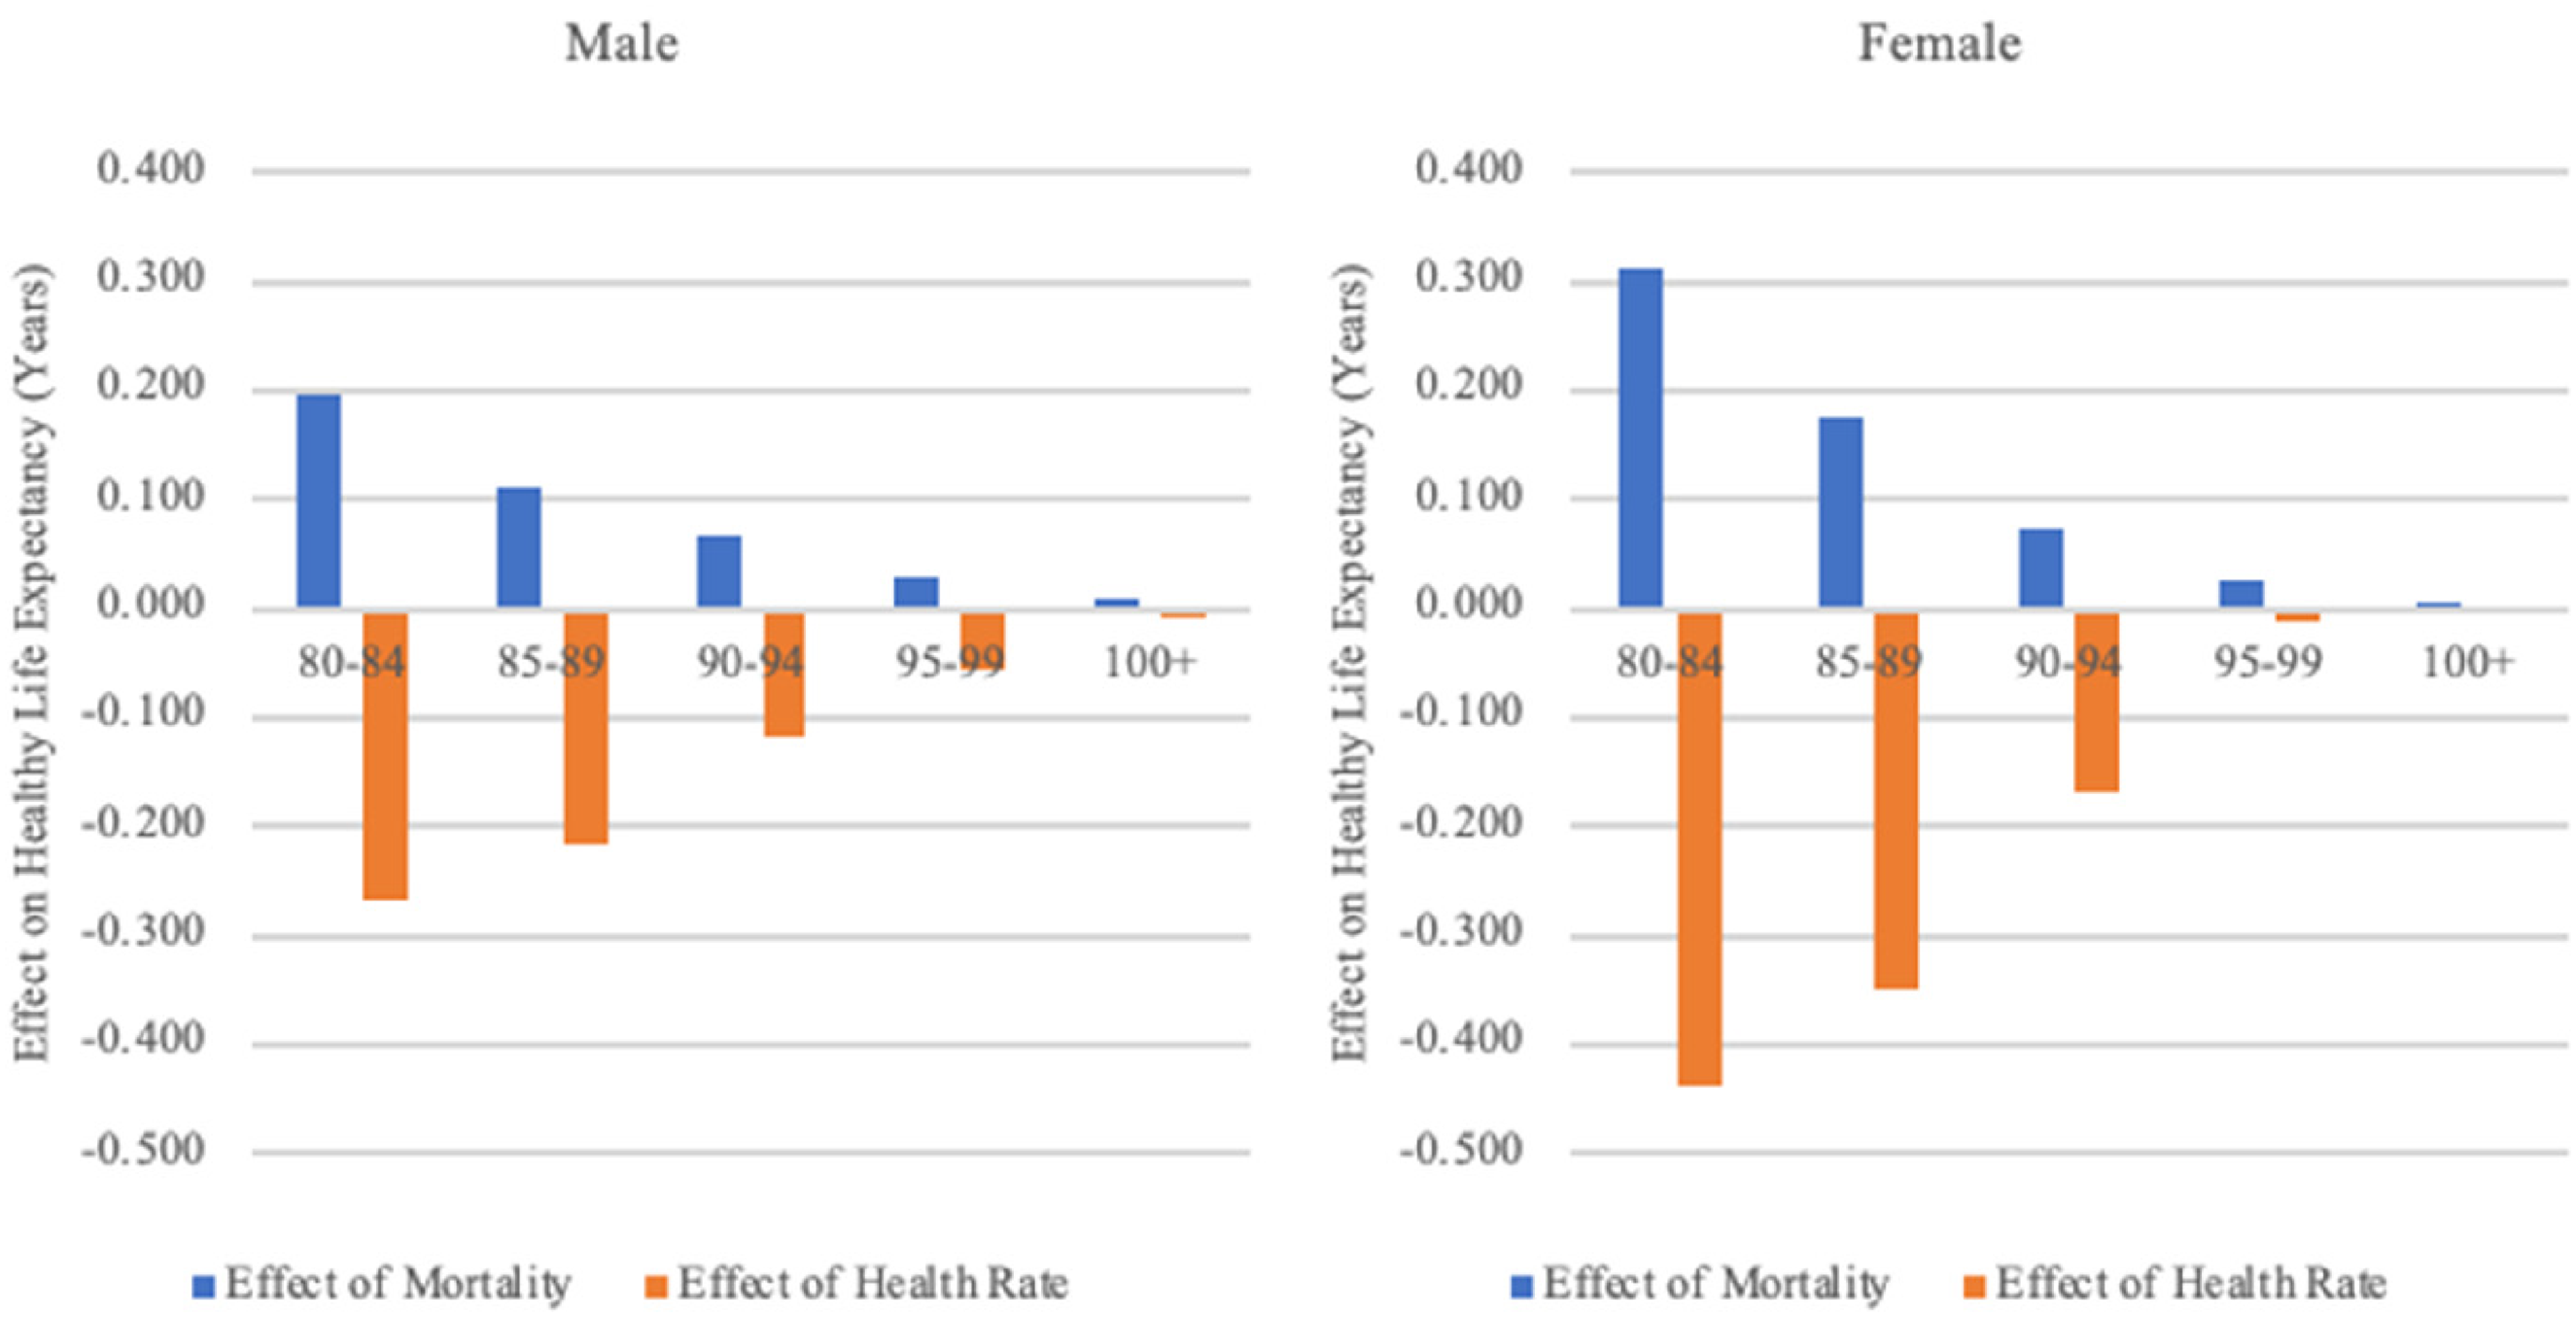
The effect of mortality and health rates on healthy life expectancy, 1998–2002.
It is important to note that the trend was different for the oldest old. Specifically, males who were aged 100 and above and females who were aged 95 and above experienced a small increase in their healthy life expectancies during this same period. For these age groups, the positive effects of declining mortality on HLE were greater than the negative impacts of a declining health rate.
The impact of mortality and health rates on HLE from 2002 to 2008
From 2002 to 2008, an upward trend in HLE among older adults was observed, which was driven by a reduction in mortality rates and changes in health rates. Notably, the changes in health rates played a more significant role in the increase in HLE, as depicted in Figure 4. Health rates for individuals aged 65 and above showed fluctuating growth during this period, as illustrated in Figure 1. Specifically, HLE among males aged 65–69 increased by 1.02 years; decreases in mortality contributed an additional 0.41 years, and increases in health rates contributed 0.61 years. Similar trends were observed among females.
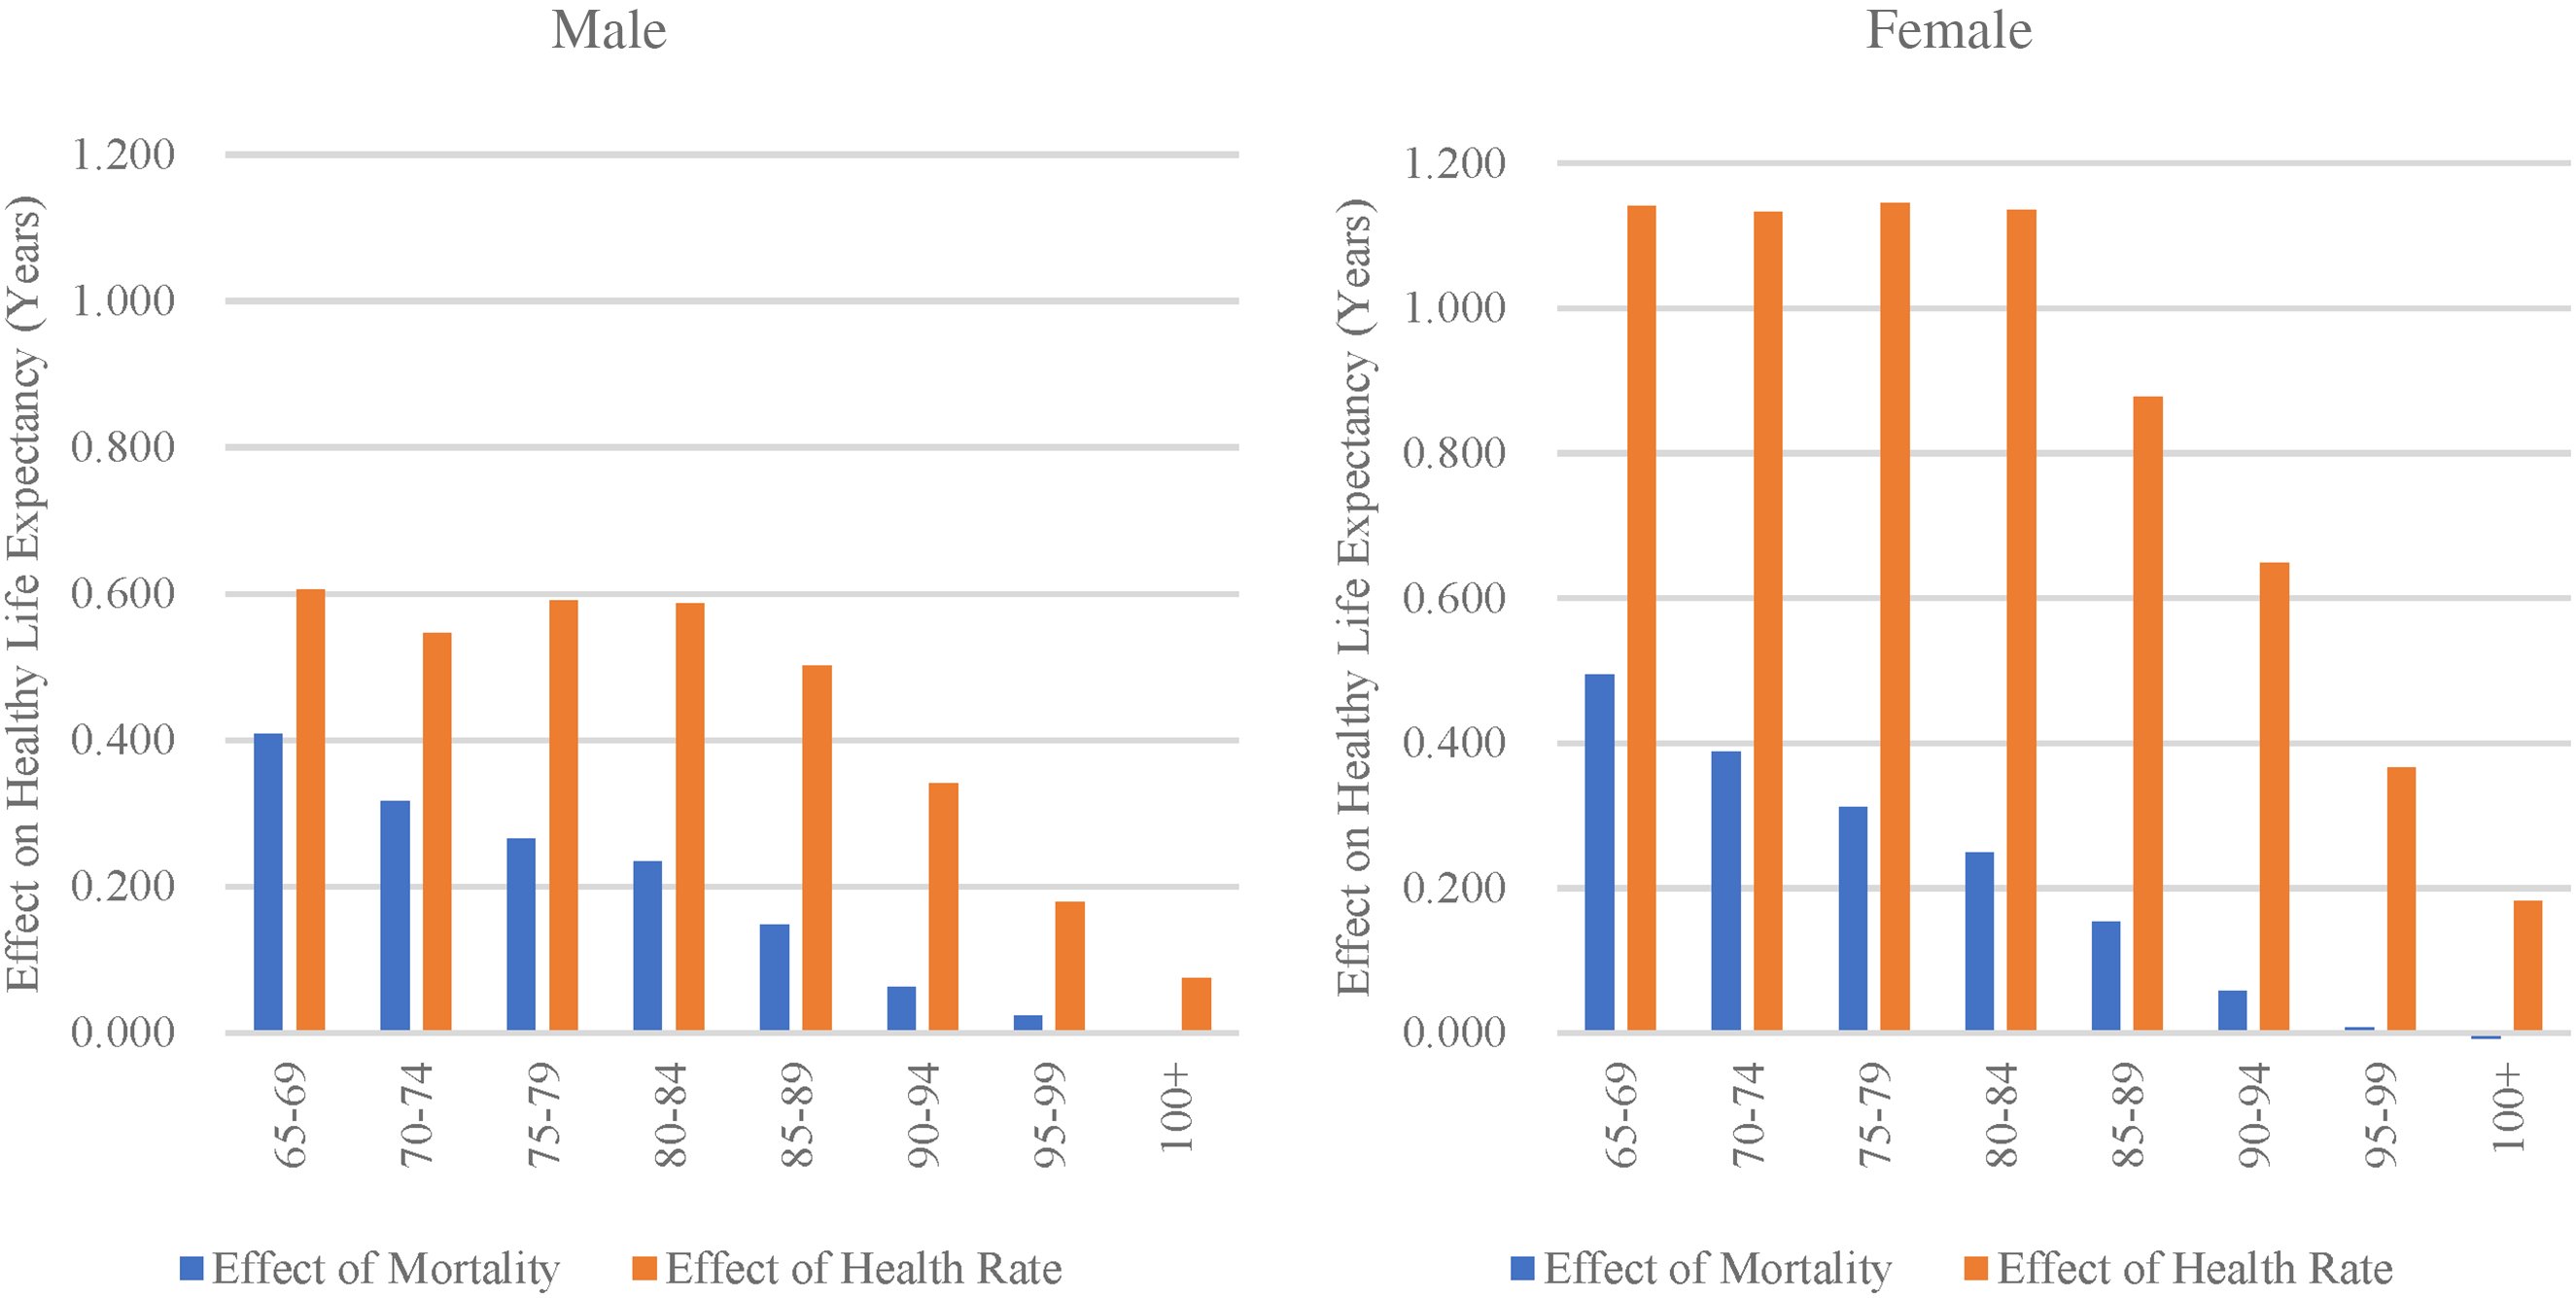
The effect of mortality and health rates on healthy life expectancy, 2002–2008.
The influence of mortality and health rates on HLE from 2008 to 2011
During the period from 2008 to 2011, HLE showed a downward trend, primarily due to declining health rates, as shown in Figure 5. For males aged 65–69, HLE decreased by 0.36 years. This decrease occurred despite the fact that a reduced mortality rate contributed an increase of 0.278 years to HLE. However, a lowered health rate led to a greater reduction of 0.636 years in HLE. This indicates that the decline in HLE was entirely due to the reduction in health rates, which offset the positive effect of decreased mortality rates on extending HLE. A similar pattern of change was observed in females.
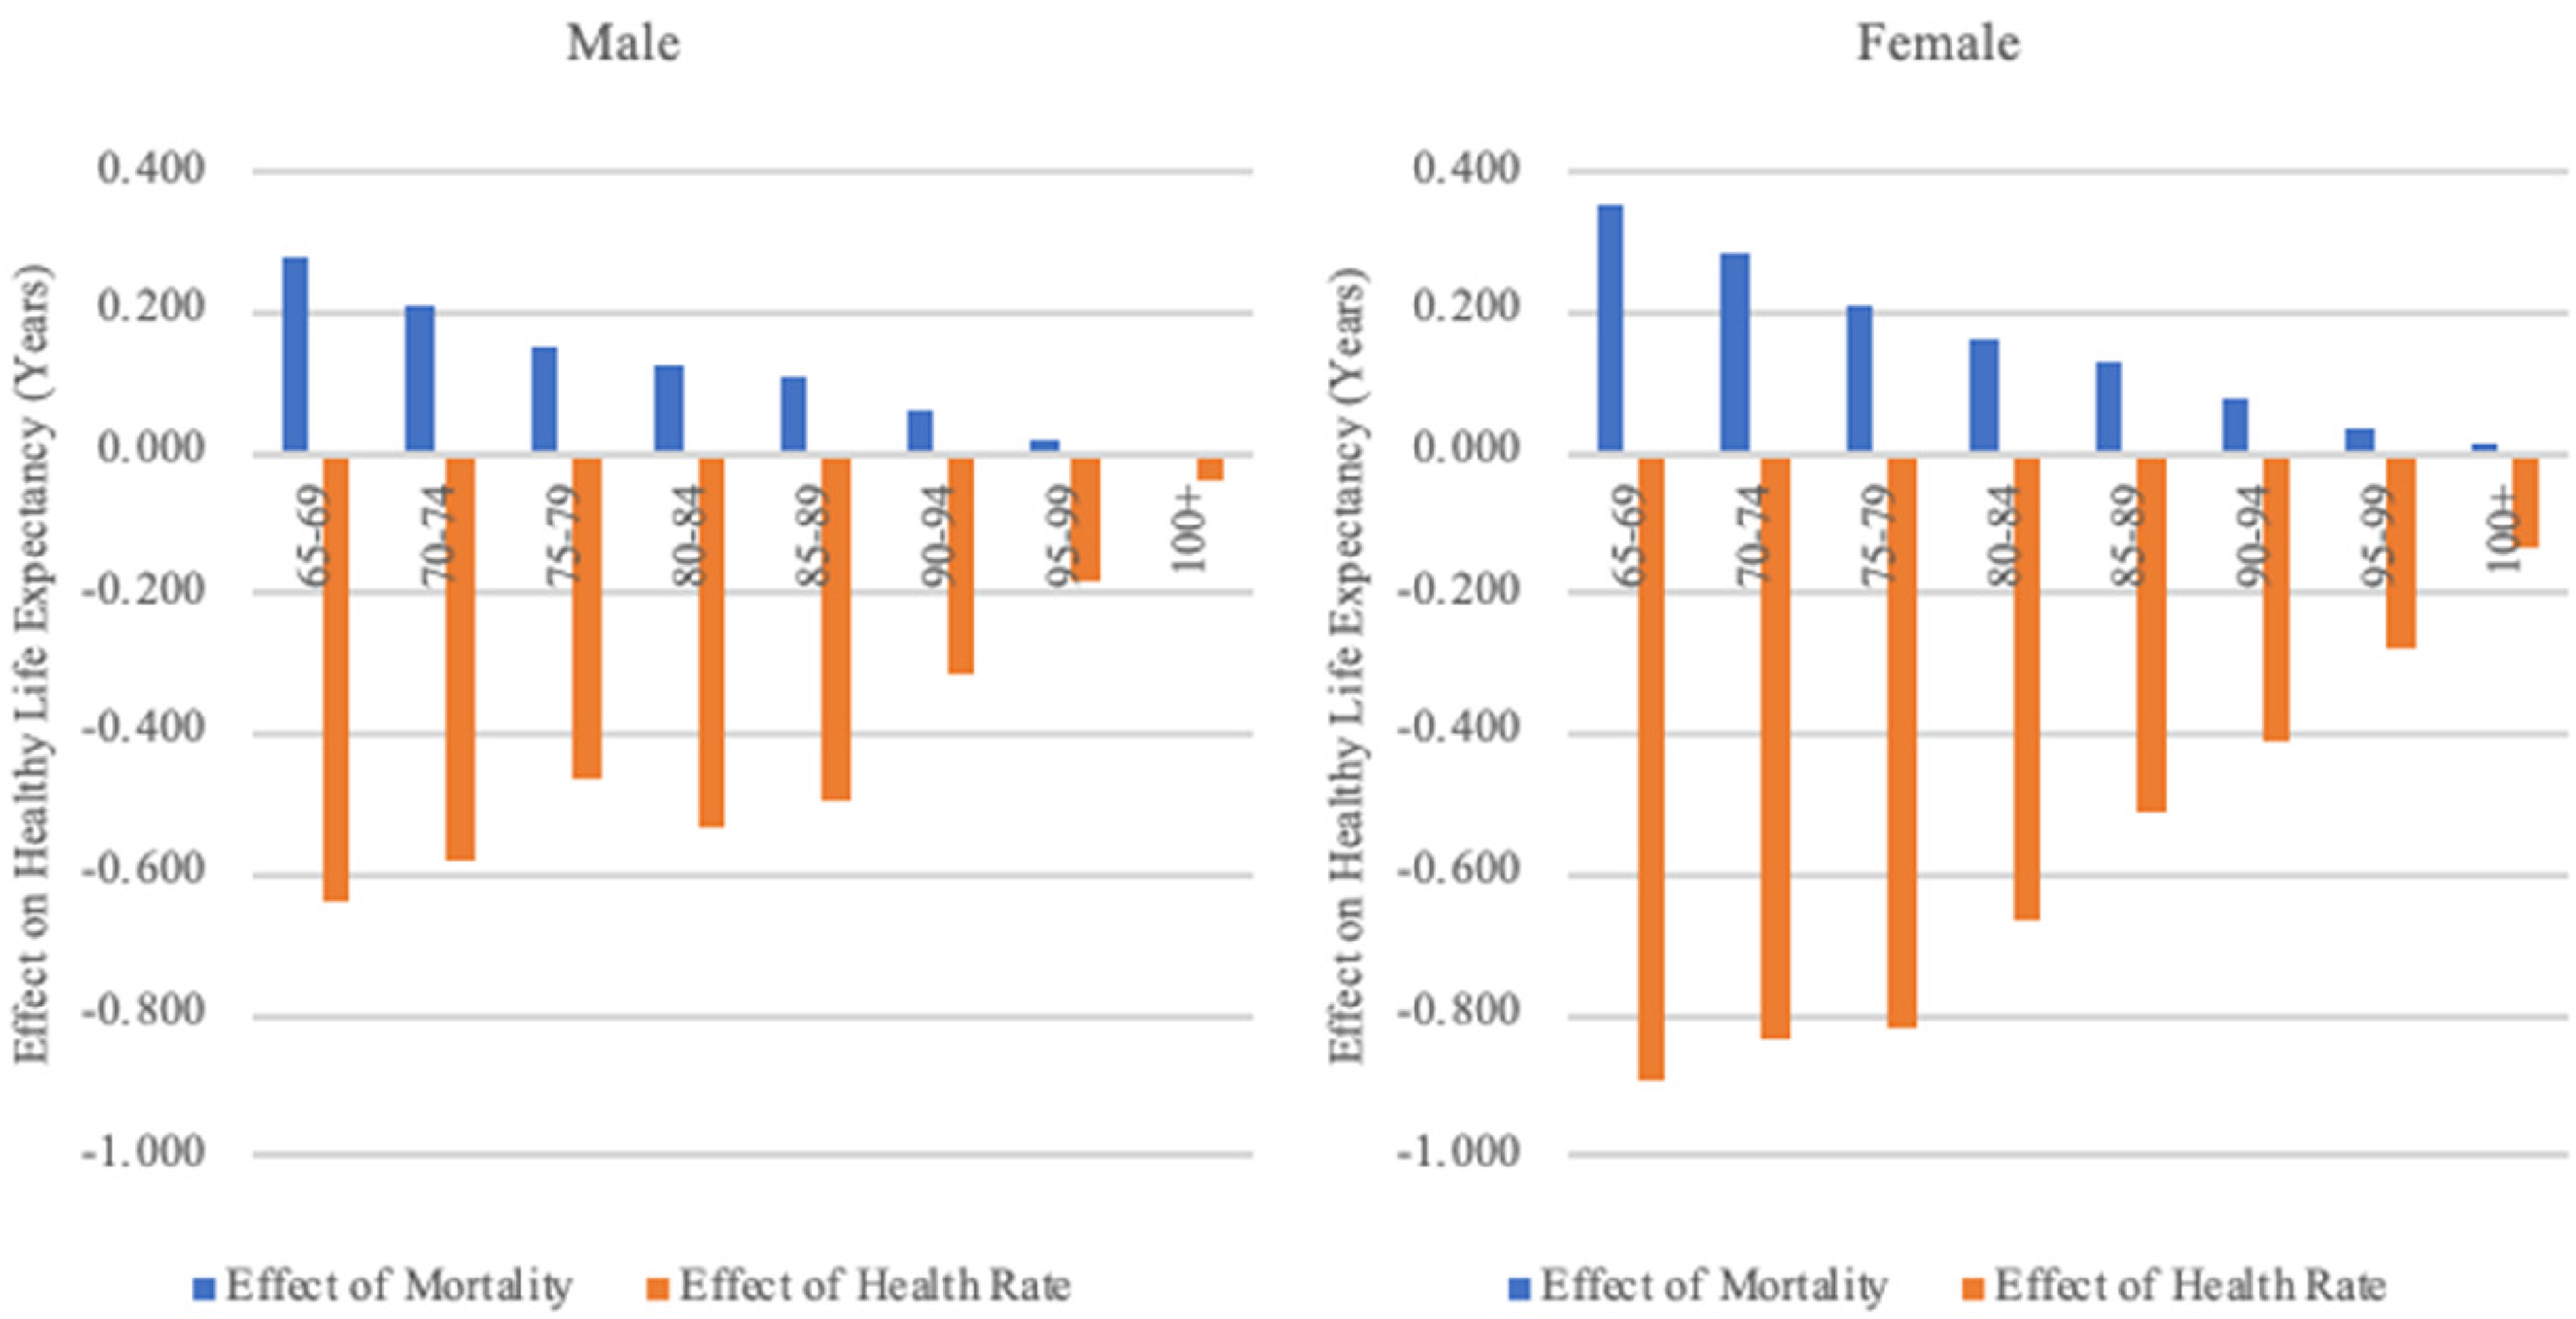
The effect of mortality and health rates on healthy life expectancy, 2008–2011.
The effect of mortality and health rates on HLE from 2011 to 2018
Between 2011 and 2018, the HLE of elderly individuals within the 65–90 age group increased, attributable to both declining mortality rates and rising health rates, as presented in Figure 6. For 65–69-year-old males, HLE increased by 0.89 years, with a decrease in mortality contributing an additional 0.5 years and an improvement in health rates contributing another 0.39 years. A similar upward trend was observed for females. However, for females in the 90–94-year-old age group, changes in health rates had a negative impact on HLE, offsetting some of the benefits gained from the reduction in mortality rates.
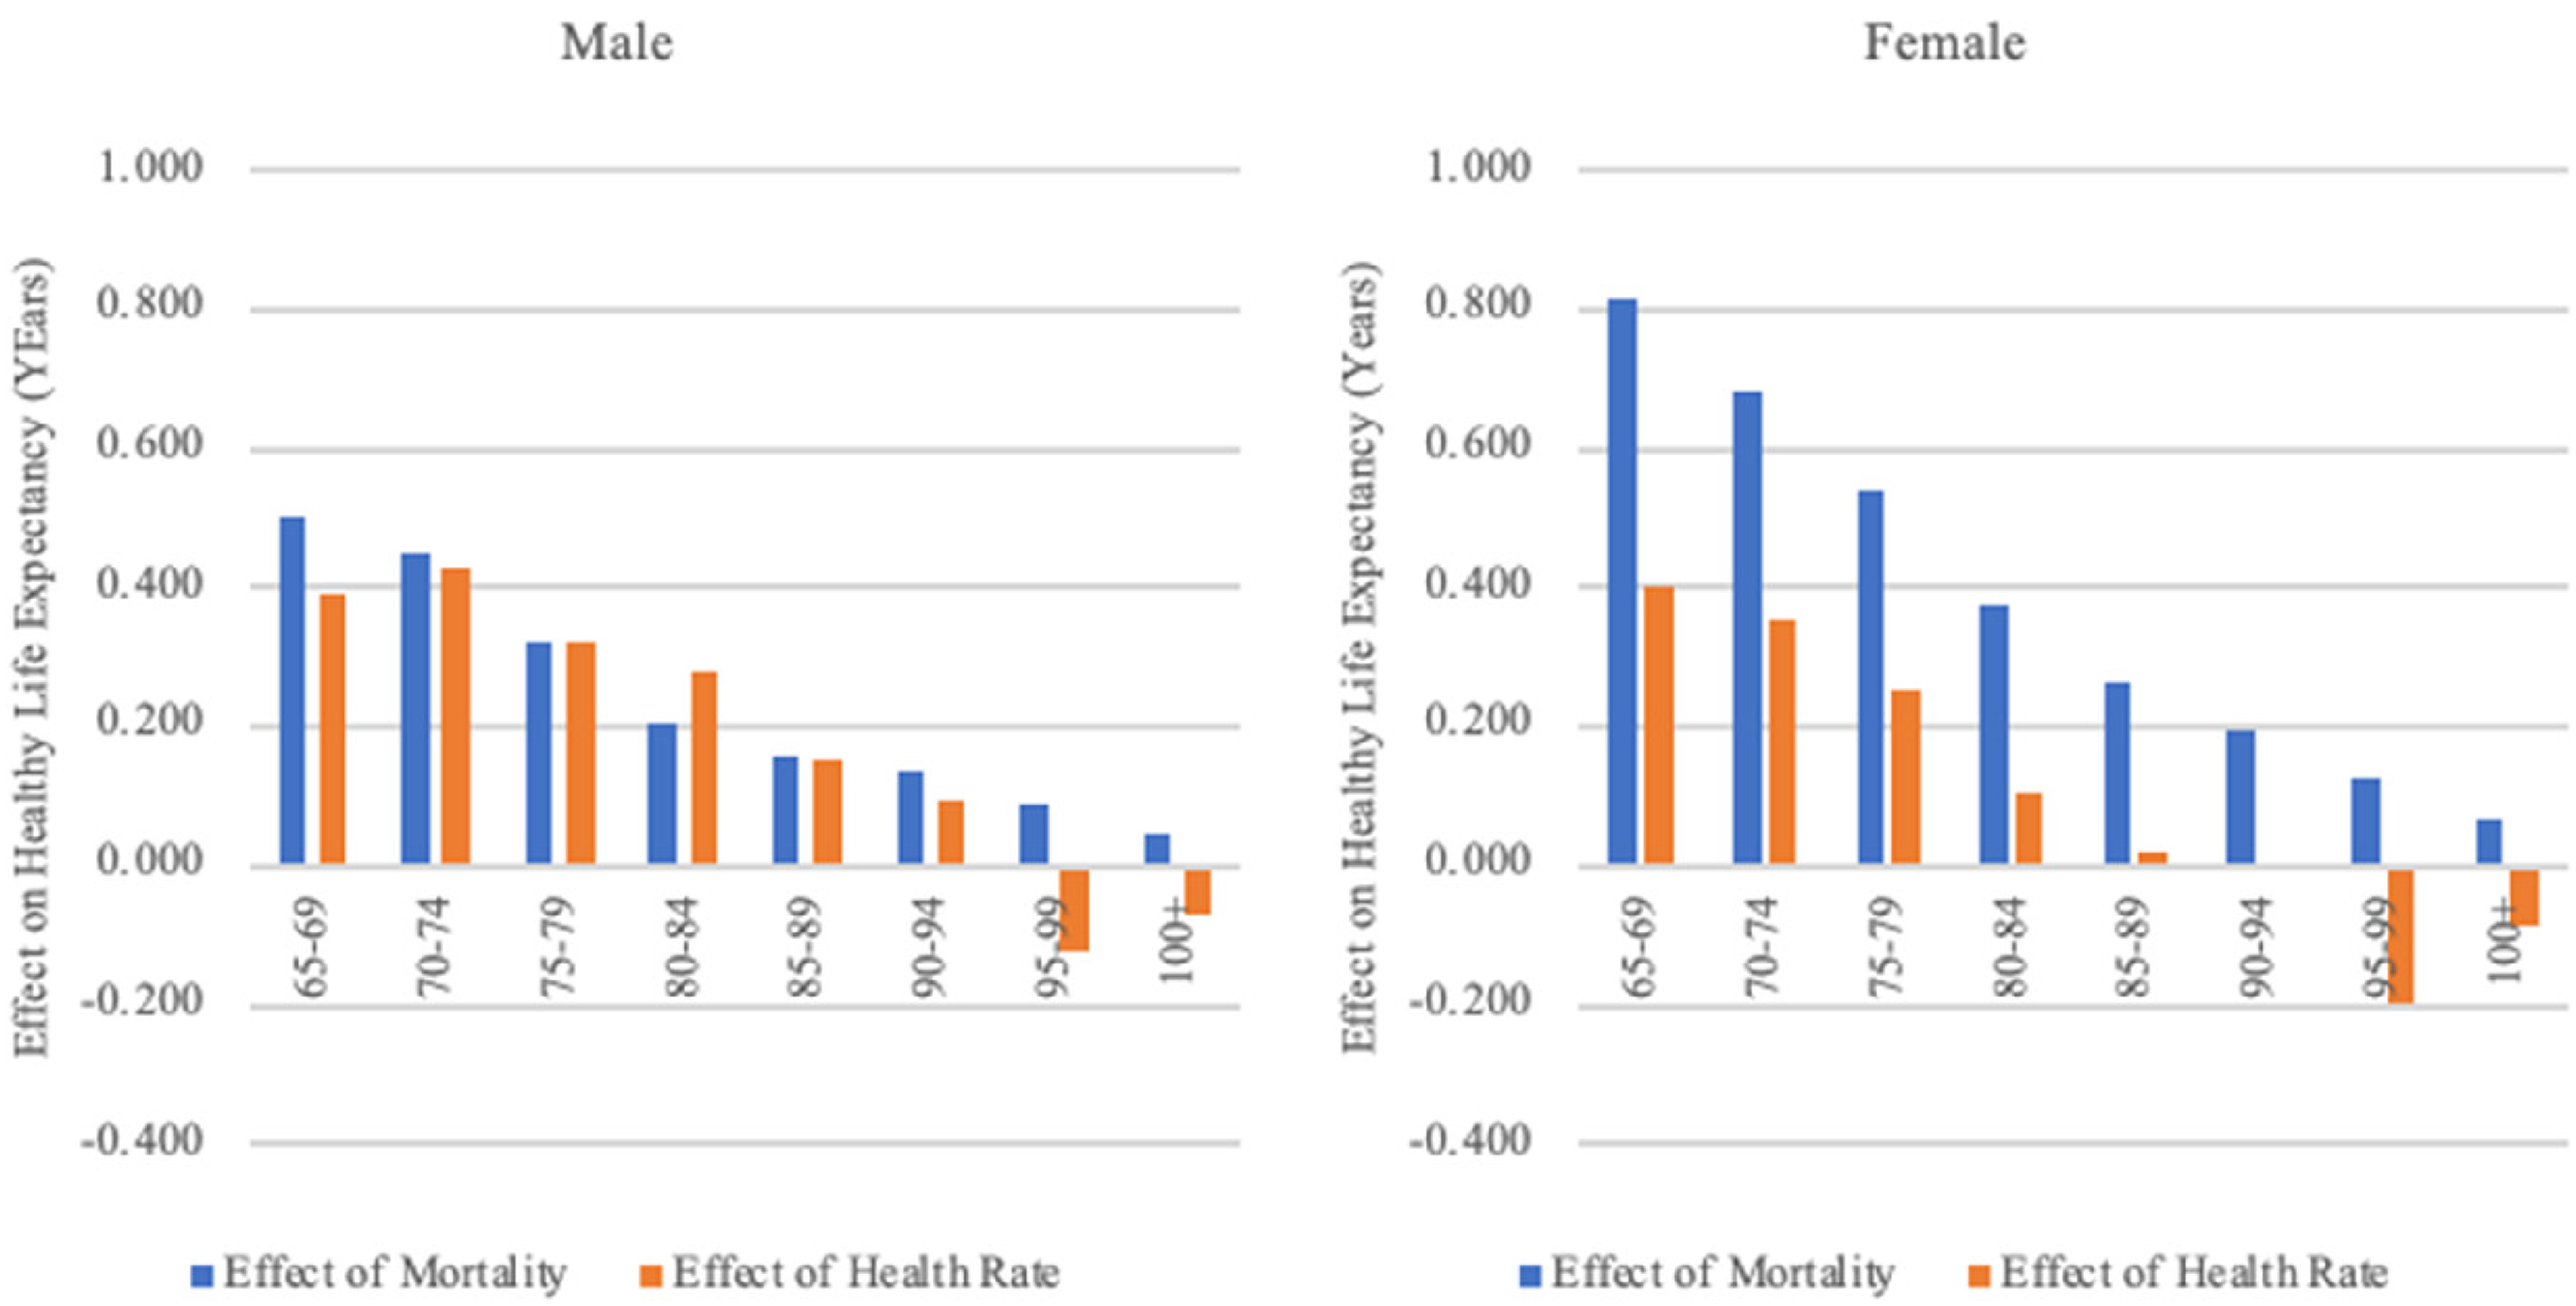
The effect of mortality and health rates on healthy life expectancy, 2011–2018.
In contrast, for those aged 95 and over, there was a decrease in HLE due to declining health rates, which outweighed the increase that resulted from declining mortality rates, as shown in Figure 6. The HLE of 95–99-year-old males decreased by 0.03 years during this period, with a decline in mortality accounting for a 0.09-year increase in HLE while the decline in health rates led to a 0.12-year decrease. Females exhibited a similar pattern.
The analysis of the influence of mortality and health rates on HLE, as gleaned from CLHLS data for 2011–2018 and National Population Census data for 2010–2020, reveals a consistent trend. Both the reduction in mortality rates and the improvement in health rates contributed to the increased HLE of the elderly. Nevertheless, a closer examination shows a disparity in the relative magnitude of these effects when comparing the census data with the CLHLS data. The census data suggest that for both men and women the decline in mortality had a much greater influence on lengthening HLE than improvements in health rates. Conversely, the CLHLS data present a more nuanced picture. For men, the CLHLS findings suggest that the effects of declining mortality rates are roughly similar in magnitude to those of increasing health rates. However, for women, the CLHLS data indicate that the decline in mortality had a more pronounced effect on HLE than the improvements in health rates. This contrast highlights the difference in how each data set represents the interplay between mortality decline and health improvement.
Discussion and conclusion
In this study, we examined the trends in HLE of the elderly in China since the 1990s. The National Population Census and CLHLS revealed that for the elderly in China HLE as a proportion of life expectancy increased during 2010–2020 and 1998–2018. This supports the “compression of morbidity” hypothesis. Despite variations in the estimation results, the observed trends are generally consistent across datasets.
Given the frequent survey intervals and periodic data collection of CLHLS, it is possible to trace the dynamic shifts in the elderly's health status. During 1998–2018, the health status of the elderly population in China oscillated between “compression of morbidity” and “expansion of morbidity”, demonstrating “expansion of morbidity” during 1998–2002 and 2008–2014 and “compression of morbidity” during 2002–2008 and 2014–2018. Such fluctuations match findings from Li et al. (2020) and Song and Yang (2020), though different research methods can yield varied results.
We used counterfactual analysis to decompose the impact of changes in health and mortality rates on HLE. From 1998 to 2020, mortality showed a continuous downward trend and the health rate increased with fluctuation, contributing to HLE increase.
The reasons for the increase in HLE among the elderly in China since 1990 are multifaceted. Factors include rapid socioeconomic development, significant advancements in medical technology, enhanced healthcare services, and better nutrition. Furthermore, the diversification of elderly care, including community-based and home care services, has markedly contributed to improving health outcomes for the elderly. These services have been linked to better self-reported health metrics and have increased the capacity of older individuals to perform daily and instrumental activities (Lyu and Zhang, 2022).
However, the relationship between socioeconomic progress, medical technology expansion, and healthcare improvements and actual health outcomes is not always straightforward (Riley, 2001). When focusing on the influence of economic development on health, there is an observable tension between its long-term advantages and potential short-term disadvantages. Historically, sustained economic prosperity tends to engender improvements in population health. However, in the short term, rapid economic growth has been associated with negative externalities such as environmental pollution and increasing socioeconomic inequality. These issues have the potential to adversely affect public health, leading to possible health crises (Shi and Hu, 2010; Wang et al. 2011; Wang, 2013). The detrimental health effects linked to lifestyle shifts that accompany urbanization—such as surges in tobacco and alcohol consumption—further compound these challenges, pointing to an erosion in health quality among the elderly (Wang, 2013; Zhou et al., 2019). Consequently, these unsynchronized shifts in mortality and health status have led to a deterioration in the proportion of life spent in good health when compared to overall life expectancy for the elderly.
This complexity is illustrated by the trends observed in China between 1998 and 2018, when the nation's GDP per capita increased 8.55-fold—from 6860 yuan to 65,534 yuan—alongside fluctuations in the elderly mortality rate and alternating periods of health improvement and decline. The results during this period based on data from CLHLS have identified a decline in health rates among the elderly, pinpointing this as a key contributor to the decrease in HLE. The decline in health among older adults has also been documented in other studies conducted in China (e.g. Du and Li, 2006; Liu et al., 2009; Tang et al., 2005). This underscores the necessity for holistic policies that promote not just economic growth but also sustainable environmental practices and equitable access to healthcare to ensure improvements in the population's overall health.
Although medical achievements have successfully lowered the death rates from certain diseases, this progress has not necessarily halted a broader decline in overall health. For instance, advancements in treating chronic diseases such as cardiovascular conditions have reduced mortality, meaning that more elderly individuals are now surviving such illnesses. However, the downside of this improvement in survival is that it has resulted in an increase in the number of elderly individuals who live longer but with compromised health and potentially with ongoing medical conditions that affect their quality of life (Zhang et al., 2012). In essence, while people may be living longer, they are not necessarily enjoying healthier lives in their extended years. Healthcare development, though primarily aimed at improving health outcomes, can sometimes have unintended negative consequences for people's health. In the 1990s, for instance, increased out-of-pocket healthcare expenses burdened individuals, especially in poorer regions, restricting their access to necessary healthcare services (Ramesh et al., 2014). China's healthcare reforms, which began in 2008, were still in their infancy between 2008 and 2011. Due to their being in a nascent stage, these reforms may not have been able to deliver immediate improvements in health outcomes. This transitional period was particularly difficult for older adults, who are inherently more vulnerable to diseases and additionally are more affected by economic shifts and healthcare system alterations. They faced a deterioration in health status during this time, reflecting the complex interplay between healthcare advancements and the actual well-being of the population, especially among the elderly.
By 2010, nearly universal health insurance coverage had been achieved through three social health insurance programs, i.e. Urban Employee Basic Medical Insurance, Urban Resident Basic Medical Insurance, and the New Cooperative Medical Scheme (Yip et al., 2012). However, while insurance can increase hospital admission rates (Zhou et al., 2017), it may simultaneously lead to more elderly people living with reduced functional abilities. The increased survival rate amongst the elderly, particularly in rural areas, may be contributing to poorer overall health status.
The observed decline in health rates among the elderly may be partially due to changes in the sample structure of CLHLS during the studied periods. Specifically, there was a decrease in the proportion of the rural elderly in the sample, which fell from 62.10% in 1998 to 53.98% in 2002, and from 60.29% in 2008 to 52.24% in 2011. This is noteworthy because the health status of rural elderly individuals has typically been better than that of their urban counterparts. For example, in 1998, 64.12% of the rural elderly were able to care for themselves, as compared to 60.76% of the urban elderly. This trend persisted in subsequent survey years. Thus, the reduced representation of rural elderly in the sample may have contributed to the reported decline in overall health rates, which in turn affects the calculation of HLE.
It is important to recognize the limitations of this study. The health rates of elderly individuals in China might be overestimated due to the nature of the CLHLS data, which is known for its high-quality information on age and health (Zeng, 2013; Zeng et al., 2004). However, because the survey primarily includes home-dwelling elderly and only a small proportion of those in nursing homes, excluding those in hospitals, it may not provide a fully accurate picture of the overall health status. Therefore, survey results could over-represent HLE.
Despite these limitations, the consistency of the results with data from both the National Population Census and CLHLS underscores progress in mortality decline and health improvements among China's older population over the past two decades. CLHLS offers an extensive 20-year data span with eight observations, enabling a more nuanced understanding of health status transitions among the elderly. While earlier studies provided a linear view of HLE trends, the CLHLS data complement the National Population Census data by elaborating on these trends and informing us of the shifts in the health levels of China's older population. The CLHLS and census data employ different indicators to evaluate health status. CLHLS utilizes the ADL measurement scale while the census uses self-rated overall health indicators. The ADL scale offers an objective look at health by evaluating an individual's ability to perform basic self-care tasks, thereby reflecting their practical or physical health. On the other hand, self-rated health indicators capture a subjective perspective by allowing individuals to assess and report their overall health based on their personal perceptions and feelings. By combining these objective and subjective indicators, the datasets offer a more comprehensive view of health status changes within the population. The inclusion of both ADL and self-rated health measures allows for a fuller understanding of health that encompasses both the functional capability and the self-perceived well-being of individuals. Moreover, our analysis sheds light on how changes in mortality and health rates impact HLE, offering insights into the drivers of these changes and guiding targeted health improvement strategies.
Footnotes
Acknowledgments
The authors would like to express their sincere gratitude to the anonymous reviewers for their valuable comments and suggestions, which have greatly contributed to the improvement of this manuscript. Their insightful feedback, constructive criticism, and dedicated efforts have been invaluable in refining the quality and clarity of our research.
Contributorship
Junhan Dong performed the data analysis, wrote and revised the article. Qiang Li initiated the study, supervised the data analysis, wrote and revised the article.
Declaration of conflicting interests
The authors declared no potential conflicts of interest with respect to the research, authorship, and/or publication of this article.
Funding
The authors disclosed receipt of the following financial support for the research, authorship, and/or publication of this article: This work was supported by The Key Program of the National Social Science Foundation of China (21&ZD186); the Ministry of Education of Humanities and Social Science Project of China (21YJA840010)
Appendix
The healthy life expectancy of the elderly, 1998–2018.
| Age | Year | Male | Female | ||||
|---|---|---|---|---|---|---|---|
| Ex | HLEx | HLEx/ex | Ex | HLEx | HLEx/ex | ||
| 65–69 | 1998 | 13.94 | / | / | 16.40 | / | / |
| 2000 | 14.17 | / | / | 16.48 | / | / | |
| 2002 | 14.39 | 13.11 | 91.13 | 17.19 | 15.01 | 87.31 | |
| 2005 | 14.64 | 13.60 | 92.93 | 17.54 | 15.92 | 90.77 | |
| 2008 | 14.88 | 14.12 | 94.95 | 17.85 | 16.64 | 93.25 | |
| 2011 | 15.18 | 13.77 | 90.67 | 18.25 | 16.10 | 88.21 | |
| 2014 | 15.45 | 13.92 | 90.12 | 18.65 | 16.39 | 87.87 | |
| 2018 | 15.79 | 14.66 | 92.86 | 19.31 | 17.32 | 89.71 | |
| 70–74 | 1998 | 10.82 | / | / | 12.82 | / | / |
| 2000 | 11.02 | / | / | 12.89 | / | / | |
| 2002 | 11.21 | 9.94 | 88.73 | 13.51 | 11.33 | 83.90 | |
| 2005 | 11.42 | 10.39 | 91.05 | 13.81 | 12.17 | 88.14 | |
| 2008 | 11.60 | 10.81 | 93.16 | 14.05 | 12.86 | 91.49 | |
| 2011 | 11.84 | 10.44 | 88.17 | 14.39 | 12.31 | 85.54 | |
| 2014 | 12.08 | 10.71 | 88.68 | 14.75 | 12.61 | 85.47 | |
| 2018 | 12.39 | 11.32 | 91.33 | 15.30 | 13.35 | 87.25 | |
| 75–79 | 1998 | 8.12 | / | / | 9.66 | / | / |
| 2000 | 8.30 | / | / | 9.71 | / | / | |
| 2002 | 8.47 | 7.15 | 84.39 | 10.24 | 8.13 | 79.35 | |
| 2005 | 8.65 | 7.65 | 88.41 | 10.49 | 8.85 | 84.30 | |
| 2008 | 8.81 | 8.00 | 90.83 | 10.70 | 9.58 | 89.57 | |
| 2011 | 8.99 | 7.69 | 85.59 | 10.96 | 8.97 | 81.89 | |
| 2014 | 9.16 | 7.78 | 84.95 | 11.24 | 9.19 | 81.80 | |
| 2018 | 9.40 | 8.34 | 88.70 | 11.70 | 9.76 | 83.43 | |
| 80–84 | 1998 | 5.83 | 4.91 | 84.11 | 6.96 | 5.44 | 78.13 |
| 2000 | 5.95 | 4.81 | 80.78 | 6.98 | 5.34 | 76.58 | |
| 2002 | 6.08 | 4.83 | 79.54 | 7.40 | 5.31 | 71.79 | |
| 2005 | 6.24 | 5.28 | 84.62 | 7.61 | 5.98 | 78.60 | |
| 2008 | 6.39 | 5.66 | 88.50 | 7.79 | 6.70 | 85.98 | |
| 2011 | 6.54 | 5.25 | 80.24 | 8.00 | 6.19 | 77.43 | |
| 2014 | 6.67 | 5.43 | 81.41 | 8.21 | 6.41 | 78.05 | |
| 2018 | 6.82 | 5.74 | 84.11 | 8.55 | 6.67 | 78.00 | |
| 85–89 | 1998 | 4.07 | 3.24 | 79.62 | 4.94 | 3.48 | 70.43 |
| 2000 | 4.14 | 3.10 | 74.79 | 4.91 | 3.37 | 68.66 | |
| 2002 | 4.21 | 3.13 | 74.34 | 5.21 | 3.31 | 63.43 | |
| 2005 | 4.31 | 3.41 | 79.09 | 5.34 | 3.81 | 71.30 | |
| 2008 | 4.42 | 3.78 | 85.52 | 5.47 | 4.34 | 79.25 | |
| 2011 | 4.56 | 3.40 | 74.59 | 5.65 | 3.96 | 70.05 | |
| 2014 | 4.67 | 3.58 | 76.62 | 5.83 | 4.18 | 71.71 | |
| 2018 | 4.79 | 3.71 | 77.52 | 6.08 | 4.24 | 69.76 | |
| 90–94 | 1998 | 2.70 | 1.91 | 70.49 | 3.45 | 2.02 | 58.66 |
| 2000 | 2.75 | 1.86 | 67.58 | 3.40 | 1.99 | 58.66 | |
| 2002 | 2.80 | 1.85 | 66.21 | 3.59 | 1.93 | 53.84 | |
| 2005 | 2.85 | 2.10 | 73.65 | 3.63 | 2.32 | 63.88 | |
| 2008 | 2.90 | 2.26 | 77.91 | 3.70 | 2.64 | 71.37 | |
| 2011 | 2.98 | 2.01 | 67.31 | 3.81 | 2.30 | 60.42 | |
| 2014 | 3.08 | 2.09 | 67.90 | 3.96 | 2.45 | 61.83 | |
| 2018 | 3.19 | 2.24 | 70.04 | 4.17 | 2.49 | 59.80 | |
| 95–99 | 1998 | 1.71 | 1.04 | 60.78 | 2.40 | 1.15 | 47.74 |
| 2000 | 1.73 | 1.09 | 62.80 | 2.35 | 1.13 | 48.30 | |
| 2002 | 1.76 | 1.01 | 57.51 | 2.46 | 1.16 | 47.22 | |
| 2005 | 1.79 | 1.15 | 63.93 | 2.46 | 1.28 | 52.08 | |
| 2008 | 1.80 | 1.21 | 67.41 | 2.48 | 1.54 | 62.01 | |
| 2011 | 1.83 | 1.05 | 57.36 | 2.54 | 1.30 | 50.99 | |
| 2014 | 1.89 | 1.03 | 54.33 | 2.64 | 1.33 | 50.45 | |
| 2018 | 1.99 | 1.02 | 51.08 | 2.80 | 1.23 | 43.73 | |
| 100 + | 1998 | 1.05 | 0.48 | 45.30 | 1.79 | 0.65 | 36.30 |
| 2000 | 1.06 | 0.52 | 48.70 | 1.74 | 0.70 | 40.20 | |
| 2002 | 1.07 | 0.48 | 44.50 | 1.80 | 0.65 | 36.10 | |
| 2005 | 1.09 | 0.58 | 53.20 | 1.78 | 0.75 | 42.40 | |
| 2008 | 1.08 | 0.56 | 51.40 | 1.78 | 0.83 | 46.40 | |
| 2011 | 1.08 | 0.52 | 47.90 | 1.81 | 0.71 | 39.10 | |
| 2014 | 1.10 | 0.57 | 51.90 | 1.88 | 0.81 | 42.90 | |
| 2018 | 1.18 | 0.49 | 42.00 | 1.99 | 0.69 | 34.80 | |
Data source: CLHLS, 1998–2018.
Note: In 1998–2000, the sample of CLHLS was the elderly aged 80 and over, and since 2002, the sample has been expanded to include people aged 65 and over.