
Abstract
Objective
Healthy life expectancy is conventionally calculated at the population level, with no standardized approach for estimating it for individuals. Despite the increasing availability of personal health records (PHRs), comprehensive personalized health indicators remain scarce. This study aimed to develop a framework for estimating personal healthy life expectancy using PHR data.
Methods
We used the combined dataset of the Comprehensive Survey of Living Conditions and the National Health and Nutrition Survey conducted for randomly sampled general population in Japan, 2019. From the merged dataset, 5552 respondents were included for the analysis. Machine learning models were constructed to predict activity limitation—a key determinant of healthy life expectancy—using age, sex, disease history, blood test results, and lifelog variables (blood pressure, body mass index, waist circumference, daily step counts, and sleep patterns). Subsequently, an equation was derived for estimating personal healthy life expectancy through a mathematical algorithm.
Results
The prediction model achieved an area under the receiver operating characteristic curve of 0.84. Personal healthy life expectancy was estimated using a derived equation in which an individual's probability of having no activity limitation, relative to their age group average, was scaled by the population-level healthy life expectancy.
Conclusion
We developed a novel framework for estimating personal healthy life expectancy from PHR data, incorporating both lifelog data and blood biomarkers, by machine-learning and mathematical approach. The application of this individualized health metric may advance personalized medicine, preventive health strategies, and tailored health guidance, while serving as a behavioral nudge to promote healthier lifestyles. It should be noted, however, that because the framework is derived from cross-sectional data, it does not estimate when future activity limitations may occur.
Keywords
Introduction
As societies worldwide continue to face rapid population aging, healthy life expectancy—often referred to as healthy life years—has received increasing attention. This metric reflects the expected duration during which individuals can engage in daily activities without restrictions imposed by health-related conditions. Numerous studies have demonstrated that lifestyle-related diseases impact healthy life expectancy.1–3 Recent studies using a machine learning approach have highlighted several major determinants that exert a substantial influence on this indicator, including advanced age, psychiatric conditions such as depression, musculoskeletal impairments, neurological disorders, and a range of chronic illnesses. 4 Strategies aimed at maintaining and improving health, as well as extending healthy life expectancy, emphasize the importance of increasing daily physical activity, maintaining a balanced diet, participating in social activity, and preserving mental well-being.5–8 In Japan as well as many Western nations, nationwide surveys are employed to estimate healthy life expectancy, typically based on measures such as limitations in daily functioning or self-assessed health status.9–12 This indicator is typically calculated at the population level—whether for an entire nation or a specific region—and, to date, no standardized framework has been established for determining an individual-level healthy life expectancy.
Personal Health Records (PHRs), including their electronic counterparts (ePHRs), have garnered increasing attention as comprehensive repositories of individual health information. These systems encompass a wide range of data, including medical history, clinical test results, and lifestyle-related metrics such as lifelogs derived from wearable devices and self-reported inputs. In recent years, the utilization of PHRs has been anticipated to facilitate the development of innovative healthcare solutions addressing various challenges in the health and medical domains. Previous studies have reported associations between the use of electronic personal health information (ePHI) technologies and obesity-preventive behaviors, such as engagement in physical activity and dietary management. 13 Other evidence suggests that increased utilization of ePHI technologies may promote cancer screening behaviors, potentially mediated by cancer-related worry. 14 Moreover, the potential benefits of ePHR use on clinical outcomes among patients with cardiovascular disease have also been documented.15,16 Collectively, these findings imply that leveraging ePHRs to support health-related behavior change—including increasing physical activity, improving dietary regulation, reducing harmful lifestyle behaviors, and enhancing therapeutic adherence—may contribute to the prevention of the onset and progression of disease.
While numerous PHR applications have predominantly focused on condition-specific outcomes—such as real-time disease risk assessment, provision of medical information, facilitation of communication with healthcare providers, and tailored preventive interventions—these approaches, although valuable, fall short of capturing an individual's overall health status. This underscores the need for holistic, integrative health metrics that reflect the multidimensional nature of health and functional capacity. Despite the increasing availability of ePHR data, research aimed at leveraging these resources to derive such comprehensive indicators remains scarce. Furthermore, there is currently no standardized methodology for estimating an individual-level healthy life expectancy using PHR data that integrate lifelog parameters (e.g., blood pressure, physical activity, sleep patterns) with laboratory test results. Establishing such a method could enable precise, personalized health monitoring and inform proactive prevention strategies. The present study addresses this gap by developing a novel approach for estimating personal healthy life expectancy using PHR data.
Methods
The Comprehensive Survey of Living Conditions (CSLC) is a nationwide cross-sectional survey conducted every 3 years by the Japanese Ministry of Health, Labour and Welfare (MHLW) to assess key aspects of the population's well-being, including health, medical care, welfare, pensions, and income. 9 The health questionnaire within the CSLC collects information on subjective symptoms, health-related limitations in daily life, ongoing treatment for diseases or injuries, self-rated health, concerns and stress levels, mental status, and participation in health check-ups. The National Health and Nutrition Survey (NHNS), another cross-sectional survey administered by the MHLW, draws a random sample from CSLC respondents to provide a detailed evaluation of physical condition, dietary intake, and lifestyle habits. 17 Both surveys were conducted among randomly selected members of the general population via face-to-face interviews, with the NHNS additionally incorporating an online questionnaire for physical condition and lifestyle items. The data were accessed for research purposes between 1/10/2023 and 11/8/2025.
Data from the CSLC and NHNS were linked through shared identifiers for prefecture, region, survey unit, household, and household member. From the merged 2019 dataset, information from 5552 respondents was used for analysis. Descriptive statistics were generated using R version 4.2.0, 18 and machine-learning models were deployed in Python 3.10.6. The prediction target was the presence or absence of activity limitations, which were evaluated using responses to the questions, “Do you have any health problem which limits your daily activity?”. The datasets were randomly split into training (80%) and test subsets (20%), and five-fold cross validation was performed to determine the best hyperparameter values. Features were selected a priori based on baseline demographic factors, including age and sex, as well as predefined medical conditions documented in our previous report. 4 These baseline features were then combined with 18 blood biomarkers and seven lifelog variables to construct the final feature set used for model development. Blood test data and lifelog data with missing values were imputed using a single imputation approach, applying the median for continuous variables and the most frequent value for categorical variables.
Results
Prediction model for activity limitations using personal health records
We used a linked dataset combining data from the CSLC and the NHNS in Japan (n = 5552). The prediction target was the presence of activity limitations. As baseline predictors, we included age, sex, and the presence of 41 medical conditions (Table 1). Additionally, we incorporated 18 blood biomarkers—white blood cell count, red blood cell count, hemoglobin, hematocrit, platelet count, blood glucose, HbA1c, total cholesterol, HDL cholesterol, LDL cholesterol, triglycerides, total protein, albumin, creatinine, AST, ALT, γ-GT, and uric acid—and seven lifelog variables: body mass index (BMI), waist circumference, systolic blood pressure, diastolic blood pressure, daily step counts, sleep duration, and sleep quality. In the group with activity limitations, the characteristics included older age, a higher prevalence of most diseases, elevated systolic blood pressure, fewer daily steps, a greater proportion of both short- and long-duration sleepers, and a higher prevalence of individuals dissatisfied with their sleep quality.
Participant characteristics.

Categorical values are represented as numbers along with percentages, and numerical values are represented as means with standard deviations.
To compare predictive performance, we employed three machine learning models: extreme gradient boosting (XGB), random forest (RF), and multilayer perceptron (MLP). XGB achieved the highest area under the receiver operating characteristic curve (AUROC) of 0.84 when using base + blood test data + lifelog data. RF achieved the highest AUROC of 0.84 with base + lifelog data. MLP achieved the highest AUROC of 0.83 with base + blood test data. Given that XGB consistently demonstrated high accuracy regardless of the combination of predictors, it was selected as the primary model (Figure 1). The model tuning method was described in Supplementary Method. The mean AUROC of the nested cross validation was 0.83 ± 0.01.

Model performance. Model performance was compared using the area under the receiver operating characteristic curve (AUROC) for each combination of predictors (baseline, blood data, and life log data) across the different models. XGB, extreme gradient boosting; RF, random forest; MLP, multilayer perceptron.
Predicted probabilities were plotted according to the model target and representative features (Supplementary Figures 1 and 2). Age-stratified analyses demonstrated lower but comparable predictive performance in younger individuals aged ≤64 years (n = 3515) and older individuals aged ≥65 years (n = 2037), with an AUROC of 0.76 in both groups (Supplementary Figure 3). This reduction in AUC is likely attributable to smaller sample sizes within each subgroup and the attenuation of age-related predictive information following age stratification.

Healthy life expectancy curve. Healthy life expectancy is calculated by summing the number of healthy individuals across all age groups and dividing by the reference population size. N is the reference population size, m is the number of age group j.
Equation for calculating personal healthy life expectancy
When individuals with activity limitations are classified as ‘unhealthy population’ and those without as ‘healthy population,’ healthy life expectancy (HLE) is calculated by summing the number of healthy individuals across all age groups and dividing by the reference population size N (Figure 2).
The probability of not having activity limitations (denoted as 
Using this probability p, both population-level and individual-level HLE can be calculated according to the following procedure.
First, the proportion of individuals without activity limitations in a given age group—denoted as the “rate of having no activity limitations"—is obtained by averaging the individual probabilities within the group:
Here, n denotes the number of individuals in the age group,
Next, population-level HLE (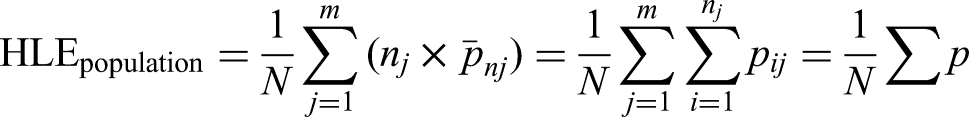
Here, N is the reference population size, m is the number of age groups,
Thus, population-level HLE can be defined as the sum of all individual probabilities of not having activity limitations divided by N.
On the other hand, if the expected duration from the reference age until an individual loses their healthy status is defined as personal healthy life expectancy (
Furthermore, we define the contribution 
We assume that the contribution 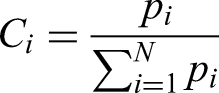
Under this assumption, the formula for population-level HLE can be reformulated as:
Rearranging this expression gives the formula for personal HLE:
In other words, personal healthy life expectancy can be estimated as the ratio of the individual's probability of not having activity limitations to the average probability within their age group, scaled by the population-level healthy life expectancy.
Discussion
In the present study, we developed a machine learning model to predict the presence or absence of activity limitations using PHR data, including both lifelog and blood test information, and subsequently derived an equation for estimating personal healthy life expectancy through a mathematical algorithm. Although healthy life expectancy has traditionally been a metric applied to populations, such as countries or regions, this approach enables its estimation at the individual level based on PHRs. An overview of the estimation method is presented in Figure 3. The proposed technology has potential applications in personalized medicine, disease prevention, health examinations, and health guidance (Supplementary Figure 4). Furthermore, providing individuals with their estimated healthy life expectancy may serve as a behavioral nudge for those indifferent to their health, potentially increasing health awareness and encouraging positive lifestyle changes.

Overview of estimating methods for personal healthy life expectancy. Machine learning model predicts activity limitations using personal health records including blood test data and lifelog data. In the derived equation, personal healthy life expectancy could be estimated as the ratio of the individual's probability of not having activity limitations to the average probability within their age group, scaled by the population-level healthy life expectancy. HLE, healthy life expectancy. p is the probability that individual i does not have activity limitations, and
In our previous study, we developed a model to predict the presence or absence of activity limitations using age, sex, and 40 disease categories as predictors. 4 In the present study, we demonstrated that adding PHR variables—specifically lifelog and blood test data—to the existing model improved its predictive accuracy. Data acquisition can also be integrated with wearable devices, such as smartwatches, and medical or health examination databases. The framework may be extended to incorporate omics data, such as genomic and proteomic information, enabling more sophisticated personalized medicine.
In this study, variable scaling was not performed because our final selected model was XGBoost, a tree-based ensemble method that is inherently insensitive to feature scaling. Although this approach preserved interpretability and practical transparency by maintaining original measurement units (e.g., laboratory values and daily activity metrics), it may have disadvantaged scale-sensitive models such as MLP. Therefore, the comparative performance of neural network models should be interpreted with caution. In addition, the magnitude of performance improvement across different variable combinations was modest, and these differences should also be interpreted cautiously.
The potential associations between PHR utilization and subsequent behavior change and clinical outcomes have been widely noted in the literature.13–16 Nonetheless, findings from intervention-based randomized trials frequently suggest that the effect of PHR use on modifying health behaviors is modest, with evidence yielding mixed conclusions.19–22 A few studies have implemented interventions in which PHR use was combined with health coaching and user training, implying that such supportive measures may be crucial for maximizing the benefits of PHR systems.23,24 Although ePHRs offer considerable promise for enhancing health management among older adults—by improving access to medical information and promoting communication with healthcare providers—their adoption in this population remains low.25,26 In addition to ageing, there are several barriers to ePHR use, such as health literacy, sociodemographic and health care–related factors.27,28 A future research agenda is to determine how the “personal healthy life expectancy” metric and its application tool, developed in this study, can be leveraged to promote behavior change that enhances people's health.
The population-level healthy life expectancy used for this study is derived from Japan-specific epidemiological data, which may limit direct transferability to other countries—particularly those with shorter healthy life expectancies and different lifestyle. However, the proposed framework itself is structurally generalizable by using country-specific population healthy life expectancy. The estimating algorithm includes an assumption that the contribution, defined as the proportion of an individual's probability of not having activity limitations relative to the total probability in age group is constant across all age groups for a given individual. Accordingly, the estimated personal healthy life expectancy should be interpreted as a cross-sectional, relative indicator anchored to population-level healthy life expectancy, rather than as a deterministic or physiological prediction of individual future healthy life expectancy. Importantly, the current model does not predict the timing or onset of future activity limitations. Estimating how far in advance such limitations may occur would require longitudinal data and prospective validation. The framework is intended for individual-level estimation of healthy life expectancy rather than etiological inference, and included predictors should not be interpreted as causal or directly modifiable factors.
Conclusion
We presented a novel method to estimate personal healthy life expectancy using PHR data, including lifelog and blood test data, through machine-learning and mathematical approach. The application technology of personal healthy life expectancy can support personalized medicine, disease prevention, and health guidance, while potentially motivating healthier behaviors. It should be noted, however, that because the framework is derived from cross-sectional data, it does not estimate when future activity limitations may occur.
Supplemental Material
sj-pdf-1-dhj-10.1177_20552076261436862 - Supplemental material for An integrative framework for estimating personal healthy life expectancy from personal health records
Supplemental material, sj-pdf-1-dhj-10.1177_20552076261436862 for An integrative framework for estimating personal healthy life expectancy from personal health records by Masahiro Nishi, Reo Nagamitsu, Satomi Morita, Mai Imanaka and Satoaki Matoba in DIGITAL HEALTH
Supplemental Material
sj-docx-2-dhj-10.1177_20552076261436862 - Supplemental material for An integrative framework for estimating personal healthy life expectancy from personal health records
Supplemental material, sj-docx-2-dhj-10.1177_20552076261436862 for An integrative framework for estimating personal healthy life expectancy from personal health records by Masahiro Nishi, Reo Nagamitsu, Satomi Morita, Mai Imanaka and Satoaki Matoba in DIGITAL HEALTH
Footnotes
Acknowledgments
The authors have no acknowledgments to disclose.
Ethical considerations
The study protocol was approved by the Ethics Committee of Kyoto Prefectural University of Medicine (Approval No. ERB-C-2878) and adhered to the principles of the Declaration of Helsinki.
Consent to participate
As the study utilized pre-existing national survey data, the requirement for informed consent from participants was waived by the ethics committee.
Author contribution
MN initiated and designed the overall study framework. MN, RN, SM had full and independent access to all data used in the analysis and were jointly responsible for ensuring the reliability and accuracy of the results. All authors were involved in the writing and revision process and approved the final version of the manuscript. The submission for publication was a unanimous decision among all contributors.
Funding
The authors disclosed receipt of the following financial support for the research, authorship, and/or publication of this article: This research was financially supported by the Foundation for Total Health Promotion, and Japan Agency for Medical Research and Development (JP25ek0210219h0001).
Declaration of conflicting interests
The authors declared no potential conflicts of interest with respect to the research, authorship, and/or publication of this article.
Data availability statements
Supplemental material
Supplemental material for this article is available online.