
Abstract
China's recent fertility data collected from the 2020 population census and 2017 fertility survey have considerably improved in quality. Based on these, we can assess the levels and patterns of fertility with high confidence. We reconstruct China's fertility history from 1990 using these two types of data and review the trends and characteristics of fertility transitions and changing fertility patterns in China. Over the past half century, China has experienced an extraordinary fertility transition and decline, which can be described as three stepwise downward jumps in fertility that occurred in the 1970s, 1990s, and 2010s. While the tempo effect has always depressed fertility, the quantum effect became positive in the most recent fertility decline, when China made successive adjustments to its fertility policy. Age, parity, and interval patterns of fertility in China have also undergone fundamental changes influenced by changing fertility policies and rapidly expanding higher education. The recent rapid decline in fertility is driven by the increasing postponement of marriage, a large reduction in fertility for lower education groups, and a rising proportion of younger women accessing higher education.
Keywords
Introduction
China's fertility transition is one of the most significant events in human history. It also deviates from the predictions of classical demographic transition theory. It occurred in the world's most populous developing country under very low levels of economic development and modernization, but at a much faster pace than any previous demographic transition in comparable countries. Compared with other low-fertility countries, China's fertility transformation shows unique characteristics while otherwise following the broad pattern found worldwide. This is directly related to China's family planning policies. Despite countless studies on fertility in China, there have been no systematic examinations of the patterns and characteristics of China's fertility over the past seven decades in general, or in the last decade in particular. Using data from China's population censuses and fertility surveys, this study reviews the trends and characteristics of fertility transition and changing fertility patterns in China.
Recent fertility data in China
China's fertility data derive from population censuses and fertility surveys. Censuses can obtain period fertility rates for the census year and cohort fertility rates for women of different ages. Fertility surveys collect data on women's reproductive histories, which can be used to construct period fertility rates for many years prior to the survey and cohort fertility rates for women of different ages. China's population censuses and fertility surveys in the 1980s and 1990s are generally considered to be of high quality (Coale, 1989). After the early 1990s, the quality of data declined, although recently, the quality of fertility surveys and censuses has improved substantially. The fertility level for the nearly 30 years between the 1990 and the 2020 censuses in China has been subject to debate as scholars disagree on the fertility levels obtained from the 2000 and 2010 censuses, generating much research and debate on understanding and estimating China's low level of fertility (Chen and Yang, 2014; Zhai et al., 2015). China's seventh population census in 2020 achieved very high data quality owing to a series of institutional arrangements and technical measures (Li et al., 2021; Zhai et al., 2022). Thus, in the case of minimal international migration, we can use the age distribution of the population from the 2020 census to extrapolate the annual number of births since 1990 and, based on this estimate, the fertility rate for the three decades.
After the completion of the seventh (2020) census, the National Bureau of Statistics randomly selected 32,000 households in 141 counties in 31 provinces for post-enumeration quality checks. The rate of underreporting was only 0.05%, which was the lowest compared with that of previous censuses (Li et al., 2021; Wang and Hu, 2022). Why was the quality of data from the seventh census high? First, the census adopted comprehensive electronic data collection, which can greatly reduce registration and data entry errors. Second, a real-time reporting system was adopted, which means that all data were directly collected in real time by the central government without going through the local aggregation process, and even the local authorities were not able to directly affect local data collection, thus enabling unified quality control. Third, adding resident ID card information largely eliminated the problem of double counting. Finally, the outbreak of COVID-19, beginning in late January 2020, and subsequent community prevention and control measures made communities more fully and accurately aware of their internal population situations.
The National Bureau of Statistics used data from the seventh census to adjust the crude birth rate, crude death rate, and natural growth rate for 2011–2019. The number of births in these years can be easily estimated based on the adjusted birth rates. However, the National Bureau of Statistics did not adjust the birth rate for earlier years, resulting in a sudden increase in the number of births from 2010 to 2011, which is clearly unreasonable. Table 1 shows the total population, birth rate, number of births, and total fertility rate (TFR) before and after adjustment, as published by the National Bureau of Statistics. The adjusted number of births is 10.03 million more than the original number of births over 2011–2019, and these extra births occurred from 2011 to 2017. Consequently, fertility rates increased considerably. When comparing this with the results of the population sample surveys, it indicates serious underreporting of fertility in the population sample surveys, which is in line with the results of the 2017 fertility survey.
China's total population, crude birth rate, number of births, and total fertility rate, 2011–2020.
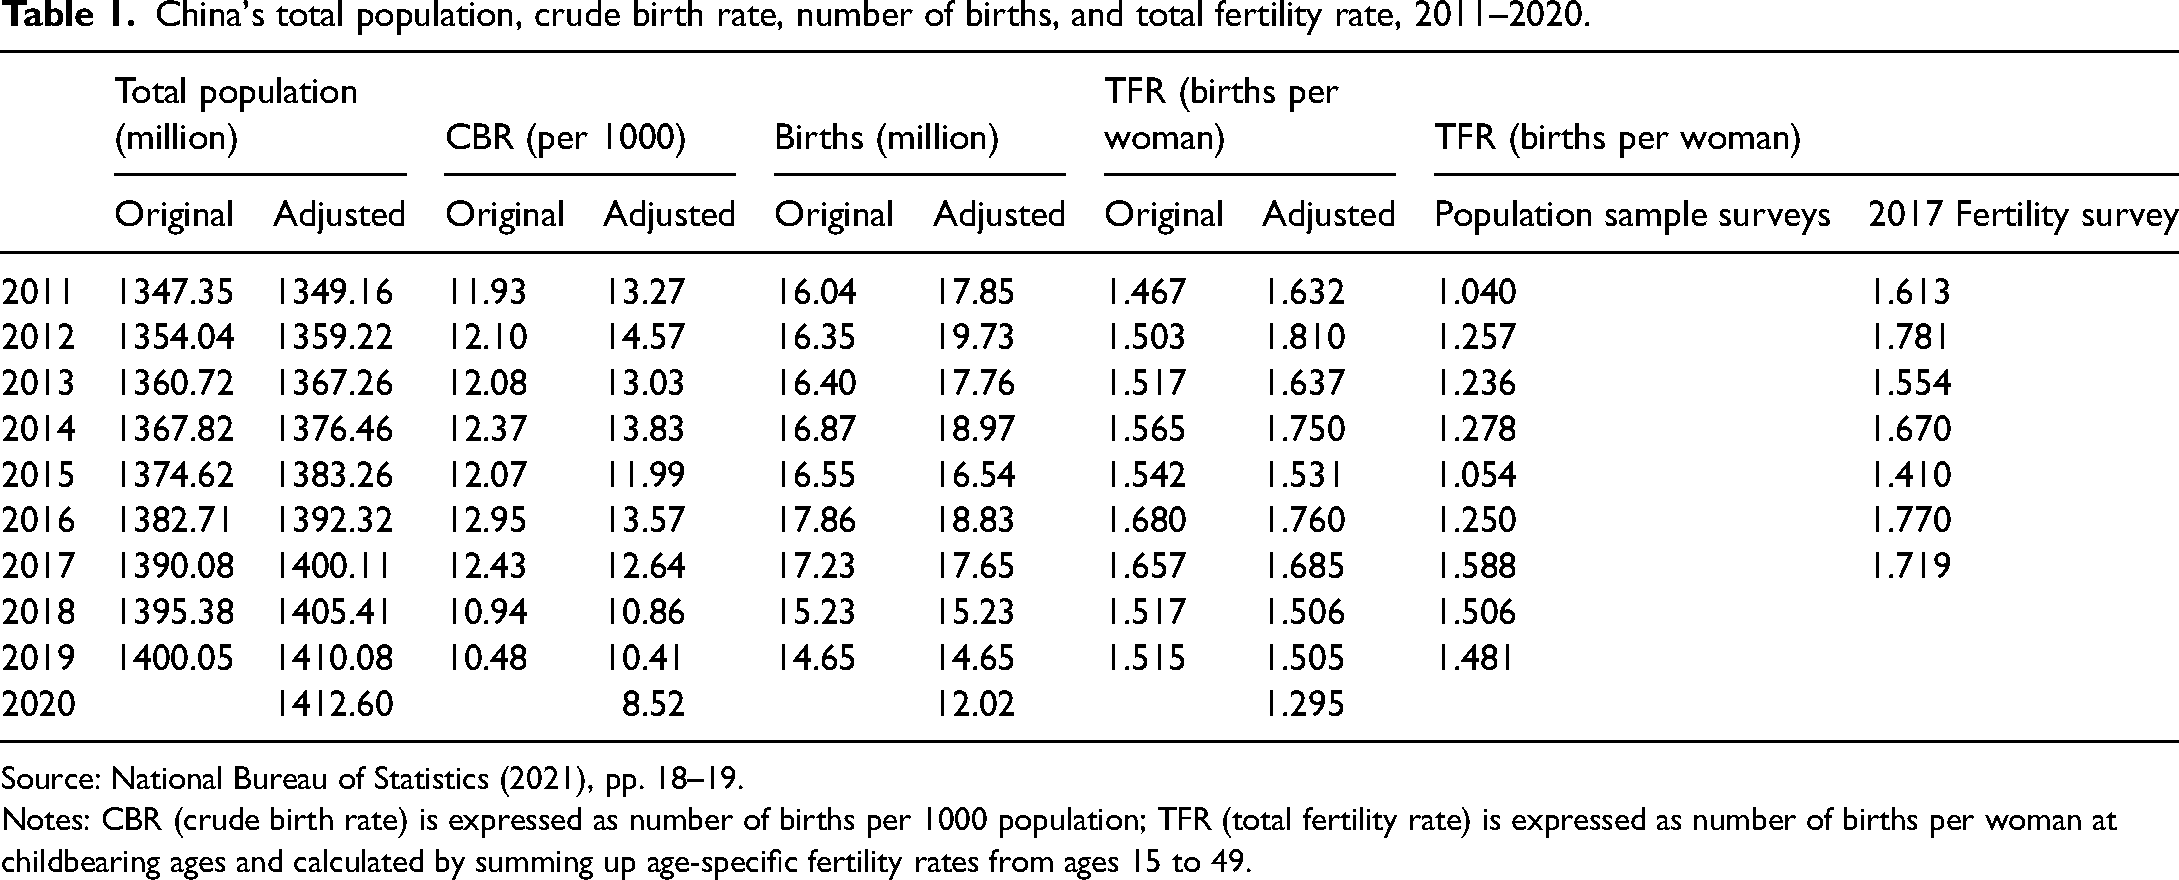
Source: National Bureau of Statistics (2021), pp. 18–19.
Notes: CBR (crude birth rate) is expressed as number of births per 1000 population; TFR (total fertility rate) is expressed as number of births per woman at childbearing ages and calculated by summing up age-specific fertility rates from ages 15 to 49.
We can calculate the number of births and fertility rates in earlier years using population age data from the seventh census. Here, the birth numbers and fertility rates since 1990 are calculated using the population aged 0–30 from the seventh census. Ignoring international migration, we can use life-table survival ratios to reverse the survival of the population aged 0–30 in 2020 to the births in the years 1990–2020. The denominator required for calculating the fertility rate, namely the female population of childbearing age, is calculated using the female population aged 15–59 from the fifth (2000), sixth (2010), and seventh censuses. Subsequently, the birth numbers over the years are broken down by women's age at the time of childbirth, and the age distribution of births obtained from population censuses and population sample surveys is used to calculate the age-specific fertility rates and TFRs. 1
China conducted its seventh national fertility survey in 2017. The survey has a large sample of 249,946 women aged 15–60. The age range of the sample was designed to fully reflect the changes in China's fertility rate over the past 10 years. A comparison between the results of the telephone follow-up interview and survey results showed that the consistency in the number of children was 98.9%, indicating that the birth information obtained from the survey was highly accurate. Thus, we also used the 2017 fertility survey to extrapolate fertility rates since 1990. Figure 1 shows China's TFR from 1990 to 2020.
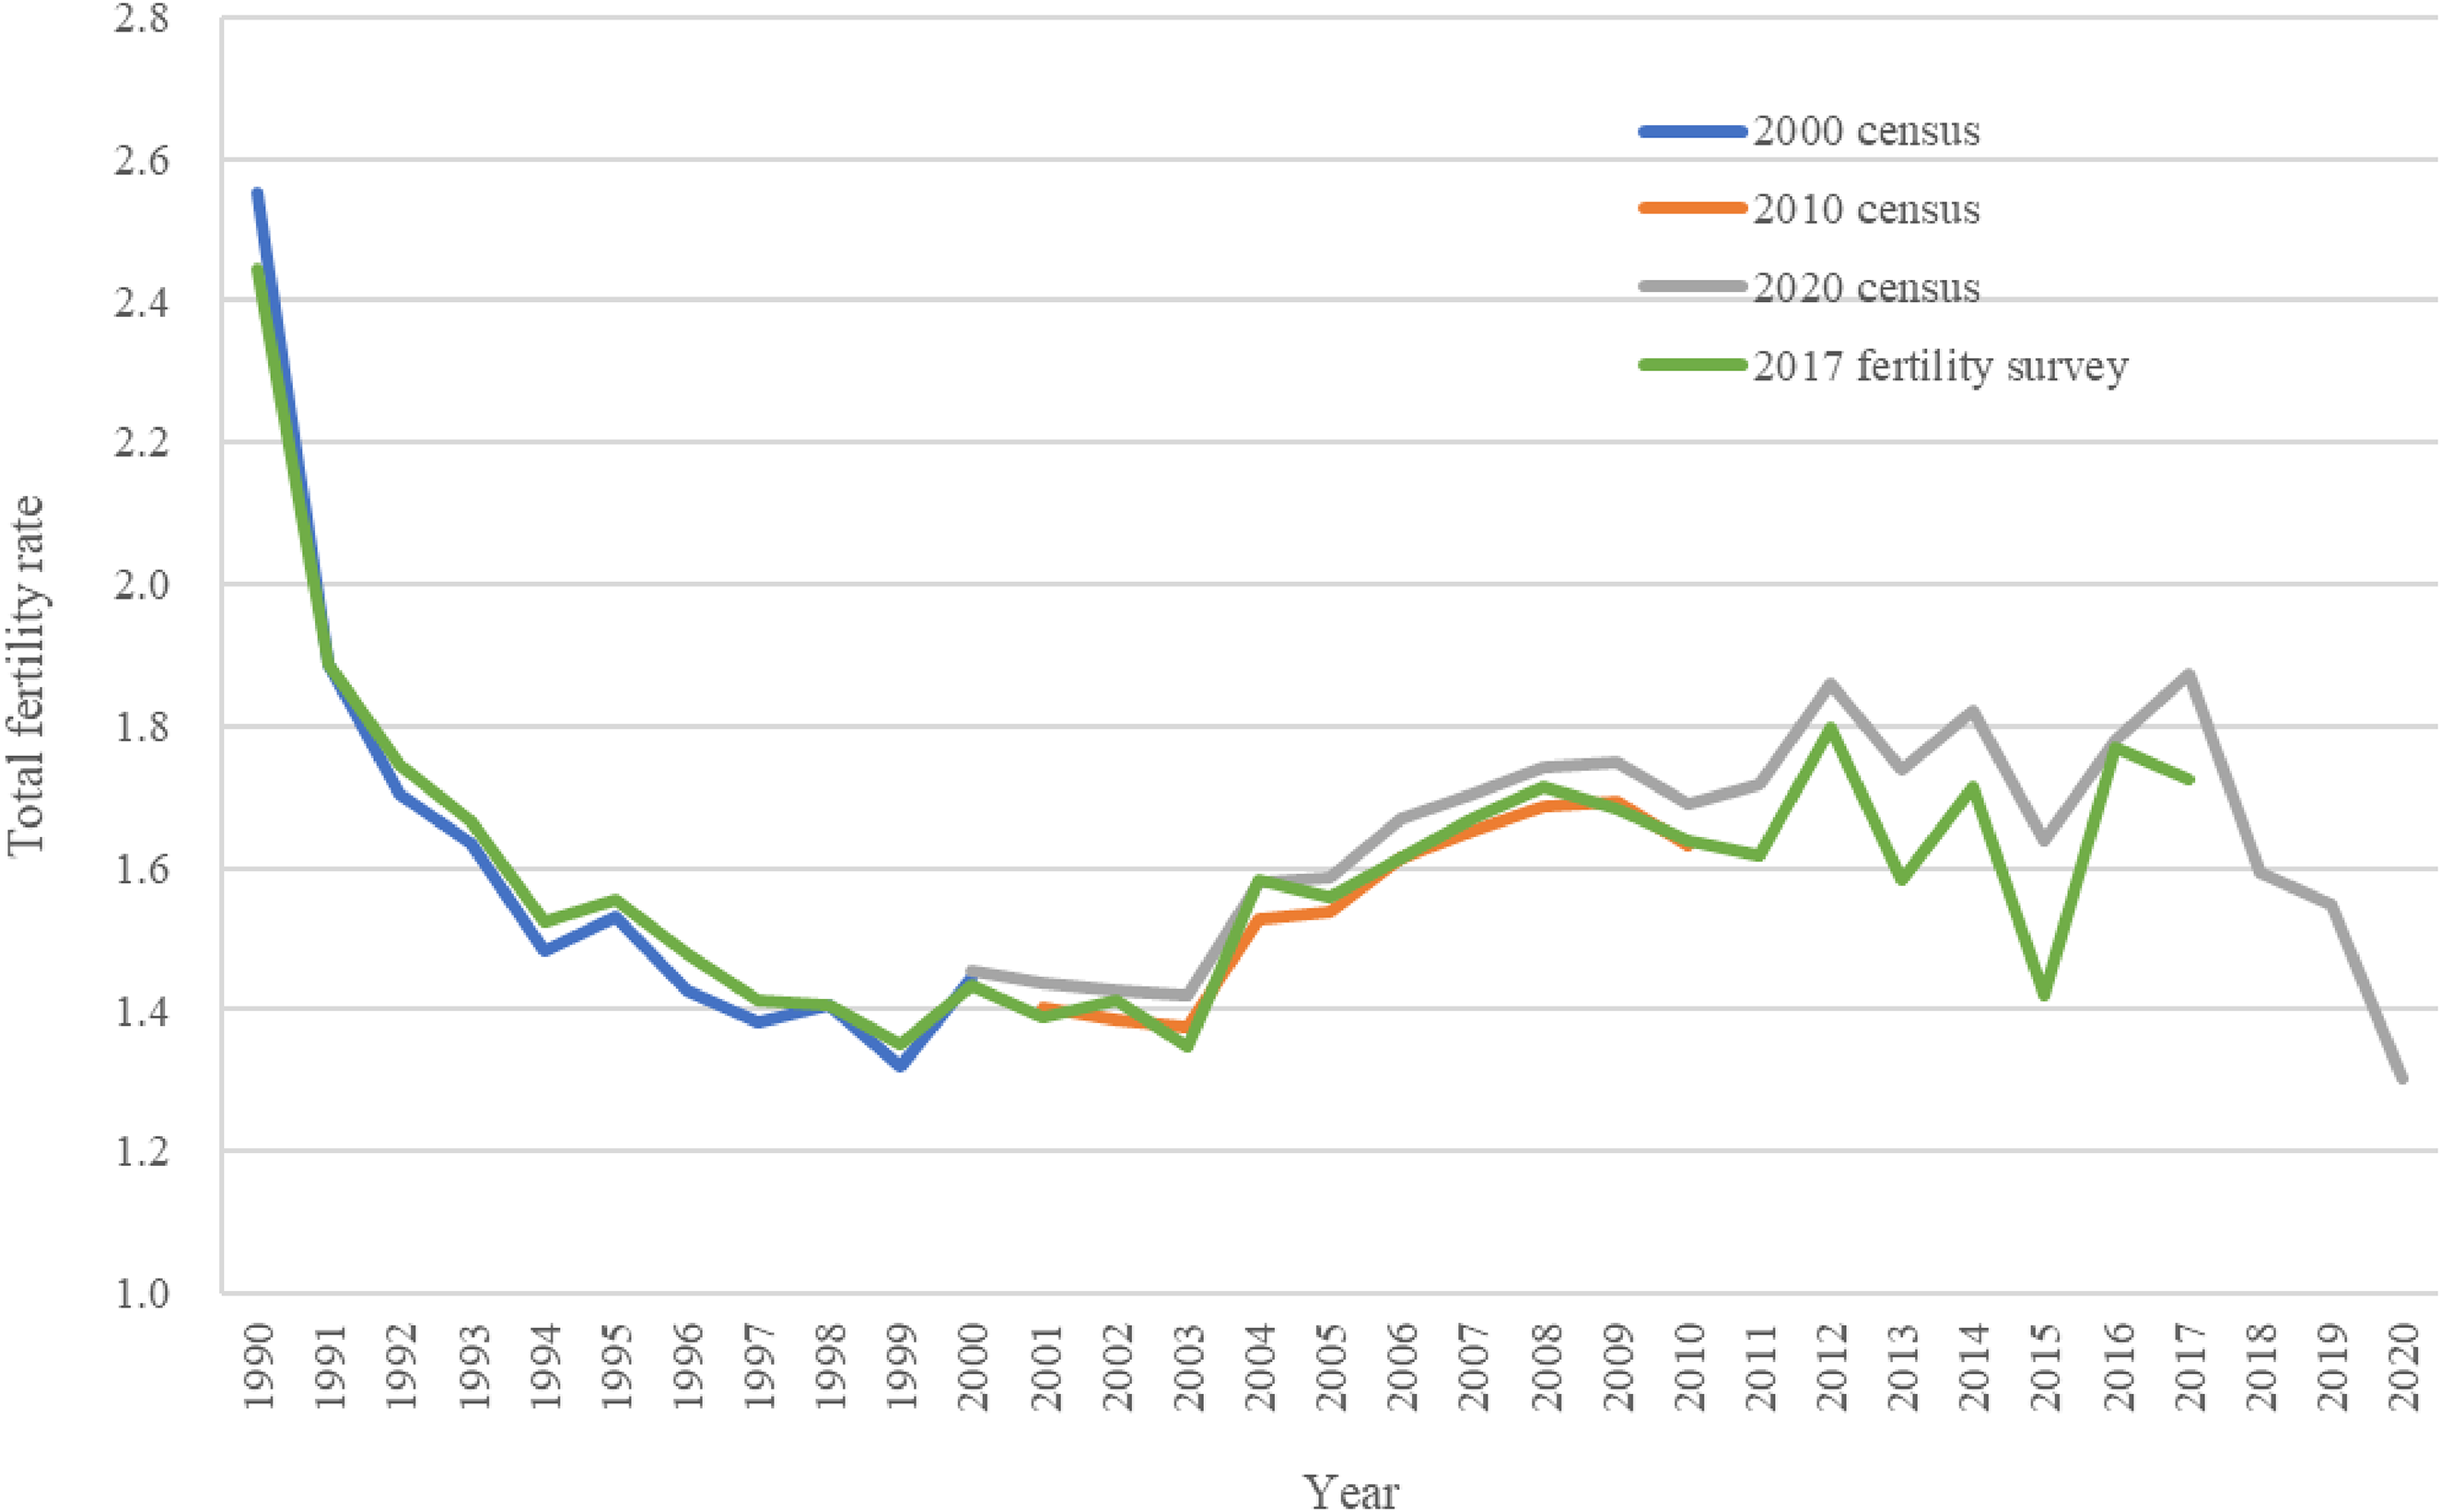
China's total fertility rate: 1990–2020. Source: 2017 fertility survey, and the 2000, 2010, and 2020 censuses.
Figure 1 shows that the fertility rates derived from the seventh census and the 2017 fertility survey are highly consistent. In the later period, the fertility rates estimated from the seventh census are higher than those estimated from the 2017 fertility survey. The estimated TFRs in 2000 and 2010 are much higher than the original fertility rates obtained from the censuses. For example, the 2010 census yielded a TFR of only 1.18; however, the estimated level in Figure 1 is 1.68. Remarkably, an evaluation of 2010 fertility using an indirect method based on period and cohort fertility data from the 2010 census suggests a rather similar level of fertility (a TFR of 1.66) (Chen and Yang, 2014).
China's fertility transition and structural shifts in fertility
As early as the late 1970s, China's TFR began to approach the replacement level. 2 After a decade of fluctuation in the 1980s, it began to fall below the replacement level in 1991 and continued to decline rapidly to a very low level of below 1.5 at the end of the 1990s. After entering the twenty-first century, due to the cyclical impact of population development, as well as the abolition of mandatory between-birth intervals, especially the multiple adjustments to the family planning policy after 2013, China's low TFR gradually increased, exceeding 1.8 in 2012, 2014, and 2016. However, in recent years, China's TFR has undergone another sharp decline, falling to only 1.3 in 2020. Furthermore, according to estimates of births in 2021 and 2022 published by the National Bureau of Statistics, the TFR has fallen to an even lower level in the past few years.
As there is a vast amount of research on fertility transition in China, the trends and characteristics of China's fertility transition are not examined in detail here. To summarize, China's fertility transformation since the 1970s can be described as three fertility transitions, or three stepwise downward jumps in fertility: fertility falling to close to the replacement level in the 1970s, fertility further dropping far below the replacement level in the 1990s, and fertility declining to below the ultra-low level of 1.3 in recent years. In the past 50 years, China's fertility rate has dropped in three steps, from a very high fertility rate of approximately 6 births per woman to a very low rate of below 1.3. In the process of China's fertility transformation and the evolution of low fertility, family planning policy played a leading role, although its impact has been declining, while the impact of economic and social development has been increasing and has become the decisive factor. Simultaneously, the stepwise downward jumps in fertility are also the embodiment of the cyclical nature of population reproduction. The dramatic decline in fertility in China in recent years is similar to the reduction in the 1990s. Without the two-child policy, this decline would have occurred much earlier.
The overall change in fertility is inevitably accompanied by structural shifts in fertility because fertility transitions or declines do not occur simultaneously in different population groups. The rapid decline in China's fertility in the 1970s first manifested in the decline in the birth rate at higher parities, also known as the multiple birth rate. Figure 2 shows that the declining multiple birth rate (that is, the birth rate for three children and beyond) was the main feature of fertility reduction in the 1970s. The TFR for a third child and beyond fell from more than 4 to fewer than 1 during this time. Simultaneously, under the influence of the trend toward later marriage and childbirth, first- and second-child fertility rates also declined by varying degrees. The different changes in fertility by parity during this period were mainly influenced by fertility policies. The fertility policy of the 1970s allowed each family to have two (and in some cases three) children, and focused on limiting three children and beyond. The timing and spacing of lower parity births, that is, first and second births, were controlled. Affected by the fertility policy during this period, there was a huge decline in the number of births at parities of three or more, with corresponding delays in the birth of first and second children. Accordingly, the decline in first- and second-child fertility rates was largely associated with the delay in the age at the first and second births in this period, rather than a real reduction in the first- and second-child fertility level. Although fertility rates in the 1970s and 1980s were significantly different for multiple births, the first- and second-child fertility rates increased and fluctuated significantly in the 1980s, and the first-child fertility rate at many times exceeded 1.
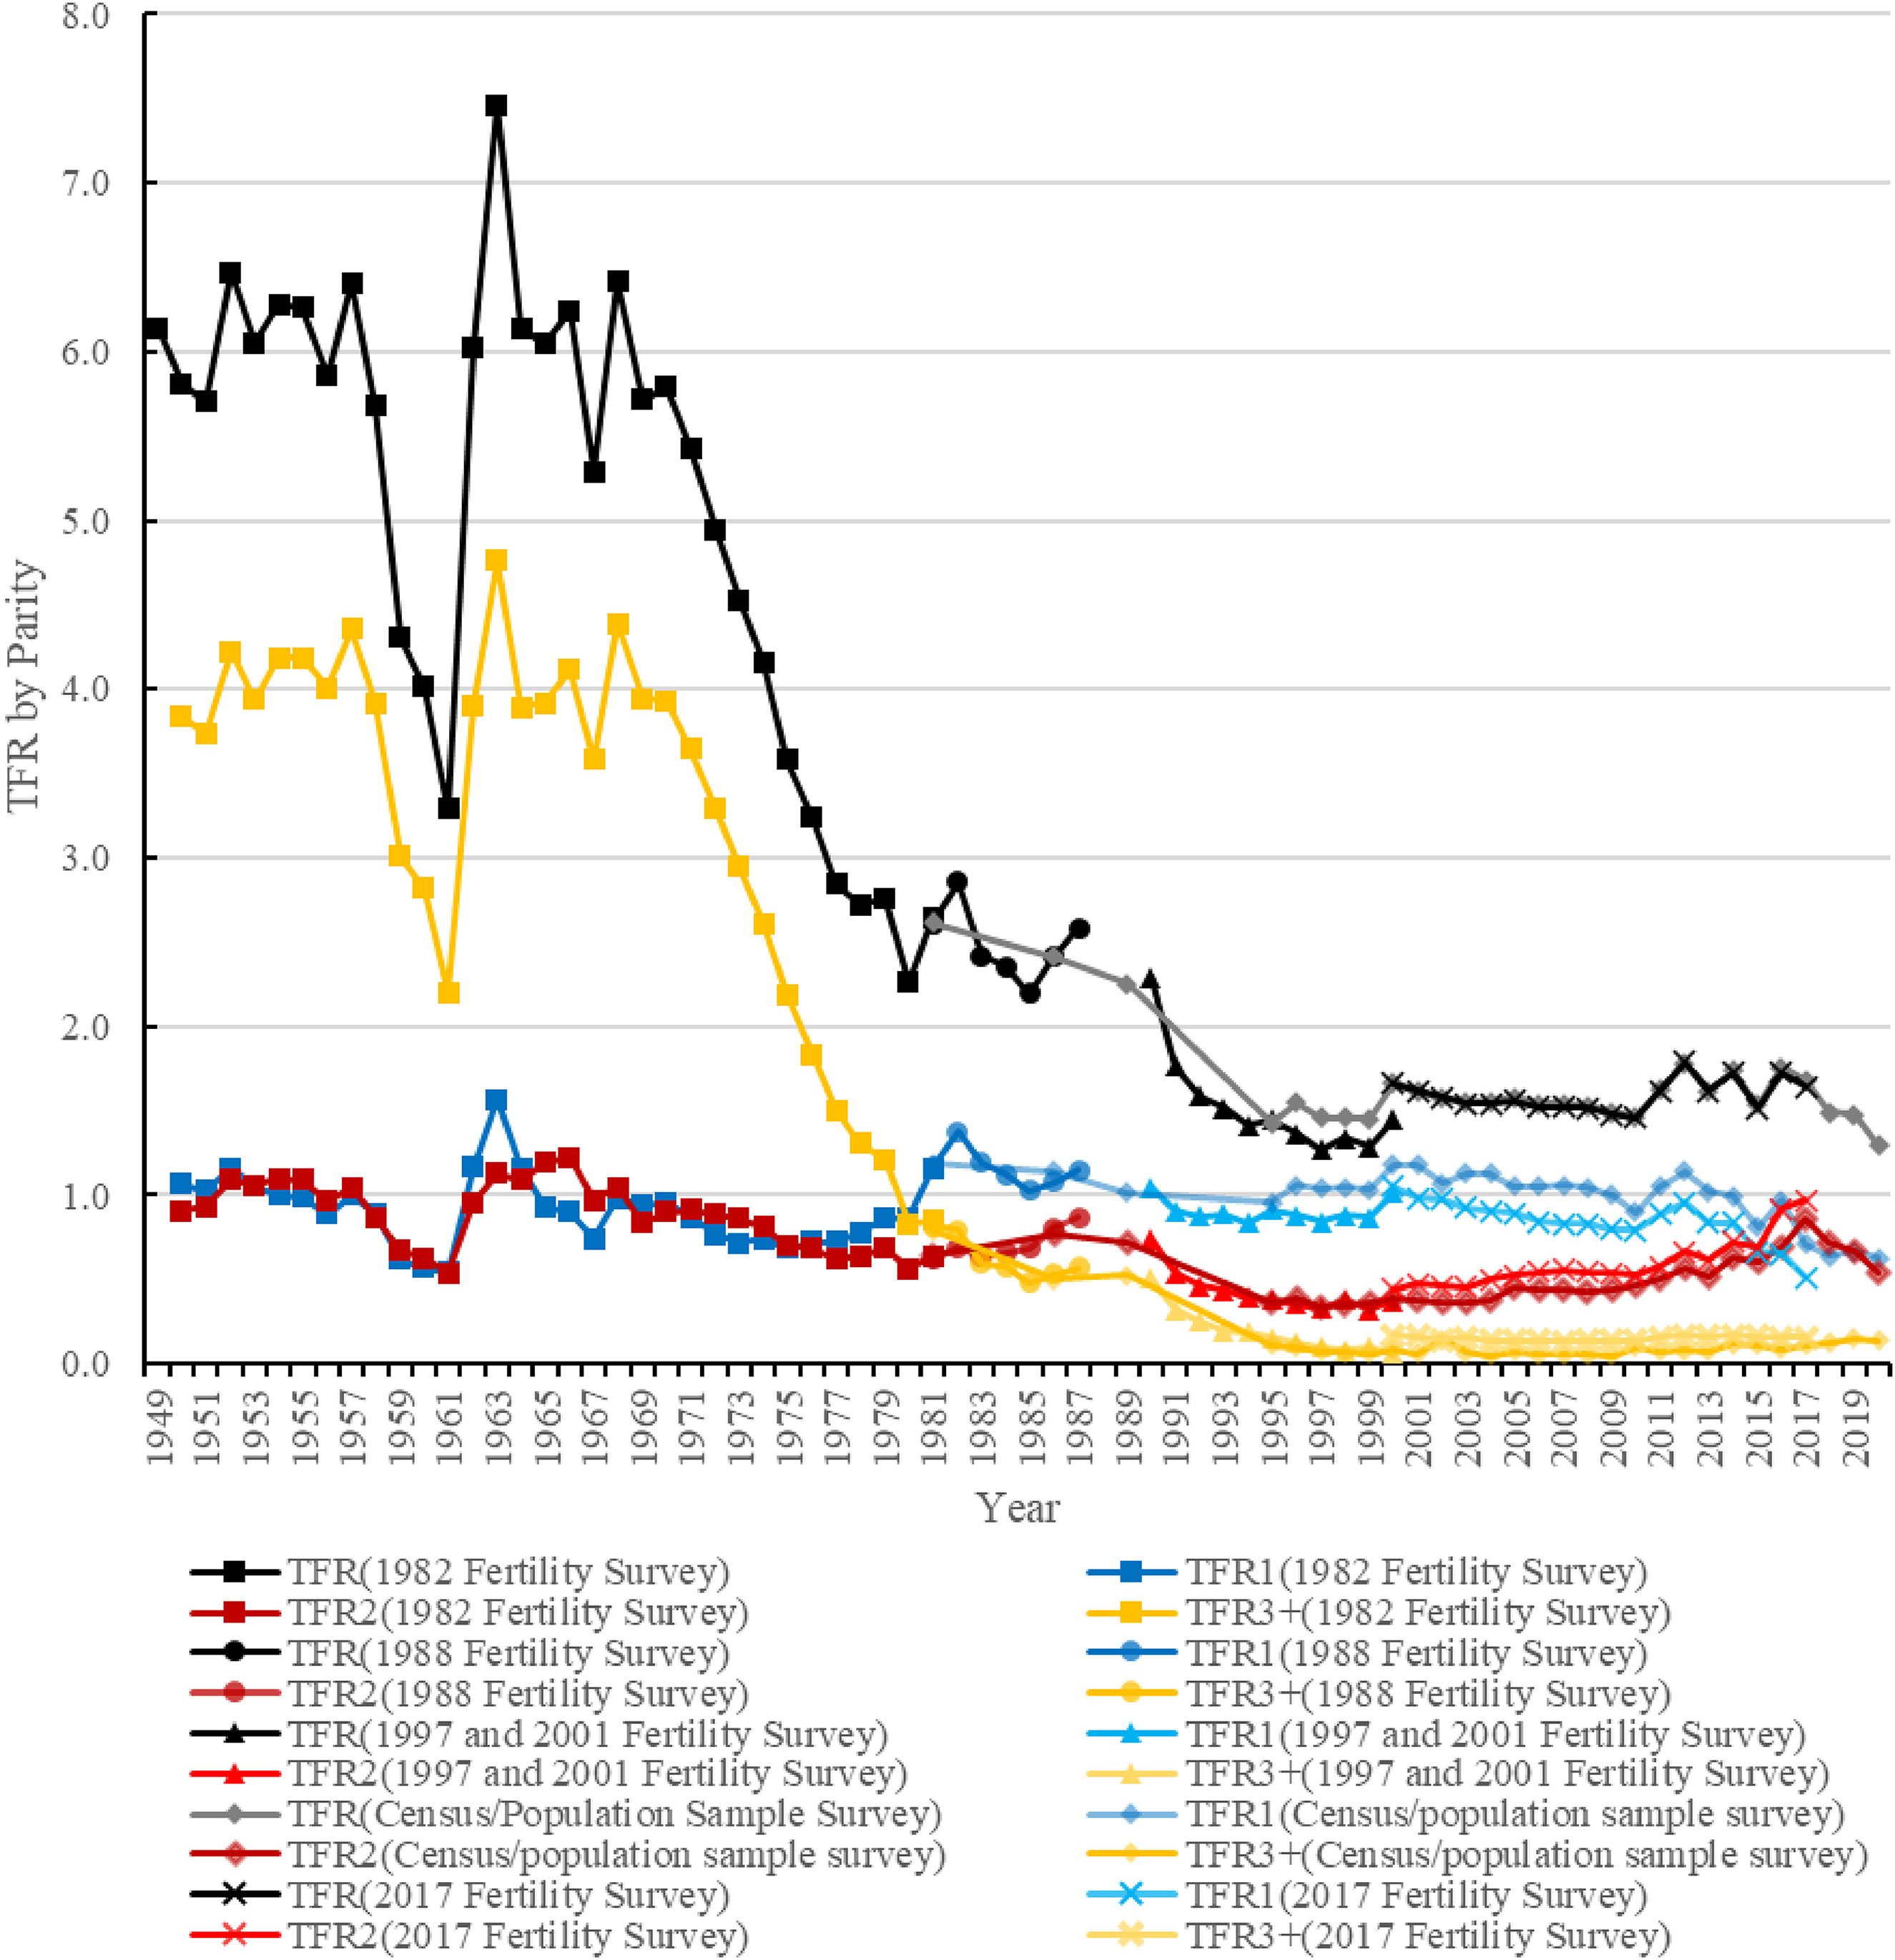
Overall and parity-specific total fertility rates in China: 1949–2020. Source: 1982, 1988, 1997, and 2017 fertility surveys, and the 1982, 1990, 2000, 2010, and 2020 censuses.
The fertility decline since the early 1990s is characterized by a further drop in the multiple birth rate, from more than 0.4 to approximately 0.1. At the same time, the second-child fertility rate also declined from 0.6 to approximately 0.3, and has remained at this very low level. During this period, the first-child fertility rate was relatively flat at approximately 0.9.
Due to concerns about the fluctuation in and rebound of fertility rates in the 1980s, the Chinese government reiterated the importance of family planning in the early 1990s, calling for strengthened policy implementation while stabilizing existing policies. Owing to the strengthened implementation of the family planning policy, the fertility rates for second and later births declined substantially in the 1990s. Finally, the overall TFR fell below the replacement level. However, in the 1990s, while China's family planning policy remained consistent and stable, some reforms were carried out in family planning, manifested in the “two shifts” and “three combinations” 3 working models of family planning in the early 1990s and the introduction of high-quality family planning services in the later stages. Quotas for fertility indicators were gradually abolished, and people's willingness to have children underwent significant changes. However, in the 1990s, with rapid economic development and significant lifestyle changes, the low fertility rate was sustained and stable, suggesting a gradual transition from exogenous low fertility to endogenous low fertility (Li, 2004).
Since the beginning of this century, China's fertility rate has fluctuated considerably. This is largely due to the successive modifications of China's family planning policy, including the removal of mandatory between-birth intervals since 2002 and the introduction of the “selective two-child policy” 4 in 2013 and the “universal two-child policy” in 2015. During this period, the second-child fertility rate increased substantially. Before 2011, the second-child fertility rate had stabilized at approximately 0.6 and it began to rise after 2011, and rose sharply after 2015. The second-child fertility rate exceeded the first-child fertility rate in 2015, reaching 0.94 in 2016 and even exceeding 1 in 2017. In the history of the People's Republic of China, there were cases in the 1950s and 1960s when the total second-child fertility rate exceeded 1. In the early 1950s, shortly after the founding of the People's Republic of China, the economy gradually recovered, people's lives tended to stabilize, the first baby boom occurred, and the total second-child fertility rate exceeded 1 from 1953 to 1955. Largely due to compensatory births after the “three years of natural disasters” in the late 1950s, a second baby boom occurred in the 1960s, with the total second-child fertility rate exceeding 1 in 1963–1966 and 1968. In contrast to the 1950s and 1960s, the total second-child fertility rate in 2017 exceeded 1 in a context of low fertility, completely as a result of the implementation of the universal two-child policy, a fertility accumulation phenomenon caused by women of different ages having a second child simultaneously. This can be described as a “blowout” release of reproductive potential limited by the original birth policy. In this sense, the effect of the universal two-child policy has been enormous.
It should be noted that overall fertility did not increase significantly under the two-child policy, because the increase in the second-child birth rate was largely offset by the decrease in the first-child birth rate. The recent rapid reduction in the first-child birth rate has never before been observed in history, and is mainly due to a tremendous delay in the age of first marriage and a shrinking number of women entering marriage and childbearing age. Without the implementation of the two-child policy, China's TFR would have fallen more sharply earlier, along with the decline in the first-child birth rate. Thus, the two-child policy effectively temporarily interrupted the decline in fertility that began in the early 2010s. However, the effect of the two-child policy soon faded, and China's fertility rate fell rapidly after 2017. In just 5 years, the TFR dropped from more than 1.8 to less than 1.3. The dramatic decline in China's fertility in recent years has occurred in the context of a relaxation of family planning policy rather than restriction; yet, although the requirement for late marriage and childbearing has long been abolished, the trend of delaying marriage and childbearing has intensified.
The change in the structure of China's fertility is also reflected in the age pattern of fertility (Figure 3). In the 1970s, the fertility of older women fell sharply, followed by that of younger women. In the 1990s, further change in the fertility age pattern manifested in further declines in fertility at younger ages, especially a decline in peak fertility; as such, the age pattern of fertility shifted from an “early, wide, and high” type to a “late, narrow, and low” one. Since 2000, the fertility age patterns have changed considerably once again. Peak fertility age has been delayed, and peak fertility has further declined. There has been a marked increase in fertility in those aged over 27, and the fertility of those aged over 30 even exceeds that of those of the same age in 1989. The aging characteristics of the fertility rate are directly related to the continued delay in childbearing age, particularly the impact of the two-child policy.
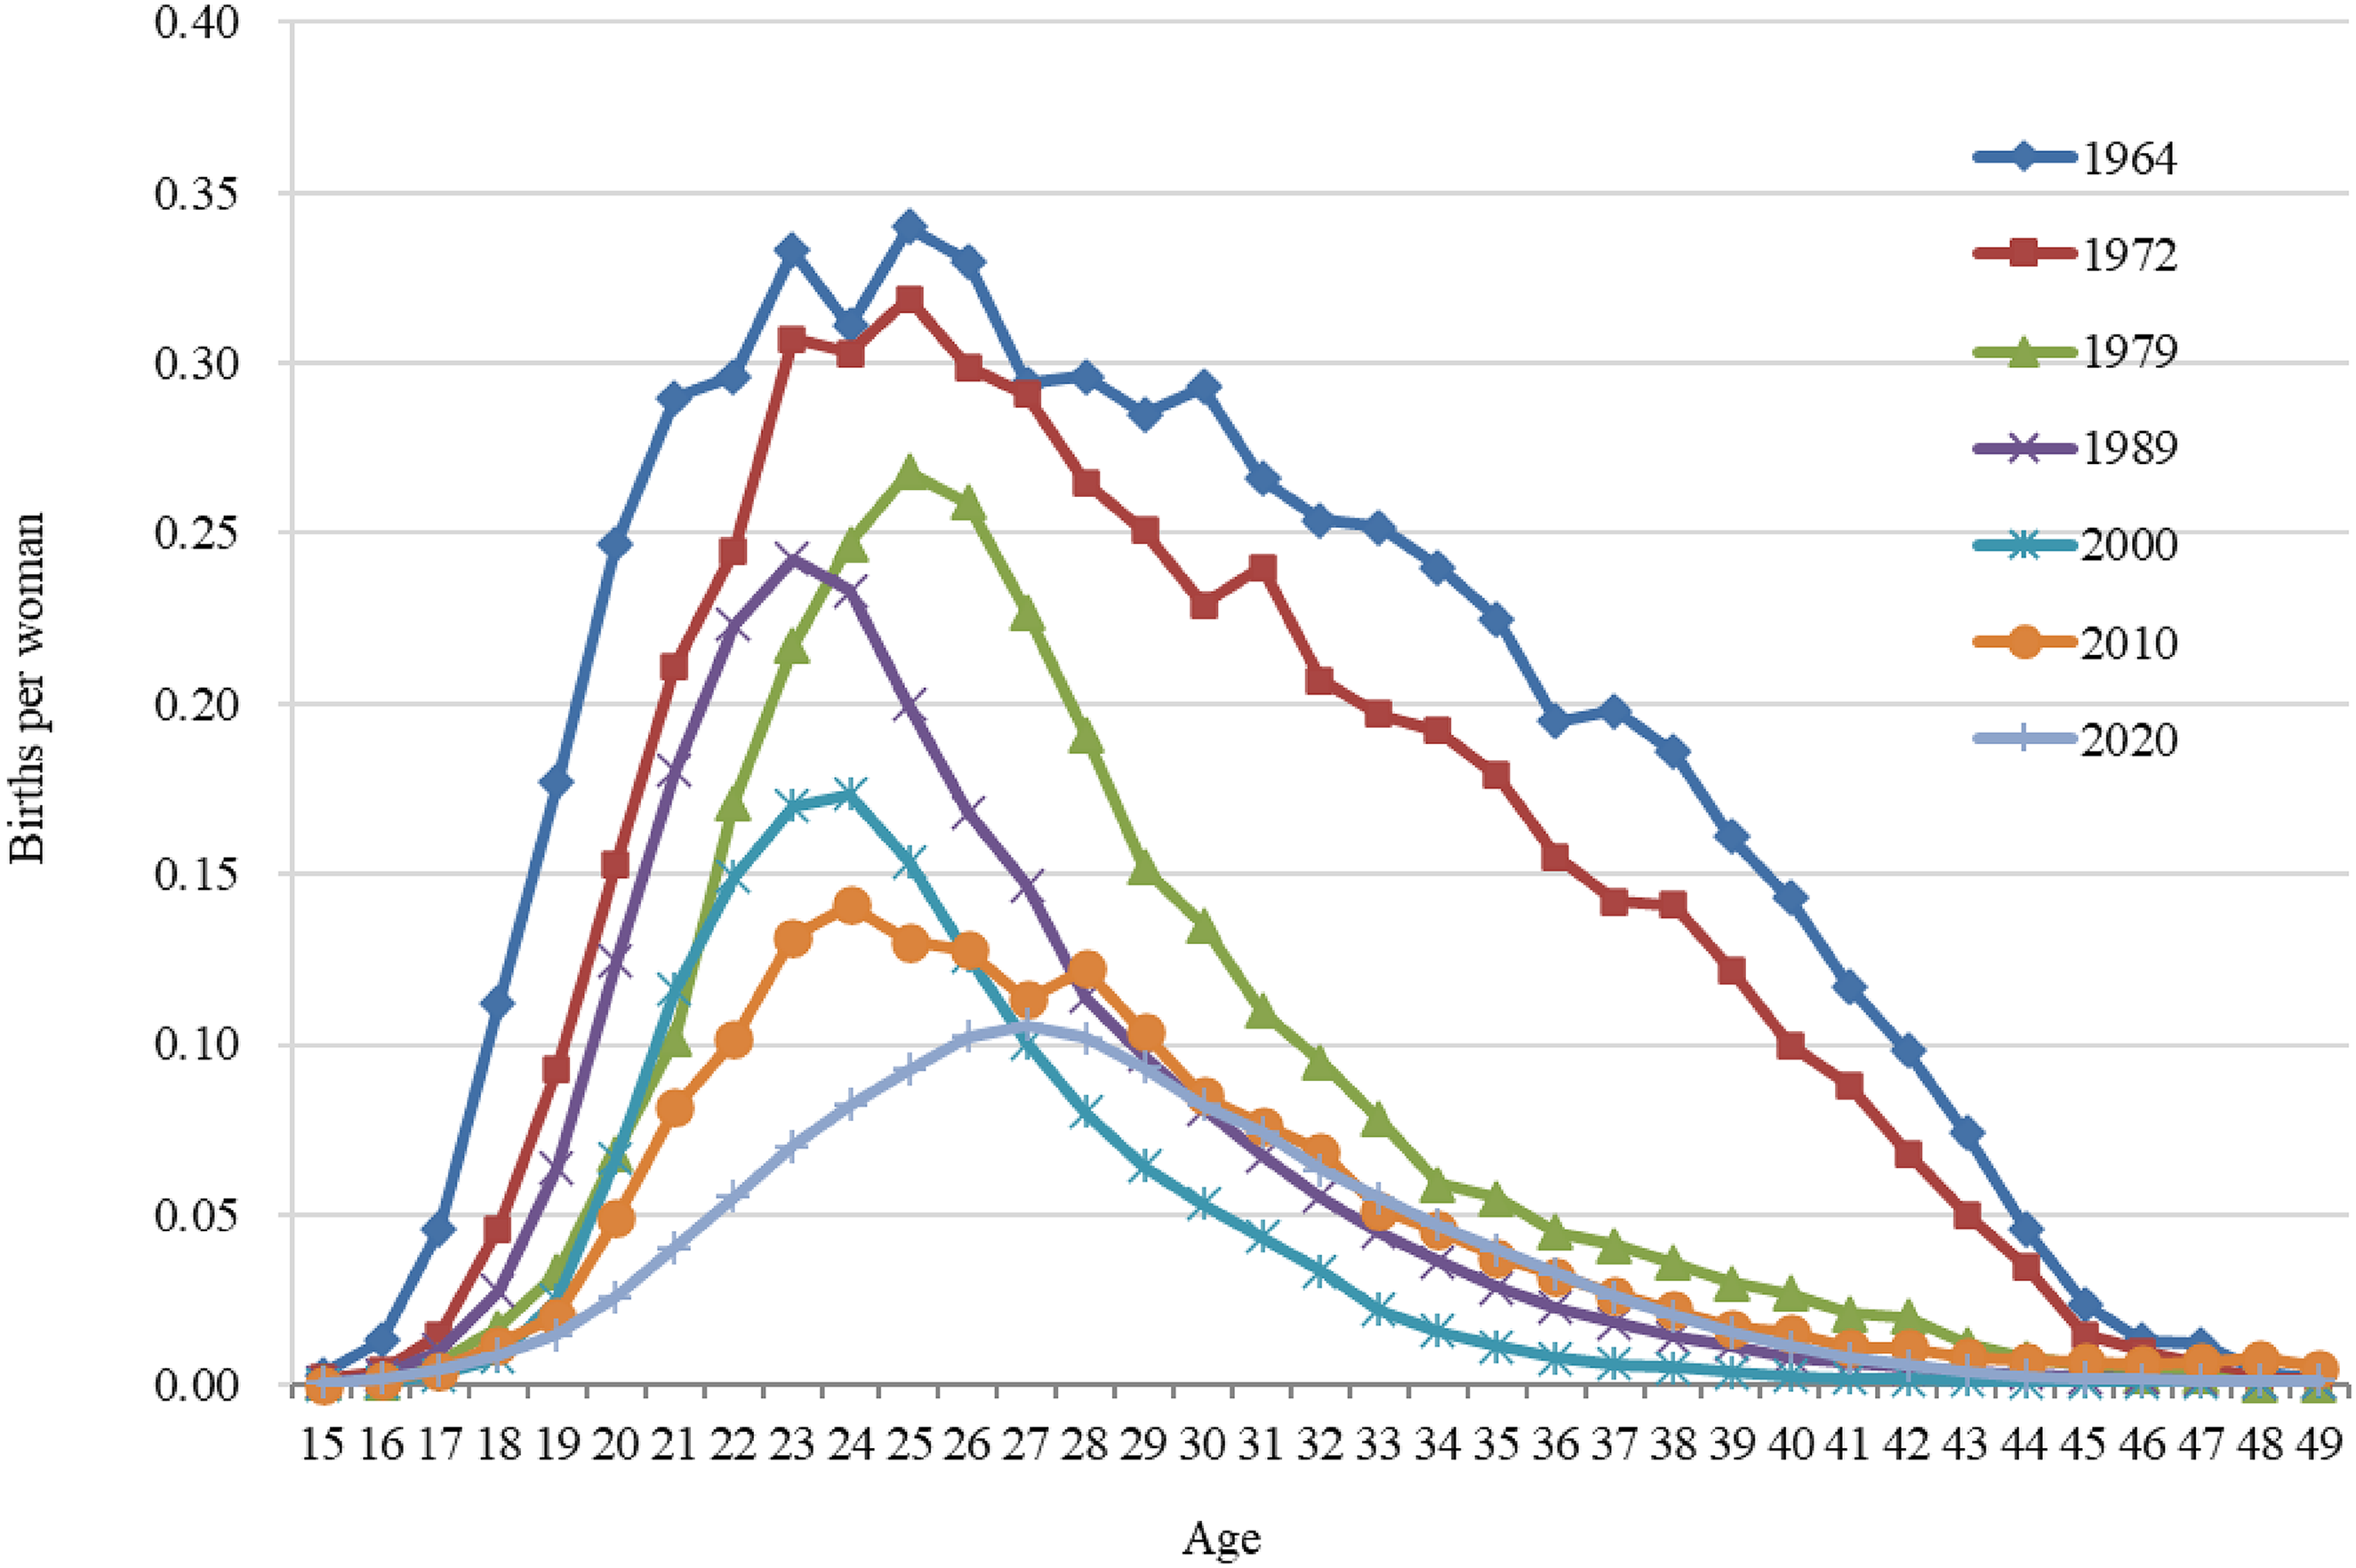
Age pattern of fertility in China: 1964–2020. Source: 1988 fertility survey, and the 1990, 2000, 2010, 2020 censuses.
However, compared with other countries with similar levels of fertility, Chinese women tend to give birth more frequently at a younger age. Figure 4 shows the age pattern of fertility in selected countries when their TFR was 1.3. Even with the same TFR, the age-specific fertility patterns in different countries and periods are significantly different. Except for South Korea, the kurtosis of most countries is less than three, which indicates a platykurtic distribution. In other words, when TFR was approximately 1.3, peak fertility was at a very low level, sometimes even lower than 0.1, and childbearing occurred over a wider age range. There is also a significant difference between China and other countries in terms of childbearing age. At the same TFR of 1.3, the mean age of childbearing of women in Japan, South Korea, and Italy was higher than that of Chinese women (the mean age of childbearing in Japan in 2021 and Italy in 2018 was 3 years higher than that of China in 2020). The skewness of the fertility curves in Japan in 2021 and Italy in 2005 and 2018 was less than 0, that is, a left-skewed distribution, indicating later childbearing. The skewness of Australia in 1999 and 2001, the Czech Republic in 2006, and South Korea in 2001 was also lower than that of China in 2020. The cumulative fertility rate before the age of 24 in China was higher than that of the selected countries, except for Australia in 1999 and 2001. Therefore, Chinese women still gave birth relatively early, although the childbearing age in China was considerably postponed.
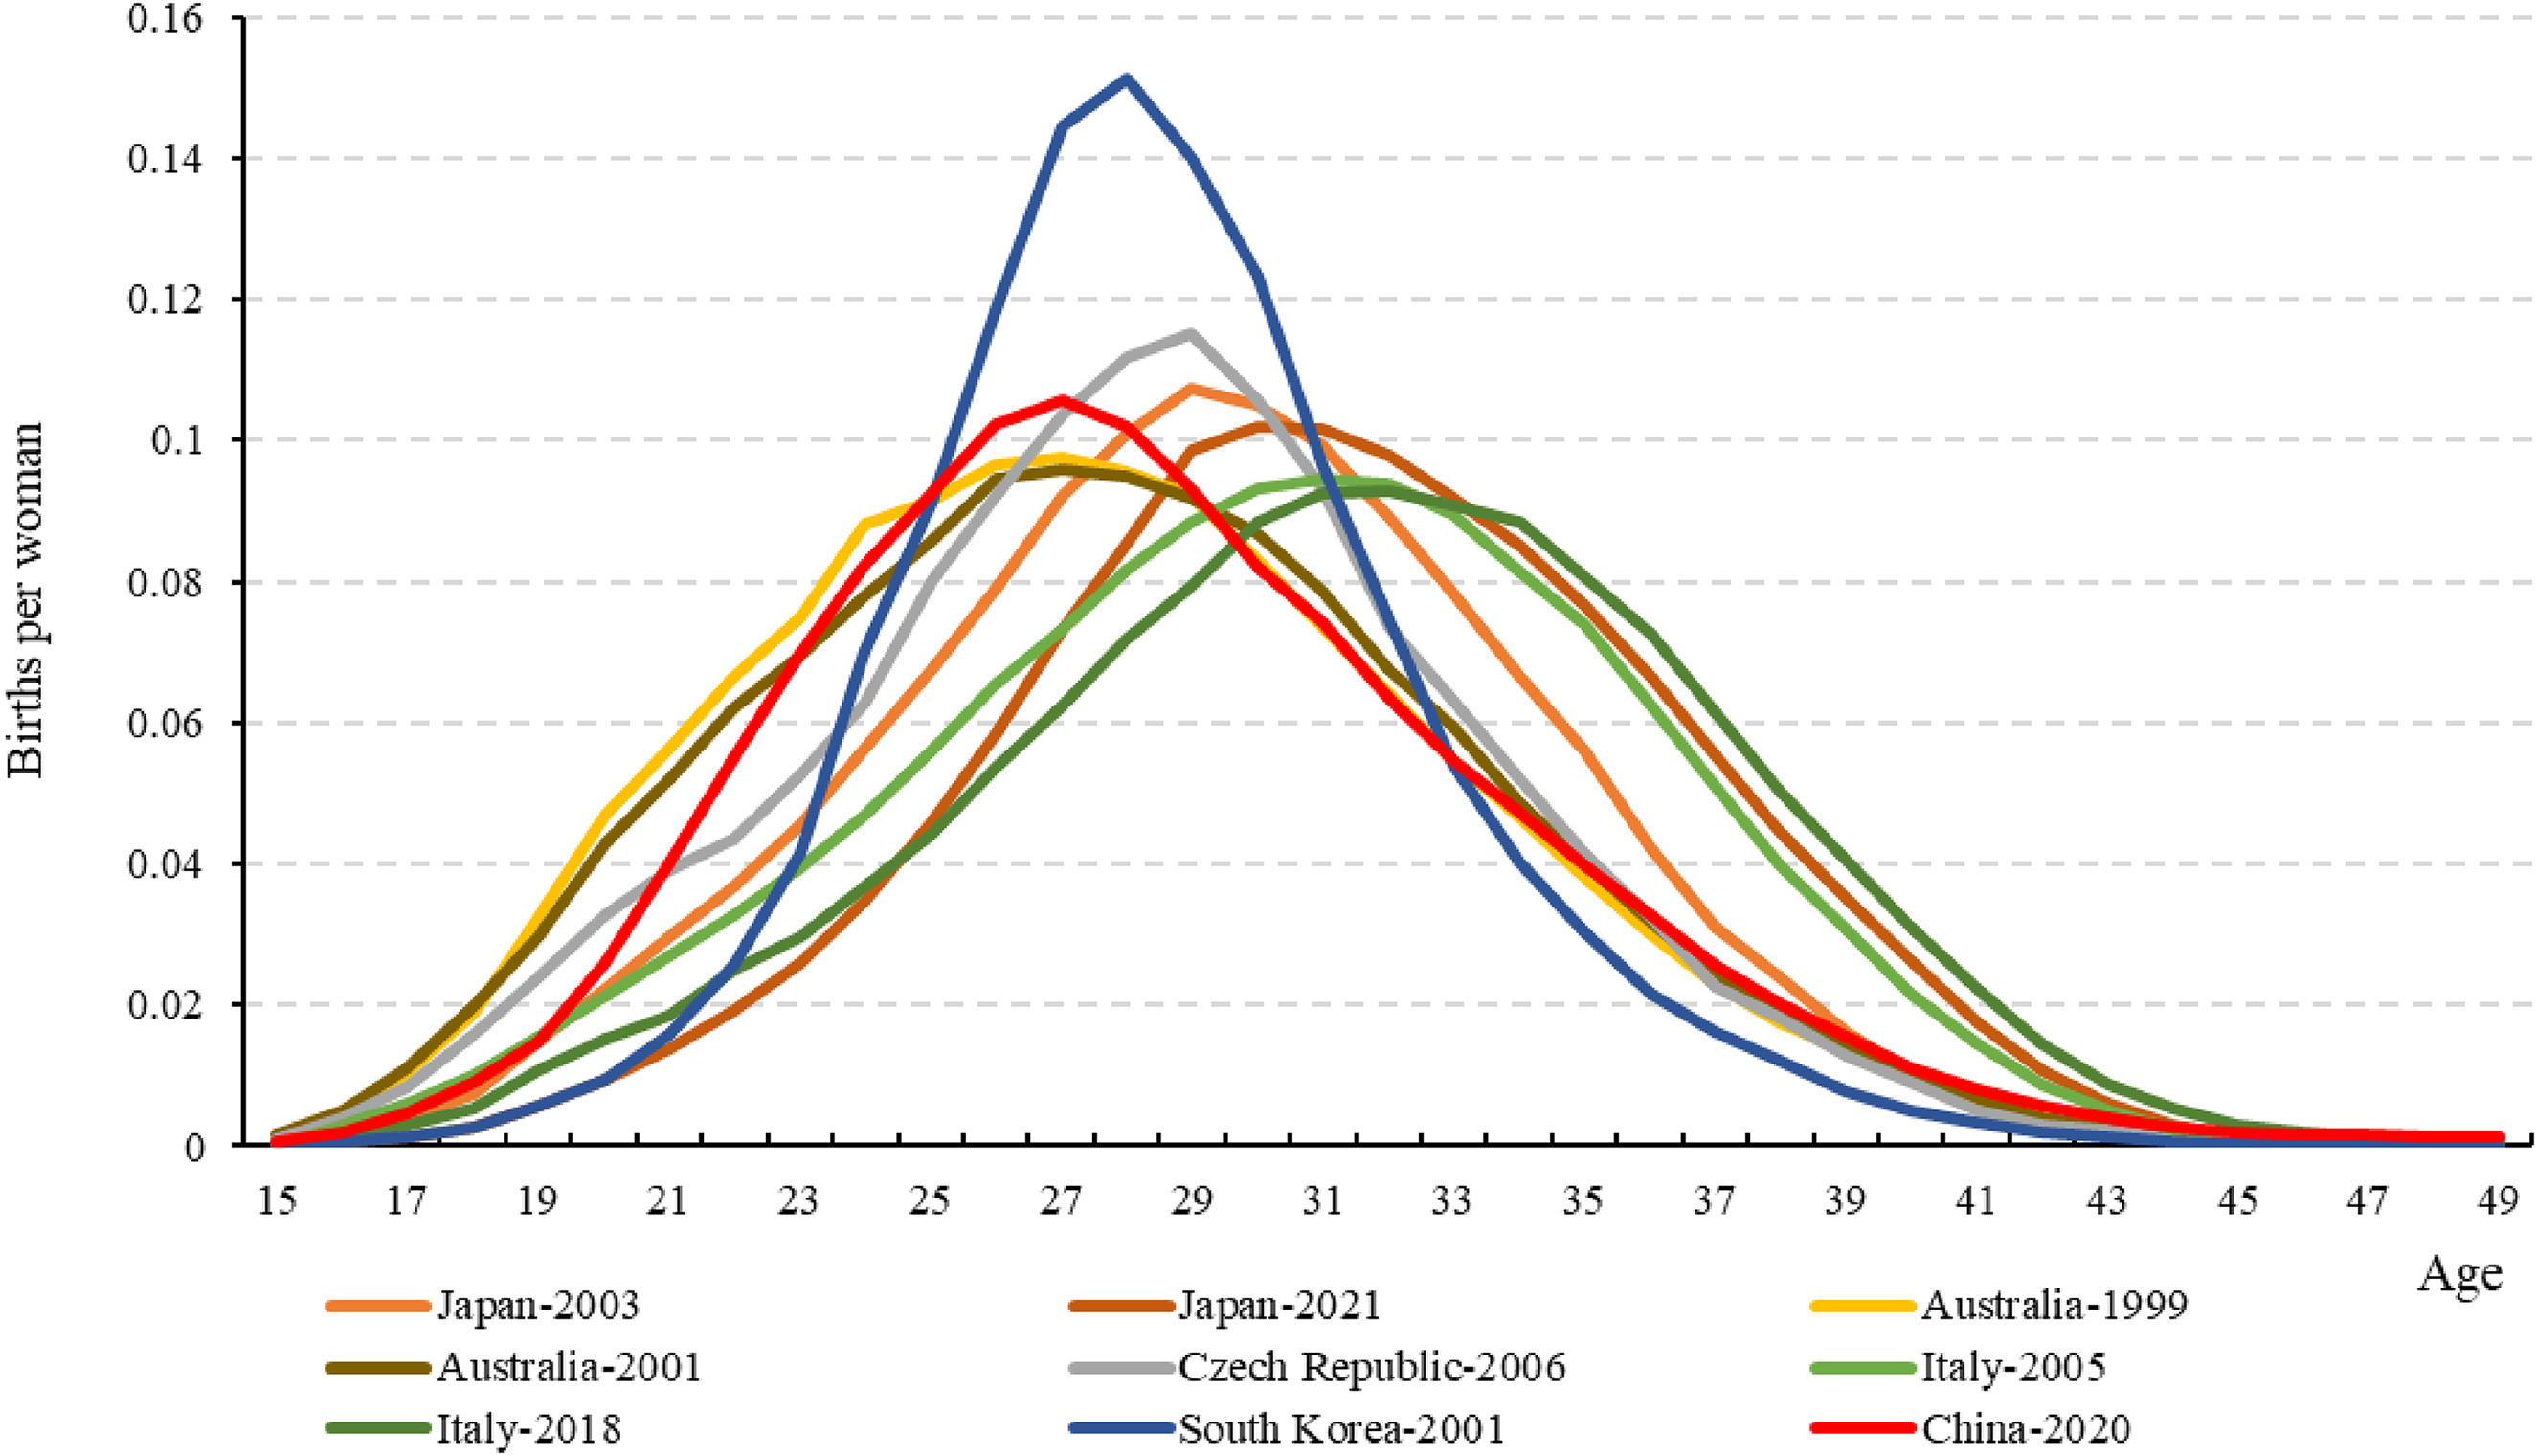
Age pattern of fertility under the total fertility rate of 1.3: China comparing with selected countries. Source: 2020 China population census and Human Fertility Database.
Age at marriage and childbearing and birth intervals are important factors that affect fertility. China's family planning policies also control births based on both their number and timing. Even if the lifetime fertility of each cohort remains the same, a change in birth timing will lead to a nontrivial change in the period fertility rate, sometimes depressing or inflating fertility. China's 50-year fertility transition and low fertility rates illustrate this point. The delay in women's marriage and childbearing age and the extension of birth spacing have always been important features that have inhibited China's fertility.
In general, the age at which women marry and have children has gradually increased since the founding of the People's Republic of China (Figure 5). In the 1970s, owing to the intervention of the “later, longer, fewer” family planning policy, 5 the age at first marriage rose rapidly, and in the 1980s, owing to the amendment of the Marriage Law, the actual age at first marriage decreased. The tightening of family planning policy in the 1990s, which was followed by an increase in the age at first marriage and first birth, stalled in the early 2000s (it should be noted that different census data do not agree on this point); however, there has been an acceleration of the delay once again in the past decade. Between 1990 and 2020, the average age at first marriage for Chinese women, as measured by census data, rose by 5.8 years, with most of the increase occurring in the 2010s, alongside 1- or 2-year growth periods in the 1990s and 2000s. The trend in the average age at first birth of Chinese women is consistent with the age at first marriage, with the average age at first birth being generally 1- to 2 years higher than the average age at first marriage.
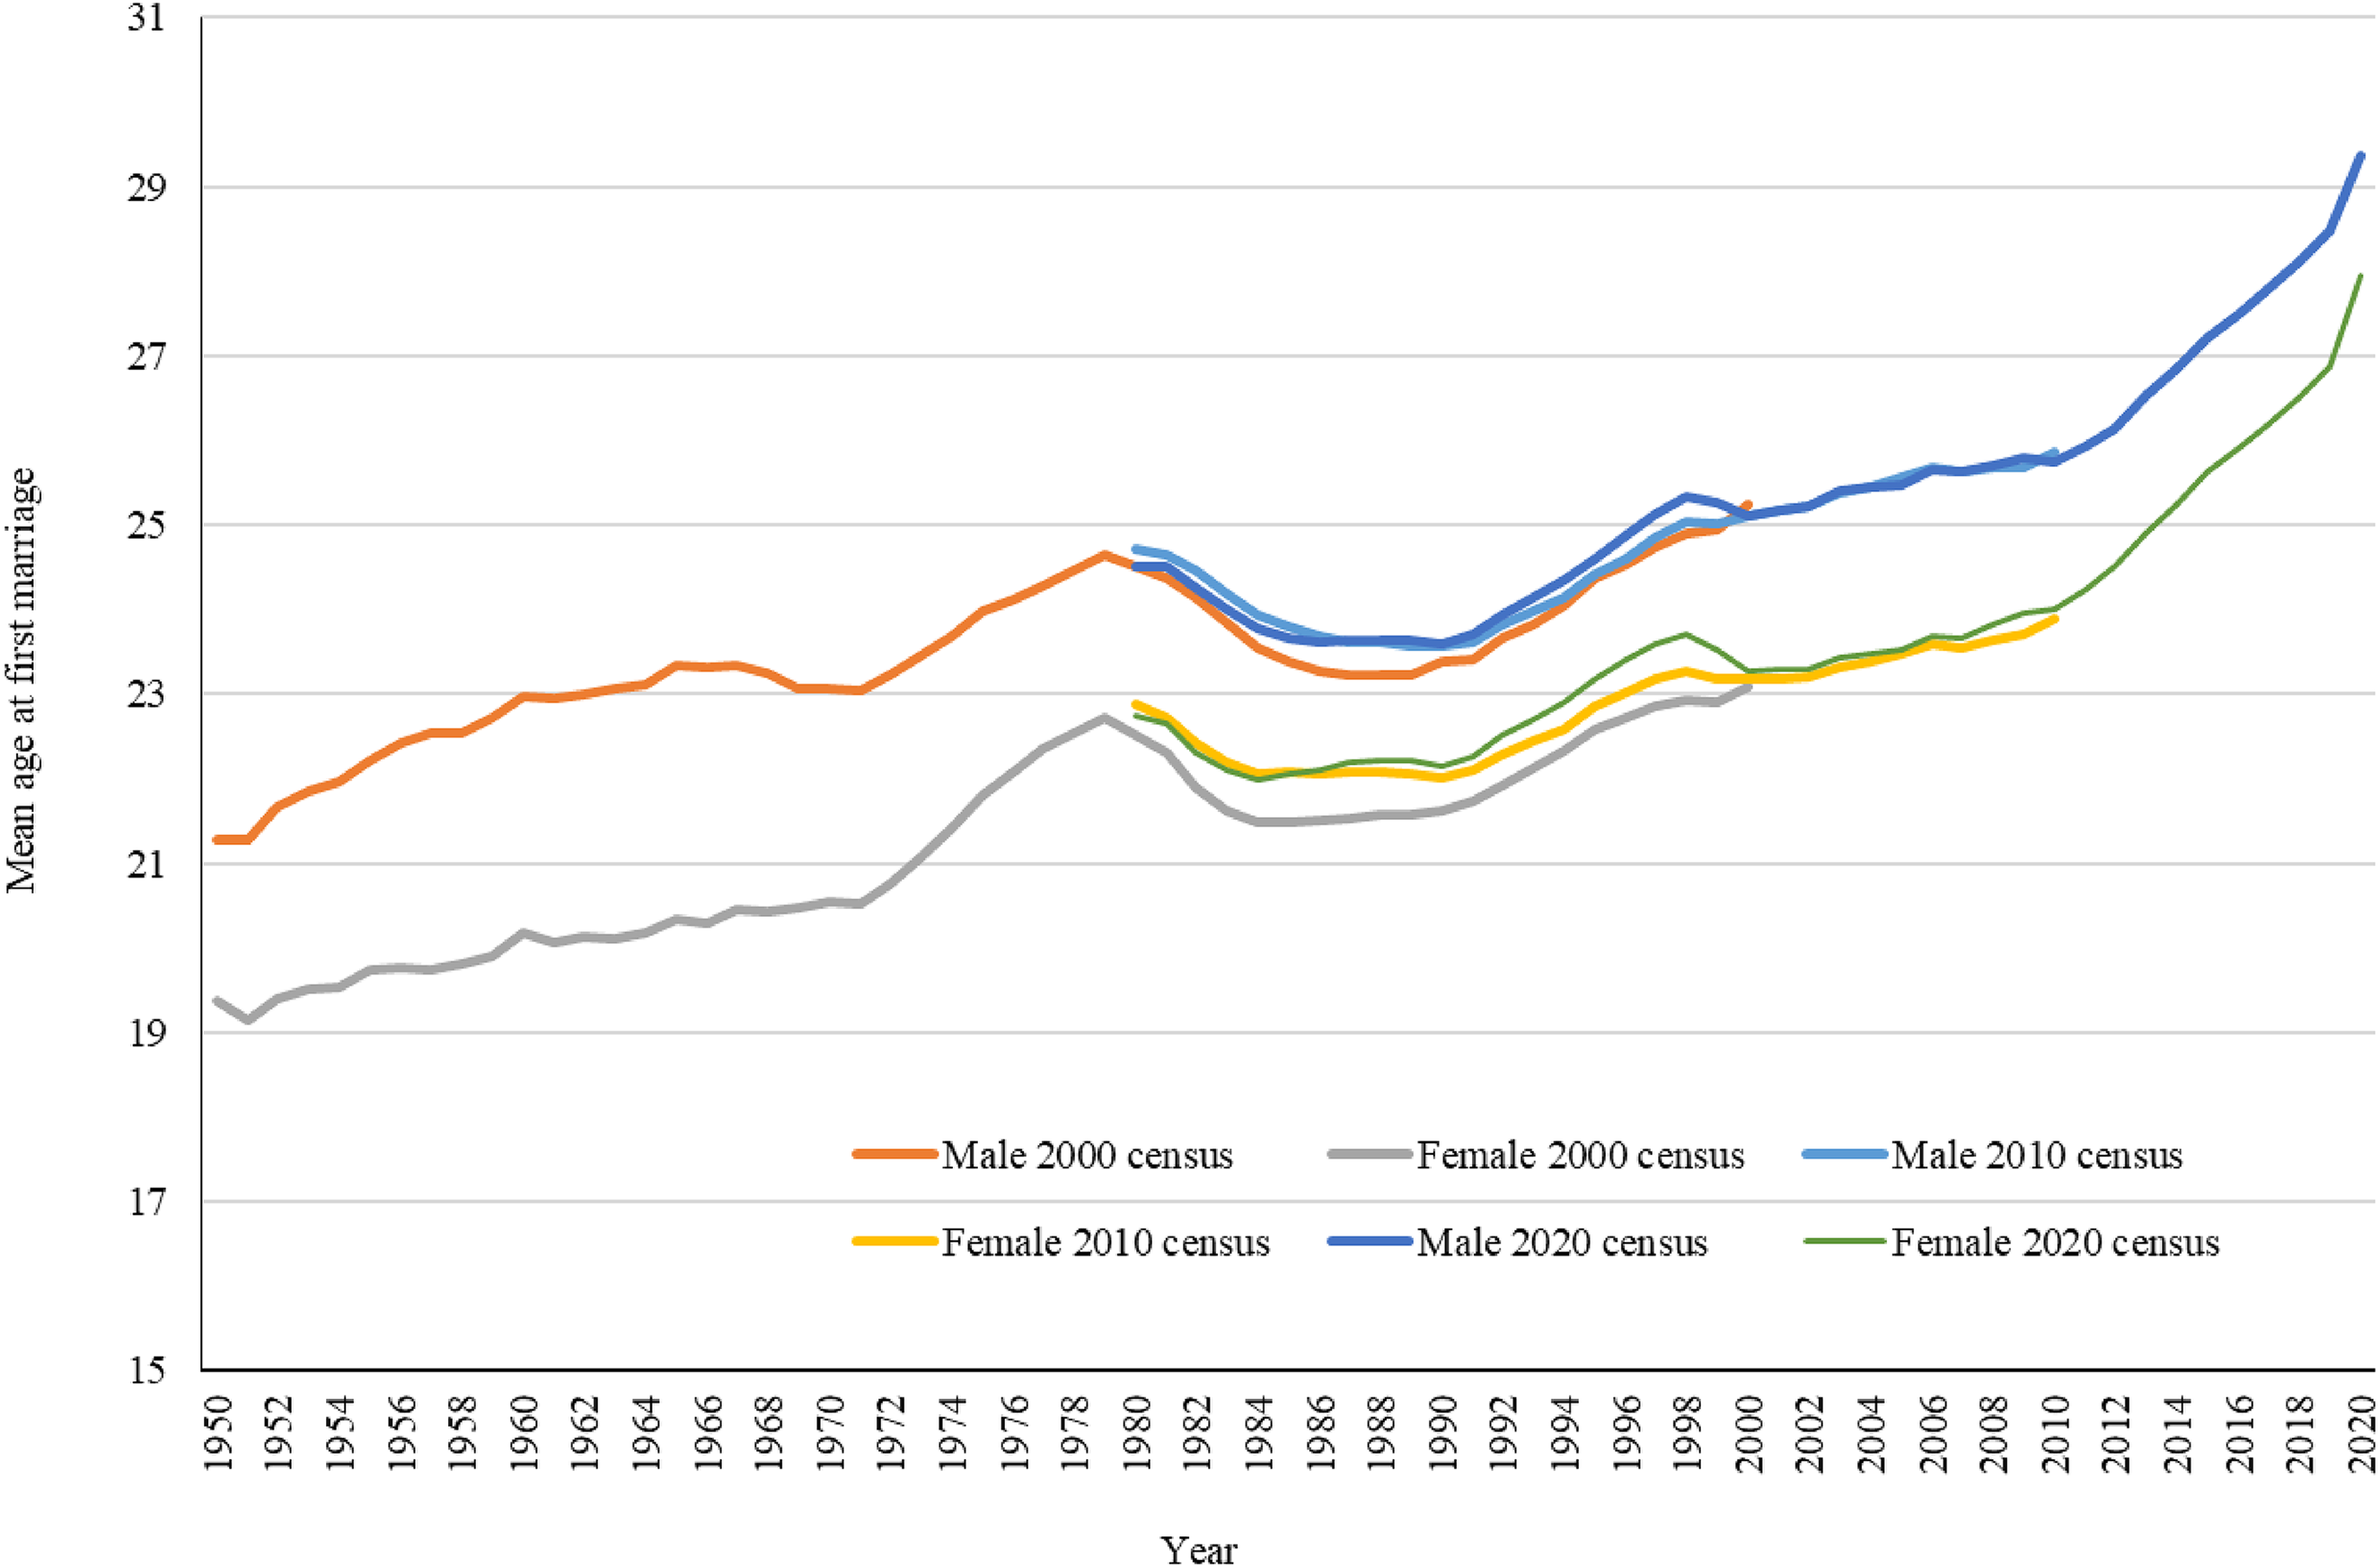
Mean age at first marriage in China: 1950–2020. Source: 2000, 2010, and 2020 censuses.
Owing to restrictions on birth spacing in China's family planning policy, the interval between the first and second child for Chinese women is constantly increasing. From 1970 to 2010, the average age at having a second child increased from 25.3 to 30.37, an increase of 5 years, which was greater than the increase in the average age at first birth (which increased by nearly 3 years over the same interval). The average age at having a second child had been stable since 2010; by 2017 it had reached 30.77, while according to the seventh census it was 29.83 in 2020. The average interval between the first two births among Chinese women also decreased with the lifting of birth-spacing restrictions and continuous adjustment of birth policies.
Quantum and tempo components of fertility
The aforementioned structural changes in China's fertility can be quantified using a deconstructive fertility framework wherein fertility changes are divided into two demographic driving forces: quantum and tempo.
According to Bongaarts and Feeney (1998), quantum and tempo are the two components of fertility change. Even if the number of births remains the same, when fertility timing changes, the TFR will decrease or increase. To solve the defects of using TFR in predicting fertility level, they proposed the “tempo-adjusted TFR”. 6 According to Guo (2000a, 2000b, 2004), the TFR obtained from the fertility surveys in China in the mid- and late 1990s was around 1.3–1.4, while the tempo-adjusted TFR reached 1.7, and the difference between the TFR and the tempo-adjusted TFR can be used to estimate the effect of birth deferment on the current birth rate.
Some scholars have argued that tempo-adjusted TFR is also flawed and cannot accurately predict fertility levels because it is based on an almost unrealistic premise; that is, the measurement of the fertility tempo effect can only be accurate on the assumption that all subsequent cohorts delay or advance fertility to the same extent (McDonald and Kippen, 2007; Ni Bhrolchain, 2011). In fact, before Bongaarts and Feeney, Rallu and Toulemon (1994) proposed a tempo-adjusted TFR controlling all distortion effects contained in the conventional TFR—age structure (age), parity structure (parity), and parity interval (duration)—which can predict fertility levels more accurately (McDonald and Kippen, 2007). This section uses this method, referred to hereinafter as TFRadj, 7 to investigate fertility transition and low fertility in China, decomposing the fertility quantum and tempo effects during different periods of fertility transition in China. The data used for the decomposition include the 1988 fertility survey, 2008 population sample survey, and 2017 fertility survey.
Figure 6 shows TFR versus TFRadj from 1971 to 2016. It should be noted that the fertility rate after 2007 was calculated based on the 2017 fertility survey data, and is much higher than the previous fertility rates calculated using the 2008 population sample survey data. This jump is due to data discrepancies, not reality, and while fertility did rise during this period, it is unlikely that such a large jump would have occurred. In general, the TFRadj trend is largely consistent with the TFR results. Judging from the TFRadj values, since 1990, the fertility level in China has been below the replacement level, and in the early 1990s the fertility level indeed experienced a sharp decline. Since 1994, the fertility level has been at a very low level of less than 1.5; in recent years it has risen significantly, although there has been a large fluctuation.
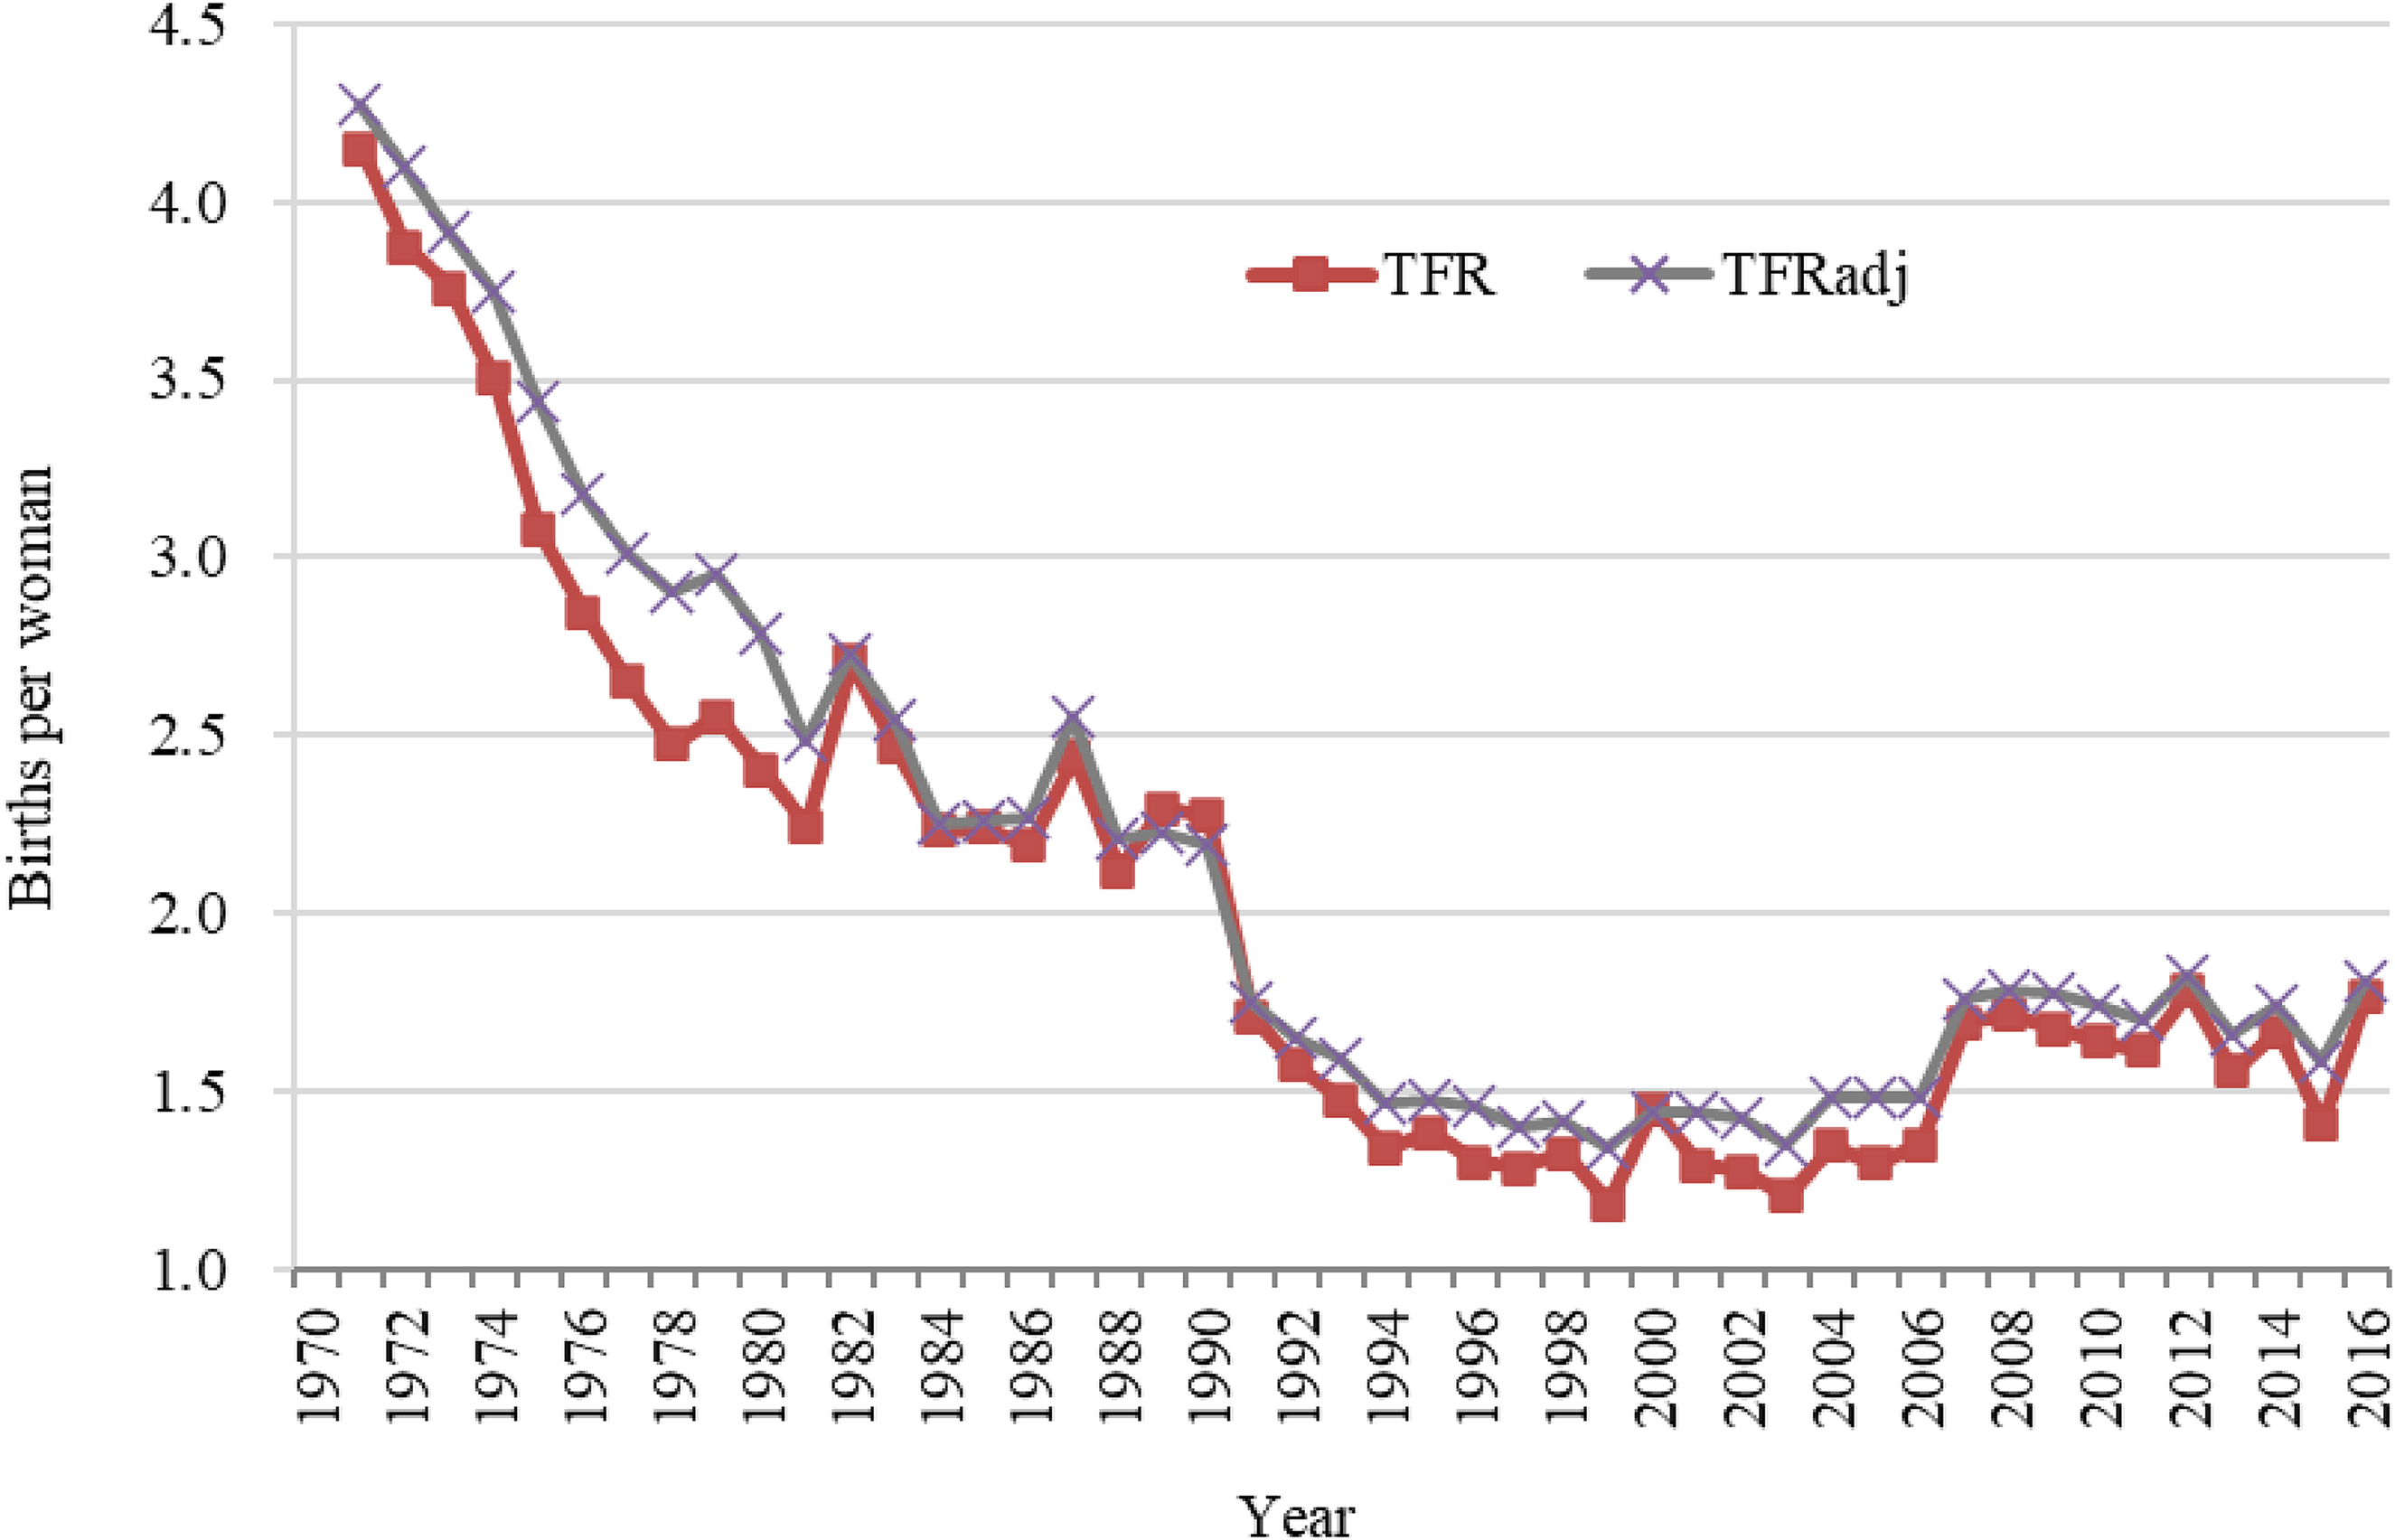
TFR and adjusted TFR in China, 1971–2016. Sources: 1988 fertility survey, 2008 population sample survey, and 2017 fertility survey.
In the 1970s, there was a marked difference between TFRadj and TFR, with the former being increasingly greater than the latter. The TFRadj for each parity (first child, second child, etc.) was also greater than the equivalent TFR, and the difference between the two for the first child was large between 1973 and 1978, whereas the difference between the two for the second child has shown an expanding trend since 1977. During the fertility decline in the 1970s, the change in reproductive behavior related to the first child was most pronounced in the mid-1970s. However, in the mid-to-late 1970s, the adjustment in first-child reproductive behavior slowed while the delay in second childbirth became more pronounced. This is consistent with the requirements of the “later, longer, fewer” fertility policy.
In the 1980s, both TFRadj and TFR showed substantial fluctuations, and the difference between the two was not large, although for different parities the differences were more pronounced. For example, in 1983 the difference between TFRadj and TFR was very small (only 0.0785), although the first-child TFRadj was 0.2374 lower than the first-child TFR. The pattern was the opposite for second-child fertility, with TFRadj being 0.2427 higher than TFR, indicating that in 1983 there was a large accumulation of first-child fertility and a considerable delay in having the second child. In fact, the accumulation of first-child fertility and the delay in having a second child in the first half of the 1980s has already been established. Many studies have confirmed that rural reforms and amendments to the Marriage Law played significant roles in the accumulation of first-child fertility at this time. However, as the average age at second birth did not decrease significantly during this period, the probability of giving birth to a second child after less than a 3-year interval for women aged 20–30 years decreased significantly. By contrast, the probability of having a second child after an interval of more than 3 years increased, leading to a delay in the birth of a second child.
TFRadj and TFR fell sharply below the replacement level in 1990 and continued to decline until 1999. In 2000, the TFR was close to 1.5. Except in 2000, the TFRadj curve has always been above the TFR curve. The TFRadj of the first and second child in the 1990s was slightly higher than that of the TFR, indicating a small degree of delayed birth of the first and second child during this period. Although Zhigang Guo (2000a) shows that fertility decline in the 1990s was mainly due to the large delay in marriage and childbearing, our calculation using one-per-thousand sampling data from the population census of 2000 shows that the average age of all births was greatly delayed during the 1990s. Therefore, the estimated tempo-adjusted TFR was considerably higher than the TFR. However, TFRadj was lower than tempo-adjusted TFR, indicating that the decline in fertility in the 1990s was, on the one hand, due to the rise in average age of marriage and childbearing, resulting in “delayed” fertility, while on the other hand, the changing pattern of marriage and childbearing had made some “delayed” fertility “disappear”. It should be noted that the fertility change in the early 2000s was largely the continuation of trends from the late 1990s. There was no significant difference between TFRadj and TFR for those third children and beyond, while the difference between the two for first and second children has been consistent since the late 1990s.
After the mid-2000s, both the TFRadj and TFR showed upward trends; however, there were significant fluctuations. The trends in this period are somewhat similar to those of the 1980s, albeit with greater volatility caused by period factors. Overall, TFRadj was slightly higher than TFR, although the differences between the two are obvious. The difference in the fertility rate before 2012 was small, although after 2012 the difference widened; that is, the increasing tempo effect continued to depress the total first-child fertility rate. The second-child fertility rate exhibited the opposite trend. From the implementation of the selective two-child policy to the universal two-child policy, the two-child fertility rate increased greatly. However, from the perspective of TFRadj, this fertility accumulation effect overestimates the two-child fertility rate. The fertility rate of the third child and beyond is similar to that of the second child, which is also overestimated. However, because the fertility rate itself is very low, the impact is small.
As mentioned above, the variation in TFR is caused by either, or both, the quantum and tempo effects of fertility changes. As TFRadj represents the fertility quantum, a change in TFRadj represents a change in the quantum effect. The difference between TFRadj and TFR reflects the effect of tempo. We calculated the TFRadj difference from t to t + 1 years, which represents the quantum effect of fertility change from t to t + 1 years. We calculated the difference between TFR and TFRadj in year t + 1, which represents the tempo effect of fertility change from year t to year t + 1. The results are shown in Figure 7.
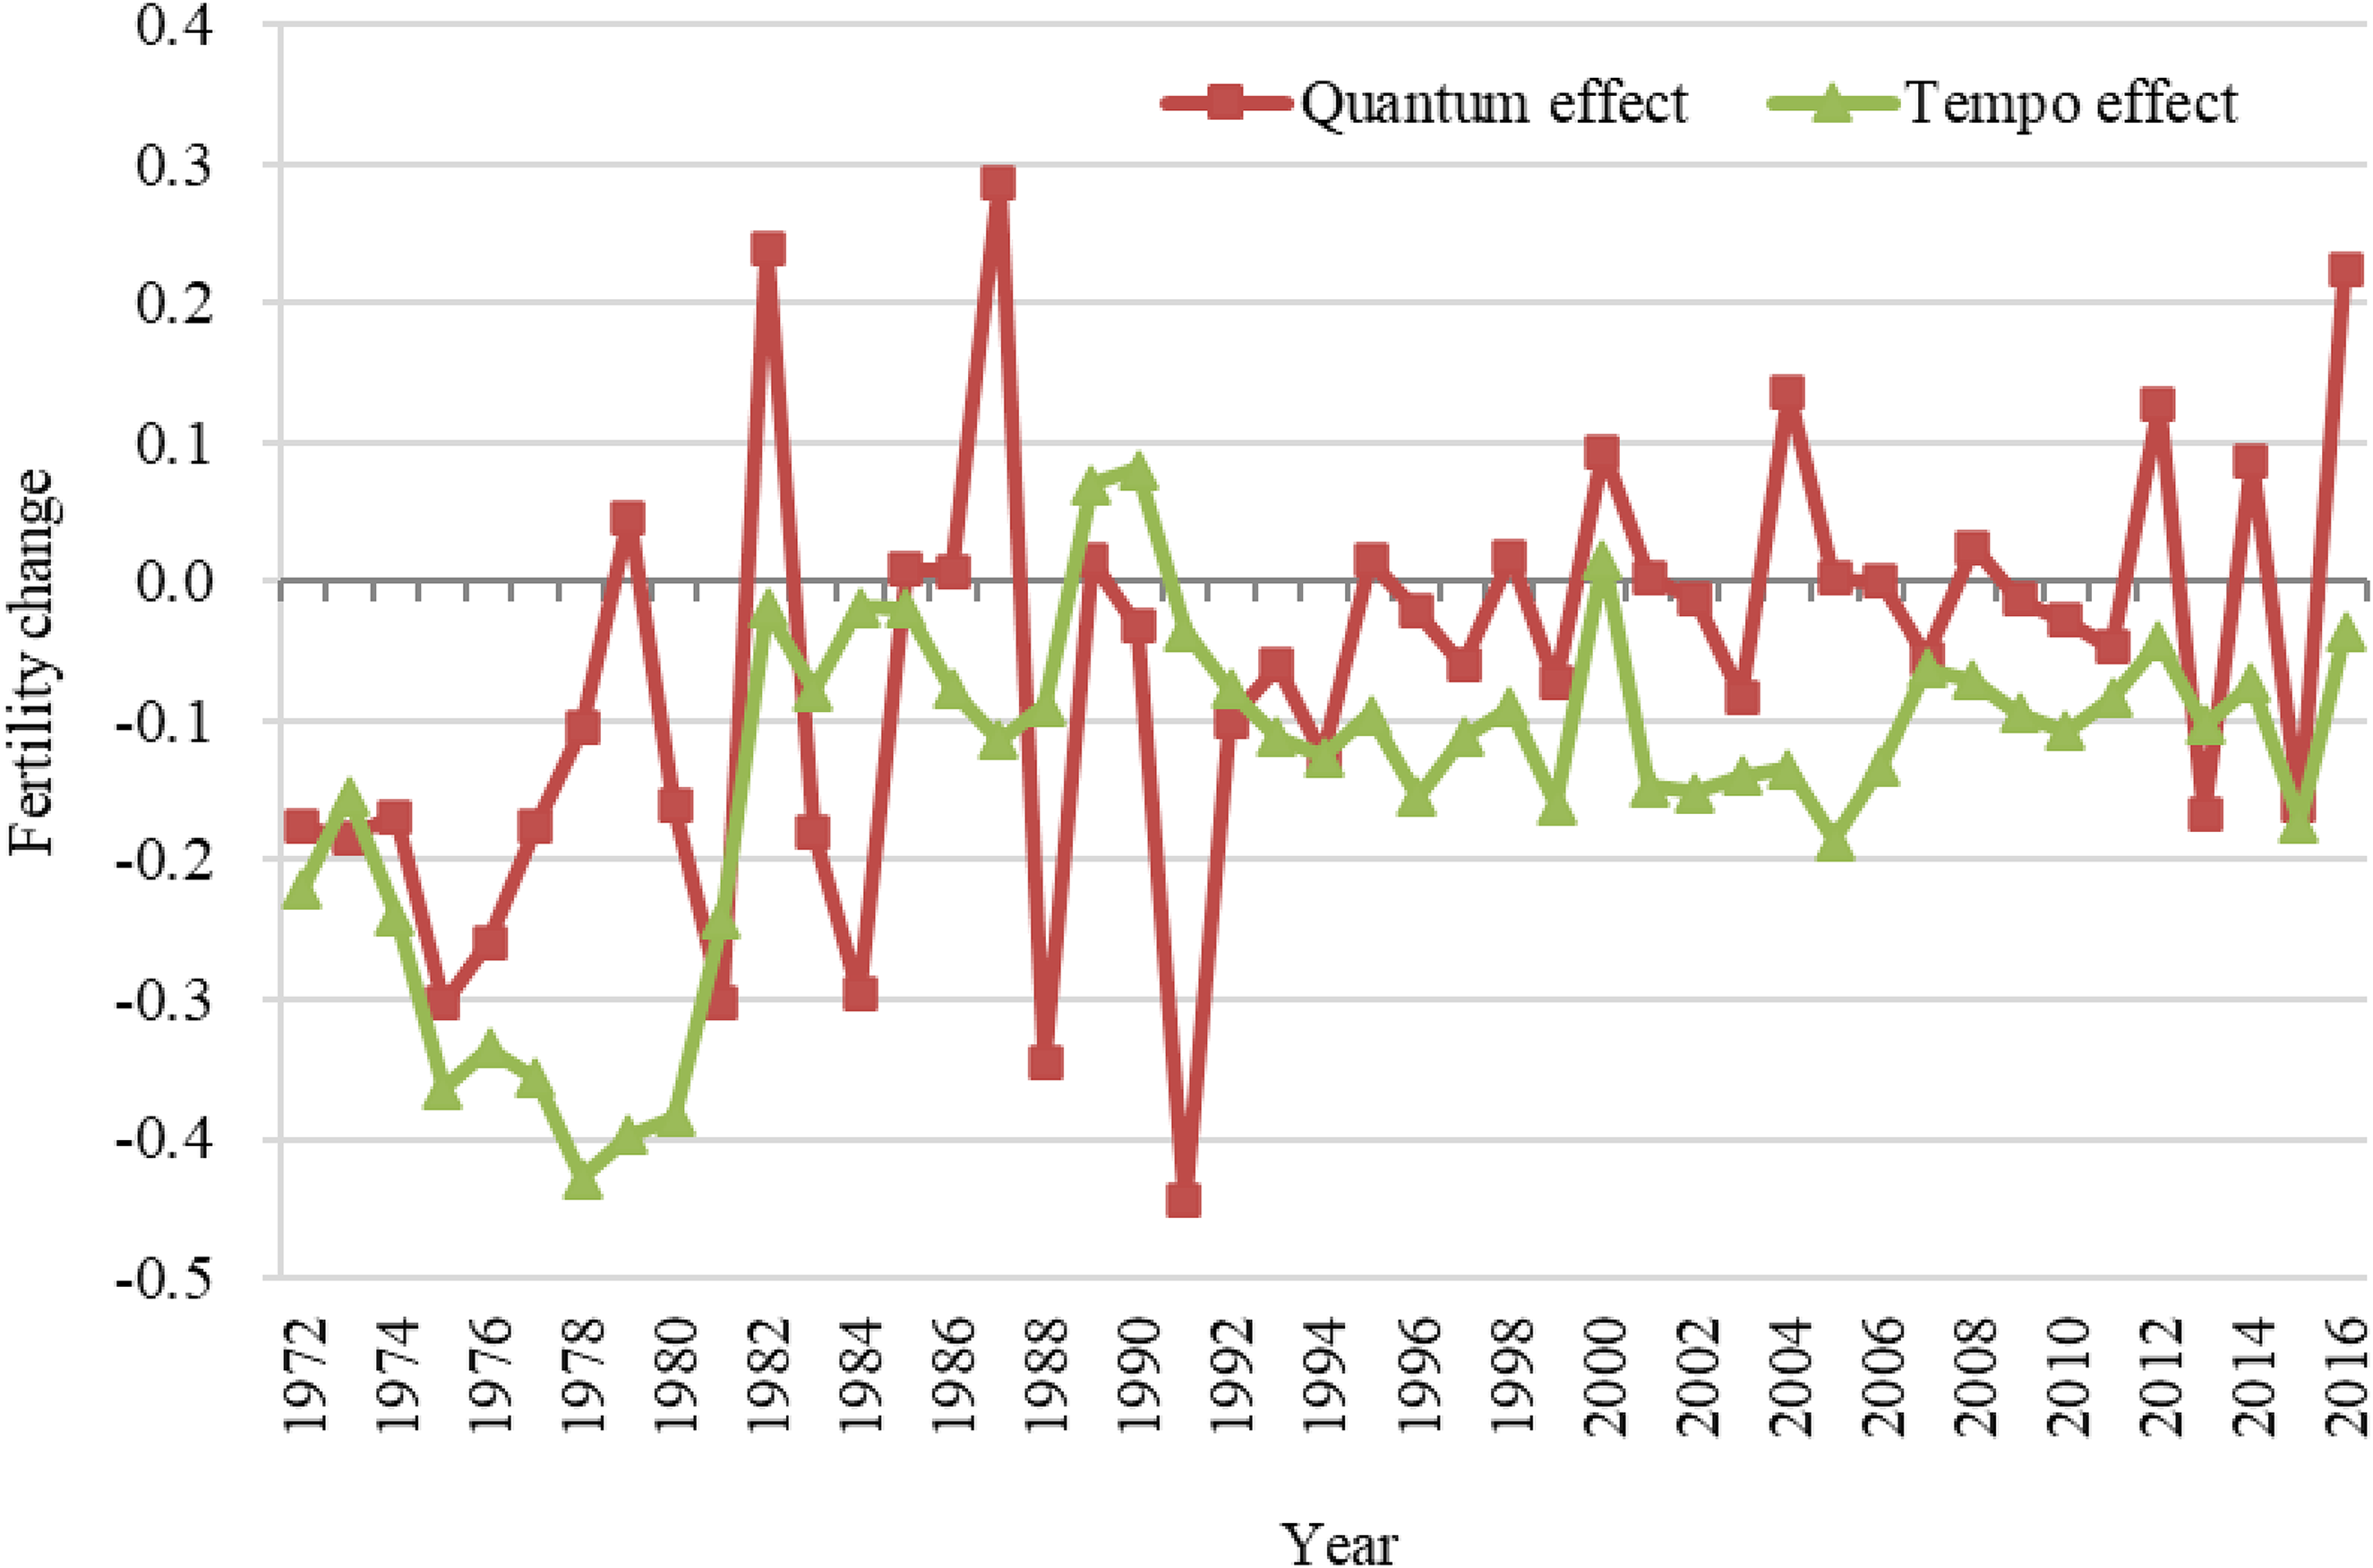
Quantum and tempo effects in fertility transition in China, 1972–2016.
Over the past five decades, with a few exceptions, the effect of tempo on fertility in China has consistently decreased. If the values are averaged over a decade, then both quantum and tempo effects contributed to the decline in fertility in the 1970s, 1980s, and 1990s. In the 2000s and 2010s, the quantum effect reversed to promote a rise in fertility, although the tempo effect continued to depress fertility to a greater extent than the quantum effect increased it. In the 1970s, China's fertility rate underwent an unprecedented decline, in which the average annual quantum effect reduced the fertility rate by 0.165 and the tempo effect by 0.312, with the quantum effect accounting for one-third (34.6%) and the tempo effect two-thirds (65.4%) of the fertility reduction. By the 1980s, fertility rates fluctuated with little decline. The average annual quantum effect reduced the fertility rate by 0.073 and the tempo effect by 0.097. The quantum effect accounted for 42.8% of the variance, whereas the tempo effect accounted for 57.2%. By the 1990s, the quantum effect (50.1%) and the tempo effect (49.9%) were almost equal, and both the quantum and tempo effects reduced the fertility rate by 0.088. From the 1970s to the 1990s, in terms of the decline in China's fertility, the quantum effect gradually increased, while the tempo effect constantly declined, but both played important roles in the decline of fertility. Since 2000, these two effects on China's fertility have changed; the tempo effect continues to reduce fertility, while the quantum effect has increased it. However, the quantum effect weakened at this time, and the fertility change was dominated by the tempo effect. In the 2000s, the quantum effect caused the average annual fertility rate to rise by 0.0098, although the tempo effect caused the average annual fertility rate to fall by 0.11. In the 2010s, the quantum effect caused the average annual fertility to rise by 0.0049 and the tempo effect caused the average annual fertility to fall by 0.088. The contradictory trends of the quantum and tempo effects on fertility in the past two decades are largely a result of the increasing relaxation of birth policies and the tremendous rise in the educational level of young women in China.
Impacts of education on fertility in China
The major changes in marriage and fertility in China over the past decade, particularly the dramatic decline in the total first marriage rate and total first-child fertility rate, are directly related to the rising educational level of Chinese women. Since the expansion of higher education in China in the late 1990s, both sexes have seen a rapid rise in educational attainment, although women's educational attainment has risen faster than that of men—the 2020 census shows that women in younger age groups have now surpassed men in educational attainment. Table 2 shows the sex ratio (number of men for every 100 women) of the population aged 20–34 at different levels of higher education. The sex ratio for all ages was well above 100 in 2000 and fell sharply over the next two decades. By 2020, the sex ratio at the 2- or 3-year non-degree diploma level (zhuanke) was almost balanced, while the ratios at both the undergraduate and postgraduate levels were well below 100, indicating a clear female advantage in higher education. As the fertility of women with higher education is lower than that of women with a lower level of education, the expansion of higher education has inevitably led to a decline in fertility.
Sex ratio of the population at ages 20–34 by levels of higher education in China, 2000–2020.
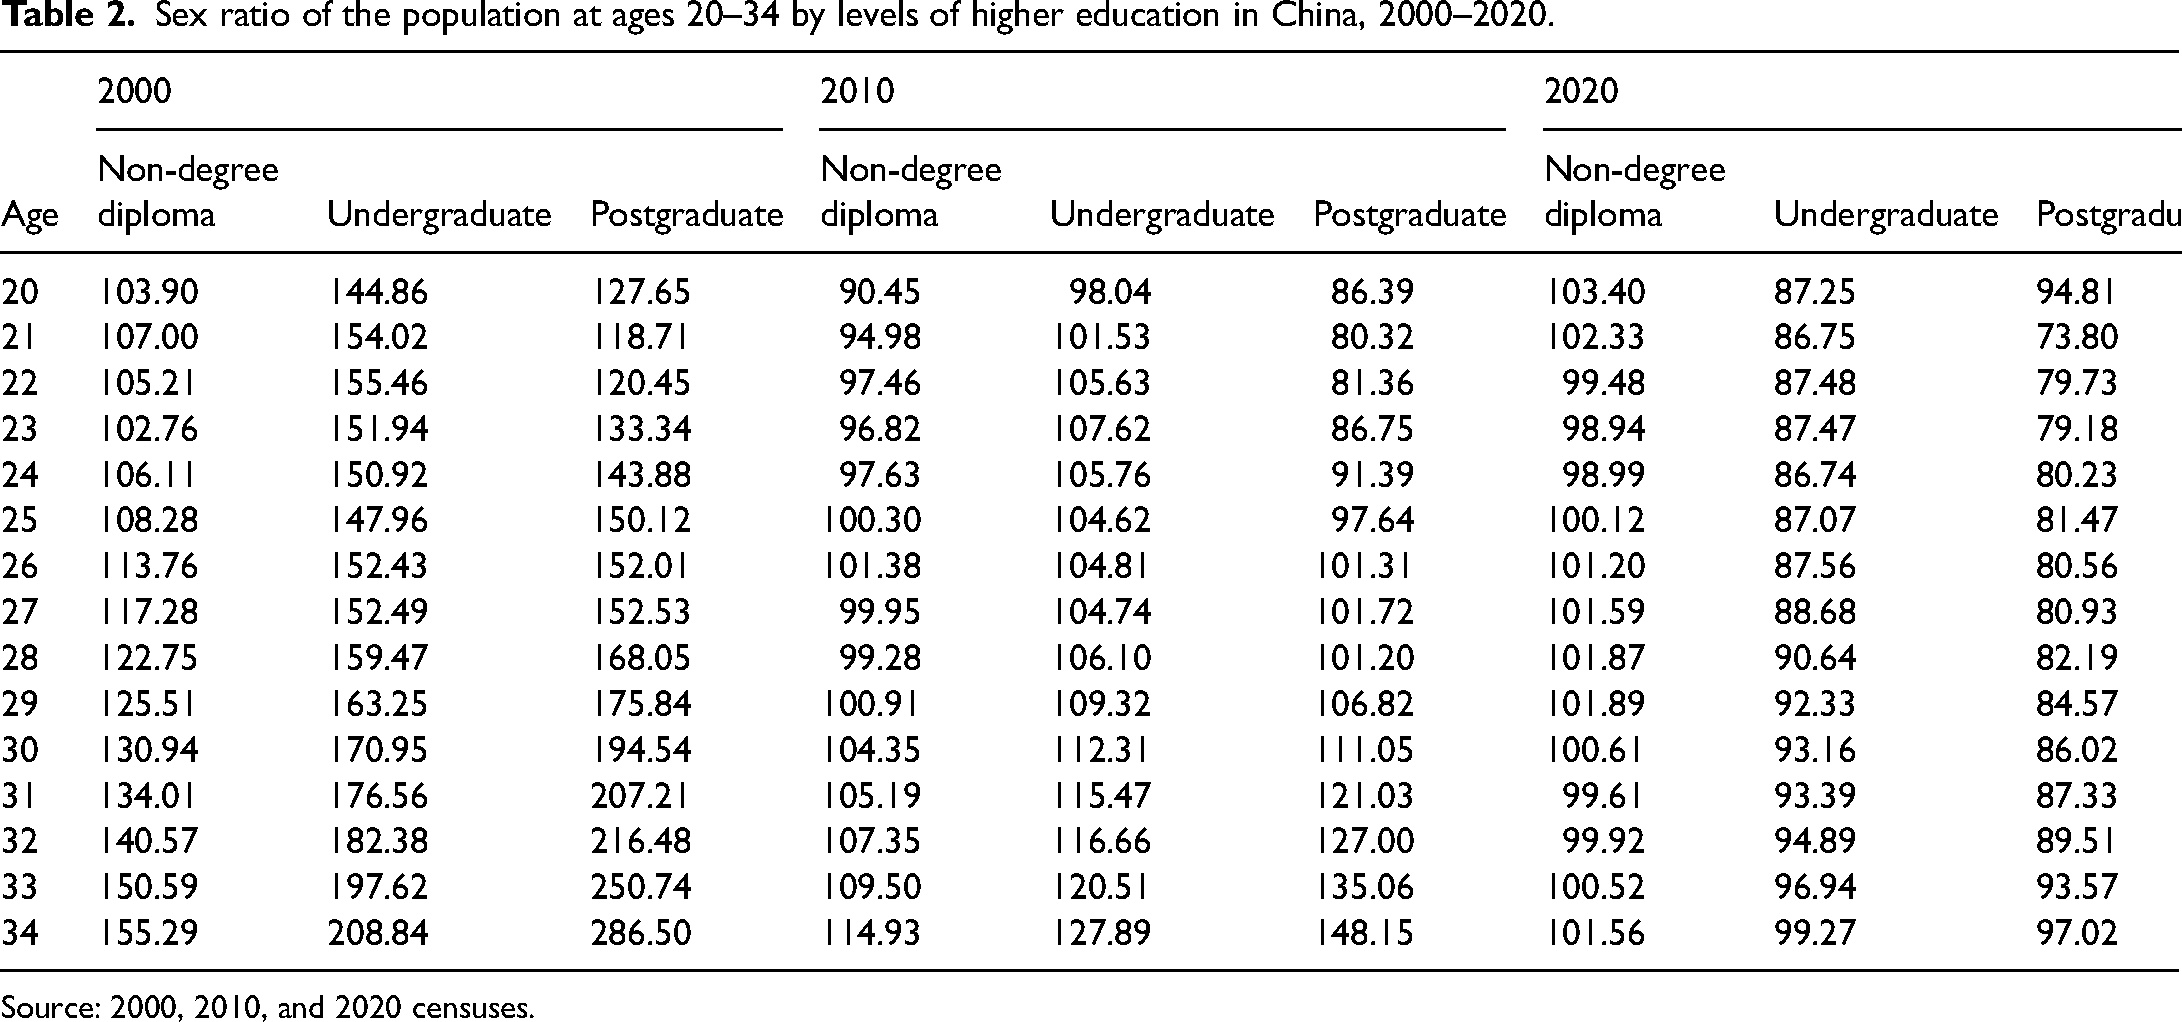
Source: 2000, 2010, and 2020 censuses.
However, the fertility of women at all levels of education is changing (Figure 8). Since 1990, China's fertility rate has continued to decline and remains low, as reflected in the decline in fertility rates at all levels of education. A large fertility decline occurred in the 1990s for women at all levels of education, although this decline was greater among women with lower levels of education (illiteracy, primary school, and secondary school). In the 2000s, except for illiterate women, fertility increased by varying degrees at all educational levels, with the largest increase occurring among women with primary school and junior high school educations. The most significant change between 2010 and 2020 was that the fertility rate of women with the lowest education levels was no longer the highest relative to other levels of education. While the fertility rates of women with lower levels of education (illiteracy, primary and secondary school) have declined significantly, those of women with higher levels of education (high school, non-degree diploma, and bachelor's degree and above) have not declined or have even increased slightly. The changes in fertility rates by education between 1990 and 2020 have much to do with the strengthening of fertility policies in the 1990s, the relaxation of fertility policies since 2000, and the substantial increase in female educational attainment over the past several decades.
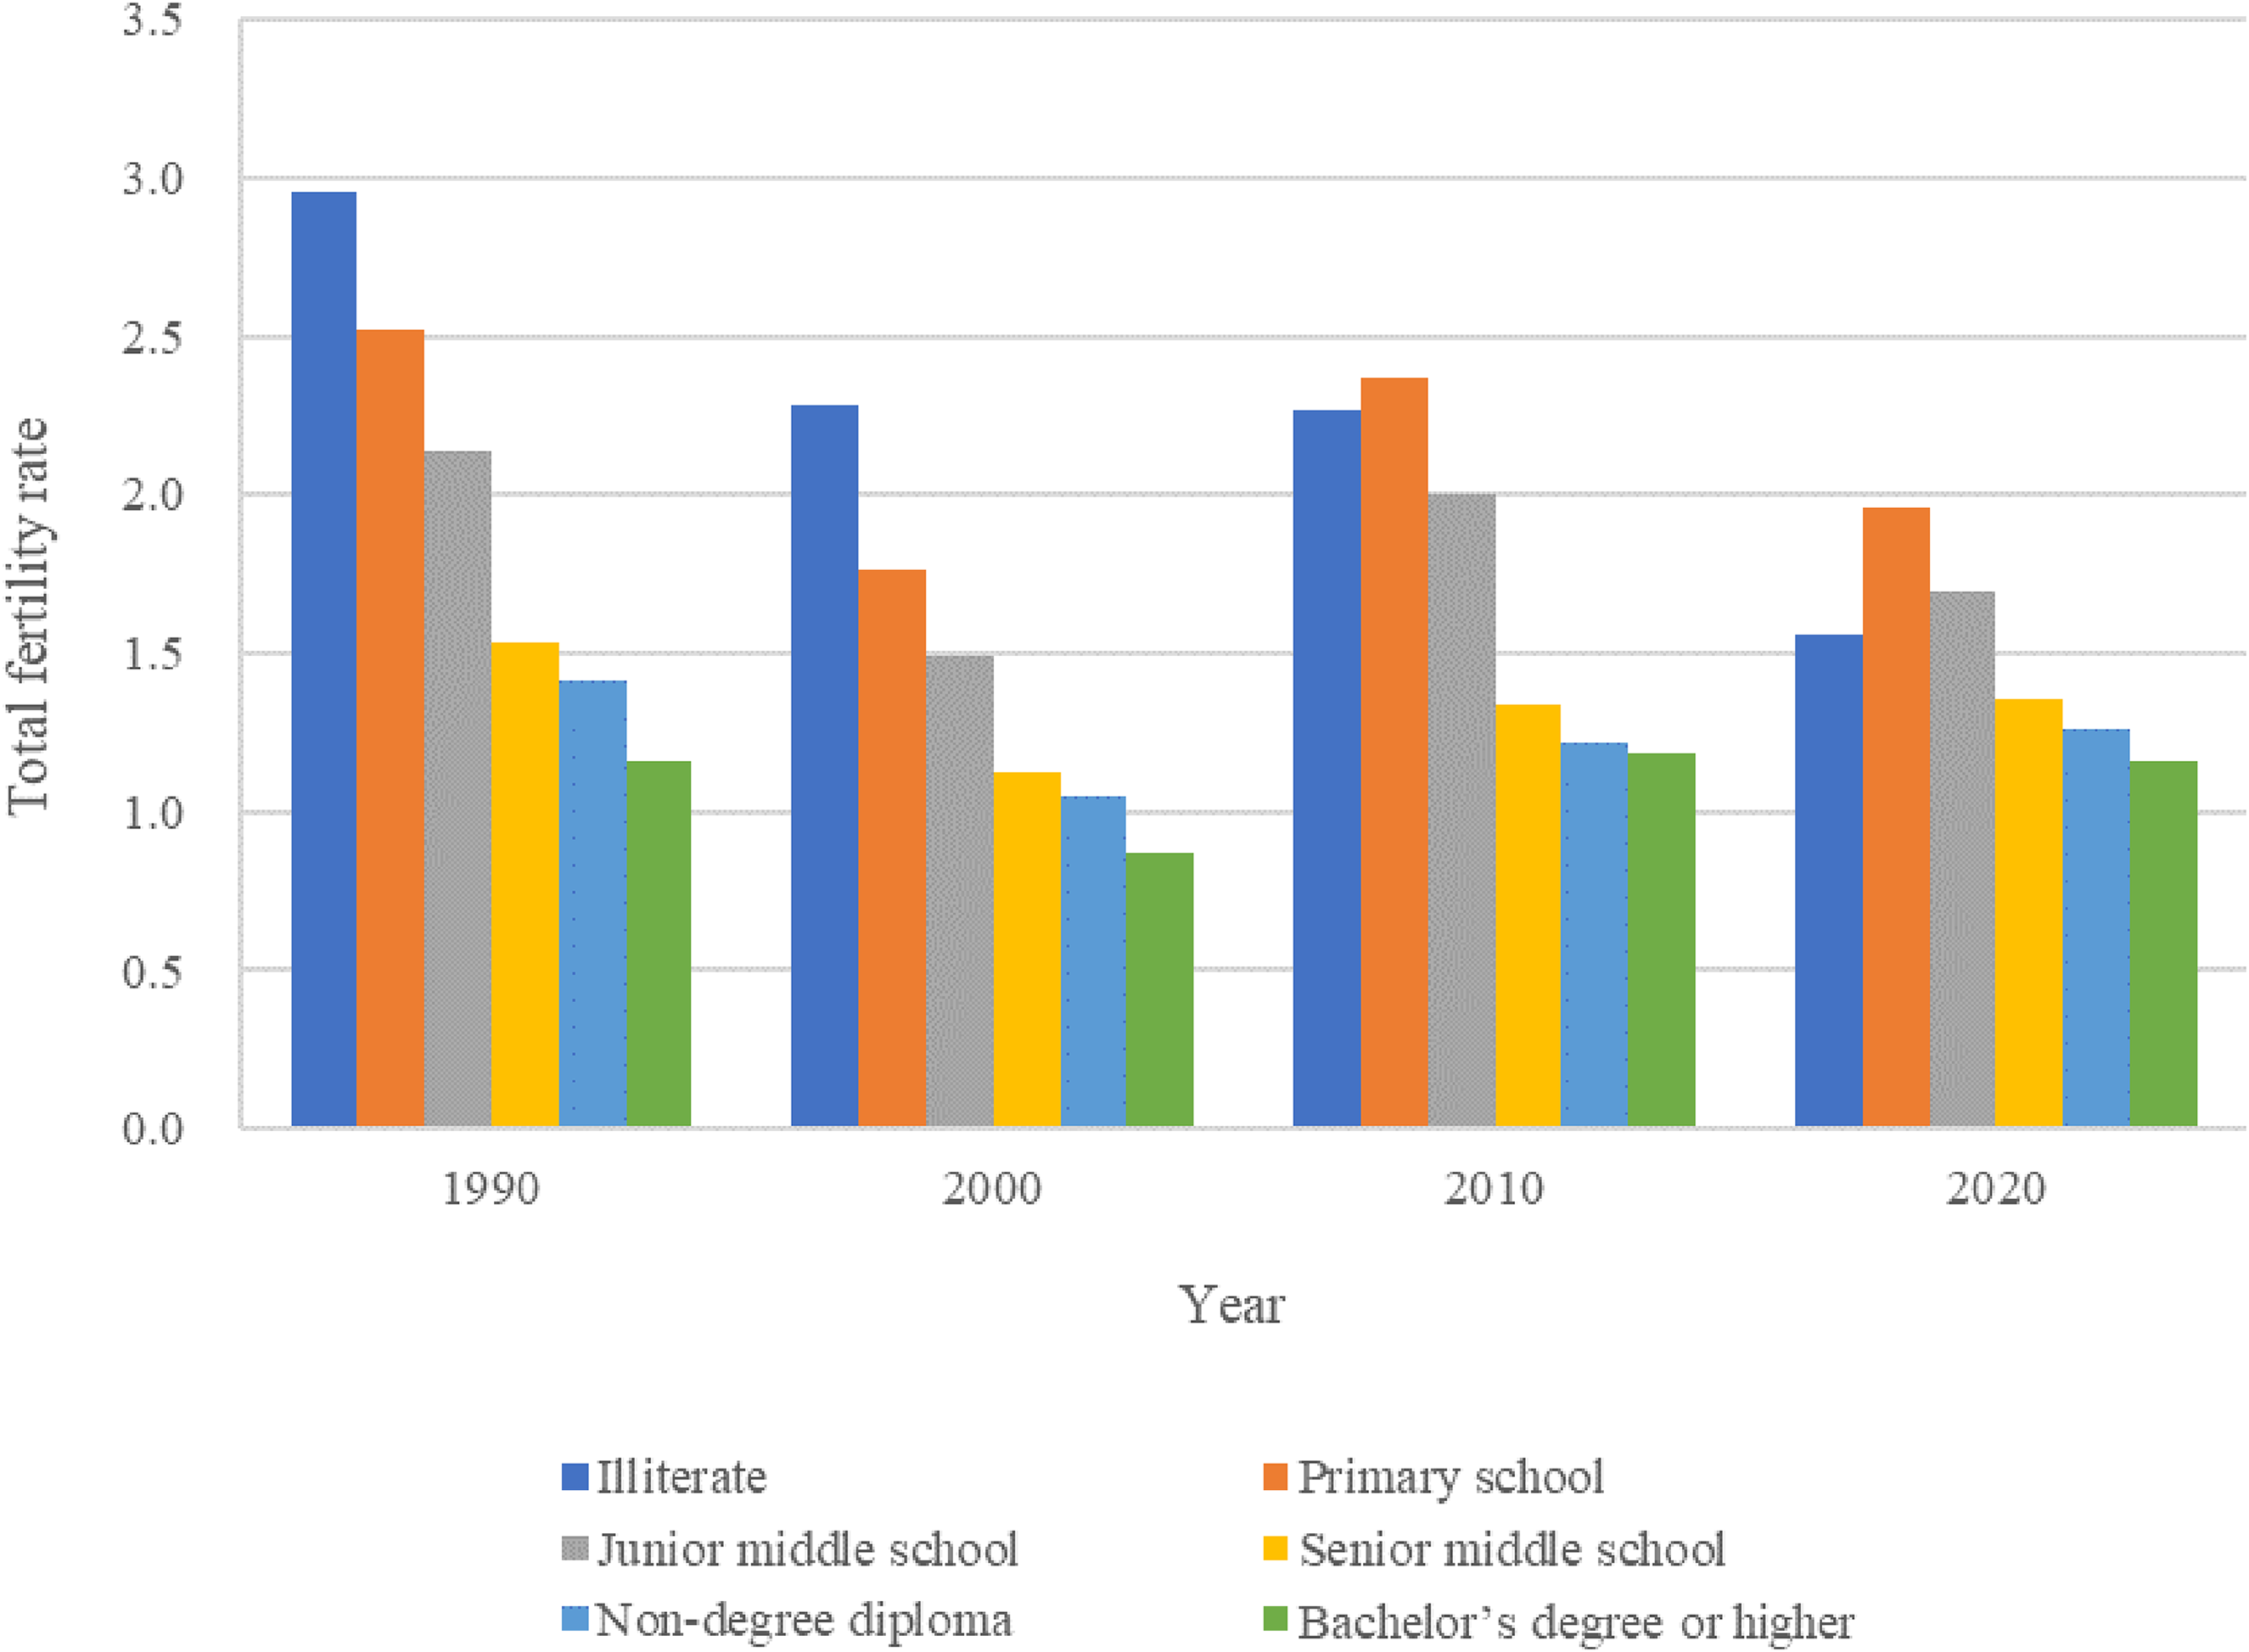
Total fertility rate by education in China: 1990–2020. Source: 1990, 2000, 2010, and 2020 censuses.
To quantify the impact of changes in the gender structure of education on fertility, we decomposed fertility changes in 1990–2000, 2000–2010, and 2010–2020 into the impact of fertility levels and education structure. 8 We used data on fertility by education and age distribution by education from the 1990, 2000, 2010, and 2020 censuses. Figure 9 shows the decomposition results.
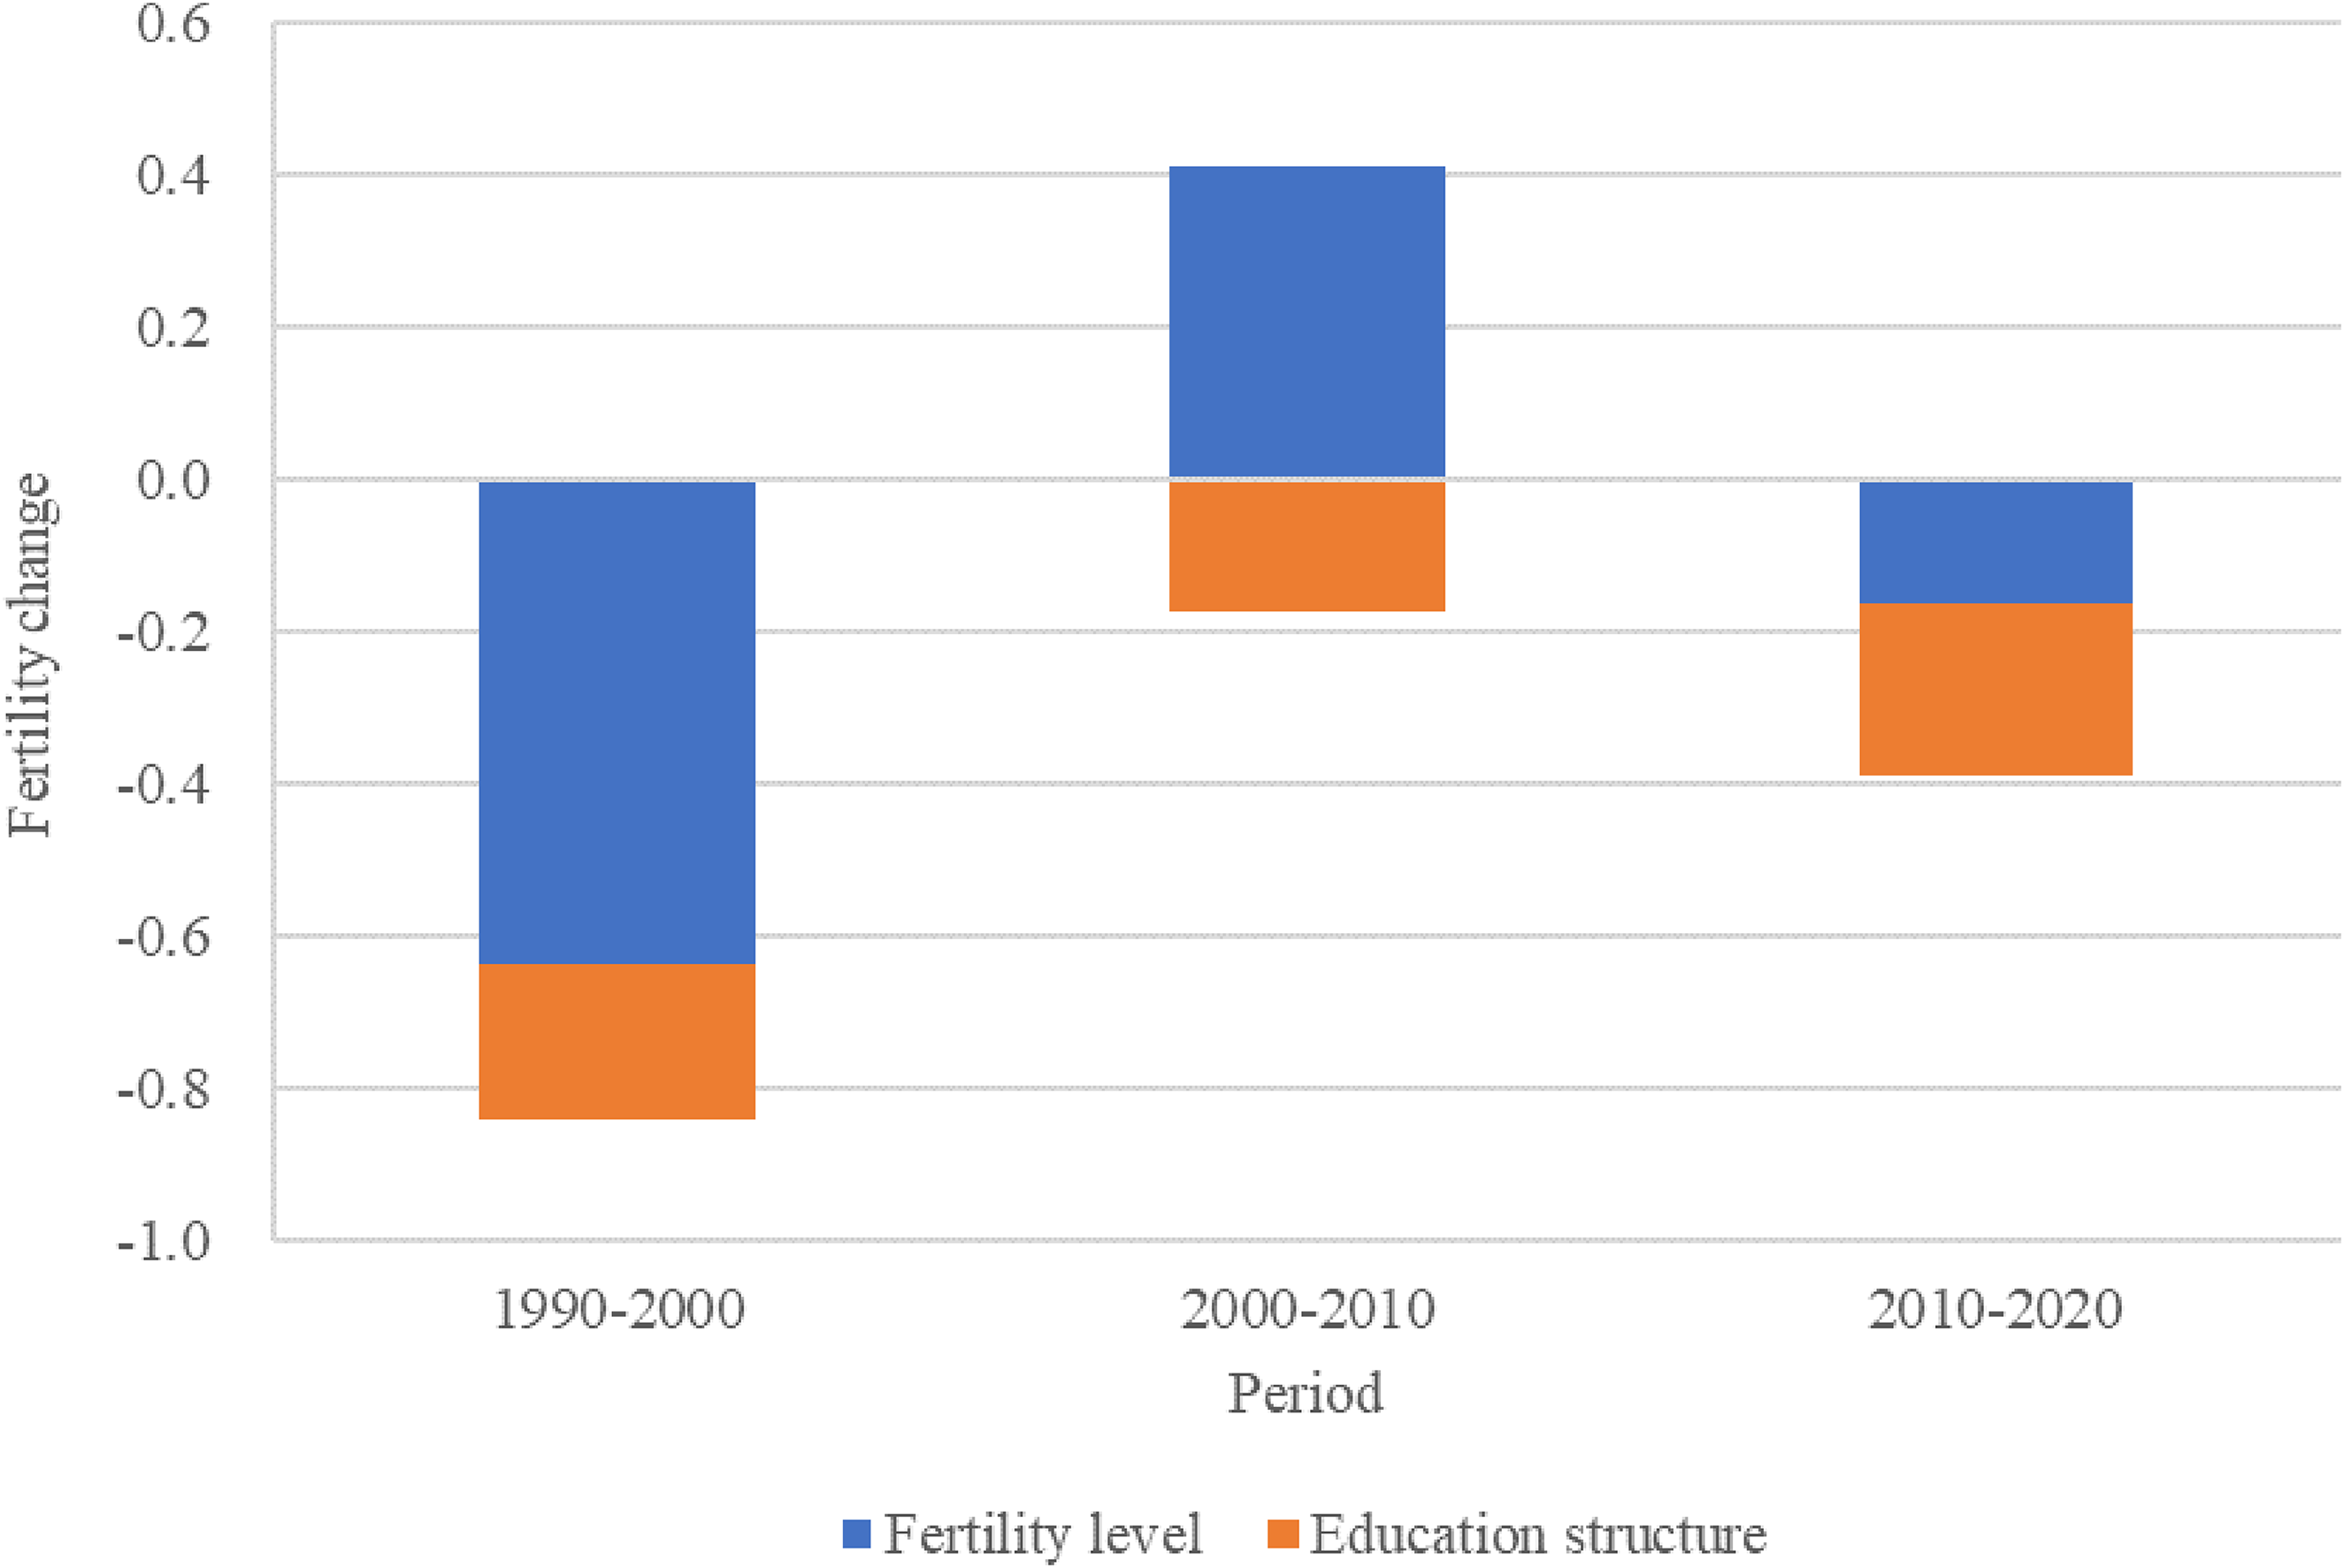
Fertility decomposition over 1990–2000, 2000–2010, and 2010–2020: impact of fertility level and education structure. Source: 1990, 2000, 2010, and 2020 censuses.
China's TFR dropped from 2.29 in 1990 to 1.45 in 2000, a decrease of 0.84. Decomposition shows that the fertility decline of women across all levels of education caused a reduction in TFR of 0.64, while the change in education structures was responsible for a reduction of 0.20, that is, the role of changing education structures accounted for one-quarter of the decline in fertility in the 1990s. China's TFR rose to 1.68 in 2010, 0.23 higher than in 2000, entirely due to rising fertility rates among women with different levels of education (up by 0.40), while changing education structures continued to reduce fertility (down by 0.17). In 2020, China's TFR dropped to 1.30, and the effect of the change in the education structure reached nearly 60%, reducing the fertility rate by 0.23, and the fertility level dropped by 0.16. Hence, changes in the structure of education over the past 30 years have contributed to the decline in fertility, and its role is increasing.
Discussion and conclusion
In the past half century, fertility in China has experienced an extraordinary transformation and decline, and the fertility pattern has undergone fundamental changes in which China's family planning policy has always played a very important role. In the 1970s, the “later, longer, fewer” policy reduced fertility through both quantum and tempo effects. Simultaneously, the average age of Chinese women at first marriage increased significantly, and the total first marriage rate decreased markedly, which also produced a strong tempo effect on fertility decline. In the 1980s, owing to the amendment of the Marriage Law and reform of the rural economy, the tempo effect on the decline in fertility was greatly weakened, and there were many years in which the quantum effect contributed to the increase in fertility. With the further strengthening of family planning in the 1990s, the quantum effect of fertility decline was apparent in the early 1990s, whereas the tempo effect was more obvious in the late 1990s. Since 2000, the main reason for continued low fertility has been the tempo effect, whereas the quantum effect has been very low. Under the influence of various period factors, although the tempo effect consistently depressed the fertility rate, the quantum effect fluctuated substantially, as in the 1980s. In years with fertility rises owing to factors such as zodiac-related preferences for childbirth and the two-child policy, the quantum effect caused the fertility rate to rise. In fact, since 2000, the marriage delay of Chinese women has further intensified, especially in the past 10 years; the average age at first marriage has risen by 3 years, and the total first marriage rate has dropped dramatically, which has a strong tempo effect on reducing the fertility rate. However, under the influence of certain major events, the overall fertility rate has not fallen, but risen. The renewed rapid decline in fertility since 2017 demonstrated a strong tempo effect. Over the past five decades, except for a few years, the tempo effect has always been an important factor in China's declining and sustained low fertility, whereas the quantum effect sometimes inhibits and sometimes increases fertility, depending on the influence of different factors in different periods with no systematic trend. In addition, the three stepwise downward jumps in fertility decline suggest a strong intergenerational transmission of fertility intention and fertility decline. In fact, the post-1970, post-1990, and post-2010 birth cohorts, as the children of the previous generations, have been affected by different birth policies in different eras, which have variously been strengthened and relaxed, and have also encountered different levels of and prospects for economic growth, which has shifted from rapid- to moderate- and low-speed. Therefore, China's fertility rate has shifted from low to very low and then extremely low levels.
The same low fertility rates can have rather different structural characteristics. Compared with low-fertility developed countries, a prominent feature of China's fertility structure is that the proportion of first-child fertility is much higher, whereas the proportions of childlessness and of having two or more children in developed countries are significantly higher than in China. From the 1990s to the middle of the 2000s, the first-child fertility rate in China was 0.6–0.7, and the second-child fertility rate was 0.23–0.32. In developed countries, the first- and second-child fertility rates were approximately 0.5 and 0.35, respectively. However, over the past 10 years, China's birth rate structure has changed dramatically. With the decline in the first-child fertility rate and rise in the second-child fertility rate, the birth rate structure has become similar to that in developed countries. Nevertheless, Chinese women are postponing marriage and childbirth to a lesser extent than their counterparts in developed countries. Although the peak fertility age group in China has gradually been delayed to those aged 25–29 since 2006, the peak age group in most developed countries is those aged 30–34, and their fertility age pattern is closer to the normal distribution. Although the average age at first birth among Chinese women is lower than that of women in Western and Northern European countries, the average age of second births is similar (30–33). The long interval between the first two births in China, which was associated with the birth-spacing controls stipulated by the family planning policy, decreased with the removal of such restrictions.
In recent years, with the loosening of family planning policies, even to the point of there being almost no restrictions, China's fertility has continued to fall to an extremely low level, and the marriage rate has dropped considerably. The most important reason for this is the continuous increase in women's years of schooling; the proportion of women in higher education has risen rapidly, surpassing that of men. The result has been an unprecedented decline in the rates of first marriage and first births. Changes in the gender structure of education in China have contributed to declining fertility rates, and 60% of the decline in fertility over the past decade can be attributed to changes in the structure of women's education. Half of young women aged 20–29 have at least an undergraduate degree, compared with 42% of men. More than half of the higher-education population in the same age range is female. Increasing access to higher education has led to significant changes in women's willingness to marry and have children and their resulting behaviors. The improvement in education level and the extension of time spent in schooling objectively delay marriage and childbirth, resulting in a decline in the period of fertility. More importantly, education, as an important channel by which to improve human capital, increases expected income in the labor market, but at the same time intensifies competition in the labor market, resulting in a crowding-out effect on marriage and fertility. Education also changes preferences for marriage and childbearing, especially for women. The improvement in education can help break down the traditional gender division of labor in the family and allows women to become more economically independent. Simultaneously, the material and opportunity costs of childbearing and rearing increase, while the benefits of alternatives to marriage and childbearing become more attractive. Marriage and childbearing are not inevitable choices in life, and life options outside of marriage and childbearing are increasingly attractive. In addition, with the maturation of the post-1990 and post-2000 birth cohorts, a new generation of people is contemplating the prospect of marriage and childbearing on the basis more open and diversified ideas, and their acceptance of non-traditional marriage is also increasing. Premarital cohabitation is also becoming more common and attitudes toward out-of-wedlock births are becoming more tolerant (Yu and Xie, 2019).
Broadly speaking, China's changing fertility patterns have been also substantially influenced by other structural changes in China, including the economic and urbanization booms. Four decades of rapid economic growth, wealth accumulation, and rising income have contributed to the radical changes in fertility patterns in China. China's economic growth has been among the fastest in the world over the past several decades. When the fertility rate reached replacement level, the per capita GDP in some developed countries was over 20–30 times that of China. However, compared to when the fertility rate reached extremely low levels (a TFR of around 1.3–1.4), China's per capita GDP is still relatively low compared to other developed countries, but this gap has narrowed to only two- to three times. Meanwhile, the employment rate of Chinese women has been consistently among the highest levels in the world. Economic development and increased income have led to a significant increase in the cost of childbirth, including opportunity costs. Women's work–family conflicts have become increasingly severe, especially for women with higher levels of education, which suppresses fertility rates.
In the 1980s China's urbanization rate was only half the global average; now it is higher, with nearly two-thirds of the population living in cities and towns. China's urbanization has been largely driven by rural-to-urban migration, with 380 million migrants living mainly in eastern China, where fertility rates are much lower. The fertility rate of the migrant population is considerably lower than that of the non-migrant population. On the one hand, there are a large number of couples separated in the floating population, and also a lot of divorce; on the other hand, rural migrants have taken up non-agricultural jobs in cities and coastal areas, resulting in significant increases in income and living costs, and greater freedom from parental control when it comes to marriage and childbirth.
China's economic development and urbanization have led to substantial changes in family structure. The seventh China population census data show that, in 2020, one-person households accounted for one-quarter of China's total households, while two-person households accounted for 30%. Thirty-five million young people aged 15–34 live alone, and the proportion of young people living alone has reached 10%. China has historically advocated family life, but nowadays young people have a strong desire to live independently and are not bound by traditional ideas. Especially for the post-1990 and post-2000 birth cohorts, who are currently at the age of marriage and childbirth, most are children who grew up only in the stage of rapid economic growth after reform and opening up, with high material requirements. However, their marriage and fertility behavior occurred during the transitional period after rapid economic growth, characterized by high consumption desire but low economic ability, which brings obstacles to marriage and fertility. This is an important factor in the decline in marriage and fertility rates in recent years.
Looking ahead, experiences from low-fertility countries could shed important light on China's future fertility trends. Fluctuating, rather than stable, low fertility rates have been a common feature of low-fertility countries for the past two to three decades. Not only does the level of low fertility in different countries vary greatly, but so do the fluctuations in low fertility. Recently, some countries with long-term fertility rates below 1.3 have rebounded to rates of around 1.7. Furthermore, there are countries with overall low fertility rates that have been relatively high (above 1.8) for decades but which have shown sustained declines in recent years. China's future fertility rate will also fluctuate, which will mainly be determined by economic development and social changes, economic and social policies to support fertility, and of course, cyclical fluctuations in population reproduction. The sharp decline in fertility since 2017 is similar to the reduction in the 1990s. China's fertility is expected to remain extremely low for the next 5 to 10 years and then to recover somewhat, repeating cyclical fluctuations. However, future cyclical swings will likely be less dramatic than they are currently.
The experience of countries with low fertility shows that continuous delay in the age of marriage and childbearing is the main reason for the decline in fertility, and this effect can suppress fertility for decades. Compared with developed countries with low fertility, the ages at first marriage and first birth of Chinese women remain low, and there is considerable room for improvement in the future. Owing to the progressive and strong relationship between marriage and childbirth in China (and in East Asian countries generally), the delaying effect will have a stronger inhibitory effect on China's fertility rate than in Western countries.
The fertility intention of women of childbearing age in China is the lowest in the world, laying the foundation for an extremely low fertility rate in the future. Even countries such as Japan, South Korea, Spain, and Germany, which have fertility rates comparable to or even lower than China's current fertility rate, have fertility intentions that are much higher than those of China, and are all above the replacement level (Yu et al., 2021). According to the ratio of actual fertility in low-fertility countries relative to the desired fertility standing at 50%–80%, China's desired number of children is 1.8, and the actual fertility rate is likely to be 0.9–1.4. Thus, China's future fertility rate is also at risk of falling below 1. This risk increases if young people's willingness to have children declines further.
Footnotes
Declaration of conflicting interests
The author declared no potential conflicts of interest with respect to the research, authorship, and/or publication of this article.
Ethical approval
Not applicable as this study involves the analysis of secondary data.
Funding
The author disclosed receipt of the following financial support for the research, authorship, and/or publication of this article: This work was supported by the China Social Sciences Foundation, (No. 22AZD083).