
Abstract
Using data from the 1991–2009 China Health and Nutrition Surveys, this paper examines the temporal–spatial variation in the education gradient of body weight relative to height among Chinese adults, and how the variation is associated with levels of economic development. We find different variation patterns for men and women. For women, the education gradient in body weight shifted from being positive to being negative over time for China as a whole, as well as across regions with different levels of economic development. In contrast, for men, higher education remained consistently associated with higher body weight over the 18-year period studied in China as a whole, as well as across regions with different levels of economic development.
Introduction
The ‘obesity epidemic’, as many public health experts call it, initially occurring in the United States and other developed countries, has spread to many developing countries (Caballero, 2007; Prentice, 2006), including China (Gordon-Larsen et al., 2014; Xi et al., 2012). Despite its rise world-wide, obesity is not a phenomenon that affects all social groups in all countries. In a thorough review of studies published between 1933 and 1988, Sobal and Stunkard (1989) summarize two distinct patterns in the socioeconomic patterning of weight: in developing countries, the socioeconomic status (SES) gradient in body mass index (BMI) is generally positive – that is, a higher body weight relative to height tends to be associated with a person’s higher SES. In developed countries, on the other hand, this pattern is typically reversed, particularly for women. McLaren’s (2007) updated review of studies through 2004 arrived at essentially the same conclusion. The reversal pattern highlights the importance of the broader socioeconomic context, particularly the overall level of economic development, for determining the SES–BMI gradient at the individual level.
To date, there have been only a few studies (Deuchert et al., 2014; Kinge et al., 2015; Pampel et al., 2012) that comprehensively examined the transition of the SES–BMI gradient from being positive to being negative with economic development. While most of these studies found supporting evidence for the SES gradient reversal proposition, they relied primarily on cross-sectional data from various countries, consequently being subject to bias due to cross-border differences in genetic, institutional, and cultural settings. In this article, we take a significant step forward by investigating SES–BMI gradients among adults in a single large country, that is, China, where economic growth has not only been sustained at high levels but also been regionally uneven (Hauser and Xie, 2005). This context gives us a unique research opportunity, as we may observe the transition from a positive SES–BMI gradient to a negative SES–BMI gradient, as individual regions of China have reached particular levels of economic development. If the gradient becomes negative as a result of regional development level, is there a specific level of economic development at which the gradient shifts from being positive to being negative?
In this research, we focus specifically on education as a key component of SES that may influence body weight in adulthood. Education is a simple yet powerful measure of SES, because it: (1) can be measured for everyone, unlike occupation, income, or wealth; (2) is highly correlated with other SES measures, such as occupation and income; (3) is broadly stable across the life-course and thus may be more accurately reported by survey respondents than the more variable measures of income and wealth; and (4) is less likely than income and wealth to exhibit reverse causality for adults – that is, abnormal body weight in adulthood is less likely to cause lower education than to cause a loss in income, employment, or occupational standing (Averett and Korenman, 1999; Finkelstein et al., 2005; Morris, 2007; Shimokawa, 2008). Our empirical work is based on data from the China Health and Nutrition Survey ((CHNS) 1991, 1993, 1997, 2000, 2004, 2006, and 2009), a data set that is appropriate for our research. The CHNS offers a wide range of variables, spans a long time period, and covers broad regions in China that vary substantially in economic development. One study by Jones-Smith and her colleagues (2012a) addressed the question of temporal variation in the education gradient in overweight among Chinese adults. Although their study provided some evidence that educational disparities in overweight changed over time, like previous studies, it still treated China as a homogeneous entity and disregarded enormous regional variation in level of economic development at any given time. Our study contributes to the existing body of literature by simultaneously evaluating temporal and spatial variations in education–BMI gradients in China.
In the following sections, we first review theory and evidence about how economic development shapes the education–BMI gradient in body weight, then set out the conceptual framework underpinning our research. Next, we provide a description of the Chinese context. We then introduce data from the CHNS and our methodological approach. After this, we present our results concerning temporal and spatial variations in the education–BMI gradient among Chinese adults. Finally, we conclude with a discussion of our findings and their implications.
Theoretical background and previous studies
Economic development is a common goal pursued by policy-makers to improve general standard of living and population health. However, economic development can have unintended consequences, one of which may be an obesity epidemic and a widening obesity disparity that disadvantages low-SES individuals. Two major theoretical perspectives provide important explanations of why economic development leads to a negative association between body weight and SES: economic cost; and ideational change.
The economic cost perspective holds that the monetary costs of food consumption and caloric expenditure, as well as the health cost of excess weight, usually change with economic development, thereby creating changes in the educational gradient of BMI (Pampel et al., 2012). When a society is in an early stage of economic development, food shortages are common, work is mainly manual, and higher BMI represents a healthier status. Compared to the less educated, the more educated have easy access to adequate food (expensive processed food) and sedentary lifestyles. As a result, more-educated groups tend to have higher BMIs.
As a society industrializes, foods, especially calorie-dense ones, become cheaper through technological innovations in agriculture and food production (Cutler et al., 2003; Philipson and Posner, 2008), and workers move from manual employment involving physical exertion to office and professional work that does not require manual labor (Putnum et al., 2002). Therefore, people consume more and expend fewer calories and, consequently, get heavier. As a result, body weight has generally increased in most recent decades in many countries, especially developed countries, and a high weight no longer represents good health. With economic development, the health costs of obesity become more salient, particularly to the more educated. Compared to the less educated, highly educated persons have resources for avoiding overweight/obesity through better access to healthy diets, physical exercise, high-quality health care, and information on the health costs of unhealthy behaviors. Thus, a negative education–BMI gradient emerges as a society becomes industrialized. We label the shift of the education gradient in body weight from being positive to being negative resulting from economic development, the ‘education gradient reversal’.
The ideational change perspective claims that the cultural schema of ideal body type changes with economic development, giving rise to the shift of the education gradient in body weight (McLaren, 2007; Sobal and Stunkard, 1989). This viewpoint, to some extent, aligns with the propositions of the cultural model, ‘developmental idealism’ (Thornton, 2001, 2005). It assumes that, though at different speeds, human societies develop along a relatively uniform pathway, the apex of development being located in northwest Europe and its diasporas (particularly the United States). Tacit in this cultural model is the proposition that family systems in these areas are better and may, in fact, be causes (as well as consequences) of development at both individual and societal levels. This model also implies that such a system in northwest Europe could serve as a useful model for people in other societies. A broad definition of developmental idealism can include almost every dimension of life (Thornton, 2012). Except for marriage and family behaviors (Thornton, 2001; Thornton and Philipov, 2009), studies of both developed and developing countries show that many other dimensions of human behavior and relationships (Kavas, 2015; Kavas and Thornton, 2013; Thornton et al., 2015), including the maintaining of small body size in particular (Xu, 2016), have been influenced by the forces of developmental idealism. Originating from and now pervasive in the West, especially among women, is the new cultural perception that thinness is healthy, beautiful, and good while fatness is bad (Dornbusch et al., 1984; McLaren, 2007; Sobal and Stunkard, 1989). Through many different channels, such as television programs, the internet, and travel, this particular proposition of developmental idealism has been disseminated across and within societies around the world. It is possible that it has been accepted more readily in more developed areas than in less developed ones, given that economic development is often positively identified with the West. Because the highly educated can mobilize more resources and make their body weights conform to the socially or culturally desirable type, the education gradient reversal in body weight is likely to occur along with economic development.
Evidence on the relationship between economic level and education gradients in body weight, however, has remained ambiguous. Most relevant studies use one of the following two approaches: (1) cross-national (thus, spatial) comparison of socioeconomic patterning in body weight; or (2) temporal comparisons of socioeconomic patterning in body weight in a single population.
Using the first approach, research has found evidence in support of the education gradient reversal proposition (Martorell et al., 2000; Monteiro et al., 2004; Pampel et al., 2012; Roskam et al., 2010). For example, Pampel et al. (2012) described the associations of education with BMI, being overweight, and being obese across countries, and explored the contribution of level of socioeconomic development to cross-national differences in the associations of education with these outcomes. Cross-sectional data, based on self-reports, were derived from the World Health Survey from 67 countries during the 2002 and 2003 survey period. There is a positive relationship between education and BMI in low-income countries, but the relationship becomes negative in high-income countries. The patterns differed for men and women, with the shift from a positive to a negative relationship between education and weight occurring more clearly for women than for men (Jones-Smith et al., 2011; Pampel et al., 2012).
After pooling national cross-sectional data gathered between 1992 and 2000 on women of reproductive ages from 37 developing countries, Monteiro et al. (2004) utilized multilevel models to explore how the social distribution of obesity was modified by a country’s gross national product (GNP). Except for the shift of obesity towards the less educated with economic development, they further found that once a country’s GNP reached $2500 per capita, obesity began to be more common among the less educated than among the more educated. Through meta-analysis of studies between 2004 and 2010 on the obesity gradient, Dinsa et al. (2012) reported that among women, the reversal of the obesity gradient occurred at an even lower level of per capita income, a GNP per capita of about US$1,000. No clear switch-over occurred among men.
Using the second approach, past studies also have found evidence in support of the education gradient reversal proposition: the association of education with such measures as BMI, being overweight, and being obese becomes more negative with economic development. For example, Großschädl and Stronegger (2013) found that in Austria, data from Microcensus 1973, 1983, 1991, 1999 and the Austrian Health Interview Survey 2006–2007 revealed a progressive shifting in adults’ obesity toward the less educated. In other countries, such as Egypt, the association of education with body weight also became increasingly negative over time, especially in the case of women (Aitsi-Selmi et al., 2012; Gutiérrez-Fisac et al., 1996).
Recently, a number of studies based on data for the US and other developed countries have challenged the theoretical view that during periods of economic development, higher body weight becomes more common among less educated groups. Instead, they showed that obesity disparity by education narrows over time (Cook and Daponte, 2008; Himes and Reynolds, 2005; Singh et al., 2011; Zhang and Wang, 2004). Researchers attributed this narrowness to the gradual spread of obesogenic environments (e.g., calorie dense foods, sedentary lifestyles, and poor dietary habits), making it difficult for any education group to avoid obesity (Himes and Reynolds, 2005; McLaren, 2007).
Previous studies, based on either cross-national data or temporal comparisons are still inadequate for understanding whether and how the relationship between education and body weight is affected by economic development. First of all, cross-national comparisons suffer from lack of control for population-level genetic and cultural influences, or other unobserved differences between countries. Dinsa et al. (2012) claimed that the reversal of the obesity gradient for women may already take place at a lower per capita income level, compared to the income level found by Monteiro et al. (2004). Such a comparison may be not meaningful, due to several factors, including (1) inclusion of different countries, (2) reliance on different methodologies, and (3) varying survey time. Further, temporal comparisons based on repeated cross-sectional data in a single population typically suffer from a limited variation in levels of economic development, making it impossible to observe the education gradient in body weight to transition from being positive at lower levels of economic development to being negative at higher levels of economic development.
For these reasons, China provides a unique research opportunity for testing the education gradient reversal proposition. China as a whole was relatively poor only four decades ago, when incidences of overweight and obesity were relatively low, and education was positively associated with body weight. Over the course of China’s economic development, we should observe an increasing trend in incidences of overweight and obesity. Do we also observe an education gradient reversal in China, that is, a shift in the association between education and body weight from positive to negative in the same process? Not only will we answer this question through an analysis of data from repeated cross-sectional data, we will also capitalize on the uneven paces of economic development by region and construct a research design with contextual variation defined at both temporal and spatial levels. We ask whether conclusions drawn from the temporal perspective are consistent with those drawn from the spatial perspective. If they are, we can be more confident in the generalizability of the findings as well as the robustness of commonly used research methods in the literature.
A word is in order about our use of the term ‘gradient’. We are interested in systematic differences in body weight across different education groups. While we share the prevailing view in the literature that the predominant causal direction is likely for education to affect body weight (Brunello et al., 2013; Link and Phelan, 1995), we wish to take a more conservative approach in this study and focus on the observed association between education as an indicator of SES and BMI as a measure of body weight. Conceptually, education and BMI can potentially be associated for reasons other than direct causation. For example, they both could be caused by genetic traits or psychological traits. In this study, we are not able to disentangle causal effects of education from non-causal effects. Thus, although we `will report the coefficient of education in regression analysis as the ‘effect’ of education, we do so in terms of a descriptive meaning, because it is better interpreted as an association rather than as direct causation.
Chinese contexts and hypotheses
Since the beginning of the economic reforms in 1978, China has experienced unprecedented and continuous economic growth. From 1978 to 2010, its per capita gross domestic product (GDP) increased from 381 RMB yuan to 5594 inflation-adjusted RMB yuan, averaging an annual growth rate of 8.76% (National Bureau of Statistics of People’s Republic of China, 2011). Accompanying the rapid economic development has been the declining relative price of energy-dense foods (Lu and Goldman, 2010), the increasing penetration of physical inactivity environments (Ng et al., 2009), and the spread of the Western ideal of body shape (Luo et al., 2005; Xu, 2016). The prevailing dietary pattern in China is shifting away from high-carbohydrate foods toward high-fat, high-calorie foods (Du et al., 2004; Popkin and Du, 2003). In the meantime, with increased adoption of labor-saving devices for work and leisure, as well as the spread of motorized transportation, activities requiring physical exertion have also declined. For example, between 1991 and 2006, average weekly physical activity among Chinese adults fell by 32% (Ng et al., 2009). As a result of these changes, there has been a remarkable upward shift in population weight. The proportion of Chinese adults considered overweight or obese more than tripled from 8.1% in 1982 to 26.4% in 2009 (Ge et al., 1994; Xi et al., 2012).
Traditional Chinese culture favors large body size, as higher SES is perceived to be linked to higher BMI. Nevertheless, traditional Chinese values and beliefs about body image might have undergone changes as China has reopened to the outside world since the economic reform in 1978 and its people have gradually become more familiar with Western culture through transportation and telecommunication. Chinese who accept developmental idealism may view the sociocultural and personal tendencies in the West, including favoring a thin rather than a fat body, as the ideal objectives for China. Beyond individual values and behaviors, the Chinese government’s policies and propaganda may also facilitate the diffusion of the Western worldview that thinness is good, healthy, and beautiful. For example, on 25 October 2016, the Central Committee of the Communist Party of China and the State Council of China released the Blueprint of Healthy China 2030, and it clearly states that various programs promoting healthy diets and active lifestyles will be developed to slow the rise of overweight and obesity and reduce the health burden they are associated with. 1 Hence, in China, perceptions of thinness as a cultural symbol of beauty, good health, self-discipline, and sexual attractiveness have gained more and more acceptance (Luo et al., 2005). At present, the wording commonly used to describe fatness has gradually changed from ‘rich-like’ to ‘obesity,’ and this discrimination may reflect changes in the public’s attitudes toward fatness.
Along with these changes, economic development in China has been accompanied by greater longevity, which makes obesity’s cost in potential years of life more salient among large portions of the population, in particular the more educated. In an increasingly obesogenic environment, the more educated in China are better able to control their weight (Shimokawa et al., 2009) and achieve the Western ideal for body shape. Drawing on the abovementioned literature and applying it to the Chinese context, we derive the following hypothesis: Hypothesis 1: The effect of education on body weight (relative to height) will become increasingly negative over time in China. Hypothesis 2: Along the regional dimension, the effect of education on body weight (relative to height) will become increasingly negative at higher levels of economic development in China.
On the other hand, obesity is a source of stigma and bias, especially among women. In Western countries, thinness is considered a key feature of beauty among women but not among men (Haworth-Hoeppner, 2000). This Western sex-specific body shape ideal might have been disseminated to China through such channels as foreign media. Indeed, many recent studies in China have observed that thinness is conducive to acquiring good things, such as employment (Pan et al., 2011) and marriage entry (Xu, 2016), among women but not among men. Taken together, we arrive at the following two hypotheses: Hypothesis 3: The increasingly negative effect of education on body weight over time is more pronounced among women than among men. Hypothesis 4: Along the regional dimension, the increasingly negative effect of education on body weight with levels of economic development is more pronounced among women than among men.
A summary of studies on education and body weight among adults in China.
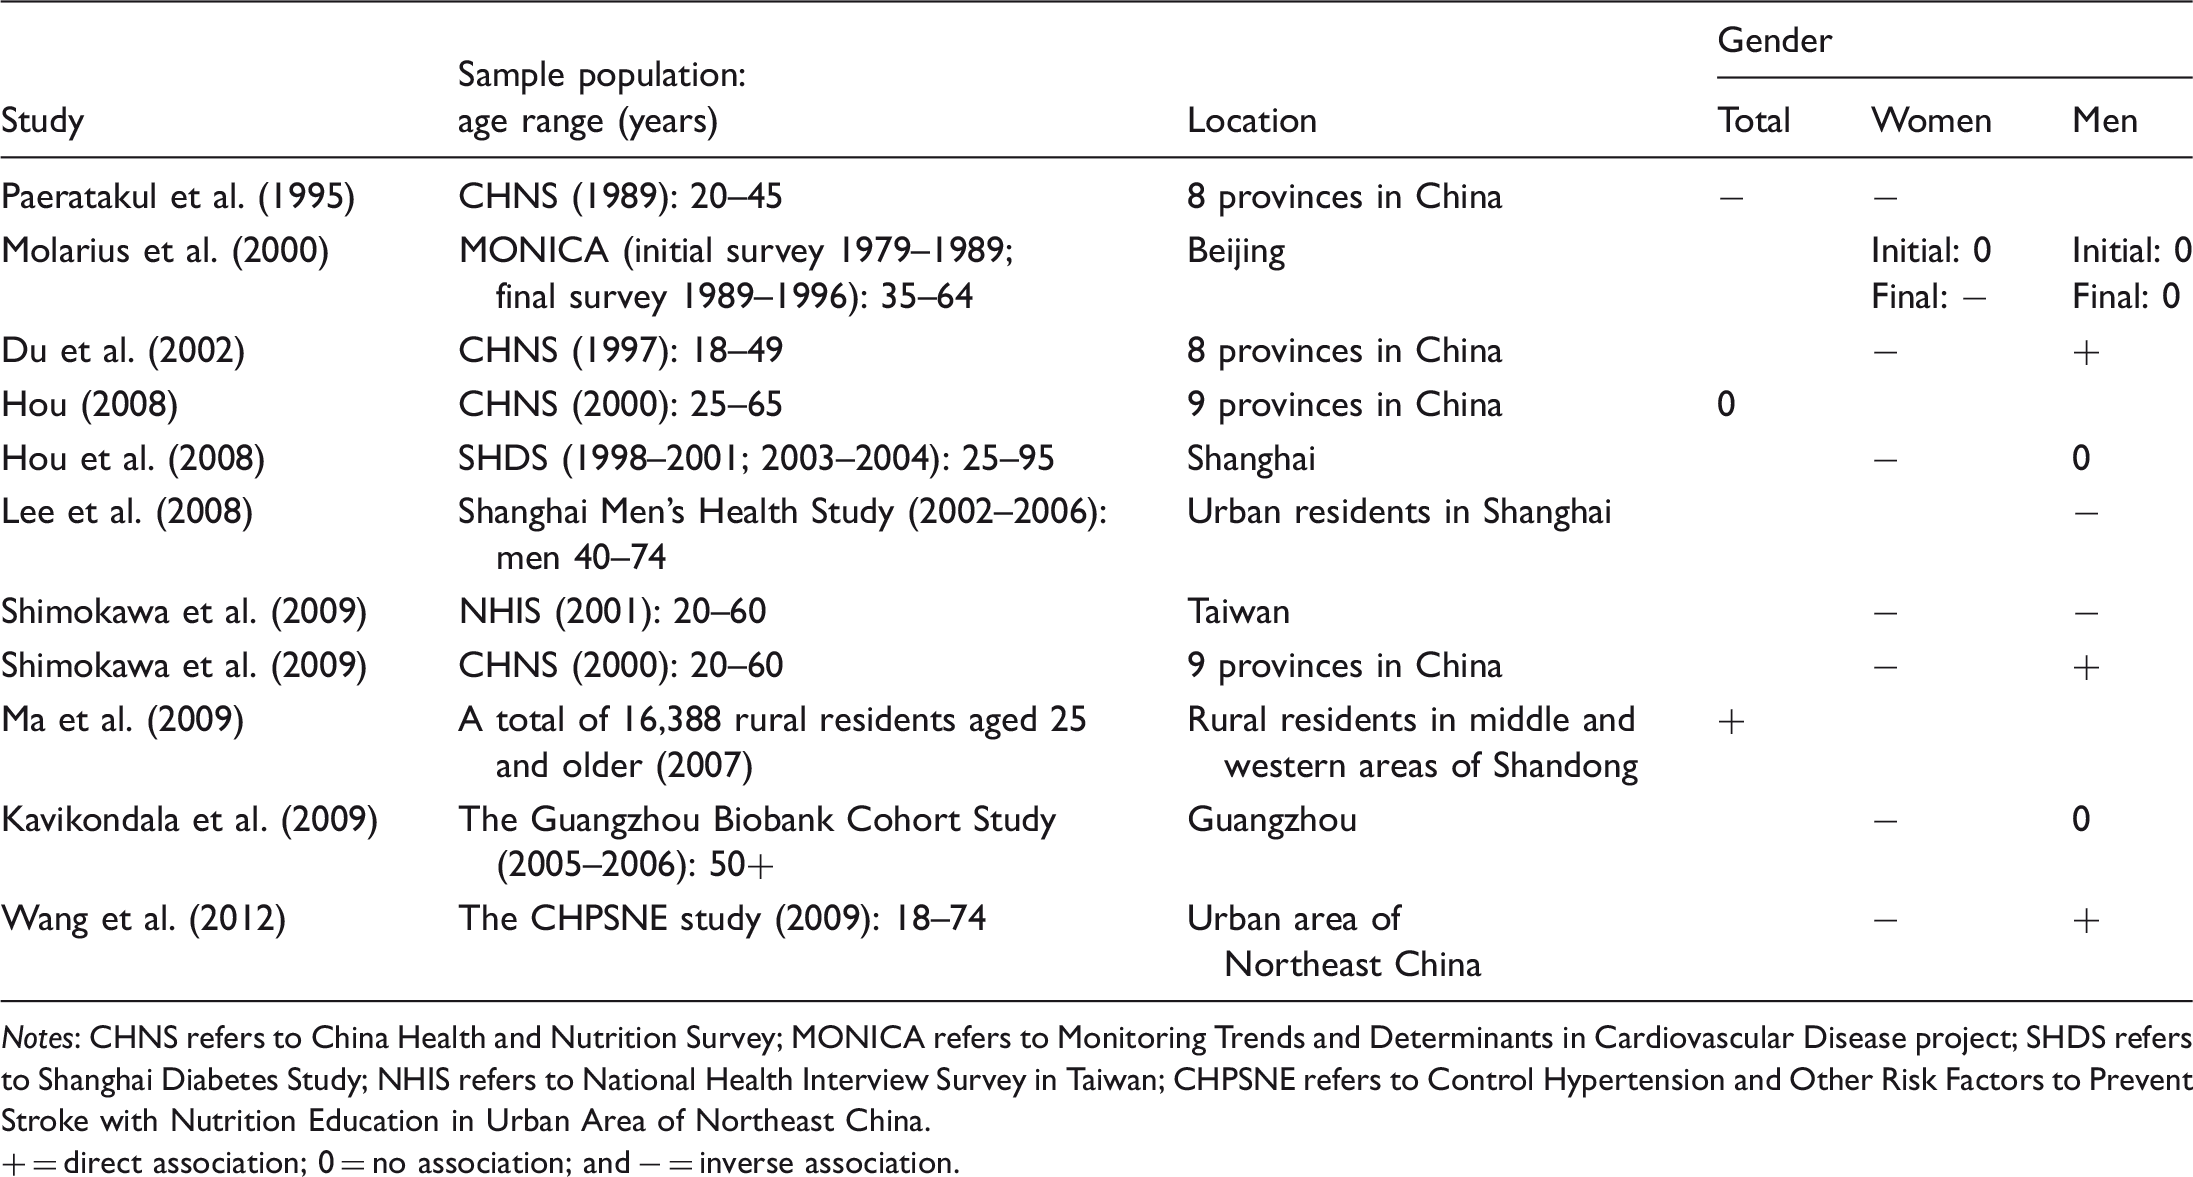
Notes: CHNS refers to China Health and Nutrition Survey; MONICA refers to Monitoring Trends and Determinants in Cardiovascular Disease project; SHDS refers to Shanghai Diabetes Study; NHIS refers to National Health Interview Survey in Taiwan; CHPSNE refers to Control Hypertension and Other Risk Factors to Prevent Stroke with Nutrition Education in Urban Area of Northeast China.
+ = direct association; 0 = no association; and − = inverse association.
To understand the inconsistencies of past findings, it is important to consider two features of the existing literature. First, the data have been drawn from different parts of China, such as urban Shanghai, rural Shandong, and Taiwan, characterized by different levels of economic development. Second, these studies are all based on survey data conducted in different years. As we emphasized earlier, the direction and strength of the education gradient in body weight may vary over time and across regions.
Our study has three concrete aims. First, we examine the trend in the education gradient in body weight for both men and women through a regression analysis. Second, we further incorporate regional variation and evaluate how the education gradient in body weight varies with the local level of economic development. Third, for the different years we identify cross-over points, that is, specific levels of economic development over which the education–BMI gradient shifts from positive to negative.
Data, measures, and methods
Data
Our empirical analyses are based on the CHNS, an ongoing project conducted by the Carolina Population Center at the University of North Carolina at Chapel Hill and the National Institute of Nutrition and Food Safety at the Chinese Center for Disease Control and Prevention. The CHNS is a panel survey, which has collected eight waves of data (1989, 1991, 1993, 1997, 2000, 2004, 2006, and 2009) that are available to researchers. Although the CHNS data are not nationally representative, households were randomly selected from a set of provinces which are diverse in terms of geographic location, economic-development level, and public resources. The CHNS initially covered eight provinces in China: Liaoning; Jiangsu; Shandong; Henan; Hubei; Hunan; Guangxi; and Guizhou. In 1997, Liaoning province was replaced by Heilongjiang, a province similar to Liaoning in terms of geographic and other characteristics. From 2000 on, Liaoning was included in the survey again, along with Heilongjiang. A stratified multistage, cluster sampling method was used to draw households. Counties and sub-cities in each province were stratified by income (low, middle, and high) and a weighted sampling scheme was used to randomly select four counties and two sub-cities in each province. Villages and townships within the counties and urban/suburban neighborhoods within sub-cities were selected randomly. In each community, 20 households were randomly selected. The survey was not a true panel study, because it did not follow up households that have moved to other neighborhoods not covered by the survey. Instead, the CHNS included new households in each survey wave to replace those that were lost to follow-up. As a result, due to the changing nature of the sample over time, the data are better treated as repeated cross-sectional surveys.
For our study, we exclude the 1989 CHNS because it only surveyed preschoolers and young adults aged 20–45 years. Beginning in 1991, each wave of the survey included all members of the sampled households. Our analyses are limited to adults aged 21 years or above, excluding women who were pregnant at the time of survey. We use a lower limit of age 21 to ensure that most respondents will have completed their education. After excluding invalid or incomplete cases, our analytical sample consists of 7833 persons in 1991, 7427 in 1993, 7884 in 1997, 8613 in 2000, 8785 in 2004, 8783 in 2006, and 9212 in 2009.
Measures
We use BMI, defined as the ratio of weight (in kilograms) to the square of height (in meters), as our outcome variable of interest. In the CHNS, weight and height were measured objectively by trained health workers who followed standard protocols and techniques. We focus on BMI, rather than discrete measures of obesity or overweight, not only because cut-offs for them among the Chinese population are controversial (Gu et al., 2006; WHO Expert Consultation, 2004), but also because the relationship between education and weight is graded and gradual in nature (Frank and Akresh, 2013).
The main independent variable, education, is treated as a continuous variable and measured by years of schooling completed. An additional measure of education is a three-category ordinal variable, including primary school or lower (less than 7 years of schooling completed), junior high school (7 to 9 years of schooling completed), and senior high school or higher (10 or more years of schooling). Given the nearly identical results obtained from these two kinds of measures, we use the years of schooling measure, which has more easily interpretable units.
Covariates in our multivariate analyses include age, marital status, smoking, drinking, and region. In light of past research on life course changes in body weight (Ferraro et al., 2003; Schafer and Kwon, 2012), BMI likely rises with increasing age through middle adulthood, and then declines somewhat at older ages due to bone and muscle loss. Therefore, age and age-squared will be included simultaneously to model the curvilinear relationship between age and BMI. Marital status is binary, coded as 1 for currently married and 0 otherwise. Smoking measures whether one smoked in one’s lifetime to date. Drinking indicates whether the respondent has ever drunk alcohol during the past year. To account for regional variation, we first include dummy variables for differences in BMI across broad regions: coastal (Shandong and Jiangsu); northeast (Liaoning and Heilongjiang); inland (Henan, Hubei, and Hunan); and the southern mountain region (Guangxi and Guizhou). Appendix Table A1 presents summary statistics of all variables used in the analyses for each wave.
Analytic strategy
Our statistical analysis consists primarily of three steps. First, we use ordinary least squares (OLS) models to estimate, in a statistical sense, the effect of education on body weight for each wave. Omitting subscripts denoting the 
Second, we estimate two-level hierarchical models to examine how the effect of education on body weight depends on regional differences in economic development. We borrow this methodology from Xie and Hannum (1996). For the ith person in the jth county/sub-city, the model at the individual level is

At the county level, we assume


The county level variable 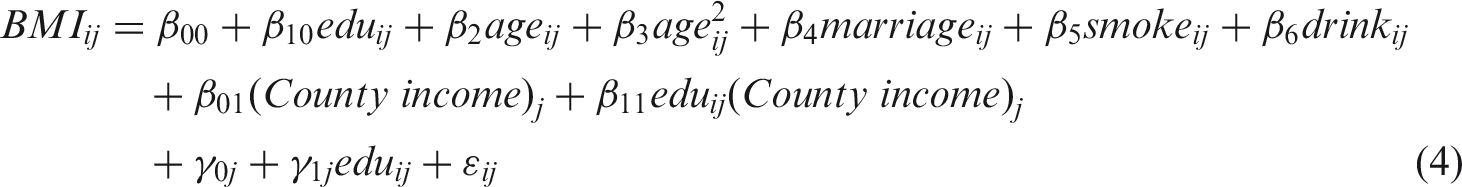
Our interest centers on testing the SES gradient reversal proposition, that is, how the effect of education varies as a function of economic development. If the reversal pattern, true for the temporal dimension, also holds true along the regional dimension, we expect the education gradients to be positive (or less negative) at low levels of economic development but to be negative (or less positive) at high levels of economic development.
Third, we derive from the two-level hierarchical models’ cross-over thresholds of economic-development level beyond which the effect of education on body weight shifts from positive to negative. We keep the analyses separate for men and women, given that the education–BMI gradient is known to differ by gender.
Results
The first obvious finding in the data is that body weights have been steadily and dramatically increasing in China from 1991 to 2009, the time period of our study. Figure 1 displays the trend in BMI from 1991 to 2009 for women and men separately. Both women and men experienced weight gains over the period. Compared to men, women had a significantly higher average BMI between 1991 and 2000. However, men’s BMI grew at a faster rate, so the gender gap was no longer statistically significant by 2004 and continued to decline afterwards.
Secular trend in body mass index by gender for Chinese adults age 21 and older, 1991–2009.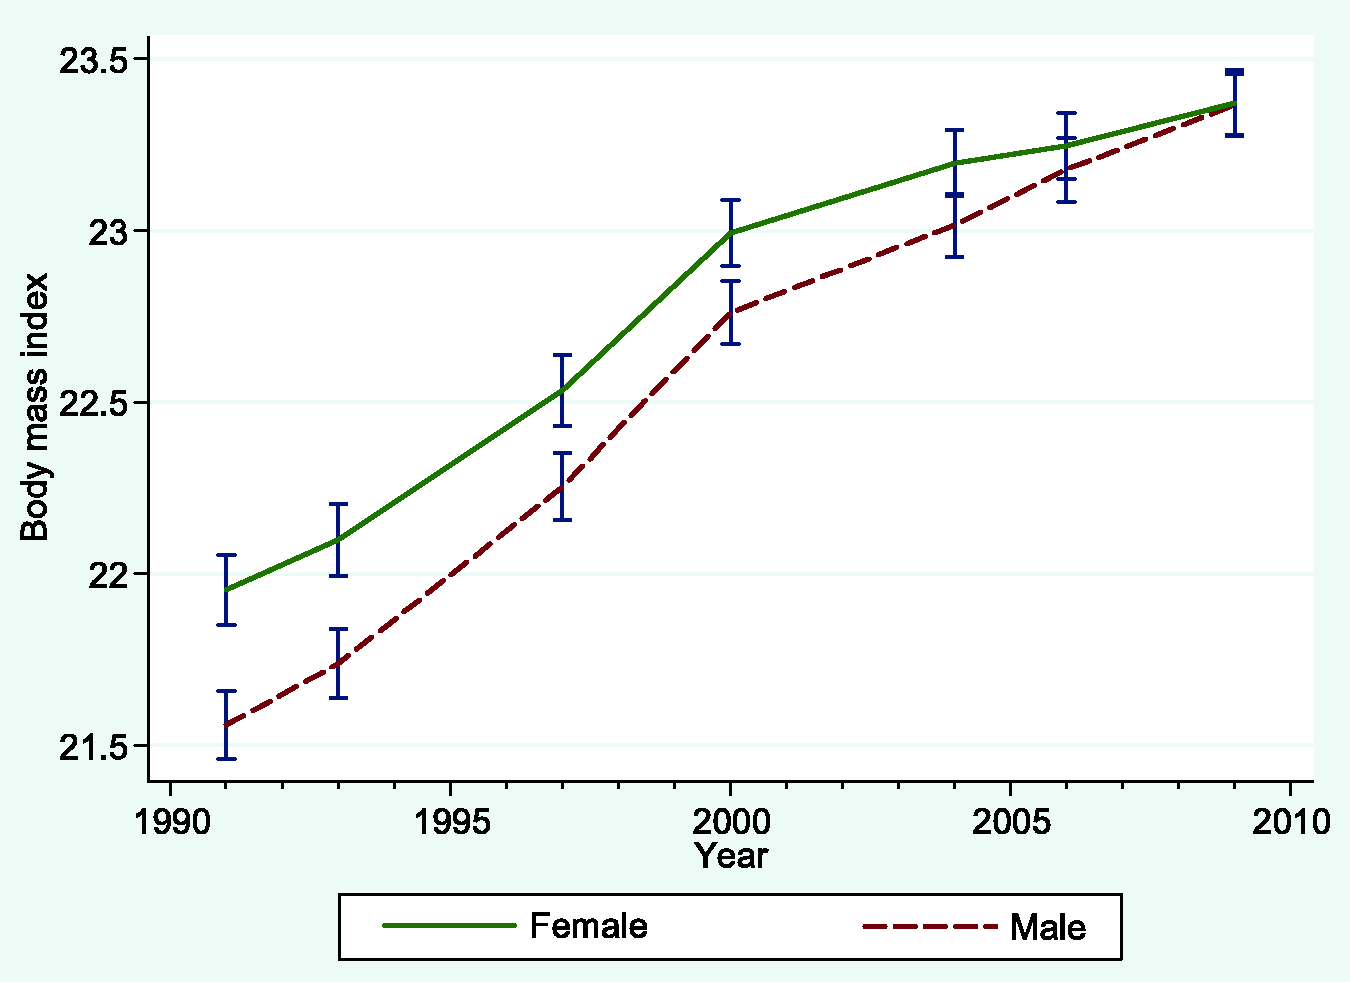
Trends in the education gradient in body weight
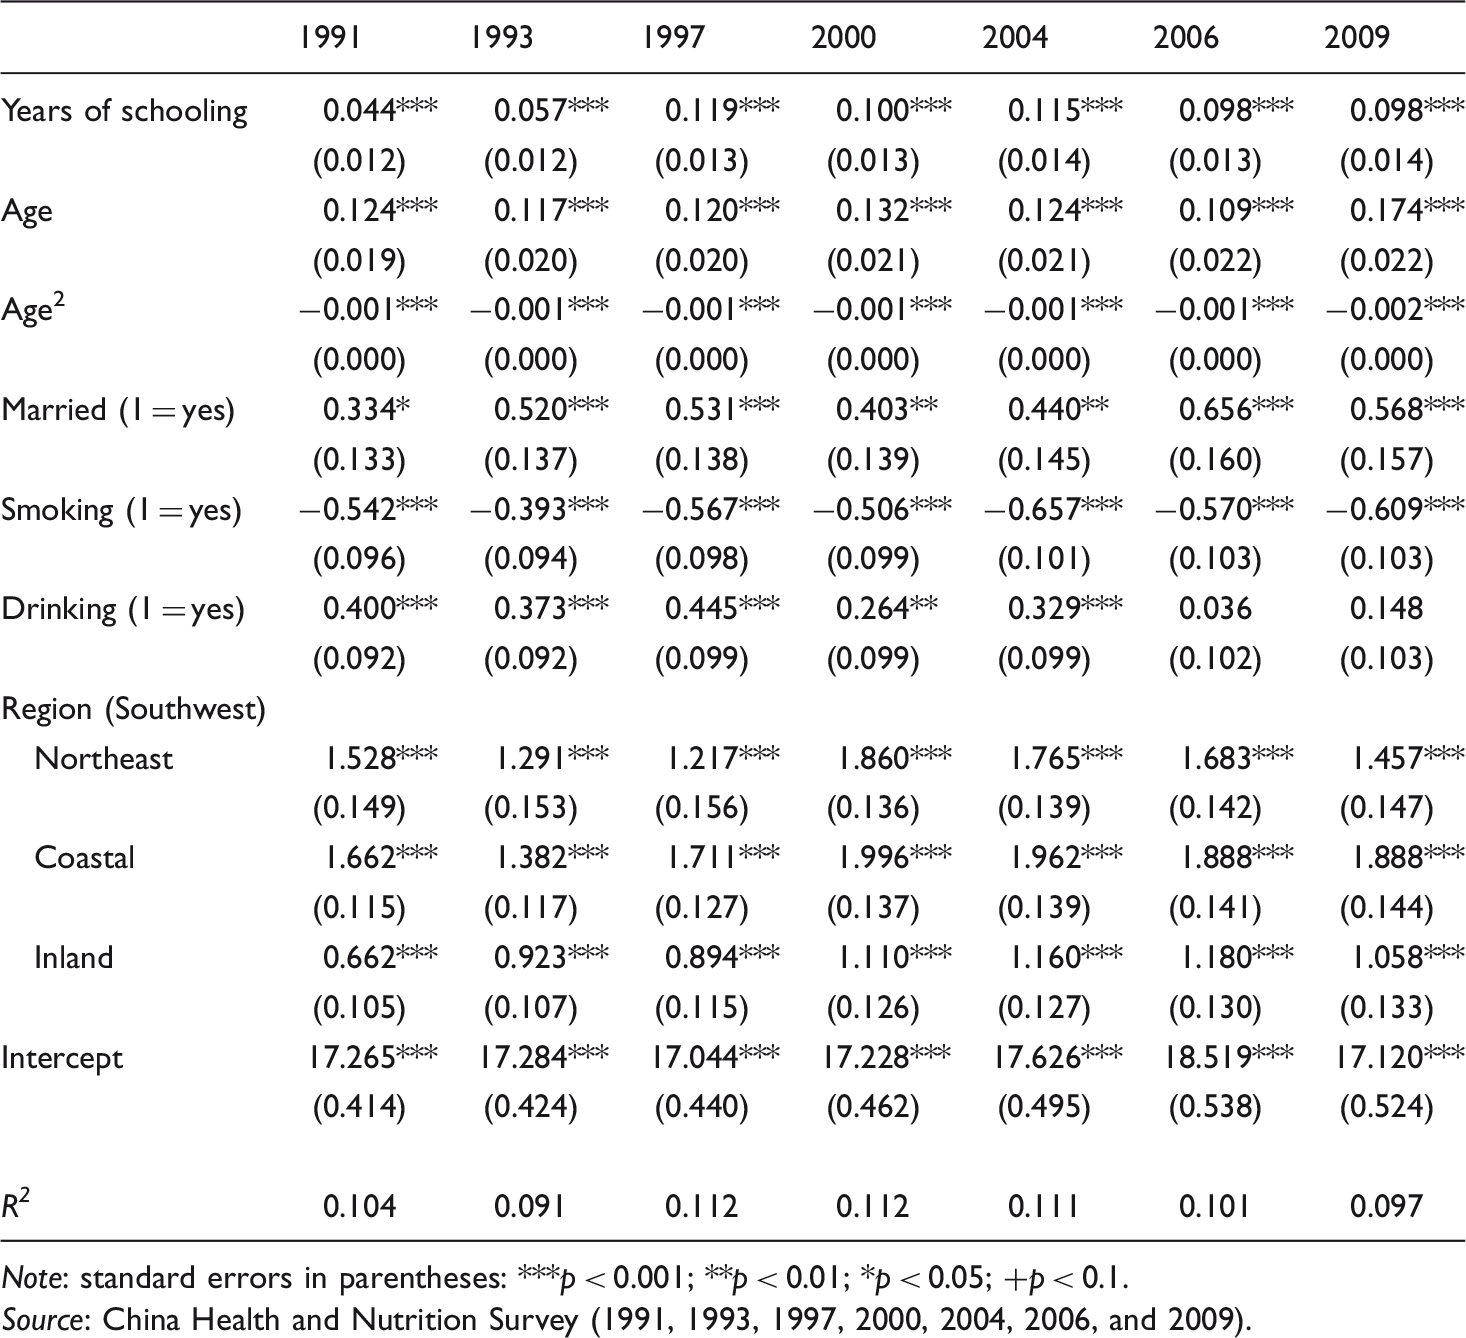
Ordinary least squares regression models of education effects on body mass index for Chinese females age 21 and older.
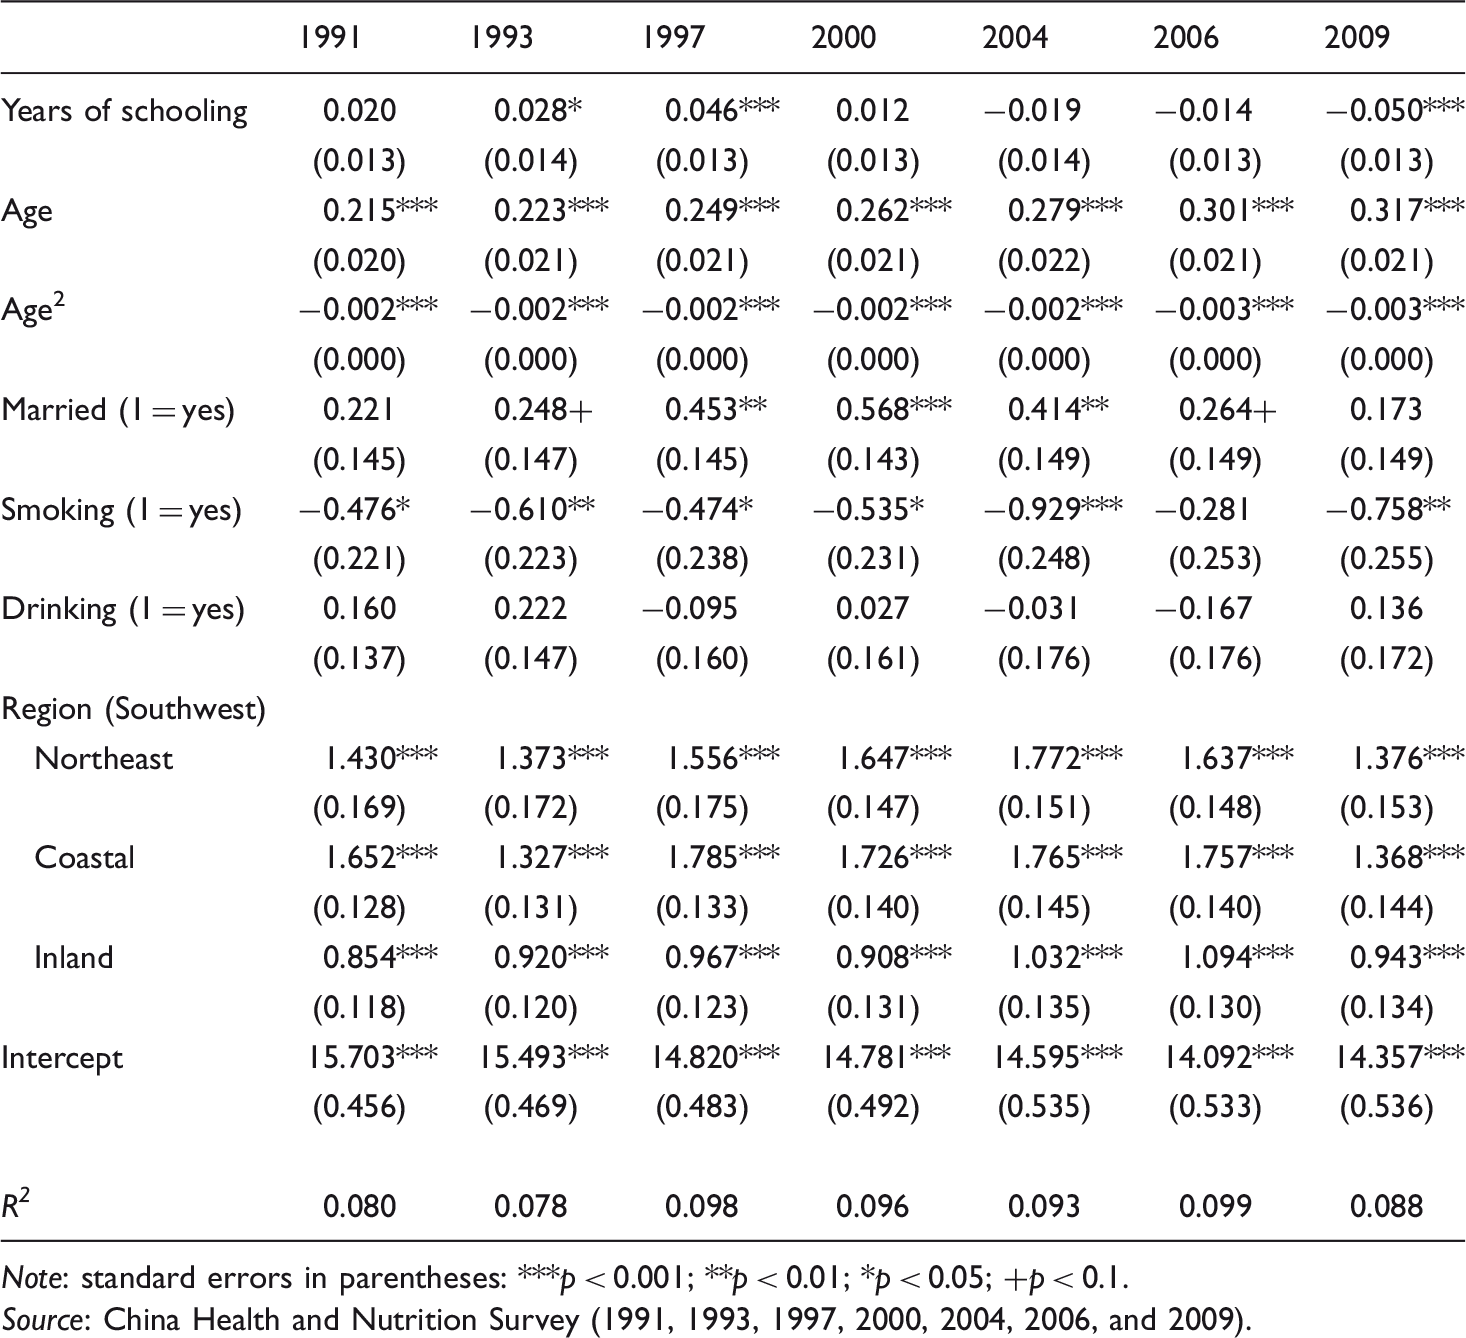
Note: standard errors in parentheses: ***p < 0.001; **p < 0.01; *p < 0.05; +p < 0.1.
Source: China Health and Nutrition Survey (1991, 1993, 1997, 2000, 2004, 2006, and 2009).
Ordinary least squares regression models of education effects on body mass index for Chinese males age 21 and older.
Note: standard errors in parentheses: ***p < 0.001; **p < 0.01; *p < 0.05; +p < 0.1.
Source: China Health and Nutrition Survey (1991, 1993, 1997, 2000, 2004, 2006, and 2009).
To better interpret the results, we graphically show temporal changes in the effect of education on body weight in Figure 2. We observe that the estimated coefficient of education on the BMI shifts from positive to negative for women but stays positive and becomes increasingly so from 1991 to 1997 for men. These results for women confirm earlier work by Jones-Smith et al. (2012b), who suggest that the education gradient in body weight should become more negative over time as a country becomes more economically developed.
Education slope on body mass index by year for males and females age 21 and older.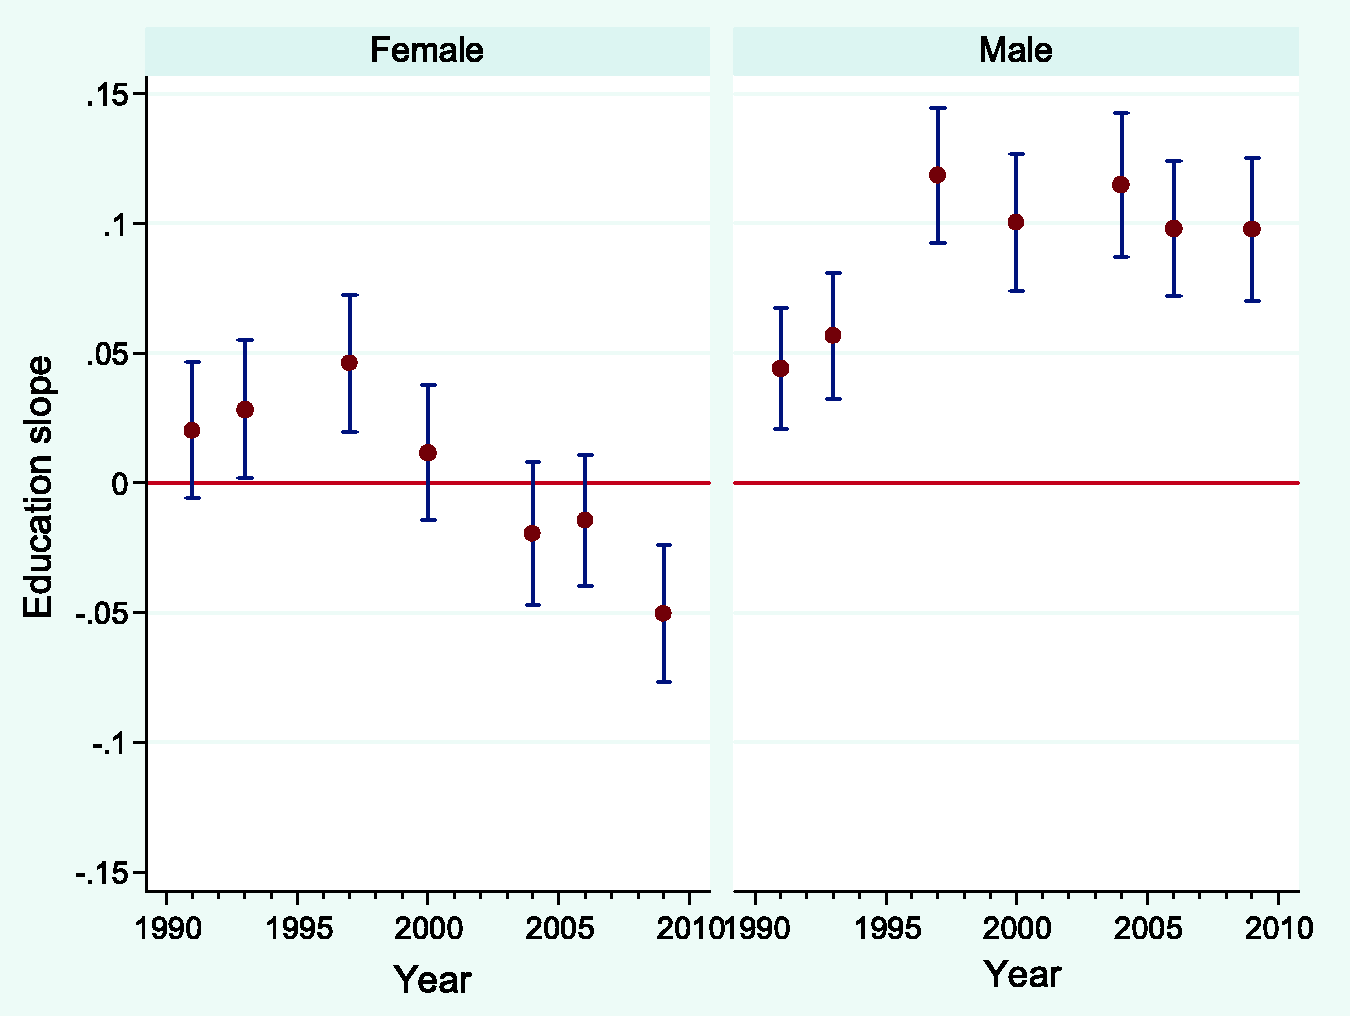
In line with previous research (e.g., Ferraro et al., 2003; Pampel et al., 2012; Shimokawa et al., 2009), the age pattern of BMI follows an inverted ‘U’ shape, as it rises early in the life course and then begins to fall toward the end. This pattern holds true for both men and women. The positive coefficients for being married mean that married persons weigh more than their unmarried counterparts. Smoking has a negative association with body weight for both men and women. Drinking alcohol has a positive association with men’s, but not women’s, body weight. One plausible reason for the gender disparity in the effect of drinking is that few women in China ever drink alcohol, which makes the estimation subject to great fluctuations; another reason is that even if women do drink alcohol, they are more likely than men to be light drinkers. From earlier research (Pampel et al., 2012), we know that a higher level of economic development is associated with a higher BMI. Not surprisingly, people living in China’s coastal areas have the highest BMIs on average, followed by those living in the northeast, inland, and southwest areas.
Regional variation in the education gradient in body weight
Although the application of the baseline model in equation (1) provides us with a crude picture of temporal changes in the education gradient in body weight, it ignores the reality of regional variations in China. As mentioned above, the education gradient in body weight may vary substantially in different parts of China, due to a large regional variation in the level of economic development.
Two-level models of education effects on body mass index for Chinese females ages 21 and older, 1991–2009.
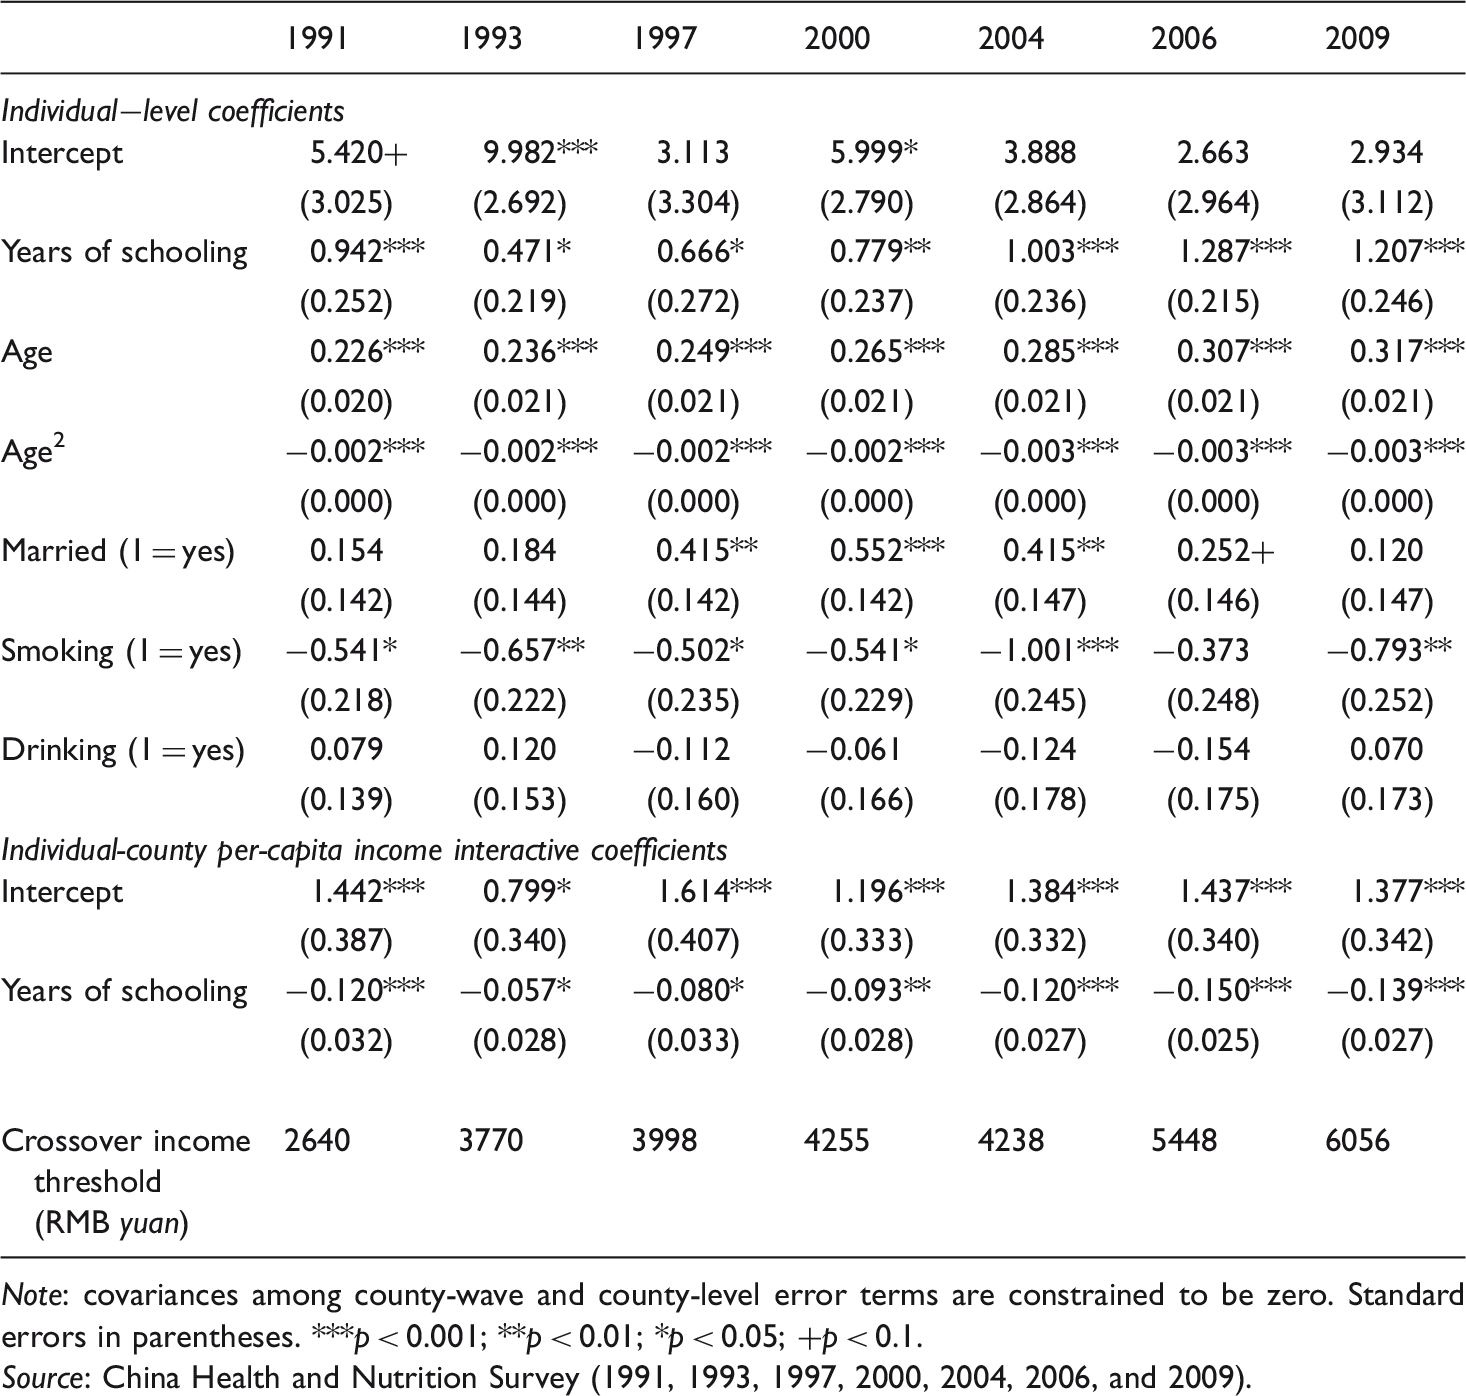
Note: covariances among county-wave and county-level error terms are constrained to be zero. Standard errors in parentheses. ***p < 0.001; **p < 0.01; *p < 0.05; +p < 0.1.
Source: China Health and Nutrition Survey (1991, 1993, 1997, 2000, 2004, 2006, and 2009).
Two-level models of education effects on body mass index for Chinese males ages 21 and older, 1991–2009.
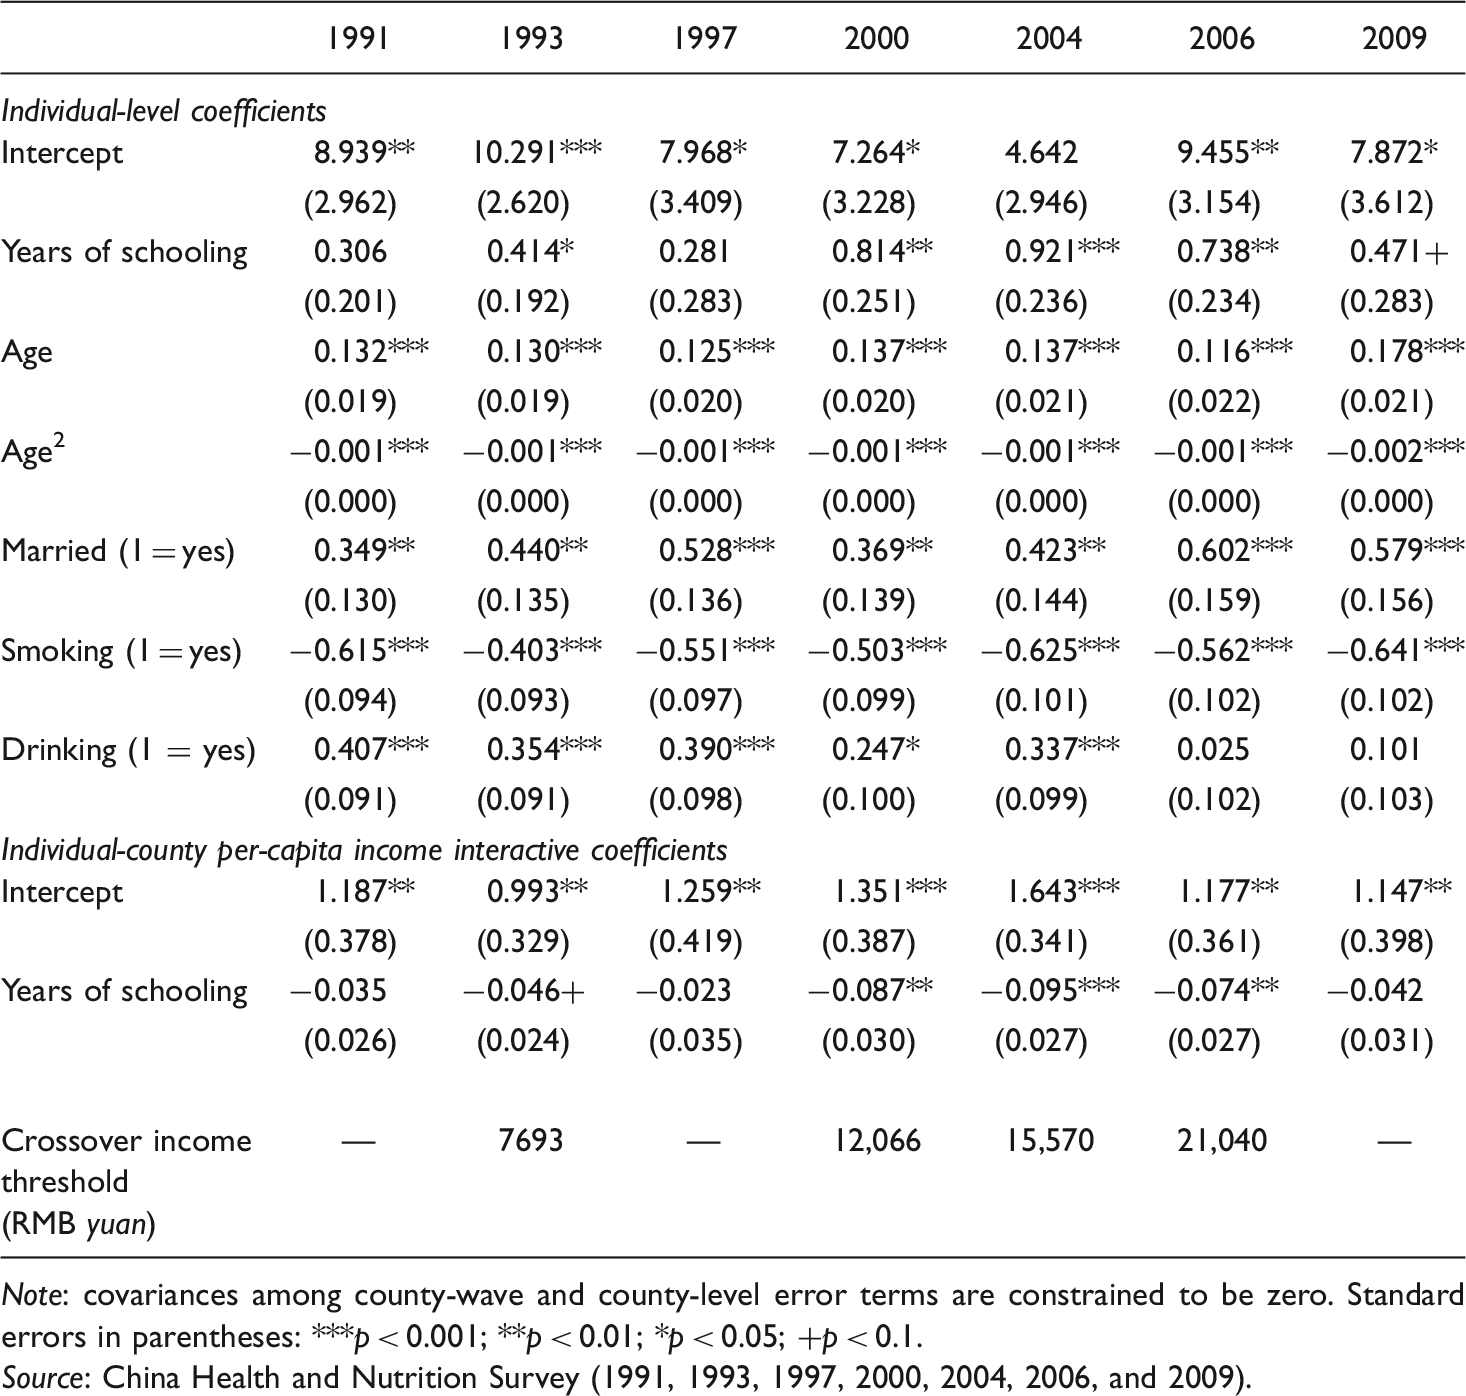
Note: covariances among county-wave and county-level error terms are constrained to be zero. Standard errors in parentheses: ***p < 0.001; **p < 0.01; *p < 0.05; +p < 0.1.
Source: China Health and Nutrition Survey (1991, 1993, 1997, 2000, 2004, 2006, and 2009).
Among women, in line with our second hypothesis, we find strong evidence for the education gradient reversal proposition along the regional dimension. Evaluating the second hypothesis requires attention to two coefficients: main effect of education variable; and interaction between education and county-level economic development. In 1991, the baseline effect of education on body weight was 0.942 for women. The education effect on body weight is negatively related to county-level economic development, as the estimated
In the later waves (i.e., 1993, 1997, 2000, 2004, 2006, and 2009), we also find similar interaction effects between education and economic development:
Among men, contrary to our second hypothesis – a negative interaction between education and county-level economic development – we find no support for the education gradient reversal proposition along the regional dimension, which resembles the results from the temporal trend at the national level. Generally, the effect of schooling on body weight is also positive when level of economic development is held at zero. However, the interaction effect between education and economic development is not always statistically significant: the interaction effect is significantly negative in waves 1993, 2000, 2004, and 2006, but insignificant in the remaining waves. For the waves in which the effect of education on body weight changes with county level of economic development, each estimated crossover point is so high that none of the counties studied can reach it in terms of economic development. For example, for 1993, the predicted crossover point is 7693 RMB yuan per capita; of the 48 counties studied, however, the highest per-capita income was 7189 RMB yuan (Appendix Table A2).
In all, women in our analysis differed from men in their expression of the education gradients across both time and geography. Among women, there was evidence of an education reversal, while among men, few of the interactions between education and county-level economic development were negative and statistically significant. These results were clearly in line with our expectations, providing support for hypotheses 3 and 4. The gender differences in the relationship between economic development and the effect of education on body weight underscore the importance of studying men and women separately. Perhaps the negative relationship becomes clearer (as has been the case among women) when economic development is more advanced, but future data will be needed to assess this possibility.
One other important finding in Tables 4 and 5 concerns the baseline effect of economic development on body weight. In our model, which allows coefficients to vary by county/sub-city, the intercept has a structural component (
Conclusion and discussion
Taking advantage of the unique context in China – its economic growth has not only been sustained at high levels but also been regionally uneven – we test the SES gradient reversal proposition in this study by examining temporal and spatial variations in the education gradient in body weight among Chinese adults. Specifically, we ask whether the education gradient in body weight changed direction from positive to negative during the period studied, and whether the gradient varied across regions from positive in less developed regions to negative in more developed regions. Our analysis of CHNS data from 1991 to 2009 reveals different variation patterns for men and women in education gradient of body weight.
In line with the socioeconomic patterning of body weight indicated by cross-national comparisons (Deuchert et al., 2014; Kinge et al., 2015; Pampel et al., 2012), for women, the education gradient in body weight shifted from positive to negative over time for China as a whole, as well as across regions with different levels of economic development. Thus, for Chinese women, both the temporal and the spatial analyses support the SES gradient reversal proposition. However, over time, there is no constant crossover threshold measured by income per capita, at which point the burden of higher body weight begins to shift towards the poorly educated. Monteiro et al. (2004) had suggested that the reversal of the obesity gradient for women takes place at about a gross national income per capita of US$2500. Dinsa et al. (2012) showed that this switchover may occur already at a considerably lower per capita income level (US$1000). Our results suggest that this threshold may be contingent on the specific social context. Possibly due to the relative lag of nutrition transition and the diffusion of Western cultural ideals concerning body type compared to the speed of economic growth in China, for women, this threshold level changed upward over time.
For men, however, more education remained associated with higher body weight over the 1991–2009 period for China as a whole, as well as across different regions with different levels of economic development. Spatial analysis suggests that the SES gradient reversal proposition may be at an early stage for men, because we found the negative interaction effect between education and the local level of economic development for some survey years. If this result is to be trusted, we expect the SES gradient reversal proposition to be applicable to men in the future, as it has been for women for a while, as China continues its economic development.
Our research demonstrates the advantage of studying both temporal and spatial variations in understanding how economic development may shape the SES gradient in body weight. This is particularly important for China, because regional variation in China is large, and China has been experiencing very rapid social changes. Previous studies have reported inconsistent findings about the association between education and body weight in China, in large part because these findings are confounded by temporal and regional variations, as we have clearly shown in this paper.
Not only do the temporal and spatial variations uncovered in our study help us to understand how education and body weight are actually associated contingently in China, they also advance our theoretical knowledge about the relationship between economic development and an obesity epidemic in general. Although economic development can improve health, it may also engender population health risks through obesity, particularly for socially disadvantaged groups. We have shown that in China, with economic development, the burden of overweight and obesity are shifting to the poorly educated. These findings are enlightening to policy-makers who are intent on improving population health and reducing social inequality of health in China.
We would like to acknowledge a few caveats for this study. First, the CHNS is a household survey and did not include a very large rural-to-urban migrant population in China. In the past twenty years, the migrant population, the vast majority being peasant workers, has increased to about 260 million. Studies that do not take this large subpopulation into account necessarily suffer from an inability to generalize findings to the entire Chinese population. Second, our analysis treated BMI as a continuously distributed variable to reflect its graded relationship with education. In so doing, we are restricted to analyses of BMI variation but not of more clinically relevant outcomes, such as obesity. To examine whether our results would change with a categorized measure of BMI, we repeated our analyses with being overweight (versus not overweight) as an outcome of interest. All substantive conclusions remained the same. Third, our study focused on education as an indicator of SES. Future studies could build on our work and examine additional measures of SES, including occupation, income, and type of work unit. Finally, our study did not address the causal relationship between education and body weight. If the effect of education on body weight is causal, future research should uncover the actual causal mechanisms that underlie the temporal and regional variations in the education–BMI gradient that we have reported. We welcome future research to overcome the limitations of this study so that we will attain a fuller and better understanding of the relation between economic development and the SES gradient in body weight, both in China and in other countries.
Footnotes
Funding
Weixiang Luo’s research was financially supported by the National Social Science Fund of China (no. 16CRK024).