
Abstract
This study presents a comparative analysis of language-specific random samples of YouTube videos, focusing on English, Spanish, Hindi, and Russian. We produce a large random sample, retrieve metadata, calibrate and deploy language-detection software, and extract four high-confidence language samples. Through an analysis of upload dates, popularity, duration, and category metadata, we highlight patterns and anomalies among our samples. For example, English YouTube has the smallest proportion of videos categorized as “News & Politics,” and Spanish videos have a longer median duration. The most salient contrast, however, is between Hindi YouTube and the other three languages. Hindi videos are much shorter and much newer, with sharp growth since 2020 and more than half of the sample uploaded in 2023 alone. The Hindi sample also exhibits a different pattern of liking, with the lowest percentage of videos with just zero or one like even while it has the highest percentage of videos with just zero or one view. These findings may help to quantify the migration of India’s short-form video culture, based around TikTok, to YouTube when TikTok was banned in the country in 2020. This study underscores the necessity of multilingual and culturally specific approaches to platform research by drawing attention to the heterogeneity of YouTube. We propose this method as a starting point to understand linguistic communities on YouTube, surfacing trends and exceptions while providing cues for more content-focused study.
Introduction
Linguistic Communities’ Use of Social Media
Our experience of the internet is shaped by the languages we understand. We search in languages we can read, follow links posted by friends who speak the same language, and the algorithms which curate our feeds to maximize attention would be malfunctioning if they served content in unfamiliar languages. When we do see content in languages we cannot understand, we most often pass it by, rather than using machine translation to read it (Lim & Fussell, 2017). As a result, our understanding of how a specific medium is used tends to be linguistically constrained.
As more and more of the world’s internet activity is concentrated on a small number of websites (Hindman, 2018), it is all too easy to assume that the ways in which one uses YouTube, Facebook, or Telegram in one language is the same as those who speak other languages. In reality, this is like assuming mobile phone use is the same across cultures or that Russian and French literature are identical.
Given the dominance of US-based technology platforms and the high output of related scholarship in English, there is furthermore a tendency to assume that English is representative of the internet as a whole, and indeed a great deal of scholarship begins with or samples only English-language content, creating a limited and skewed corpus to study. Existing research has found, for example, that most literature on social media use and wellbeing is based on English samples (Sametoglu, 2025), most studies of Wikipedia are based on the English Wikipedia (Okoli et al., 2012), and most research about Twitter focuses on English, with few studies attending to its international popularity (Hong et al., 2011). This Anglocentric bias is one of the trends in scholarship Matassi and Boczkowski (2023) take aim at when they advocate for more explicitly comparative social media research. According to the authors, individuals, groups, and the media they create are too often studied in isolation, without adequately accounting for differences across nations, media, and platforms, and language is one of the “pathways” they identify to undertake such projects.
Unfortunately, the difficulties of researching these sites, combined with the practical challenges of studying across languages, means broad comparisons of language communities are rare and often limited. A body of research, especially from the early days of user-generated content, demonstrated broad interest in the relationship between language and the adoption and use of digital tools and services. For example, Herring et al. (2007) analyzed LiveJournal, finding it to be dominated by English but with a sizable Russian community. Subsequent work found that Russian LiveJournal became popular among journalists to blog about politics, even while its English counterpart was associated with fandom (Johansson, 2014). Hong, et al. (2011) found differences in the use of linking, mentions, hashtags, and retweets across languages and cultures on Twitter. Many studies have compared parallel content on different language versions of Wikipedia, which are developed independently but sometimes share authors and procedures. Hecht and Gergle (2010) argue that most analyses of Wikipedia content from across language versions operate under a “global consensus hypothesis” whereby difference is assumed to be a sign of error or incompletion rather than the result of cultural context and the priorities of local communities.
In addition to the challenges of studying platform usage across languages is the challenge of determining the boundaries of a single language. Our examination of languages presumes that Hindi is a single language with clear boundaries as to what is and what is not Hindi. But Hindi and Urdu share a great deal of common vocabulary, and many Indian languages use Hindi as a lingua franca for concepts not easily expressed in the local tongue. It is difficult to determine whether someone moving fluidly from a local language with Hindi loan words into Hindi is speaking one language or the other. We acknowledge this both as a serious limitation to our work and as a limit to any work with languages as they are spoken in informal settings like internet videos.
YouTube
YouTube received more than 32 billion visits in November 2024 and ranks as the second most popular website in the world according to web analytics company SimilarWeb (“Top Websites Ranking,” 2024). The average time a user spends on YouTube is higher than any other website (YouTube.com, 2024). The video hosting service founded in 2005 now hosts almost 15 billion videos (Zheng et al., 2024). Its vast archive includes self-expression, education, political propaganda, science experiments, school board meetings, video game streams, family birthdays, entire Hollywood movies, and homework assignments. It has been widely studied for its role as a source of information or misinformation (Barrett & Hendrix, 2022) and the ways in which its search and recommendation algorithms influence ideas and attitudes (Bryant, 2020; Rieder et al., 2018). It has had an impact on traditional news and entertainment (Budzinski et al., 2021; Burgess & Green, 2018), marketing (Mowlabocus, 2018), education (Duffy, 2008), health communication (Sampson et al., 2013), the music industry (Cayari, 2011), and a range of other parts of society (Arthurs et al., 2018; Burgess & Green, 2018; Snickars & Vonderau, 2010).
Despite its popularity and importance, YouTube is understudied compared to many other large websites. Its medium—video—is more difficult to study at scale than text, YouTube does not release most basic information about what it contains, and the company does not provide a mechanism to produce random samples, which are necessary to make high-level claims about large portions of the site or YouTube as a whole. Researcher Kate Starbird once called YouTube “almost inscrutable” compared to other platforms like Twitter, which historically made it possible to study a representative subset of posts (Martin, 2021). However, since the removal or weakening of academic access to APIs in the time since her quote, and Twitter—as X—in particular demonstrating hostility toward researchers (Matias, 2023; Neff, 2024; Tromble et al., 2023; “Civil Society Organizations and Experts Sign Open Letter to Stand Against Elon Musk’s Efforts to Silence Independent Researchers,” 2023), it is perhaps fair to say the bar has lowered to the point that YouTube’s transparency is no worse than that of other large platforms and access may be somewhat better.
As a result, researchers typically use opportunistic methods to generate samples, searching with keywords (e.g., Ribeiro et al., 2021; Rieder et al., 2018) or starting with a set of known videos or channels, perhaps building a list by following recommendation trees (e.g., Hussein et al., 2020; Ledwich & Zaitsev, 2020). Rieder, et al. (2020) used a breadth-first crawler that followed channel connections to produce a large sample of channels and videos. Chen, et al. (2021) used surveys and browser tracking to retrieve videos and channels. All of these approaches have produced valuable contributions to scholarship about YouTube, but they generally oversample popular content. Sometimes this oversampling is by design, but other times, it is due to prioritization by YouTube’s algorithms or because it is simply more visible. While samples of popular content are useful for evaluating, for example, the quality of information in popular vaccine-related content, they are less suitable for making broad claims about YouTube.
Several studies do exist which aim to produce a more representative sample. Early in YouTube’s history, the site provided a mechanism to access recent uploads. Wesch (2008) and Hráček (2009) used it to systematically retrieve videos over a period of time, although older videos could not be sampled and the feed exhibited signs of filtering and other inconsistencies (Hráček, 2009). This feature has since been removed. Bartl (2018) identified channels through random keywords searched for random keywords, but did not include non-Latin characters and used search engine results without regard for possible prioritization. McGrady et al. (2023) used a time-consuming, resource-intensive, brute force method with search engine shortcuts called Dialing for Videos. The authors used it to validate and ultimately recommend an older, faster method called Random Prefix Sampling, which was proposed by Zhou et al. in 2011 and described below. In other words, a tested, practical method to obtain a random sample of YouTube videos has only recently become accessible to researchers, leaving large gaps in comparative research.
Languages on YouTube
YouTube does not share the distribution of languages spoken on its site with the public. A language code is not automatically assigned to a video, so it is not something easily calculable based on metadata. Some channels have a “default language” set, but it is an optional setting and one channel can have videos in multiple languages. The captions data reveals the language of the captions files uploaded by users, but user-uploaded captions are very rare in a random sample. If YouTube has generated automatic captions, the metadata will include which language it thinks the original audio track is in, but there are still many videos without autocaptions. Even when there are autocaptions, it is sometimes unclear why the autocaptioning system decided on the language it did.
While text is reasonably easy for computers to process, audio—the chief source of language on YouTube—is much more complicated (Lukito et al., 2024). The videos that immediately spring to mind when one thinks of YouTube, like the popular creators, professionally produced clips, and viral videos, are not representative of the whole, and the reality is messy. A CNN news clip, with crisp audio spoken by professional broadcasters into expensive microphones, with prepared text and a full-time sound mixer, will be easy for speech recognition software to process. What about a two-second video taken on a smartphone in a loud bar, a conversation between friends who slip between two languages, concert footage, or someone dancing to music with sparse vocals? Ambient noise, multiple speakers, cheap microphones, and ambiguous dialects are just some of the challenges YouTube videos present to automated analysis. The language sung over music is, of course, delivered much differently than the same words when spoken, and there is a great deal of music on YouTube—music videos, but also background or incidental music that computers cannot easily separate. These are challenges for any language-detection software, not to mention transcription software, which have been known to struggle with non-native speakers of a language, women, and native English speakers from Scotland, among other groups (Tatman, 2017). YouTube has contended with these problems ever since it first developed autocaptioning software, which has improved but is still derisively called “autocraptions” by some in the deaf community.
As a result of these issues, researchers have more often relied on textual data like metadata or comments than spoken language (e.g., Amudha et al., 2020; Döring & Mohseni, 2020; Obadimu et al., 2019). When studies include analyses of audio content, they typically involve watching and annotating each video manually. While not practical at scale, this approach is suitable for analyzing a narrow research topic area with a limited sample, with many examples emerging seeking to assess COVID-19 information on YouTube (e.g., Shukla, 2021; Thomas et al., 2021).
Even with software improving, sampling continues to be a limitation. There are several studies which compare content in two or more languages, with researchers watching and analyzing a relatively small number of videos. For example, Khatri et al. (2020) compared COVID-19 information on YouTube in English and Mandarin. The few broader studies of languages on YouTube have typically been limited to opportunistic samples of popular content that are not representative of the site as a whole. An example is the Pew Research Center’s analysis of videos from channels with at least 250,000 subscribers during a 1-week period in 2019, finding that 17% of videos were only in English while 72% of channels published at least one video that included a language other than English (Van Kessel et al., 2019).
For this study, we selected four languages: English, Hindi, Spanish, and Russian. English, Hindi, and Spanish are the three most spoken languages on YouTube according to existing research (McGrady et al., 2023); Russian is also prominent, but we included it because of the unusual space it occupies in Russia. Amid heavy state censorship of media, YouTube remains one of the primary ways citizens access unfiltered news (Editorial Board, 2022; Mozur et al., 2023). Even after throttling YouTube in the summer of 2024, many people still access the site directly or through VPNs (Sonne, 2025). According to McGrady et al. (2023) as of the end of 2022, roughly 20.1% of YouTube videos were in English, 7.6% were in Hindi, 6.2% were in Spanish, and 4.2% were in Russian.
Working with large numbers of videos precludes the possibility of watching and analyzing their content; instead, this study looks for high-level patterns, providing a quantitative starting point for a larger, essentially multi-disciplinary and collaborative project, as well as a counterpoint to assumptions that popular or English-language content is representative of a platform as a whole. Research on YouTube in particular and social media in general is skewed toward English both in terms of samples and publications, with most research about YouTube published in the US and concentrated in a relatively small number of journals (Mostafa et al., 2023). Following Matassi and Boczkowski (2023, p. 5), comparison here is not a “byproduct of trying to answer specific research questions” but “the epistemological principle framing our intellectual agenda.”
This study builds on recent research on randomly sampling YouTube, collecting a large-enough sample to yield representative samples of four languages. We study language in part because it is an available proxy for the geographic location of uploaders as we cannot extract user IP addresses from the YouTube database. YouTube channel owners can manually set a country field, which can be useful when studying content created by professionals or those trying to participate in the creator economy, but in a random sample it is not reliable. There are also channels which reupload other people’s content, which might come from a different country, as well as channels which feature material from multiple uploaders or from people living in one nation but creating content for another.
But language is also “one of the key constitutive elements of both subjectivity and social life” in its own right (Matassi & Boczkowski, 2023, p. 117), and one which provides a view beyond traditional territorial models of comparison, acknowledging that cultures frequently transcend national borders (Couldry & Hepp, 2012). In their conceptualization of a new wave of “media globalization,” YouTube is an example of what Cunningham and Craig (2016) call a frictionless global platform—a diverse, participatory facilitator of globalization. Their focus is on entertainment, which is only part of YouTube’s function, but the framework is useful to consider the extent to which linguistic cultures tend to use platforms in similar ways, calling attention to exceptions where they exist. Our search for high-level patterns and anomalies among and between language communities on YouTube intends to do exactly that—to highlight heterogeneity where it is tempting to assume similarity.
There are some inherent limitations when focusing on language, however, beyond the technical challenges listed above. First, one language can be spoken by very diverse groups scattered around the world. A generalization about Spanish, for example, will be skewed toward Latin America rather than Spain, and it is possible that a metadata comparison like we have done here would look very different if we were able to compare Spanish-speaking countries rather than treat all Spanish speakers as a single group. A 2017 comparison of social networking use in Mexico and Spain found the platforms were more integrated into business and government in Spain, while they served primarily recreational purposes in Mexico (Moreno et al., 2017). The inverse is also true: some regions, like India, are home to many languages. Hindi may be spoken by the largest number of people in India, but it would be a mistake to assume that a Hindi sample is representative of the whole country. Mehta (2019) highlighted the need to consider the relationship between national, regional, and local languages and use cases in India, noting, for example, that creators of content in regional languages do more community-building and storytelling while Hindi, as the national language, includes more legacy media outlets and promotional channels. Second, many YouTube uploaders are aware of the international audience they can access through the site, adapting their presentation accordingly (Adami, 2010). Third, there is a great deal of language switching, such as between Hindi, English, and Bengali (Barman et al., 2014), where we can see multiple languages in the same video or different languages in the description and title compared to the language spoken. Finally, the very notion of a lingua franca—and English serves as the lingua franca for a wide range of peoples (Durham, 2006; Vettorel, 2014)—poses questions about how much we can learn by focusing on language rather than region. Does a native Hindi speaker in India narrating a YouTube video in English say more about a culture of English speakers or the culture of India?
We improved on the language detection method in McGrady et al. (2023) in two ways. First, we used software developed by OpenAI called Whisper instead of the VoxLingua model used in that paper. VoxLingua produces a confidence score for each video, and the authors noticed strange behavior with low-confidence scores. Through experimentation, we found Whisper to perform better on YouTube videos than VoxLingua. For example, it was better able to distinguish between Welsh and English. In April 2024, The New York Times published an article about how, in a race between AI companies to find new sources of textual data to improve their large-language models (LLMs), both OpenAI and Google turned to the vast trove of language that is YouTube. Whisper, it turns out, was created expressly for the purpose of processing YouTube videos en masse (Metz et al., 2024), which may partially explain its better performance, even as the story raises privacy concerns (McGrady & Zuckerman, 2024).
The second improvement was a calibration task, described below, whereby people who speak each language evaluated the software’s confidence scores to arrive at language-specific confidence thresholds, creating a high-confidence subsample for analysis.
We selected four primary areas to focus our attention: upload dates, popularity metrics, duration, and categories. Upload dates provide an overall picture of YouTube’s growth in a linguistic culture, providing a timeline that can be used to compare against not just YouTube’s support for those languages, but technological adoption or, in the case of Hindi YouTube, the blocking of a competitor. Popularity metrics are perhaps the statistic the public hears about most regarding YouTube videos, even if reliance upon them obscures much about not just content but audiences (Baym, 2013). They constitute the clearest contrast between the typical experience of watching (and researching) YouTube and reality. Most of YouTube’s traffic is driven by its recommendation system, which generally concentrates attention in a relatively small portion of the site. The rest of the site—“digital obscura” (Berliner, 2024), “the lonely web” (Veix, 2016), or “Deep YouTube” (McGrady, 2024)—is largely neglected, both because of its lack of impact and because it is difficult to access in a systematic way, such as through random sampling (Berliner, 2022; McGrady et al., 2023). We included duration because it provides clues about the types of content which are popular among these linguistic communities, and because it may shed light on the way other parts of the internet ecosystem may affect YouTube, such as mobile internet use or the popularity of short-form video platforms. Finally, the category system instituted by YouTube provides a mechanism to glean types of content at the scale in which we are working.
Methods
Randomly Sampling YouTube
To produce a large random sample, we used the Random Prefix Sampling method proposed by Zhou, et al. (2011). Every YouTube video is assigned a unique 11-character identifier which appears in the URL after “youtube.com/watch?v=”. Random Prefix Sampling takes advantage of an unusual way the YouTube search software operates. A search for the string “watch?v=xy. . .z”, where “xy. . .z” is the start of a valid YouTube ID (the “prefix”) and does not contain a dash character, will include up to 20 results starting with the prefix, followed by a dash. Though the reason this works is not clear, it may be due to dashes separating two strings, treating either side of one as a valid search term. While the reliance on prefixes, use of a dash, and the odd behavior it relies on may cause concern that might not be generating truly random samples, it was validated by McGrady et al. (2023) by comparing it to a more random but inefficient and time-consuming method called Dialing for Videos. Based on the similarity between samples produced by the two methods, the authors concluded the faster Random Prefix Sampling approach is sufficient for research purposes.
Between September 2023 and March 2024, we used the InnerTube API 1 to produce 10 random samples using five-digit prefixes, for a total of 246,381 random videos from which to draw our language-specific samples (194,619 in 2023 and 51,762 in 2024). We used the yt-dlp Python package 2 to extract metadata and download the videos’ audio tracks to process them with Whisper.
Once we controlled for language confidence (see below), we used the two 2024 samples to provide growth estimates for each of the four languages between 2006 and 2023 and used all 10 samples to provide comparisons of views, likes, comments, durations, and categories. (While our samples were retrieved in 2023 and 2024, they are random samples of the entire YouTube corpus and include videos from the start of YouTube to the date the sample was collected.)
The method we used only includes publicly visible videos. YouTube allows three privacy levels: public; unlisted, which do not appear in search results or recommendations; and private, which is only visible to the uploaders and people the uploader shares it with directly. As Random Prefix Sampling takes advantage of search engine behavior and unlisted videos are not included in search results, our sample does not include. Furthermore, out of respect for user privacy we would have removed unlisted videos from our sample even if the method did include them.
Language Detection With Whisper
To determine what language is spoken in each video, we used Whisper, software developed by OpenAI. 3 When Whisper analyzes audio to detect a language, it assigns a confidence score from 0 to 1. The distribution of confidence scores varied significantly by language, and it was unclear what confidence level to use for each. To produce a confidence threshold particular to each language, we coordinated a calibration task.
For each of four languages—English, Spanish, Hindi, and Russian—a researcher with a strong, if not native, understanding of the language coded 90 randomly sampled videos: 10 videos at a confidence score of 1.0, 10 videos at a confidence score of 0.9, and so on, down to 0.2 (in most cases there were not 10 videos available with scores around 0.1 or lower). For each video, the coder was simply asked “is [language] the most prominent language in the video?” and specified “yes,” “no” if a different language was most prominent, “N/A” if there was no audible language, or “unclear” if the most prominent language is not identifiable. We did not distinguish between sung language and spoken language, and coders were instructed not to pay any attention to visuals or text, since they would be ignored by our software. Figure 1 depicts the results of our calibration exercise.

Whisper calibration task results.
We chose our research threshold by identifying the lowest one-tenth interval for which at least 75% of the sample was in the detected language, and no more than 10% of the sample was in a language other than the detected language. The samples used in this study were thus 0.6 for Hindi and Spanish and 0.8 for English and Russian. Figure 2 provides the percentage of each sample which met the threshold and the size of that sample.

Uncalibrated and calibrated sample size.
We can only provide speculation regarding why a smaller portion of the English sample met the confidence threshold compared to the other three languages. While there are more native Spanish speakers than English, and nearly as many native Hindi speakers, English is the most widely spoken second language by a considerable margin, with a variety of dialects, accents, and code switching that language detection algorithms struggle with (Barman et al., 2014; “The Ethnologue 200,” 2023; Jose et al., 2020; Thierry, 2018). English music is also common in both the foreground and background, neither of which tends to yield a high confidence as it is harder to identify sung rather than spoken language. The rest of this article is based on the calibrated samples.
Shorts
YouTube Shorts is the short-form part of YouTube introduced in 2020 to compete with TikTok. It launched first in India, expanding to the US in March 2021 and globally in July 2021. They are not limited to uploads after 2020, however: older videos less than a minute long and with a square or vertical aspect ratio qualifying as “shorts”, too. In the YouTube API, Shorts appear as any other video, so we used a method described by Violot et al. (2024), parsing the html of each video’s page when displayed on the website. For each video, we sent a GET request to youtube.com/shorts/ID, checking to see if the URL was redirected to the standard format of youtube.com/watch?v=ID. If it was not redirected, we counted it as a Short.
Results
We extracted metadata from our high-confidence samples of English, Spanish, Hindi, and Russian videos and used their upload dates to chart the growth of YouTube in those languages over time. We also compared distributions of views, likes, comments, subscribers, durations, and categories. Unless otherwise specified, figures will always be given in the order English, Spanish, Hindi, Russian (en, es, hi, ru).
Overall, we found a surprising degree of difference between English, Spanish, and Russian YouTube on one hand and Hindi YouTube on the other. The Hindi corpus was growing much faster, and the videos were much newer, with a much shorter duration, and more likes—even among relatively low-view videos—than the other three languages.
Growth
One of the long-unanswered questions about YouTube was the number of videos it hosts. YouTube shares some specific numbers, like how many of a particular type of video it hosts, how many were uploaded in a narrow window of time, or how many hours were watched, but does not disclose its total size. Only recently, with developments in random sampling, has it become possible to produce a sufficiently representative sample to provide a good estimate. McGrady et al. (2023) estimated about 10 billion as of the end of 2022, and a more recent sample by Zheng, et al. (2024) indicates the number has grown rapidly to nearly 15 billion. In this article, we do not estimate the total size of each language on YouTube but share the percentage of our samples uploaded in each language by year to estimate the growth of each over time.
To provide the highest quality estimate for growth from 2006 to 2023, we used our high-confidence language samples collected in 2024. The proportion of randomly sampled videos uploaded each year should be statistically representative of YouTube as a whole. In YouTube’s early years, only English was formally supported, and there were no Spanish, Hindi, or Russian videos uploaded in 2006 in our samples. While upload frequency increased at a similar rate for English, Spanish, and Russian YouTube from 2006 to 2019, with that time period accounting for 36.27%, 34.57%, and 32.30% of total uploads in those languages, only 6.91% of Hindi YouTube had been uploaded by 2019. There was a marked increase in uploads starting in 2020 across YouTube, but Hindi YouTube began to explode in popularity, with uploads increasing to the point that more than half of all Hindi videos (50.92%) were uploaded in 2023 alone (compared to 26.25%, 25.74%, and 30.71% in English, Spanish, and Russian, respectively). Figure 3 illustrates the proportion of each sample uploaded by year between 2014 and 2023, with all values for 2006–2023 in Figure 4.

Percentage of each language-specific sample uploaded by year, 2014–2023.

Percentage of each sample uploaded by year, 2006–2023.
Popularity
YouTube metadata includes figures for view counts, likes, and comments, which we compared by language. Given the number of videos with just a few views, a few likes, and a few comments, and the long rightward tail of all three distributions, we applied logarithmic transformations. This process reduces skewness and compresses very long tails in highly skewed data, facilitating interpretation and comparison. We calculated the natural log of every value and added a constant (1) to allow transformation of zero values. Figures 5, 6, and 7 present these log-transformed distributions by language.

Distribution of log-transformed view counts by language.

Distribution of log-transformed like counts by language.

Distribution of log-transformed comment counts by language.
The median views for English, Spanish, Hindi, and Russian YouTube were 38, 39, 37, and 34, respectively. Figure 8 presents a comparison of several views-related values for each language: mean, median, percentage of each sample at certain view count milestones, and proportion of each sample accounted for by the top 0.10%, 1%, and 10% by view count. The four languages were very similar in the proportion of videos under 100 views and under 1000 views but diverged on very low-view videos and very high-view videos. Hindi YouTube has many more videos with just 0 or 1 view than the other three languages, and far fewer videos with more than 10,000 views. Even still, more of the Hindi sample’s views are accounted for by the top 0.10% and top 1% by view count compared to the other samples. The top 0.10% of videos by view count on Hindi YouTube account for 78.60% of all views in the sample, more than 20% higher than the other three languages. In other words, more attention was concentrated in high-performing videos in Hindi even though there were fewer high-performing videos in Hindi.

View count statistics by language.
To better grasp the difference between the view count distributions, we calculated the Theil index, an entropy-based measure, sensitive to inequality in the extremes, typically used to quantify income inequality (Allison, 1978; Conceicao & Ferreira, 2000). The Theil indices for the four samples were 4.85, 4.78, 6.04, and 4.88. The higher score for Hindi YouTube means a few high values dominate the sample in terms of views.
The median likes for English, Spanish, Hindi, and Russian YouTube were 1, 1, 2, and 1, respectively. Figure 9 presents a comparison of several likes-related values for each language: mean, median, percentage of each sample at certain like count milestones, and proportion of each sample accounted for by the top 0.10%, 1%, and 10% by like count. The four languages varied by less than one percent with regard to the proportion of videos with 100 or fewer likes. Surprisingly, although Hindi YouTube had more videos with 0 or 1 view, there were fewer Hindi videos with 0 or 1 like. Also similar to view counts, far more of the likes in Hindi YouTube are concentrated in the top 0.10% (81.87% compared to 47.06%–65.50%).
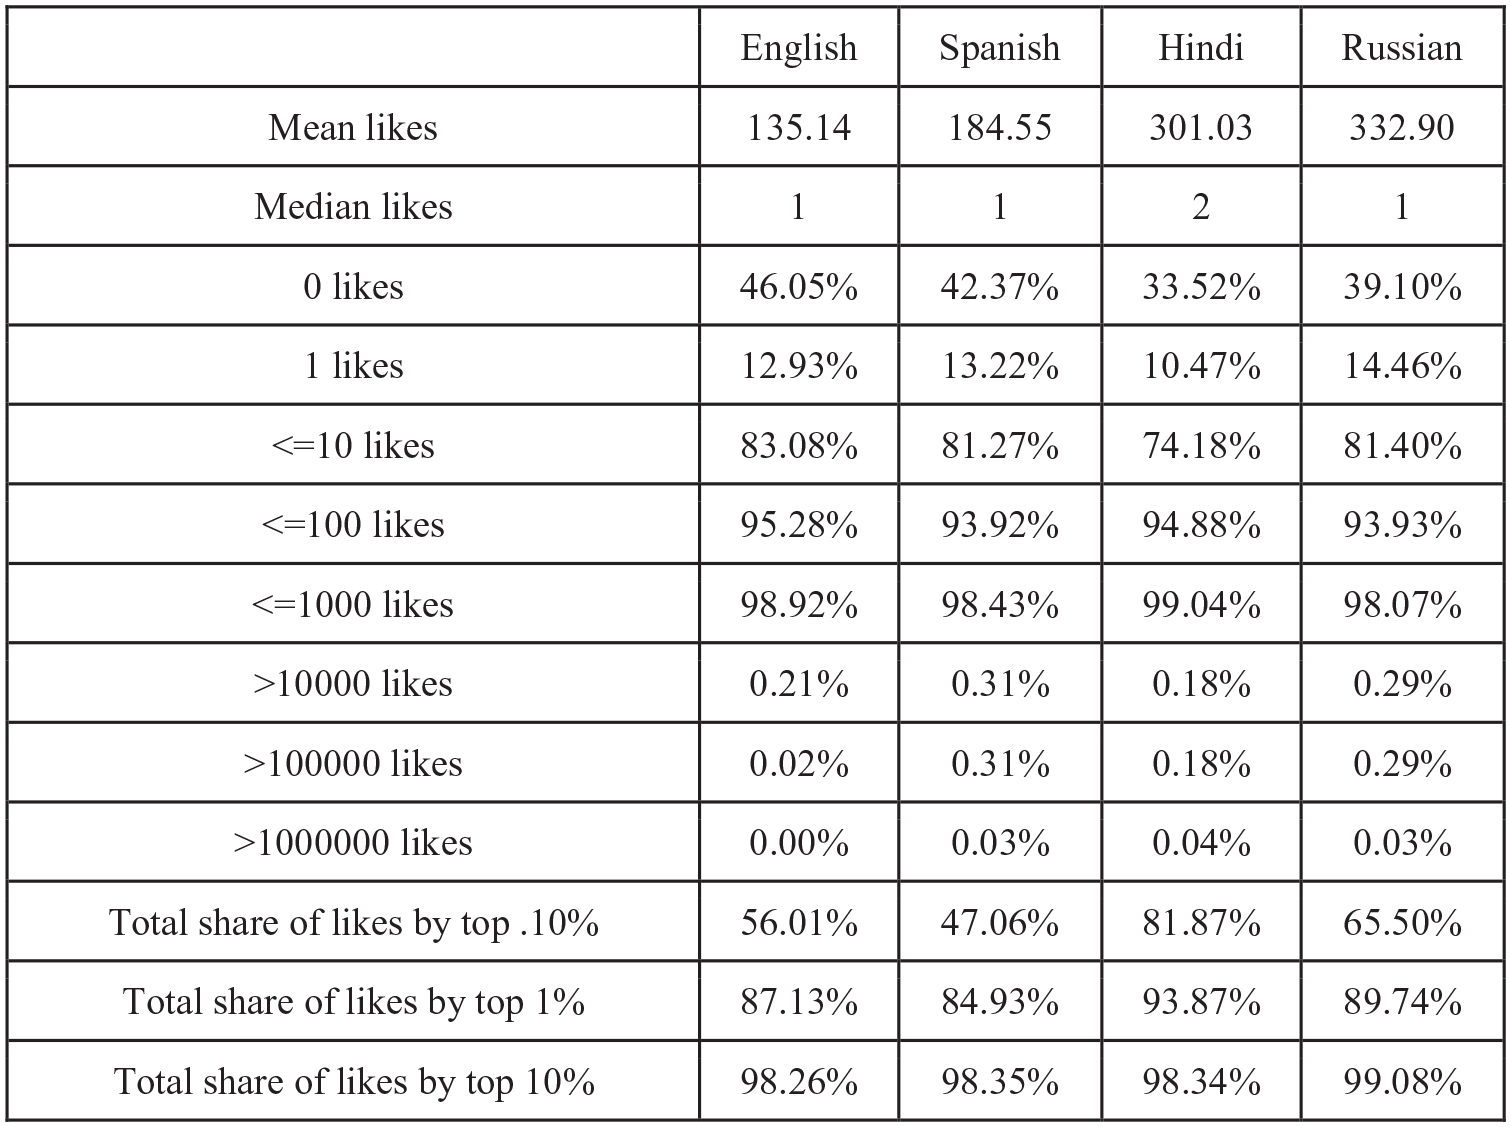
Like count statistics by language.
To further explore the relationship between views and likes, we compared the part of the sample above and including the median with the part of the sample below the median. Mean likes below the median were 0.72, 0.87, 1.78, and 0.96, with medians of 0, 0, 1, and 0; mean likes at or above median views were 270.65, 368.48, 603.38, and 663.99, with medians of 4, 5, 10, and 5.
The median comment was 0 for all four languages. Figure 10 presents a comparison of several comments-related values for each language: mean, median, percentage of each sample at certain comment count milestones, and proportion of each sample accounted for by the top 0.10%, 1%, and 10% by comment count. The four languages varied by less than one percent with regard to the proportion of videos with 100 or fewer comments. Hindi YouTube had a larger number of videos with exactly one comment than the other three languages, and a higher percentage of its sample with 10 or fewer comments. The top 1% and top 10% of Hindi videos by comments accounted for a smaller portion of total comments compared to the other languages. We did not restrict this analysis by the languages of the comments themselves, and do not know how frequently Hindi language videos had comments in Hindi.

Comment count statistics by language.
Duration
The duration of each video in seconds is stored in its metadata. The median of the four languages shows one of the most significant differences in our analysis: 119, 148, 29, and 98 seconds for English, Spanish, Hindi, and Russian, respectively. Given the distribution has such a long tail, we do not view the mean as useful as median, but there too is a stark difference, with Hindi roughly a third of the mean of the three other languages’ means. More than half of Hindi videos are 30 seconds or less, and there are very few long-form videos longer than 20 minutes (2.51%). Figure 11 provides mean and median duration, as well as the percentage of each sample above or below certain thresholds. We also include the proportion of YouTube Shorts in each sample, again finding Hindi substantially higher—roughly double the other languages by proportion of Shorts. Figure 12 is a closer look at the distribution of durations 30 seconds or under, highlighting a spike at 15 seconds which is especially prominent in the Hindi sample.
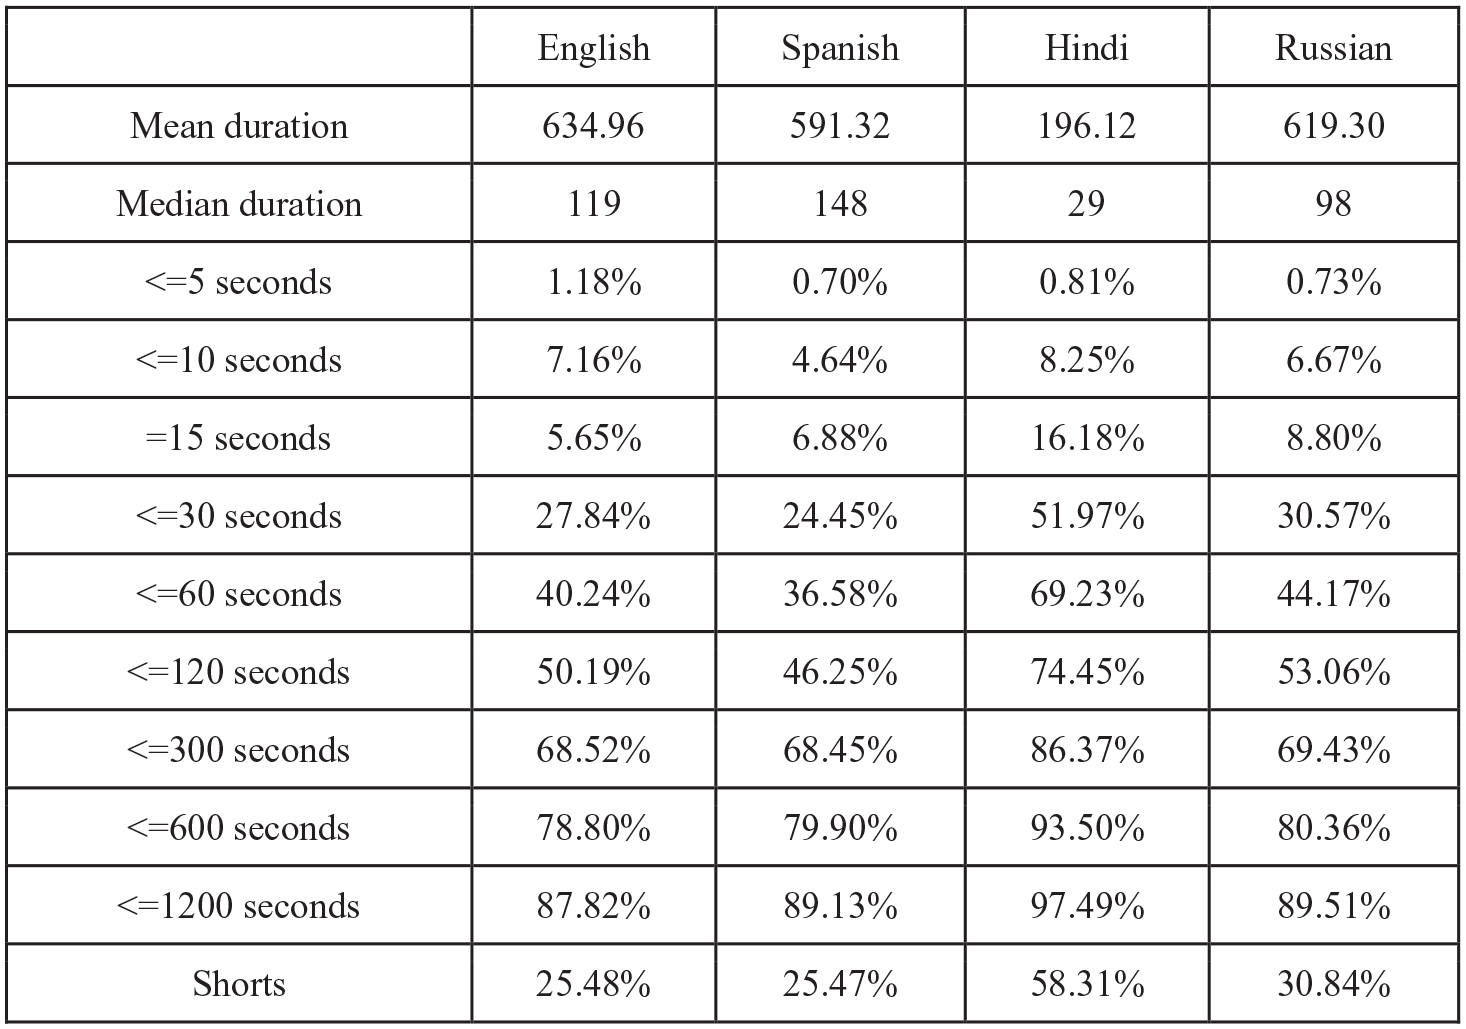
Duration statistics by language.

Distribution of duration (in seconds) for videos less than or equal to 30 seconds.
We have established that the Hindi YouTube corpus is much more recent, and with the explosion of short-form video in recent years, we isolated 2023 uploads to check for recency bias. In other words, are Hindi videos shorter because most of them were uploaded in a time when video content has been trending shorter globally? In 2023, mean duration of uploads were 460.26, 458.22, 144.50, and 372.69 and median duration was 31, 39, 21, and 23. These show a clear downward trend in video length, though Hindi YouTube is still shorter, with fewer longer videos. Figure 13 charts the median duration by upload year for all four samples.
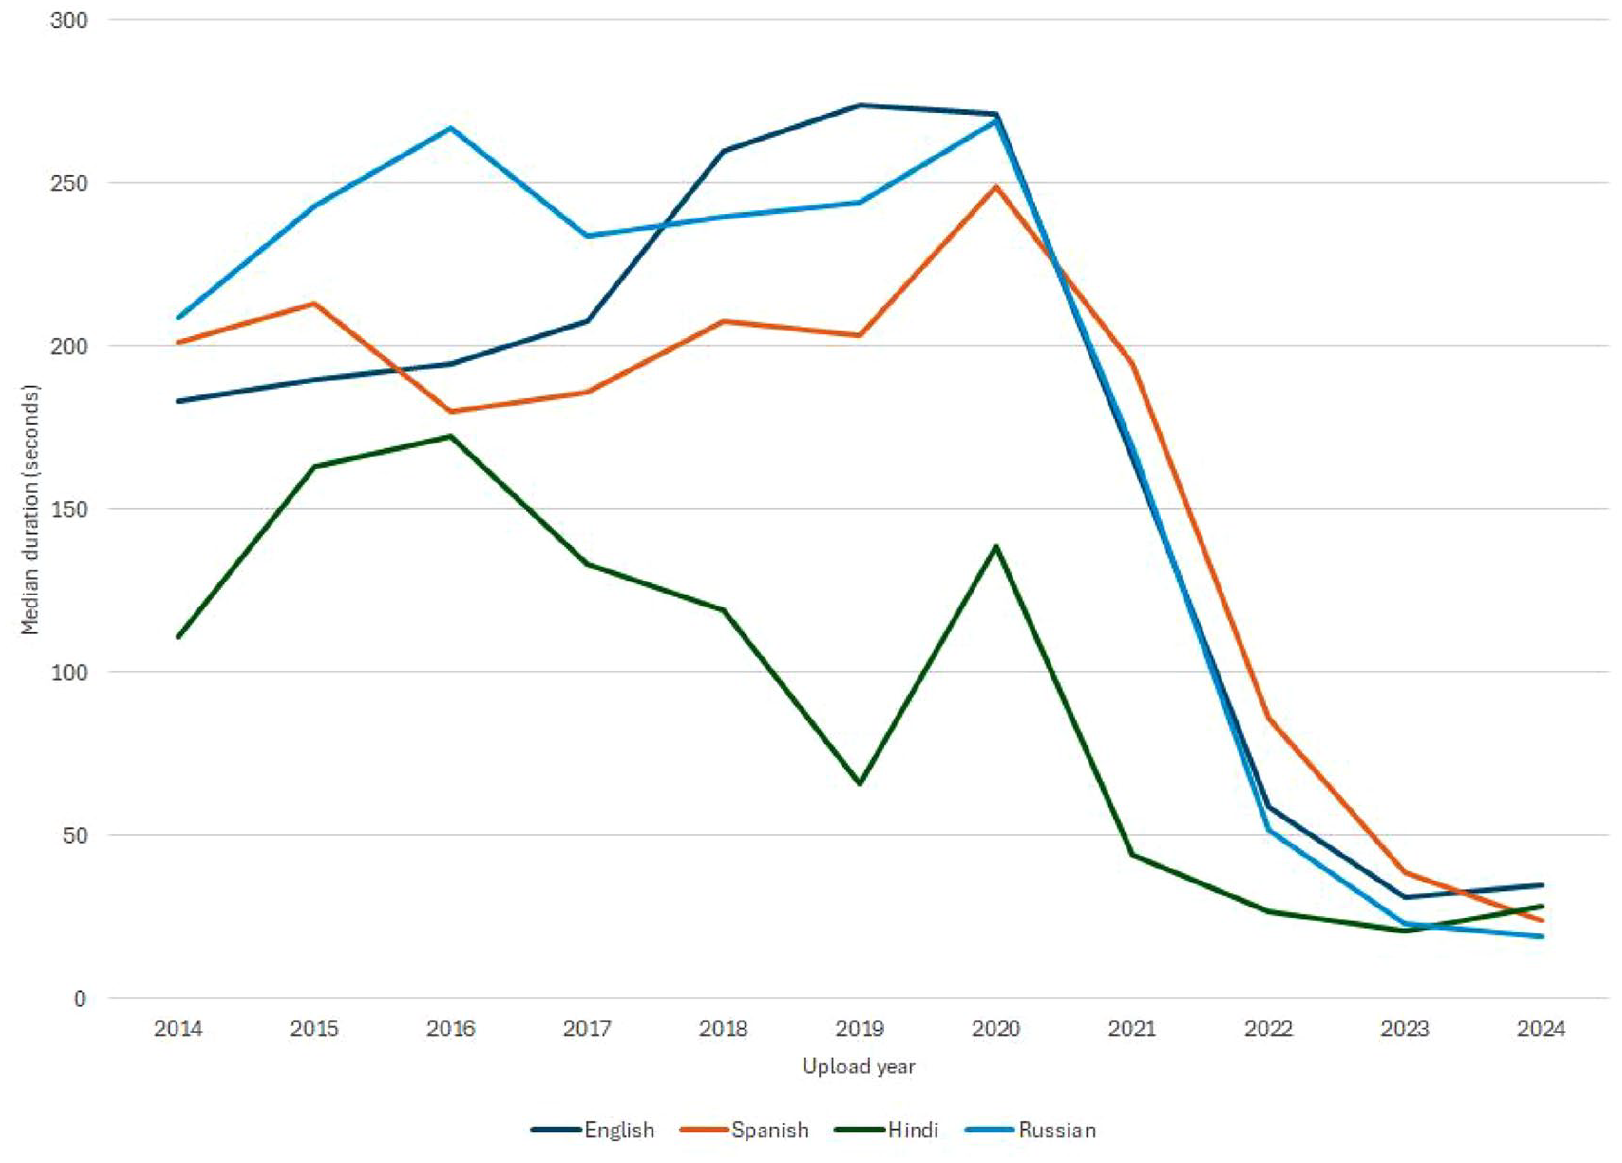
Median duration (seconds) by upload year.
Categories
When a user uploads a video to YouTube, they can optionally choose from several content categories: Autos & Vehicles, Comedy, Education, Entertainment, Film & Animation, Gaming, Howto & Style, Music, News & Politics, Nonprofits & Activism, People & Blogs, Pets & Animals, Science & Technology, Sports, and Travel & Events. The People & Blogs category serves as the default and accounts for more than half of YouTube as a whole (McGrady et al., 2023). In our samples, it ranges from 45.27% in English to 67.86% in Hindi. Figure 14 illustrates the category breakdown by language. To better understand content categorization, we also removed the default category and recalculated percentages. These results are visible in Figures 15 and 16. Gaming content was most popular on English and Russian YouTube, and lowest in Hindi YouTube. Entertainment and Education, in turn, were higher in Hindi than in the other three languages. English YouTube had a lower proportion of News & Politics videos.

Category distribution by language (all categories).

Category distribution by language (excluding people & blogs).

Percentage of each sample by category (omitting people & blogs).
We then calculated the median number of views by category to assess the relative popularity of each within the four languages. Howto & Style was consistently among the top-viewed categories. People & Blogs and Gaming were among the smallest median views across languages. Pets & Animals received significantly more views in Spanish YouTube while Autos & Vehicles were particularly popular on Hindi YouTube. Figure 17 provides these median values across languages.

Median view count by category.
Discussion
The most surprising finding from our results is just how different Hindi YouTube is from English, Spanish, and Russian YouTube. While the latter three exhibited the kinds of patterns and differences we anticipated in terms of growth rates, popularity metrics, and categories, videos in Hindi were much newer and shorter, growing at an explosive rate, and exhibiting a different pattern of liking than the other languages. We put forward some theories about why these differences may exist below, but a theme is the likely impact of India’s decision to ban TikTok in 2020. YouTube was a direct beneficiary of the move, capitalizing on the sudden demand for short-form video by launching its YouTube Shorts platform in India shortly thereafter. We can only speculate that Instagram may have benefitted from the TikTok exodus as well. The large TikTok user base in India moving over to YouTube would help to explain the rapid growth of Hindi YouTube since 2020, the shorter length of its videos, and possibly the different pattern of liking. For some of our analyses, putting aside Hindi YouTube allowed us to observe the more marginal differences between the other three languages.
Growth
YouTube hosts nearly 15 billion videos as of June 2024 (Zheng et al., 2024), and we provide here what we believe is the best estimate to-date of the growth rate of English, Spanish, Hindi, and Russian YouTube. While all four languages experienced increased growth starting in 2020, Hindi YouTube exploded in popularity. This aligns with findings by Rieder, et al. (2020), which found India second only to the US among country-flagged channels in their large sample of popular content. In our sample, more than half of Hindi YouTube was uploaded in 2023 alone.
YouTube in general reported growth in 2020, which can be partly attributed to many people staying home amid the COVID-19 pandemic (Auxier & Anderson, 2021; Staff, 2020), but we believe the rapid growth of Hindi YouTube in particular was due to the Indian government’s ban of TikTok in June 2020. India was the China-based company’s largest foreign market, with about 120 million users (Iyengar, 2020). The official reason for the ban was national security and data security (PIB Delhi, 2020) amid a rise of economic nationalism and escalating conflict along the countries’ border (Pham & Iyengar, 2020; Zargar, 2020). YouTube Shorts rushed in to fill the void, and it appears to have inherited a great deal of TikTok’s traffic (Pathi, 2024).
Popularity
Received wisdom about large American social media platforms like YouTube might lead us to believe that the site is skewed toward English-language content. Previous research has shown that the perceived dominance of English on the internet broadly is frequently overstated (Pimienta et al., 2023), and that while there is a plurality of English content on YouTube, it is not a majority (McGrady et al., 2023). The results of this study reveal that English content is not more popular, either. English had the smallest mean view count of the four samples and its median (38) was between Spanish (39) and Hindi (37), while Russian was a bit lower (34).
Hindi YouTube had the greatest proportion of videos with just zero or one view and the smallest proportion of videos with more than 10,000 views. Far more of Hindi YouTube’s total views were concentrated in the top 0.10% of videos, but the figures even out when looking at the top 10% of videos, indicating the presence of one or more extreme outliers in the Hindi sample (the most popular video in the Hindi set was about 35 million, compared to 10–19 million in the other three samples). To the extent YouTube Shorts was designed as a successor to TikTok in India, the higher degree of videos with zero or one views, and similar concentration of views in a small number of videos may indicate a different trend in YouTube’s recommendation algorithm, compared to TikTok’s reputation for surfacing videos from smaller creators.
One of the aims of this project was to examine whether liking and commenting patterns had a similar relationship to view count across languages because of the different forms of engagement, socialization, and uploader intentions that might imply. Commenting in general is uncommon in a random sample. A YouTuber asking the audience to comment may be a common theme among popular videos, but people simply do not comment on most videos. More than 70% of all four language samples had no comments at all. Hindi had a somewhat higher percentage of videos with one comment.
Most interesting was the pattern of liking videos on Hindi YouTube: it had fewer videos with no likes or just one like, which was surprising given it was the sample with the most videos with no views or just one view. One would think the sample with the most low-view videos would also have the most low-like videos, but it looks like Hindi YouTube includes more videos with low views and nonzero likes. We believe there are two possible explanations for this. One is data-based, in that Violot et al. (2024) found a higher number of likes-per-view among Shorts, compared to the rest of YouTube. While their sample was not random, there may be a feature of the Shorts interface or user base that makes them more likely to like videos. Another possibility is based on our observations while watching random videos in multiple languages that there may be more friends, family, and small-group uses of YouTube among Hindi speakers. India is regarded as a “video-first” internet culture (Ilangovan et al., 2021) in which video may be used for purposes that would otherwise be associated with text. We hypothesize that many of these videos are not part of the influencer economy but instead serve as a video analog of WhatsApp, enabling lightweight conversations within a small group.
English exhibited some opposite characteristics to Hindi, with the highest percentage of videos with just 0 or 1 like and the fewest videos with just 0 or 1 view. These figures were, however, more similar to Spanish and Russian than Hindi was.
Duration
Perhaps the most glaring difference between Hindi YouTube and the other three languages in terms of metadata is the length of the videos. More than half of Hindi YouTube is 30 seconds or less whereas the other languages range from 24.45% to 30.57%. This is reflected in the proportion of Shorts in Hindi YouTube, too, with 58.31% compared to 25.47%–30.84%. There was an overall downward trend in the duration of videos across languages, but even when we controlled for recency bias, Hindi videos were shorter. We believe this is directly related to India’s TikTok ban. Prior to the ban, YouTube was not among the most popular platforms in India, but it appears that the culture of short-form video creation cultivated by TikTok migrated over to YouTube when TikTok was no longer available. Another of TikTok’s fingerprints is visible in the number of videos in all languages—but especially Hindi—which are exactly 15 seconds long, a long-time TikTok default.
On the other side of the spectrum, the smaller percentage of long-form videos in Hindi (over 20 minutes), even after accounting for recency bias, may also point to different cultural uses, with less emphasis than other languages on podcasts and livestreams. This would make sense in the context of India’s internet infrastructure, which developed later than the most populous countries which speak English, Spanish, and Russian. Spanish language videos, by contrast, were least likely to be very short and had the longest median duration.
Categories
Interpreting the results of our category analysis is complicated by the existence of a default category, People & Blogs, and the varied extent to which each language uses the default. Bartl (2018) observed the emerging dominance of the category in his analysis of YouTube from 2006-2016. In our sample, more than two-thirds of Hindi and Russian videos were in People & Blogs, while English and Spanish were closer to half. We are unable to determine whether some categories would be more affected than others if a default did not exist. For example, is the default more common in Hindi because of a third-party app that uploads videos without prompting for a category? Is the category system simply seen as useless among Russian uploaders? Are English gaming YouTubers particular about categorizing their uploads as Gaming whereas English uploads about entertainment do not care as much whether their video is in that category or the default? Are the translations of the categories more or less meaningful? These are not questions a metadata analysis can adequately answer. As a result, we focus most of our attention on the portion of the sample where we know the uploader made a decision to choose a category, and therefore omitted the default. As we did not find good research about categorization practices among users, we also cannot know how users interpret these categories in ways that are similar or different, such as what distinguishes Entertainment from Comedy or Science & Technology from Education?
Excluding the default category, we find more Music videos in Spanish YouTube, less Entertainment in Russian, and a lot of Gaming content in English and Russian. There may be a lot of research about the political content of English-language YouTube, but the percentage of videos categorized as News & Politics in English is only about a third of the other languages. There was somewhat more Entertainment content on Hindi YouTube, which may reflect the large amount of Bollywood media we observed, but the largest difference was in the Education category, which is the second most popular in Hindi at 22.38%—more than double any of the others, and three times what we see in Russian. This again points to YouTube possibly occupying a different cultural space in India, where it is just as much an educational resource as source of entertainment or platform for expression.
Conclusion
In comparing the metadata of four language-specific random samples of YouTube videos, we can highlight broad patterns and anomalies but are not in a position to make claims about the content or character of the videos in our samples. We believe this is important work for three reasons: first and foremost, there is little research which attempts to describe broad sections of our digital communications infrastructure (Tufekci, 2014). This is, in large part, because random sampling is necessary to do so but presents a daunting challenge to researchers. Now equipped with the ability to obtain random samples of YouTube videos, we can finally begin this kind of broad analysis. We have chosen language-based samples as a starting point because we believe cultural differences in platform use to be among the most poorly understood subjects in internet research, but it is just one of many ways to divide these samples. In undertaking this project, we want to demonstrate the kinds of insights to be gained just from the level of metadata. Consistent with Matassi & Boczkowski’s (2023) call for more cross-platform research, we are also working on a comparison between YouTube and TikTok metadata, as well as a watermark detection tool to better understand the ways people may use YouTube to reupload content created with other apps, either for archival purposes or to access additional audiences.
The second reason this work is important is because of the findings themselves. Even at the level of metadata, there are subtle differences between English, Spanish, and Russian YouTube, with median views of Russian falling behind the other three languages, a smaller percentage of videos categorized as News & Politics in English, and a longer median video duration in Spanish. More obvious, however, were the large differences between those three languages and Hindi YouTube, which has a much sharper growth rate and videos that are much newer, with more than 90% uploaded just since 2020 and more than half—50.92%—uploaded in 2023 alone (compared to 26.25%, 25.74%, and 30.71% in English, Spanish, and Russian, respectively). While all four samples had a disproportionate number of videos exactly 15 seconds long, which we believe is due to the TikTok default length, Hindi videos were much shorter than the other three languages, with a median of 29 compared to 119, 148, and 98 in English, Spanish, and Russian, respectively. At the other end of the spectrum, Hindi also had fewer long videos, with nearly three-quarters of all videos—74.45%—coming in at less than or equal to two minutes, compared to 50.19%, 46.25%, and 53.06% in English, Spanish, and Russian, respectively). These figures point to the influence of TikTok on our samples, and specifically the banning of TikTok by the Indian government in 2020, which led a culture of short-form video creators to migrate to YouTube Shorts.
This work also provides a method for researchers to identify areas for further qualitative work. We and our colleagues are undertaking multiple new research projects based on findings from this article. For example, from our finding that Hindi YouTube has a different relationship between views and likes, we are investigating the use of YouTube for more small-group socialization among Hindi speakers, uploading videos meant for friends and family rather than consumption by a wide audience. We are also trying to learn more about educational uses of YouTube among Hindi speakers, based on our finding that the Education category accounts for more of Hindi YouTube than the other three languages (22.38%, compared to 8.39%, 8.94%, and 7.09% in English, Spanish, and Russian, respectively). In another project, we replicated this method with a Korean sample. The metadata revealed more News & Politics content and more engagement with that content on Korean YouTube, leading us to explore South Korea’s unique political dynamics between news produced by YouTubers and legacy media companies (Pyo, 2023). In other words, this method of language-specific random sample analysis can surface broad patterns and anomalies but also provide researchers with a map of YouTube indicating “where to dig” with qualitative, quantitative, or computational approaches that address video content.
Achieving a sophisticated understanding of what is on YouTube is a complex, multistage process that requires novel data sets, calibrating language detection tools, metadata analysis, and ultimately content analysis, ethnography, and survey research in each language studied. This article demonstrates the value of starting that process, acknowledging the importance of using qualitative methods to understand, for example, the unique way Hindi users use YouTube.
Footnotes
Funding
The author(s) disclosed receipt of the following financial support for the research, authorship, and/or publication of this article: Work was supported by grants from the Ford Foundation, the John S. and James L. Knight Foundation, and the John D. and Catherine T. MacArthur Foundation.
Declaration of conflicting interests
The author(s) declared no potential conflicts of interest with respect to the research, authorship, and/or publication of this article.
Data availability statement
To preserve the privacy of YouTube users, data will not be publicly available, but may be available to other researchers on request or through SOMAR.