
Abstract
This paper investigates how non-experts understand figurative language created by computer scientists to describe cybersecurity incidents. Its method is informed by applied linguistics, crisis communication, and cybersecurity research. Using a set of cyberattack stories composed with figurative words and a set composed with more literal versions, and an online survey, the study examines whether the use of metaphor and neologism clarifies or obfuscates the technical aspects of cybersecurity for non-experts. The results showed participants in the literal set scored significantly better in comprehension. However, participants made important errors in both literal and figurative versions. This underlines the need for organizations to employ language strategically and provide more effective explanations of cybersecurity situations.
Keywords
Introduction
The recent proliferation of online security breaches has highlighted both the need for and the lack of accurate information, making cybersecurity an issue that is not easy to explain to the public but that can, nevertheless, lead to major losses for individuals and serious reputational damage for organizations (Kuipers & Schonheit, 2022). For example, IBM Security estimates the global cost of a data breach in 2024 to be $4.88 million (IBM Security, 2024). Global losses from cyberattacks are expected to reach $10.5 trillion annually by 2025 (Morgan, 2020). At the same time, and despite an increase in training in security protection measures implemented by various organizations, users are still unclear about the factors involved, with many resigned to the risks of cyberattacks and attesting to “breach fatigue” (Bentley & Ma, 2020; Reitberger & Wetzel, 2017). Research by the Pew Institute in 2017 found that less than half of the US participants surveyed could answer more than 50% of questions about cybersecurity correctly (Pew Research Institute, 2017). Such facts underline the need for a systematic understanding of how organizations can communicate cybersecurity aspects strategically to non-experts for more effective understanding.
This paper examines the impact of figurative language on how non-experts understand the issues involved in cybersecurity. Using a risk and crisis communication framework, a linguistic-pragmatic approach and a quantitative method with an online survey, its goal is to investigate non-expert understanding of implications in descriptions of cybersecurity incidents that employ figurative language and compare this understanding with descriptions that employ more literal words. The study questions the widespread tenet in much public communication research that figurative language facilitates understanding of technical concepts. Its objectives are (a) to explore the communicative effectiveness of lexical choice in the design of messages involving cybersecurity, and (b), to contribute to the research on the use and effectiveness of lexical choice in communicating complex information to non-experts in organizational contexts.
Literature Review
Cybersecurity incidents are “ambiguous crises” (Bentley, 2018, p. 214), in that it is often difficult to identify the different actors and events that compose them. They are also often “silent” (Naidoo et al., 2024), in that organizations sometimes take long to reveal them to the public, and even to become aware internally that they occurred. Also, because of the data leak, the post-crisis period can last for several years after the breach. These incidents have been studied from different angles in the organizational crisis literature.
One angle has focused on the strategic choice of content in organizational communication, such as in company statements and press releases (e.g., Diers-Lawson et al., 2021; Jenkins et al., 2014). For example, Naidoo et al. (2024) conducted a content analysis of 378 press releases and found that the three most common strategies were acknowledging the seriousness of the situation for stakeholders, assuring them that the organization is now in control of the situation, and stating that the infrastructure has been restored and strengthened. N. Kim and Lee (2021) focused on the intercultural aspect of crisis communication in examining 108 apology statements of CEOs in the United States and South Korea after data breaches. Informed by Hofstede’s cultural dimensions, the research found significant differences in the ways leaders in the two cultures communicated. Using a narrative-semiotic analysis, Hassanzadeh et al. (2020) studied the public communication generated by Equifax after their 2017 data breach, focusing primarily on how the company constructed their accountability. They found that statements produced by the company consistently placed Equifax as a victim of the breach and the company’s corrective actions as helping the users.
Another angle has focused on public perception of organizational reputation after a crisis in relation to how the crisis was managed (e.g., B. Kim et al., 2017; Gwebu et al., 2018). For example, using an online survey, Pang et al. (2022) studied organizational silence, or lack of public communication, after a data breach in a fictitious organization. Their results indicated that the way silence is broken, whether intentionally or by external forces, has a significant effect on how the company is judged by the public. Bentley (2018) conducted a text-completion experiment in which participants were given a scenario describing a data breach in an online retail store. The research found that most respondents appreciated statements that included how the problem will be fixed and how the relationship will be rebuilt through compensation. Although most respondents appreciated statements of regret, less than half expected an actual apology. Such results indicate the possibility that non-experts “do not parse crisis communication elements the way scholars do” (Bentley, 2018, p. 224), underlining the need for a better understanding of non-expert user understanding of cybersecurity crises.
Language is routinely found at the root of costly misunderstandings that lead to organizational crises in most industries (see, for example, Lacagnina, 2009, for language issues in the aviation industry, and Marsen (2014b), for language issues in the aeronautics industry). Despite the seriousness of cybersecurity crises, not enough research exists on the role of language in either attempting to prevent them or managing them when they occur. Both the dominant crisis communication theories, Image Repair Theory (e.g., Benoit, 1997) and Situational Crisis Communication Theory (e.g., Coombs, 2007) deal with strategies used to manage crisis and organizational reputation but do not focus in any depth on the use of language or discursive choice (Marsen, 2020).
The use of figurative or creative language, defined as “juxtapositions or contrasts between two different contexts or patterns, thereby producing surprising or unpredictable forms” (Marsen, 2014a) is a common technique of communicators in constructing engaging texts that clarify complex issues. Figurative language, such as metaphors, neologisms (newly coined words) and anthropomorphisms (humanizing nouns or attributing human actions to inanimate or non-human agents) is often used when explaining complex ideas by creating links between them and observable facts (Giora, 2002). As such, figurative language plays a prominent role in public information discourses, such as technical and science communication, and practitioners in these fields are widely encouraged to create metaphors and analogies when explaining complex or technical information to the non-expert public (Angler, 2017; Gilbert, 2013; Herrera-Soler & White, 2012; Perara & Stocklmayer, 2013; Skerlep, 2001).
However, because figurative language depends for meaning on interpretive and contextual factors, it increases the inherent ambiguity of language, favoring dramatic and emotive effects rather than precision. Therefore, a possible risk is that the use of figurative language in crisis situations may be inappropriate in some cases as it might mask the urgency and gravity of the described events. This risk is accentuated in cybersecurity communication because many metaphors were coined by the insider computing community for internal communication rather than as a way to explain complex processes to outsiders. For example, words denoting malware and vulnerabilities are typically chosen by computing experts who discover cybersecurity issues. In 2004, Mydoom was chosen based on the name mydom found in the code (Dunham, 2004). The 2008 Koobface malware was named to refer to Facebook, the medium by which it spread (K. Thomas & Nicol, 2010). The 2012 Heartbleed vulnerability was named in reference to a heartbeat software module that repeats a regular signal to confirm connectivity (Durumeric et al., 2014). The 2017 WannaCry ransomware was named after a suffix .wcry found in the code (Chen & Bridges, 2017). In these cases, a pattern is to take something found in the attack, and creatively modify it to represent the threat. The question remains whether such words, by drawing attention to creative play, minimize the gravity of cyberattacks in the mind of non-expert users.
Research in cognitive linguistics has explored hidden or assumed meaning not expressly stated but implied in language and the impact of context in interpreting meaning—the distinction between sentence meaning (the linguistic properties of a sentence) and speaker meaning (the intentions for uttering the sentence in particular circumstances; Noveck, 2018, p. 21). As such, this research has been especially conducive to the study of misunderstanding and, by extension, the use of figurative language, irony, and sarcasm (see, e.g., Marsen, 2009; Colston, 2015; Vega Moreno, 2007).
Metaphor is one of the most studied linguistic phenomena. Defined as the transfer of a word from one linguistic-conceptual domain (the source) to another (the target), metaphor is an example of “loose language” (Rubio-Fernandez, 2007), comparable to other tropes, such as neologism and hyperbole, which have strong communicative and interactional effects but which may lead to miscommunication in situations where precision is required (Danesi, 2003; Kovecses, 2002; Lakoff, 1993). Experimental research on metaphor has also attempted to ascertain the cognitive effort involved in interpreting it—that is how long it takes to cognitively process metaphors and whether they go through a literal translation process or are processed directly (Bambini & Resta, 2012; Gibbs, 2023). These studies generally show that metaphor is processed as quickly as literal lexis, unless contextual factors come into play. For example, a study by Gibbs and Colston (2012) tested participants on their speed in processing metaphors in three conversational contexts: one in which the metaphor strengthens the context, one in which the metaphor adds new information to the context, and one in which the metaphor contradicts the context (in other words, in which the interlocutor uttering the metaphor disagrees with or contradicts the other interlocutor). They found that participants took significantly longer to read the metaphor in the contradictory context than they did in either of the other two.
Metaphor has also been studied in research on language in cybersecurity communication, much of it inspired by mental models (Johnson-Laird, 2010) and conceptual metaphor theory (Lakoff & Turner, 1989). Informed by conceptual metaphor theory, Wolff (2014) groups cybersecurity metaphors into conceptual categories that represent the root idea on which these metaphors were constructed—burglar, war, and health categories. She proposes that cybersecurity metaphors are distinctive because they do not refer to embodied activities but to abstract elements. Raja et al. (2011) designed visual metaphors (images) in an experiment testing participants’ understanding of firewall warnings. They found the visual metaphors helped in clarifying the risks in firewall functionality. Recognising the pervasiveness of metaphors in cybersecurity discourse and using a Natural Language Processing approach, Hilton et al. (2022) devised an algorithm to identify and extract them from texts. Maroto (2024) brought a cross-linguistic approach to the discussion by studying the translation of cybersecurity metaphors from English to four Romance languages. She aimed to determine if the metaphorical form was maintained in the translation and found that, although it was, the translations carried different cultural connotations.
Within this context, our research question is:
RQ1: Does the use of figurative words to describe technical activities affect non-expert users’ understanding of cybersecurity?
The Study and Method
We employed a questionnaire to perform an experiment that aimed to assess whether the use of figurative language developed within the computing community hinders or assists comprehension of events that occur during cybersecurity incidents. The experiment was cleared by Flinders University Ethics Board. We tested the terms data breach, vulnerability, encrypted, phishing, virus, trojan, ransomware, buffer overflow, exfiltrate, identity theft, and cryptocurrency.
Questioning the widespread assumption that figurative language is helpful in non-expert communication, we tested these hypotheses:
H1: Participants shown the figurative stories would show less understanding than participants shown the more literal stories.
H2: Participants shown the figurative stories would take longer answering the questions than those shown the more literal stories.
H3: Participants shown the figurative stories would show a level of understanding below a neutral level, that is 4 of 7.
H4: Participants shown the literal stories would show a level of understanding above a neutral level, that is 4 of 7.
Materials
We wrote six short news stories describing hypothetical cybersecurity incidents, 50 to 75 words each (see Appendix). One set of stories was composed with selected figurative words, and the other set was composed with more literal descriptions. The literal stories were a few words longer than the figurative ones because they included explication of the tested terms to reveal the implied meaning. Two of the six stories were about an incident involving a company, and four were about incidents involving individuals. All companies described were fictional to avoid legitimacy issues in participants’ assumptions about the company based on prior reputation. The stories simulated the style of news stories and Business to Client messages as realistically as possible while being brief enough for a questionnaire.
We note that, although cybersecurity attacks are often grouped under an umbrella term (usually hacking), they actually involve different activities. The stories were created to represent a range of the most common kinds of incidents, as described below.
Data Breaches and Vulnerabilities
The term vulnerability generally means a mistake or oversight in a system, and a common attack is to use the vulnerability to break through any restrictions on accessing confidential data, and then exfiltrate the data—transmit it elsewhere. One common vulnerability is a buffer overflow, where input data fields, perhaps on a web page, can be used to enter an unexpectedly long text. Unless guarded against, this can expose internal data intended to be confidential. As a defence, confidential data is often encrypted before being stored. If data is encrypted, it will be unusable to attackers unless they obtain the key or devote often infeasibly substantial computing resources.
Phishing
Phishing is essentially social engineering, a confidence trick, where someone is persuaded to do something that seems beneficial but is actually detrimental. In this way, phishing resembles fishing, where a fish is lured with bait that conceals a hook, and the word is a metaphor creatively spelt. Different kinds of phishing mechanisms are used by attackers and these are often confused in messages to clients.
Phishing for Passwords
Electronic communication often includes email addresses and web links, but their structure is poorly understood by non-experts. For example, users tend to assume that any use of an organization name in an email address or link indicates a legitimate association with that organization (Albakry et al., 2020). Deceptive addresses are easy to obtain, and when busy or distracted, many users may not even look at addresses closely. Entering credentials into a fraudulent website reveals those credentials to whoever runs that website, thus providing attackers with usernames and password for the legitimate website. The main approach to preventing phishing for credentials is two factor authentication (2FA), in which users need two different methods (factors) to log into a secured website (Stojmenovic & Biddle, 2018).
Phishing for Money
As a kind of social engineering, phishing can involve other dangers. Whereas fraudulent websites serve primarily to capture user passwords, others can be designed to capture important personal information, such as credit card details. For example, email might promote e-commerce websites, where the sites offer merchandise or services, but in reality obtain credit card details, which are used to make fraudulent payments.
Phishing with Malware
In cases where phishing email persuades users to install software on their computer, one persistent idea seems to stem from the term virus. This term became widely known with early personal computers where the software was transmitted on floppy discs. Nowadays the cybersecurity community uses the term malware for any kind of malicious software. Some kinds of malware are still distinguished. Ransomware typically involves the encryption of the contents of files, then demanding a ransom payment, in order to decrypt them. Only the attacker has the decryption key, and without it the files are unusable. If the files are important enough, users may pay. This may be avoided if a backup copy of the files was made previously, but the restoration process may take time, and care needs to be taken not to re-install the ransomware.
Table 1 shows the distribution and content of the stories.
Stories Used in the Study.

For each story, there was a set of five questions to determine understanding of important elements. The questions for each matching story, one figurative and one literal, were the same. All questions had the form of a statement and asked for level of disagreement or agreement using a 7-point Likert scale (Strongly Disagree to Strongly Agree), with strength of agreement intended as an indication of confidence. Half the statements were regarded as true, and the answers coded as 1 to 7, and half were regarded as false, and reverse coded as 7 to 1. This allowed us to compute aggregate scores per story and per participant, where 7 would be the highest score possible, and 1 the lowest. The Appendix shows the stories and questions.
The questionnaire was prepared and conducted using the Qualtrics online questionnaire software (www.qualtrics.com). In pre-testing, the time necessary to complete the survey was approximately 10 min. The questionnaire consisted of initial checks, followed by the stories and associated questions. The initial check confirmed consent, eligibility, and demographics.
Participants
Participants were a diverse sample of Internet users who do not have expertise in computer or Information Technology (IT) fields. We used the research participant recruitment service Prolific (Palan & Schitter, 2018), which has been shown to be one of the highest quality services from online participant recruitment (Douglas et al., 2023; Palan & Schitter, 2018). We successfully recruited 100 participants, not including several who were eliminated because they were identified by the survey software as potentially automated. Of these, 51 participants were randomly assigned to the Figurative condition, and 49 to the Literal condition. As supported by Prolific, gender was well-balanced, with 51 self-selecting as Female, and 49 as Male. Daily internet use was selected by 15 participants, and more than daily use was selected by 85. We restricted recruitment to ages 18 to 64 years and offered five categories by decade. The numbers in each category are shown in Figure 1. As can be seen, the categories are similarly sized, but with a smaller count in the range 60 to 64. We also asked for educational background, with categories for high school, trade certificate, Bachelor’s degree, and postgraduate. The numbers were greatest for Bachelor’s degree, then high school, trade certificate, and postgraduate qualifications, also shown in Figure 1.
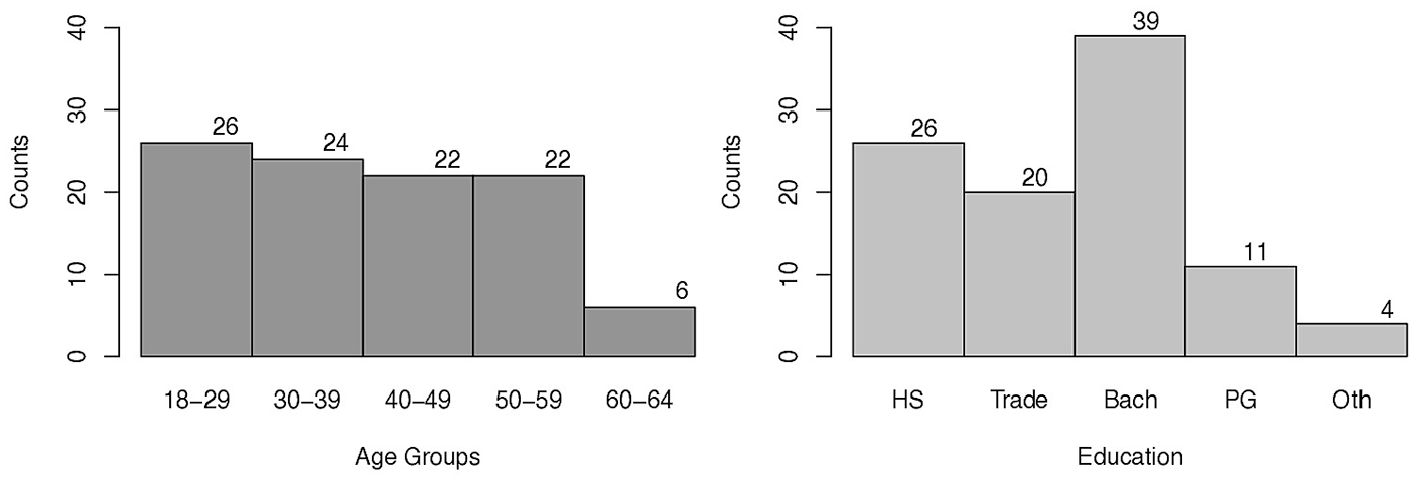
Study demographics, showing the distribution of participants by age group, on the left, and by education, on the right.
Procedure
The participants accessed the questionnaire via the Prolific recruitment platform, where the recruitment notice described the questionnaire as taking 10 to 15 min, and involving several news stories about the Internet, with questions about each story. We recorded the time the participants spent on each story with its associated questions.
Results
The descriptive results for scores are shown in Table 2, and the times are shown in Table 3. Both tables show mean, median, and standard deviation for Figurative and Literal stories, overall and individually for each story. The overall mean scores for the Figurative stories were 5.2 (out of 7), and 5.7 for the Literal Stories. For each story, the results were mainly in the 5 range. The overall mean times for Figurative and Literal stories were mainly in the range of 60 to 90 s.
Descriptive Statistics For Scores, in Both Figurative (Fig) and Literal (Lit) Conditions.

Note. The overall score for all stories is at the top, followed by each story separately.
Descriptive Statistics for Time, in Seconds, for Both Figurative (Fig) and Literal (Lit) Conditions.

Note. The overall time for all stories is at the top, followed by time for each story separately.
These scores and times are also shown as histograms for each condition in Figures 2 and 3. As can be seen, there is a difference for scores, but less so for times. The scores and times for individual stories and condition are shown as boxplots in Figures 4 and 5. The boxplots for score show a pattern where the Figurative scores are less than the Literal scores, but there is no clear pattern in the boxplots for times.

Histograms showing the distributions of overall mean story scores for each condition, Figurative on the left, and Literal on the right.

Histograms showing the distributions of overall mean story times for each condition, Figurative on the left, and Literal on the right.
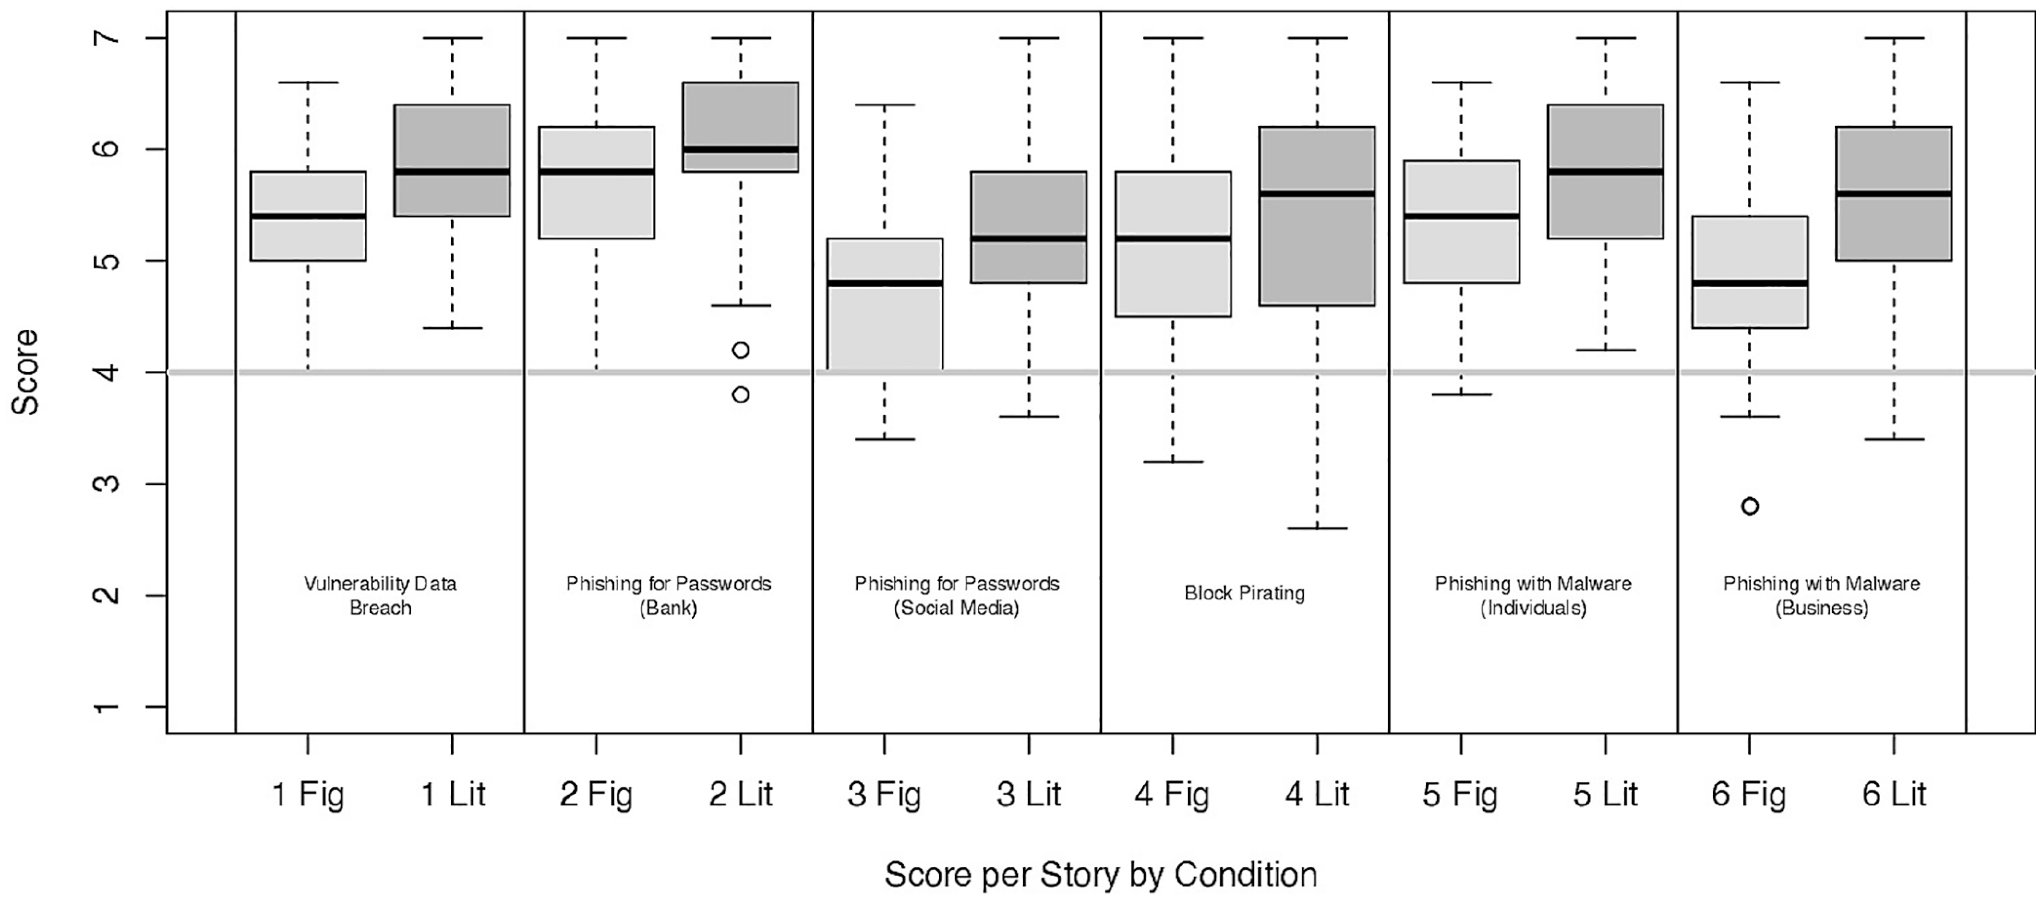
Boxplots showing the distributions of mean scores for each story and condition. (Boxplots show a dark line for the median, shaded box for the inner quartiles, and whiskers for the outer quartiles, and circles for outliers.)
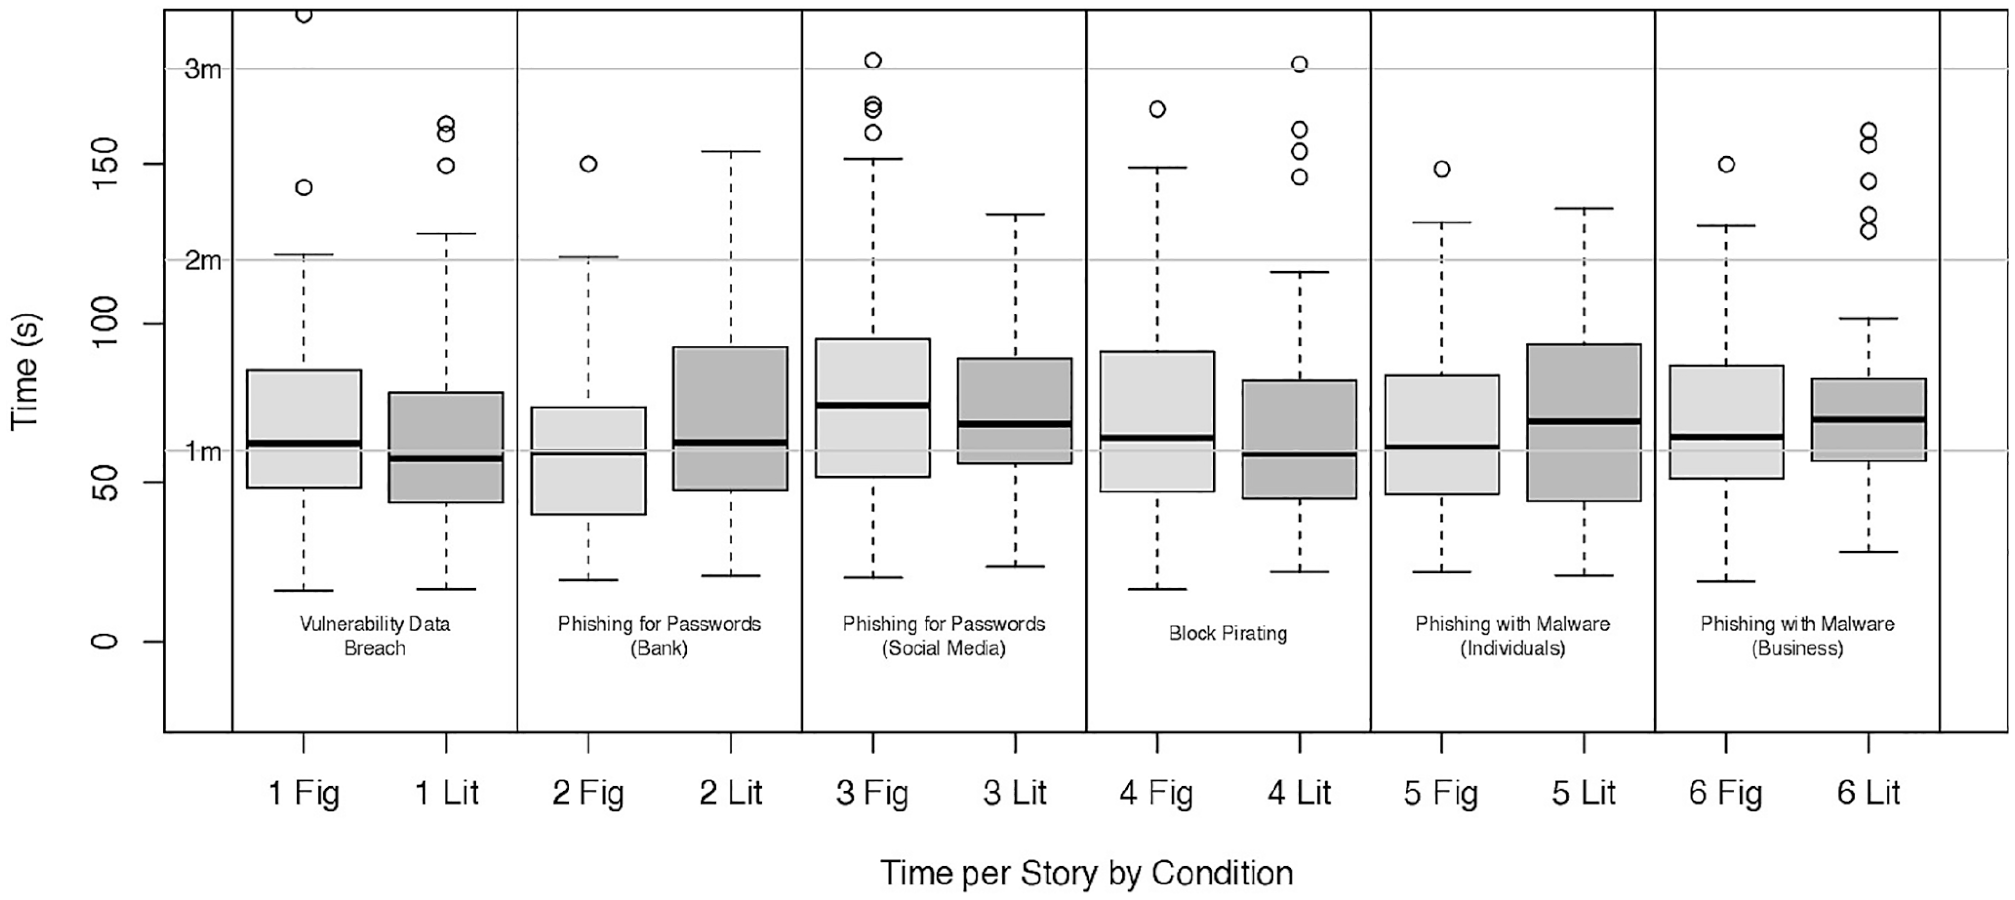
Boxplots showing the distributions of mean times for each story and condition. (Boxplots show a dark line for the median, shaded box for the inner quartiles, and whiskers for the outer quartiles, and circles for outliers.)
Analysis
Our hypotheses concern the two conditions, figural and literal wording, and the participant understanding of the stories, as determined by two dependent variables: the score answering questions, and the time taken to answer the questions. We therefore conducted a preliminary multivariate test, using an alpha value of .05. We conducted a Hotelling’s t2 test comparing the two conditions, and the result was t2 = 10.911, (df1 = 2, df2 = 97), p < .001. We therefore continued our analysis, and for the next two hypotheses applied a Bonferroni correction adjusting the alpha value to .025. Correlations for score and time are shown in matrices in Table 4, indicating no correlation overall and in the figurative condition, and a weak possible correlation in the literal condition.
Correlations Between Score and Time, Overall, and for Figurative and Literal Conditions.

Hypothesis 1
The hypothesis was that better scores would result in the literal condition than in the figurative one.
We adopted an alpha value of .025 and conducted a two-sample one-sided t-test for Hypothesis 1, after confirming suitability of the distribution for normality and homogeneity of variance, acceptably minimal skewness and kurtosis. The result showed significance, (t(85.44) = −4.536, p < .0001), with a large effect size (Cohen’s d = 0.9). This supports Hypothesis 1, and we conclude there is evidence that the literal stories led to better understanding than the figurative stories.
Hypothesis 2
Following the same approach, we conducted a two sample one-sided two t-test, but found no significance (t(96.02) = −0.515, p = .696). We therefore conclude there is no evidence that literal stories were understood more quickly than figurative stories. We again determined the effect size, where the effect size was low, (Cohen’s d = 0.1), and power analysis showed a result of 0.0446, suggesting that a much larger sample would be necessary to consider significance.
Hypothesis 3 and Hypothesis 4
As can be seen from the descriptive data, the scores for both the stories in Figurative and Literal conditions were largely above the neutral score of 4 out of 7. It is therefore hardly necessary to conduct tests. However, considering we had already conducted one test on scores, we again reduced the alpha value to .0125, and conducted a one-sided single-point t-tests for hypothesis 3, finding no support (t(50) = 21.129, p = 1.000) and similarly a one-sided single-point t-tests for hypothesis 4 was supported (t(48) = 19.939, p < .0001). The effect sizes were 3.0 and 2.8 respectively, and in both cases, power was greater than .999.
Post Hoc Exploration
We conducted t-tests for effect of gender on score in each condition and found no significant differences. We conducted an omnibus one-way ANOVA for effect of age group on score in each condition, treating each group as categorical, and also found no significant differences. We took the same approach for effect of education, and again found no significant differences. We conducted an omnibus one-way ANOVA to explore whether the scores for individual stories were different. We again tested each condition separately, and neither showed any significant difference. We did the same for the time taken for each story, and again found no significant differences. These reflect the data shown in Figures 4 and 5, which show some differences, but none of them extreme. We also conducted a regression analysis on the combined effect of all the factors on scores and found that only the condition (Figurative or Literal) had a significant effect.
Discussion
As the analysis shows, on the whole, participants understood most of the information presented in the stories, indicating general familiarity with the context and situations described. However, while the scores across stories show little difference, and in both conditions the mean scores for stories were above neutral, many participants scored poorly in some stories, and some questions were answered poorly in both figurative and literal conditions. To explore this, we considered a score of 1 to 3 (of a possible 7) as errors, and then counted the number of errors made per participant. The results are shown as histograms in Figure 6. In the Figurative condition, the median number of errors was 9 (from a possible 30), and everyone made at least three errors. In the Literal condition, the median was seven errors, and eight participants made 0 to 2. So, the Literal condition does seem to have been better understood, though even there at least half the participants made at least seven or more errors. Of particular note is the relationship between the number in the Figurative condition and the number in the Literal condition. While many are lower in the Literal condition, some are quite similar, and a few are even higher.
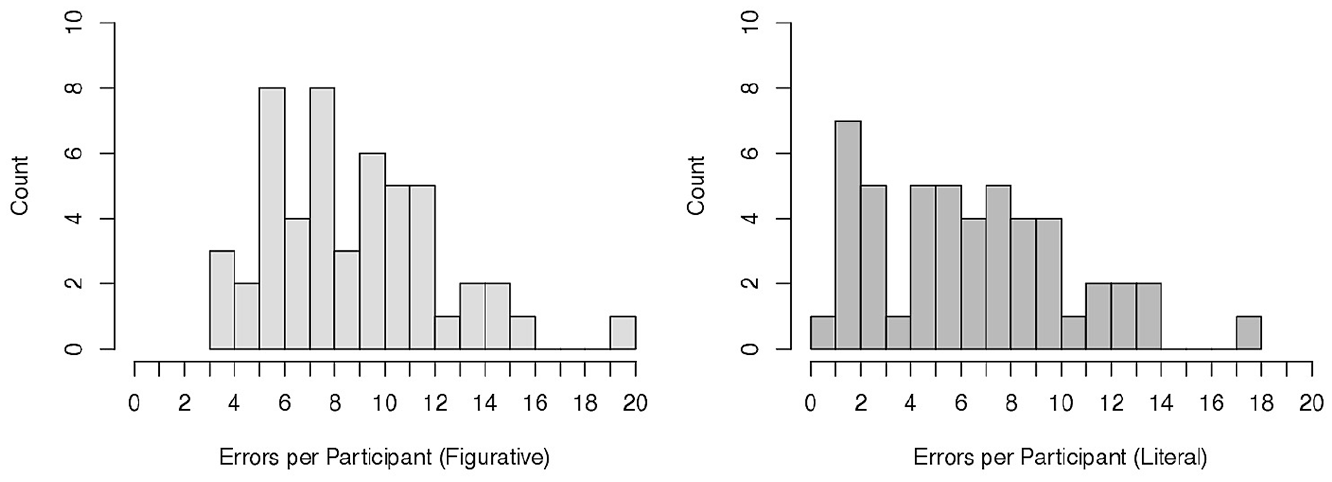
Histograms showing the number of errors made per question, in the Figurative (left) and Literal (right) conditions.
Focusing on the errors of more than 20% of participants in each story and condition, we observe the following results (see Appendix for the stories). For the figurative versions, the highest overall error rates were for Story 3, with the highest rate in the question whether hackers could add new BookParley friends as they wish (Q3—31% for the figurative version and 39% for the literal). This was followed by errors in whether a second login factor would provide protection (31% for the figurative version and 27% for the literal). A significant difference in error rate between the two conditions was in the question whether hackers emailed the users with a link to a fake website (Q5—39% for the figurative version and 0% for the literal). These results are surprising because the story involved individual users and their social media accounts, which is a situation that we expected most participants to be familiar with. Also, phishing for passwords has been found by other researchers to be the most common type of phishing (Alkhalil et al., 2021), which makes this misunderstanding even more concerning. However, the 0% rate for Q2 in the literal version indicates that the change in wording did produce a positive effect.
Story 4 also had high error rates in two questions in both figurative and literal versions. The highest rate in this story was in Q3 and Q5 in the figurative version in the question whether the IBA members’ passwords were stolen and whether the IBA was responsible for the scam respectively (both 24%). Q5 had the same error rate (24%) in the literal version and a higher rate of 31% for Q3. This indicates that these participants attributed blame to the organization even though no mention of this was made in either version. They also mistakenly inferred that this story was about phishing for passwords whereas it is actually phishing for money. This reinforces the need for organizations to distinguish between different kinds of phishing in public communication.
Story 5 has high error rates in Q3 in the question whether the phishing email tricked people into logging into a fake website (33% in the figurative version and 20% in the literal version), although no website was mentioned. This indicates inadequate understanding of malicious software that can be downloaded from phishing emails (phishing with malware). Q4 on whether the data could be recovered if a backup was made also received a high error rate (25% in the figurative version and 22% in the literal one), suggesting a lack of understanding that pre-encrypted data can be restored from backups.
In Story 6 there was a high error rate in Q4 for both figurative (35%) and literal versions (22%). This question asked if the data could be restored if a backup existed and so paralleled Q4 in story 5, reinforcing the indication that participants had difficulty understanding what happens in ransomware attacks that follow data encryption. Similarly, an error rate of 41% was shown in Q5 in the figurative version and 31% in the literal version, suggesting respondents misunderstood encryption and scrambling, in addition to not realizing that a backup of the data would help recovery.
Story 1 (on a data breach from a software vulnerability) and Story 2 on phishing for password from a bank) did not show any errors of more than 20%. However, 18% of respondents mistakenly thought that the breach was executed from inside the company in the figurative version (Q4), which may indicate confusion around the terms buffer overflow and exfiltrate. The error rate for this question was only 8% in the literal version. Similarly, there was a relatively high error rate in Story 2 (Q4) in the question whether hackers would be able to log in if the bank required confirmation of login in addition to a password (16% for the figurative version and 14% for the literal), which suggests some uncertainty about security measures to prevent phishing for password.
Story 2 also involved phishing with a website to capture usernames and passwords, but some people mistakenly thought a strong password would prevent that: it would not, because the fake website would capture their password no matter how strong it was. Story 5 involves phishing with a fake website to capture credit card details, but people did not compare the fake web address with the genuine one, nor consider that they should contact the genuine one to check the request. Story 1 mentions a system vulnerability and a buffer overflow, and some participants thought the attack was carried out onsite, perhaps thinking the terms related to hardware, rather than software. This might not be relevant for users, but would likely cause misunderstanding of the nature of attacks that organizations face. The pattern indicates that stories about cybersecurity incidents should enable users to understand the basic mechanisms, and what might have been done to prevent attacks. Where figurative language impairs this, it should be avoided or augmented with more literal explanations.
In all, misunderstanding seemed to revolve around two areas:
First, there seems to be a low understanding of the efficacy of various security measures. Several respondents seemed not to know that complex passwords do not hinder attackers in some situations (story 2, Q5; story 3, Q5). There were errors related to the method by which attackers learned passwords, leading to an over-estimation of the role of complex passwords, which are, in fact, ineffective if a login on a fraudulent website is made revealing the password to attackers. Similarly, some respondents lacked understanding of the function of organizational security measures, such as two-factor authentication (story 2, Q4 and story 3, Q5).
Second, errors regarding the recovery of data and the functionality of malware indicate a gap in knowledge of how ransomware operates and the role of backups. Many participants did not seem to understand that in ransomware attacks that involve attackers encrypting data, the data itself is not damaged or stolen and that it could be retrieved if a backup was made (story 5, Q4; story 5, Q4 and 5). This suggests that when describing situations where the implied actions are not familiar, the use of figurative language may compound the confusion of the situation, but it does not cause it because similar errors occur even when more literal language is used.
As well as the general result that literal language seems better understood, we found some other issues. Perhaps the most important are those where figurative language might mislead users about how the attacks worked, and how to defend against them. Story 6 in the figurative condition is about phishing that involves ransomware, but many participants did not understand that these involved users being tricked into downloading malicious software, or that having a recent backup copy of their data would allow them to avoid the ransom. Story 5 is also about users tricked into installing malicious software, but many participants mistakenly thought it involved logging into a fake website. Similarly, Story 3 in the figurative condition is about a phishing attack that allows attackers to collect usernames and passwords from a social media website, but many participants did not understand that this would involve email tempting users to log in to a fake website, thus exposing their usernames and passwords.
Implications
Two main implications emerge from this study. One is that the kinds of figurative words used and the social contexts in which they were created play a major role in the effects they have on non-expert audiences. The metaphors that we explored here were not explicitly created to bring clarity but, rather, reflect the practices of the computing discourse community. This could explain why, in contrast to the productive use of metaphor in other technical communication fields, cybersecurity metaphors may produce ambiguity and confusion. As opposed to many other scientific communities, computer scientists use figurative language extensively in their in-group discourse (Colburn & Shute, 2008; Sack, 2019). One reason is the culture of computer science communities for whom the playful use of language serves to create a shared identity and value system (Steinmetz, 2016; D. Thomas, 2002). Raymond (2001) compares the metalanguage developed by computer afficionados to the slang of artists such as jazz musicians, which is not only a form of communication but also a code that generates their creative process.
In fact, the use of the word hacker itself symbolizes the lexical ambivalence in computer discourses: it has evolved to carry negative connotations of intrusion and illegality in public discourse but signifies dexterity in programming within the computing discourse community, for which attacker would be the term associated with intrusion. Such concerns underline the importance of considering socio-cultural factors in any analysis of figurative language use in organizational communication.
The second implication is that organizations need to not only consider strategically their use of language, but also ensure that enough contextual information is included when instructing clients in technical processes. The existing confusion leaves the door open for some organizations to exploit non-expert users’ ignorance of cybersecurity activities by downplaying their responsibility in enhancing security. Therefore, the clear and transparent communication of what occurs in cyberattacks, and who plays a role in them, takes not only practical but also ethical dimensions.
Limitations
The experiment confirmed our principal hypothesis and showed some important findings about misunderstandings. However, we acknowledge certain limitations. First, the texts were brief in order to show participants several stories, and the sample size was only 100. Both limitations were chosen to limit participant time and experiment cost. Second, although we selected only participants who did not work in computing or IT, and who knew no programming language, Prolific is by its nature a sophisticated Internet platform for research, which may suggest that many participants are quite knowledgeable about cybersecurity. Therefore the sample was broadly reflective of developed countries and the high Internet usage may reflect the participants available on Prolific. Increasing the sample size and selecting a wider diversity of participants may affect results.
Conclusion
The experiment enabled us to answer RQ1—Does the use of figurative words to describe technical activities affect non-expert users’ understanding of cybersecurity? We found that figurative language does affect understanding but not in the way that is usually assumed. Figurative language, such as metaphors, is widely considered an effective strategy in explaining technical concepts to non-experts (Giles, 2008). However, given the insider origins of cybersecurity metaphors, we hypothesized that this might not be the case in this instance. This hypothesis was supported statistically, with more participants misunderstanding the figurative stories. Even though the difference between literal and figurative was not as large as we expected, we found no evidence that computing metaphors actually facilitate understanding of cybersecurity.
Thus, although metaphors and figurative language may not require substantially more cognitive effort (which corroborates the results of much linguistics research), our results show that figurative language may be processed differently from literal language in descriptions of situations and contexts that are not personally familiar to addressees. Importantly, we found that respondents made significant errors, regardless of whether figurative or literal words were used. This suggests that misunderstanding of cybersecurity is not related as much to the use of jargon as to a lack of understanding of what exactly happens during such incidents—the bigger picture. Non expert users seem to inadequately understand the roles of the different interactants in cybersecurity incidents—the users, the attackers, and the relevant organization—and the use of figurative language adds to confusion but is not solely responsible. It is the overall understanding of the activities involved that seems to be at play.
Lastly, the results indicate that the word phishing may be over-used in cybersecurity descriptions, which may add to misunderstanding since it is actually an umbrella term that conceals the fact that different operations and actions are involved. In the future, this research could be expanded into different areas. It would benefit with a larger sample and a mixed methods approach combining measurable data with evaluative comments. Interviewing participants to trace their reasoning in making sense of cybersecurity metaphors would also enrich our understanding of the cognitive processes involved.
Footnotes
Appendix
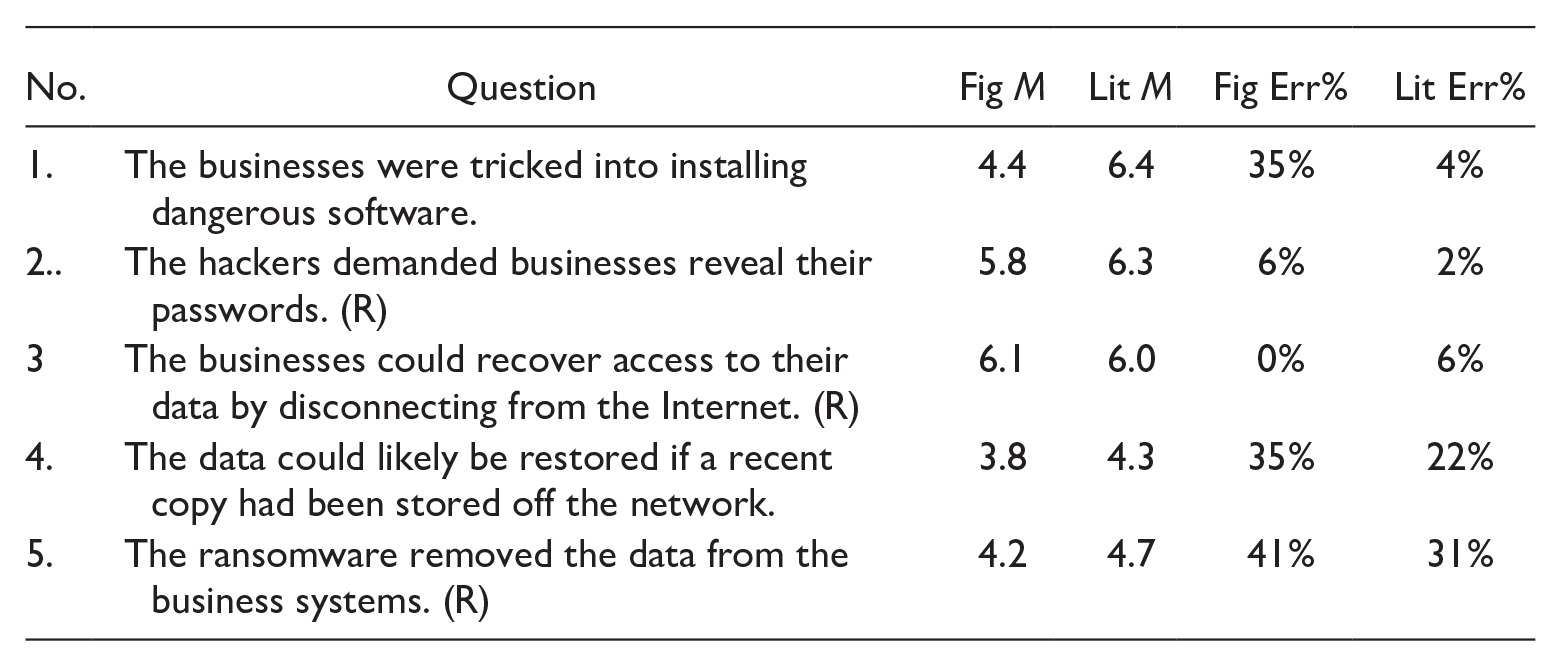
| No. | Question | Fig M | Lit M | Fig Err% | Lit Err% |
|---|---|---|---|---|---|
| 1. | The businesses were tricked into installing dangerous software. | 4.4 | 6.4 | 35% | 4% |
| 2.. | The hackers demanded businesses reveal their passwords. (R) | 5.8 | 6.3 | 6% | 2% |
| 3 | The businesses could recover access to their data by disconnecting from the Internet. (R) | 6.1 | 6.0 | 0% | 6% |
| 4. | The data could likely be restored if a recent copy had been stored off the network. | 3.8 | 4.3 | 35% | 22% |
| 5. | The ransomware removed the data from the business systems. (R) | 4.2 | 4.7 | 41% | 31% |
Authors’ note
The term grok was coined by Robert Heinlein in his 1961 science fiction novel Stranger in a Strange Land. Its meaning includes “to understand” and the word is used in computing circles today to mean understanding a programming language or framework well.
Declaration of Conflicting Interests
The author(s) declared no potential conflicts of interest with respect to the research, authorship, and/or publication of this article.
Funding
The author(s) received no financial support for the research, authorship, and/or publication of this article.