
Abstract
The social media platform X (formerly Twitter) has grown to become an important venue for political discourse, with candidates using it integrally in their election campaigns. However, it is not clear if activity on Twitter can be used to forecast elections, given conflicting findings in the literature. By analyzing 830,796 tweets mentioning key hashtags related to nine US senate races in 2014, 2016, and 2018, we demonstrate that cascades in volume and sentiment of tweets between September 1 and Election Day can predict election outcomes. We developed a non-linear growth modeling tool to identify the point in time at which bandwagon support for competing candidates begins to diverge. We also discovered that bot-driven tweets play a negligible role. We discuss theoretical and practical implications for both computational research and media effects, showing the value of combining big-data analysis and longitudinal non-linear dynamics to study the relationship between social media activity and real-world outcomes.
The first known use of the social media platform X (formerly Twitter) in election campaigns was during the 2008 presidential campaign (Tumasjan et al., 2011), and in a mere 15 years, it has become the dominant vehicle for politicians, campaigns and voters. Politicians use this platform for active campaigning during election seasons and for making important public pronouncements off-season (Hong, 2013). In this way, they are able to shape the news agenda about topics that are important for their campaign platform (Conway et al., 2015) without interference from news media.
Given its widespread diffusion and active engagement by users, Twitter has proven to be an important repository of political deliberations, drawing considerable attention from researchers as a potential source for election prediction. However, the findings from extant research are inconsistent. For example, using sentiment analysis, one study showed that the tweet sentiment of the candidates was not correlated with 2008 election results in the United States (O’Connor et al., 2010). Yet, in the context of 2009 German federal election, scholars found that the mere numbers of tweets mentioning each party were close to the poll results, and were predictive of election results (Tumasjan et al., 2011). Similarly, during the 3 months before the election cycle, the relative amount of Twitter attention received by a candidate predicted their vote share in the 2010 and 2012 US congressional elections (DiGrazia et al., 2013). However, none of the Twitter metrics (e.g., keyword mentions, hashtag mentions, and sentiments) were correlated with poll results in the 2013 German federal elections (Jungherr et al., 2017). Data from Italy suggest that the predictive power of tweets may also depend on the scale of the region. When researchers divided the country into three macro areas, tweets showed potential to predict the election results correctly; yet for smaller regions, the results were inconclusive (Caldarelli et al., 2014).
Such inconsistent findings may be attributable to theoretical and methodological shortcomings of these early studies. First, the theoretical mechanism and rationale for using twitter data to predict election results are often not clear. Second, studies do not identify and examine specific characteristics of tweets, such as volume vs. sentiment. Third, research has not paid sufficient attention to the predictive potential of the dynamic flow of users’ political attention on Twitter. Also, there is a lack of comparative analyses between poll data and social media data in Senate election predictions, particularly in assessing how social media data might supplement traditional polling predictions. Finally, the role played by automated accounts, known as bots, in boosting the prospects of some candidates over others is not quite articulated. Our study contributes to the literature by addressing these issues.
Literature Review
Theoretical Foundations—Bandwagon Effect
Bandwagon effect, which refers to an individual’s tendency to be associated with the majority opinion is well documented in the literature (Marsh, 1985). In political elections, this effect manifests in terms of the phenomenon where voters prefer to support a candidate they perceive as most likely to win (Schmitt-Beck, 2015). Previously, mass media used to serve as the primary sources through which the public received information about the opinions and preferences prevalent among the population, such as by publishing public opinion polls (Mutz, 1998). In online media, platforms like Twitter automatically generate and display popularity metrics (e.g., number of likes, shares, comments) to users, cueing the bandwagon surrounding a candidate. These metrics can trigger a mental shortcut among users called the “bandwagon heuristic,” wherein content is evaluated from a “if other people like this, then it must be good for me too” perspective (Sundar, 2008). Previous research has validated the bandwagon effect of such metrics across a wide variety of online contexts (e.g., Kim, 2018; Knobloch-Westerwick et al., 2005; Lee & Sundar, 2013; Sundar et al., 2008). For example, in the political realm, bandwagon cues are shown to be able to alter news selection. Specifically, if popularity metrics are displayed, the chances of users selecting news from ideologically aligned and misaligned sources are higher (Messing & Westwood, 2014). Scholars have found that Twitter during televised debates significantly contributes to bandwagon effects even among people belonging to different political groups. For instance, in South Korea, despite Twitter posts generally supporting a liberal candidate, bandwagon effects were observed among conservative party members as well (Hahn et al., 2018). Considering the prominence of such metrics on the interface, the bandwagon effect may be a driving force for Twitter users’ engagement with specific political issues, candidates, and parties.
The formation of bandwagon is a dynamic process, given the networked nature of modern online media. Longitudinal research has demonstrated a cascading effect of popularity indicators, which shape the nature and volume of attention around specific kinds of content cumulating over time (Fu, 2012; Xu & Fu, 2014). As such, the popular content on social media will get even more popular over time. For news stories on social media, the aggregated popularity is the most decisive factor of the stories’ diffusion, as users are more likely to be affected by indicators of collective gatekeeping, such as top trending stories (Wang & Zhu, 2019). In the context of political elections, candidates on social media can obtain different levels of popularity over time driven by bandwagon cues.
Public Opinion on Social Media
The abundance of opinions and their associated bandwagons on social networking sites have been used to gauge public opinion on a variety of issues. The number of likes and retweets that a candidate, brand, or campaign event gets has become an important indicator of success in attracting public attention and winning over public opinion. This raises the question that whether political bandwagons formed on social networking sites could serve as a proxy for public opinion and be predictive of election results. Such an approach could be particularly valuable when traditional polling data is inconclusive, potentially providing additional insights into voter sentiment. Scholars have long questioned the validity of using Twitter for predicting elections (e.g., Gayo-Avello, 2012). Tweet bandwagons associated with a candidate could largely be attributed to their “buzz-marketing” strategy on social media focused on publishing eye-catching content, with no connections to support in other media or offline votes (Murthy, 2015). Furthermore, it is questionable whether Twitter users are representative of the electorate. In the United States, Twitter users differ from the general population in several key respects, such as age, party identification, income, and education (Hargittai, 2020).
However, with social media platforms expanding their user bases, the overlap between users and citizen voters has increased. For instance, Twitter has over 37 million daily active users in the United States. (Hutchinson, 2021). Twitter conversations are more authentic than passive responses to public opinion polls (which have been historically used to predict election outcomes) because they represent active expression of thoughts and opinions (Tumasjan et al., 2011). Moreover, public opinion on social media platforms can have real-life impacts. From an agenda-setting perspective, political tweets can be predictive of news agenda (Conway et al., 2015; Conway-Silva et al., 2018). While the agenda of mainstream media has a stronger impact on agenda of Twitter compared with the reversed influence, the relationship between the agendas is generally perceived to be reciprocal (Conway-Silva et al., 2018). For instance, retweets of candidate posts could trigger increased media coverage of that candidate, such as Donald Trump (Wells et al., 2020). This agenda-setting effect may help explain how discussion on Twitter can be extended to offline settings through mass media. Using data of UK elections in 2015 and 2017, scholars have also confirmed that campaigns, by broadcasting on Twitter, did help with winning votes (Bright et al., 2020). Moreover, when voters are being exposed to tweet posts while watching televised debates in real time, their judgment will be significantly swayed by the public opinion reflected in the tweets (Hahn et al., 2018). The presented bandwagon metrics may serve as a cue for influencing voters’ views. Hence, considering the strong influence that Twitter may exert over political discourse, opinions reflected in the tweets may have predictive power of offline events even though the users are not representative of the voting population.
While compiling a large number of tweets to detect public opinion seems to be efficient and straightforward, it is still a challenging task to study the predictive power of social media data. In the realm of election prediction, research thus far has been equivocal, with some studies identifying a high consistency between tweet bandwagons and election results (e.g., Budiharto & Meiliana, 2018; Oliveira et al., 2017), while others finding inconsistency between tweet opinions and election outcomes (e.g., Heredia et al., 2018; Yang & Kim, 2017). Several factors may help explain the variability of the findings, including country or the region of election, scale of election (national vs. local), how and when researchers collect their tweets, and what tweet characteristics are measured and used as predictors. As a result, findings from previous studies may not be applicable to a specific context such as the state-level senate elections in the United States.
Is Negative Attention Better Than No Attention?
One of the most common Twitter metrics used to predict election outcomes is the sentiment associated with different candidates, which is assumed to reflect whether voters think positively or negatively about each of them. For example, a sentiment analysis of Twitter data was only slightly different (1%–8%) than traditional poll data, and the overall accuracy was about 81% for the Brazilian presidential elections in 2014 (Oliveira et al., 2017). In another study, researchers combined Twitter data and economic growth data to predict the 2016 US presidential election outcomes at the county level, and their integrated model showed that Twitter sentiment significantly contributed to the model and emerged as the second most important feature, following growth rate of GDP (Liu et al., 2021). These sentiment-based bandwagons can provide more information than using a single number to measure users’ attention to specific political content and thus are perceived to have more predictive power.
However, regardless of the sentiment, there is a strong correlation between a candidate’s share of media coverage and their share of the vote in the polls in the US presidential primaries (Silver, 2015). That is, media attention received by a candidate can be a good predictor of voting patterns. From an agenda-setting perspective (McCombs & Shaw, 1972), the media agenda has an impact on the salience of the political figure in the judgment of the public. Therefore, when a candidate receives more attention from media, even negative attention, they can still be perceived as a more salient figure and given more consideration by the public. The same principle can be applied to the social media setting, such that a more frequently mentioned candidate is more likely to win a larger share of vote, regardless of the sentiments expressed in those mentions.
Empirical findings are mixed when it comes to sentiment-based bandwagon vs. volume-based bandwagon. The Twitter data associated with the Irish general elections revealed that the best parameter for predicting the “first preference votes” is the sheer volume of the tweets that a given party received (Bermingham & Smeaton, 2011). By contrast, in the context of 2016 US presidential elections, a study found that sentiment performed better than volume for predicting the results in the swing states, but neither volume nor sentiment came close to the results in favored states where there was a clear advantage for one candidate (Heredia et al., 2018). Therefore, the relative superiority of sentiment vs. volume bandwagon for predicting election outcomes can be context dependent. We propose the following research question:
Research Question 1 (RQ1). Is sentiment-based bandwagon better for predicting US senate election outcomes than volume-based bandwagon?
Bot-Driven Bandwagon vs. Human-Driven Bandwagon
Given the proliferation of automated Twitter accounts that disseminate tweets without any human oversight, it is necessary to distinguish bot-generated bandwagon and people-generated bandwagon around hot-button political issues. Research shows the presence and active participation of social bots in political conversations during the 2016 US presidential elections, accounting for one-fifth of all conversations (Bessi & Ferrara, 2016). Bots are also known to have facilitated the spread of fake news (Shao et al., 2017). This has created grave concerns that bots may have unfairly manipulated public opinion and biased election results (Bessi & Ferrara, 2016; Wooley & Howard, 2016). Analyzing and comparing the effects of bot-generated versus human-generated information on political bandwagon cascades can help address such concerns.
Research Question 2 (RQ2). How influential are bot-generated information cascades on the US senate election discussion on Twitter compared to human-generated information cascades?
Method
In this study, we chose to use US senate elections to study the role played by Twitter metrics associated with each candidate in locale-specific elections. Unlike studies that focus on presidential elections, our work has the advantage of providing considerable variance in election results, given that several senate races take place in the United States each year. Candidates for the US senate have become increasingly active on Twitter (Russell, 2021), but their social media presence is seldom studied.
Data Collection
The Twitter Premium API, with its full-archive endpoints, provides access to all non-deleted public tweets since 2006, enabling data collection based on specific search keywords. However, as of 2023, free access to the Premium API has been discontinued. Our data were collected before this policy change, using Python and the Twitter API package.
We first examined the twitter metrics associated with the 2014 Iowa senate election, as a test case. The 2014 Iowa senate election was chosen because it was one of the most competitive races that year, in which the Republican candidate flipped the seat held by a Democrat. The geo-tagged Twitter data set contains all and only tweets that have geographical location information (i.e., only tweets that are posted by users who opt in to enable location services and geotag their tweets with location information1) published between September 1 and December 31, 2014. Although it does not contain all tweets, these data provide a good foundation for understanding tweet characteristics related to senate races. First, we used candidates’ names in this race (Joni Ernst, Bruce Braley) and keywords related to senate race (senate, senator, election, or senator election) to search for relevant tweets in this geo-tagged data set. Then, we analyzed the commonly used hashtags in these tweets, showing that the most salient hashtag related to the 2014 Iowa senate election on Twitter was #IASen. Therefore, we used it (in four different forms: #iasen, #IASen, #IASEN, or #IAsen) as the search keyword in the Twitter Premium API, to identify the tweets related to 2014 Iowa senate election that were posted between September 1 and December 31, 2014. While using this single hashtag may not provide a comprehensive data set relevant to this election, it helped isolate key data in the discourse and tweets that might be posted by individuals who were highly involved in the election and who were more likely to vote.
This inspired us to use the hashtag in the same format, that is, #(A state’s abbreviation)Sen, to search for tweets related to each senate election. We chose four different senate races (Illinois, New Hampshire, Nevada, and Pennsylvania) in 2016 and four different senate races (Arizona, Florida, Indiana, and Missouri) in 2018 to examine the same research questions. These eight races were all perceived to be “unsafe” and less predictable: either close races that had a margin of victory under 10% or flipped-seat races. We deliberately chose to test our methods in very competitive races where traditional polling often yields inconclusive results, and additional insights would be particularly beneficial for electoral forecasting. Such close races serve as the touchstone by which we can assess the validity and reliability of social media bandwagons. For each of the races, we used one case-insensitive hashtag (e.g., #ILSen for Illinois senate race, #INSen for Indiana senate race) to collect tweets posted between the beginning of September and the end of December in the year of the election.
After collecting the tweets, we cleaned the data by removing duplicated and non-English tweets. Table 1 shows the total number of tweets collected for each senate race.
Number of Tweets Collected for Each Senate Race.

Data Analysis
Candidate Identification
To identify tweets that mentioned a specific candidate in each data set, we mainly used candidates’ full names, last names, and twitter handles (if they have twitter accounts) to classify tweets into four different categories, including those that mentioned Democratic candidate only, Republican candidate only, both candidates, or neither candidate.
Sentiment Analysis
Tweet post sentiment was analyzed using the NLTK (Natural Language Toolkit) library’s VADER (Valence Aware Dictionary and sEntiment Reasoner) package, which is a pretrained, rule-based model designed for social media text sentiment analysis (Hutto & Gilbert, 2014). It is particularly effective for short texts and capable of detecting sentiment intensity. However, VADER may not pick up highly contextual or nuanced language, sarcasm, and irony. The algorithm evaluates the text of the tweet by comparing its words with existing affective dictionaries. It then reports four different scores, including negative sentiment, neutral sentiment, positive sentiment, and compound sentiment. Negative sentiment, neutral sentiment, and positive sentiment represent the proportion of the lexicon that fall into each of the categories, which adds up to 1. The compound sentiment is the sum of all the word ratings, standardized to range between −1 (extremely negative) and +1 (extremely positive).
Bot or Not Analysis
Botometer was employed to detect tweets from social bots. The Botometer algorithm indicates the likelihood of a given Twitter user being a social bot on a 0 to 1 scale. All unique user ids in the data set were checked through the algorithm. An arbitrary 0.5 threshold was used to categorize bot (vs. human) users in this data set (e.g., Shao et al., 2017). That is, if a user received a universal score larger than 0.5, they were labeled as “bot-likely” users. The remaining were labeled as “human-likely” users.
Of note, while we did collect the tweets published both before and after the election date, our analysis was based on tweets that are posted in the few weeks before the election date as we are interested in the predictive power of tweets. The divergence of tweets after the election date is shown only as a point of reference and is not part of our analysis or modeling.
Poll Data Collection
To contextualize our findings and demonstrate the potential added value of our approach in election forecasting, particularly in closely contested races where polls alone may offer limited predictive clarity, we collected representative poll data that was available during our social media bandwagon accumulation period. The data were compiled from reputable sources, including Marist College, YouGov, and Emerson College. These sources are all highly rated for their low bias and high transparency (Morris, 2024), ensuring a comprehensive and reliable set of traditional polling metrics for our analysis.
Results
Poll Data Baseline Comparison
Table 2 shows the poll data for the Senate races, where available, during the same period as our social media data collection, starting from September 1 until Election Day.
Senate Race Poll Data Summary.

The polling data, as illustrated in our table, reveal that these races were marked by fluctuating leads and narrow margins between the Democratic and Republican candidates. For instance, in Pennsylvania, the lead changed hands several times before Toomey won by a small margin, and in Nevada, Cortez Masto barely won against Heck in a close race. The 2018 races were also very competitive, with candidates like Sinema in Arizona and Scott in Florida winning in very tight contests. Our analysis thus highlights the challenge of predicting the final winner based purely on poll data, as the races were often too close to call. In competitive political contests like these, additional data sources, such as social media metrics might improve the quality of our election predictions.
Twitter Volume Bandwagons
For each senate race, we visualized the daily accumulated number of tweets mentioning one of the candidates, both candidates, or neither candidate between September and December, to show the Twitter volume bandwagon formed for each candidate. Then, we compared the observed patterns with the election results. We consider the results consistent with election outcomes if the accumulated tweets about the eventual winner exceeded those for the competitor(s) before Election Day. Any other scenario is deemed inconsistent. Figure 1 shows the four races in 2016 and Figure 2 shows the four races in 2018.
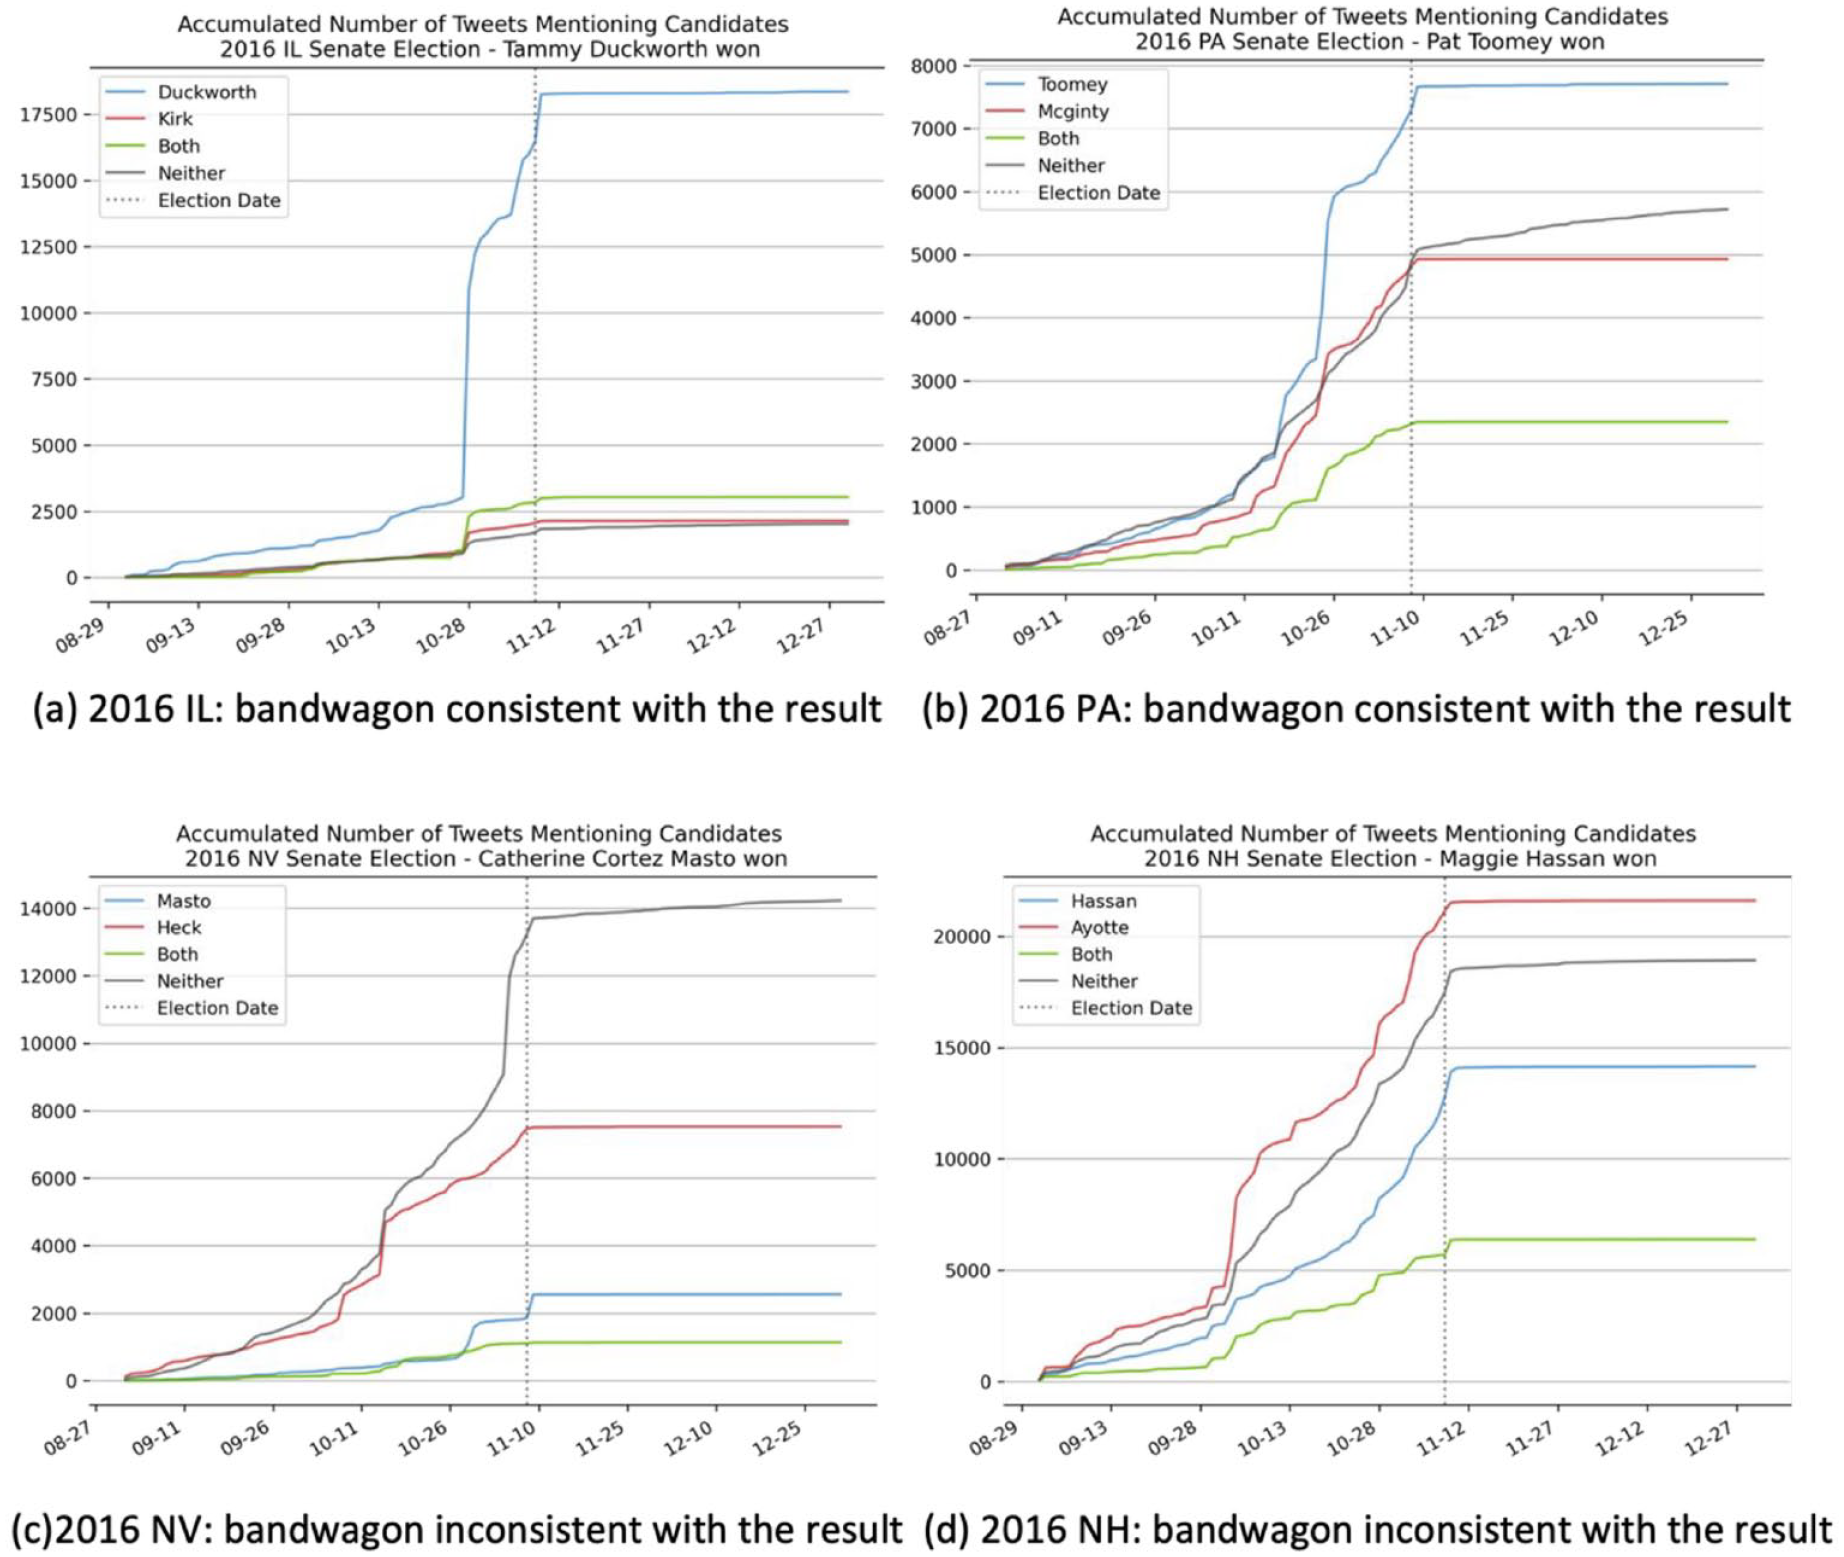
The volume bandwagons for different candidates in four 2016 senate elections.
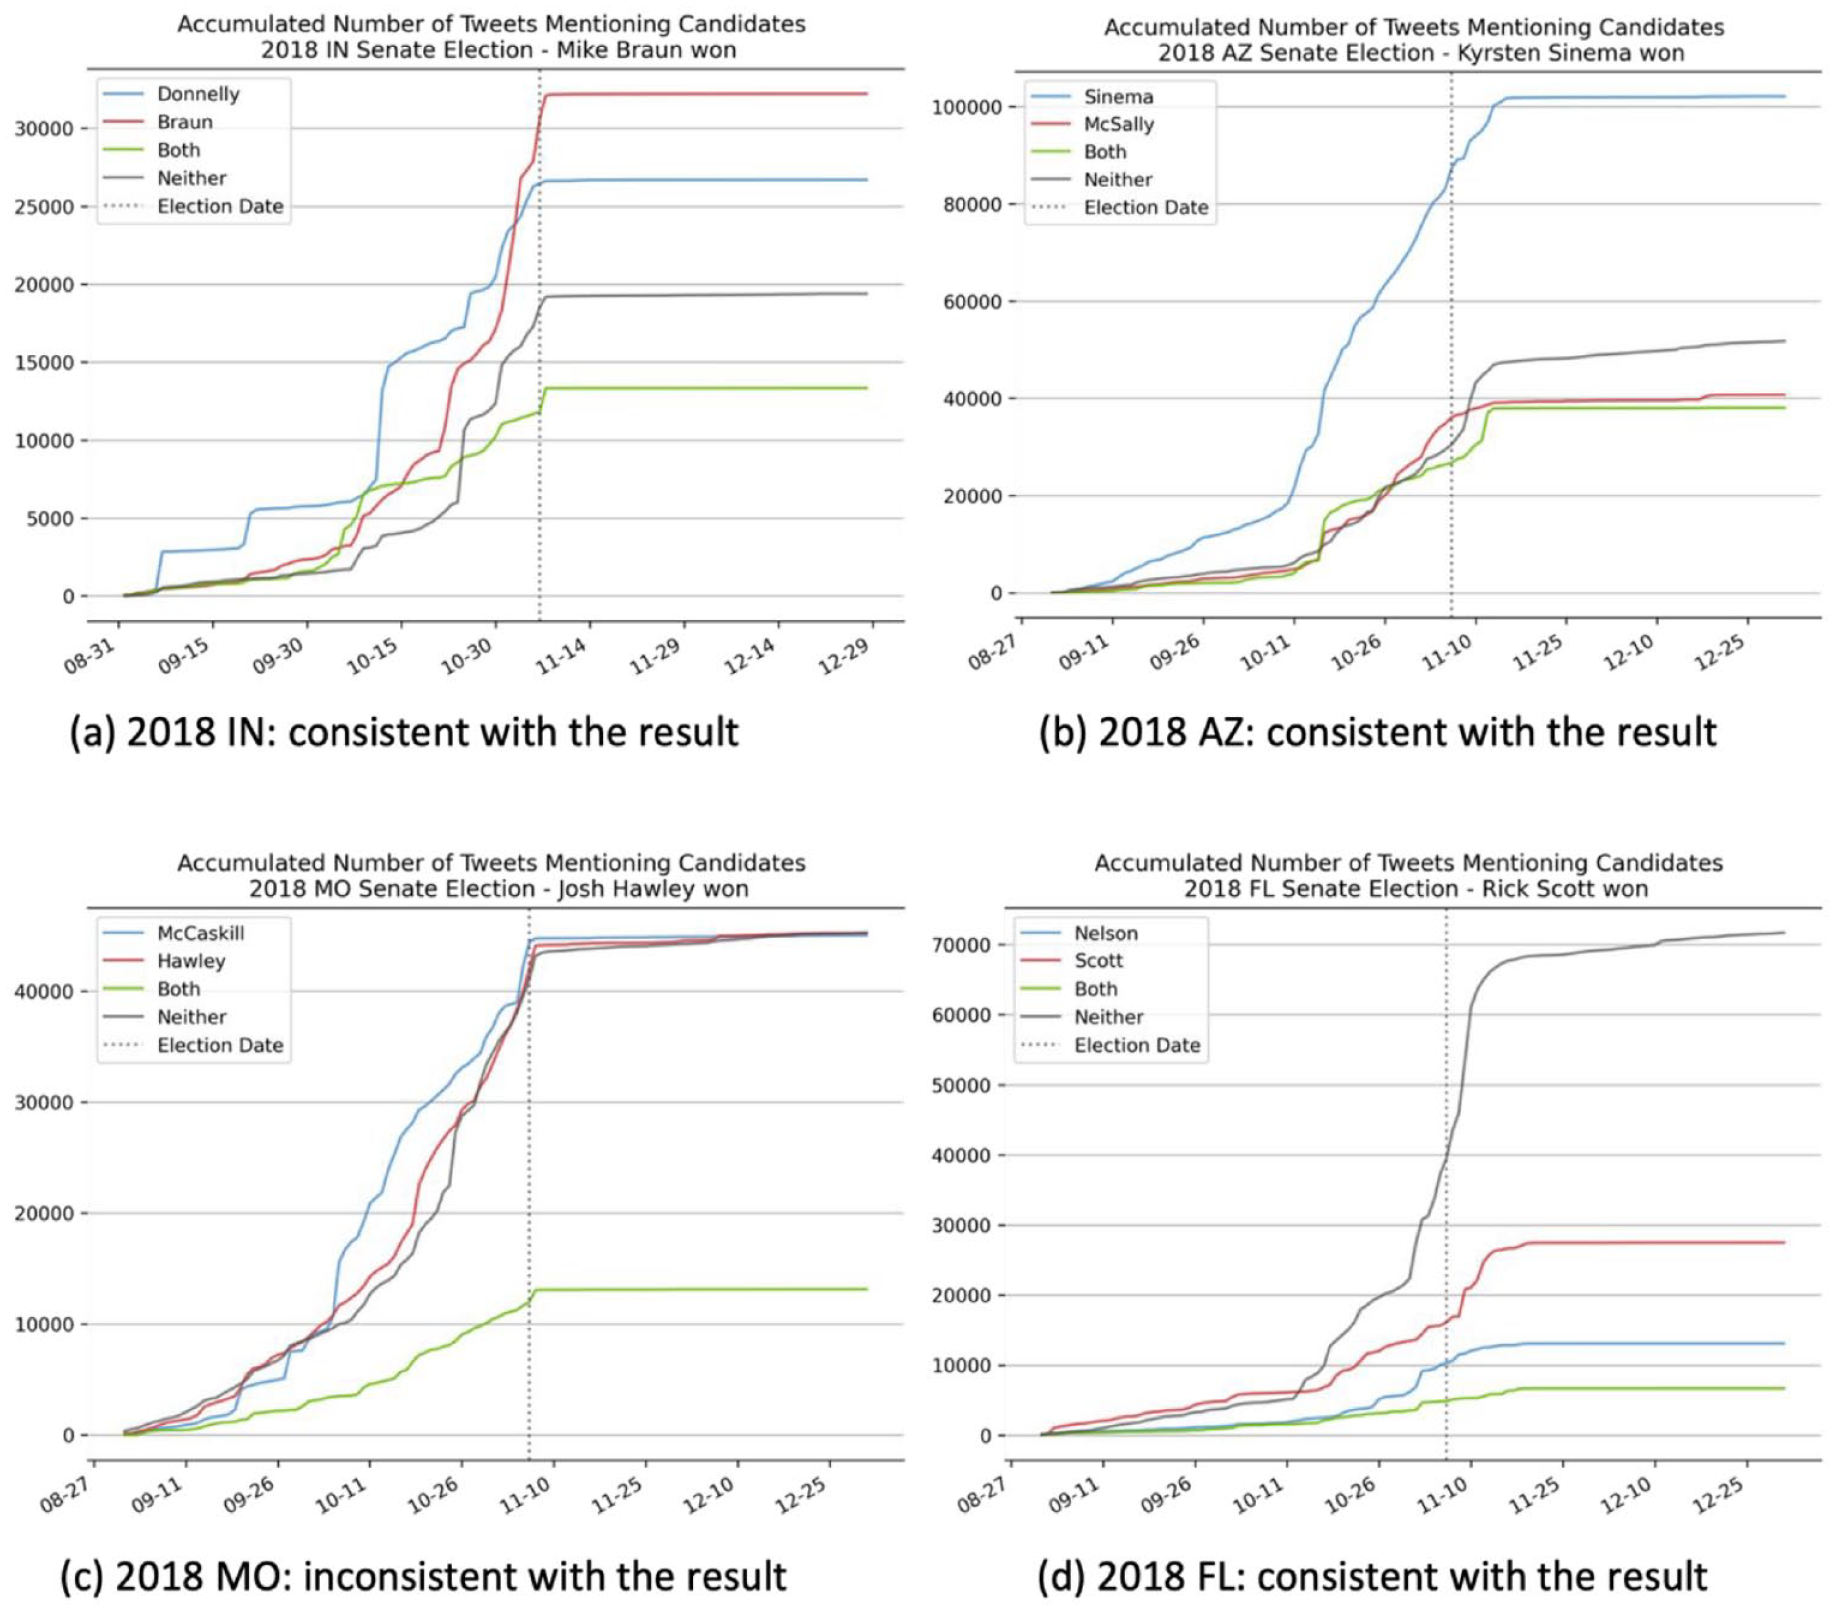
The volume bandwagons for different candidates in four 2018 senate elections.
For the four senate elections in 2016, the bandwagon cascades, indicated by the daily accumulated volume of the tweets that mentioned one of the candidates, aligned with the election results of Illinois and Pennsylvania, but were inconsistent with the results of the elections in New Hampshire and Nevada. For the four senate elections in 2018, the Twitter volume of candidates in three states, Arizona, Indiana, and Florida, were consistent with the election results, while the Twitter volume in Missouri was not consistent with the election result.
Twitter Sentiment Bandwagons
For each senate race, we then visualize the daily accumulated compound sentiment of tweets mentioning one of the candidates, both candidates, or neither candidate from September to December, to show the Twitter sentiment bandwagon formed for each candidate. Then, we compare the observed patterns with the election results. Figure 3 shows the four races in 2016 and Figure 4 shows the four races in 2018.

The sentiment bandwagons for different candidates in four 2016 senate elections.

The sentiment bandwagons for different candidates in four 2018 senate elections.
Using daily accumulated compound sentiment score as the predictor, the results showed that for Illinois and New Hampshire senate elections in 2016, the longitudinal patterns of the sentiment bandwagons were consistent with the election outcomes. However, for Pennsylvania and Nevada, the patterns were less clear: the differences between two candidates’ accumulated sentiment were too minor to tell who would win the election when approaching the election date. However, the sentiment bandwagons of all four senate elections in 2018 showed consistent patterns with the election results, such that a clear divergence emerged between two candidates’ accumulated tweet sentiment before the election date.
Overall, by examining the accumulated number of tweets, we can predict the election results for five out of eight senate races; by examining the accumulated sentiment of tweets, we are able to predict the election results for six out of eight senate races before the election date. The senate election of Nevada in 2016 was the only exception, with neither the volume bandwagon nor the sentiment bandwagon predicting the election result.
In sum, the preceding analyses answer RQ1 by showing that sentiment is a stronger predictor of election victory or defeat than the sheer number of mentions of the candidate.
Divergence Detection–The Nonlinear Growth Model
We explored the predictive power of twitter bandwagons vis-a-vis election results, using an exploratory nonlinear growth modeling approach. In brief, growth modeling techniques allow researchers to model and investigate both within-person change and between-person differences in change—including differences in initial levels of a performance metric (e.g., number of tweets), rates of improvement or decline over time, and asymptotic levels of performance (Ram & Grimm, 2007). Here, we use nonlinear growth models to obtain parsimonious descriptions of how bandwagons changed over time for each candidate and to evaluate how and when the changes of two competing candidates diverged over time. We used the 2014 Iowa senate election data set as an example. The daily counts of tweets per candidate is shown in Figure 5.

Count of tweets that mentioned the senator candidate for each political party per day.
Given the goal of detecting the divergence of two candidates as early as possible, we modeled the nonlinear (exponential) growth of tweet counts (outcome variable) in an iterative fashion as a function of time, the candidate’s political party, and the interaction of time and political party. Specifically, the tweet count for candidate i on day t, countit, was modeled as
where the parameter α governs the intercept and distance to asymptote of an exponential curve with growth rates given by the parameter β, which governs the exponential growth rate for the reference candidate (as indicated when the variable candidateit = 0), and γ, which indicates the difference in growth rates between the two candidates. This model was fit iteratively to expanding window subsets of the tweets data, starting with the first t = 15 days since September 1, 2014, then with t + 1 = 16 days, then with t + 2 = 17 days, and so on, and finally with all T = 68 days, where T = 68 (all data from September 1, 2014, to election result date of November 7, 2014, when growth stopped; see Figure 5). In each model we evaluated if the growth rates diverged, specifically whether the γ parameter indicating the difference in two candidates’ growth rates was significantly different than zero, which would indicate that one of the candidates was accelerating and thus more likely to win the election.
Results of the iterative model fitting are shown in Figure 6, where we see that the difference in growth rate between candidates was significant from day 15 (i.e., with data from September 1–15, 2014) onwards, except between day 29 to day 34 (i.e., between September 29 and October 4) after an event-related disruption in tweets on day 28 (September 28) shown in Figure 5. It is worth noting that this kind of event-related disruption occurred three times with similar magnitude (2000 tweets) on days 28, 42, and 47 (September 28, the day of the first debate; October 12, one day after the next debate; October 17, one day after the last debate), but on day 29 (September 29), the difference in growth rate between the two candidates became non-significant. This implies that the divergence in the volume of tweets about the two candidates became greater after day 29, while the disruptions on day 42 and 47 were not strong enough to reverse the lead of the Republican candidate.
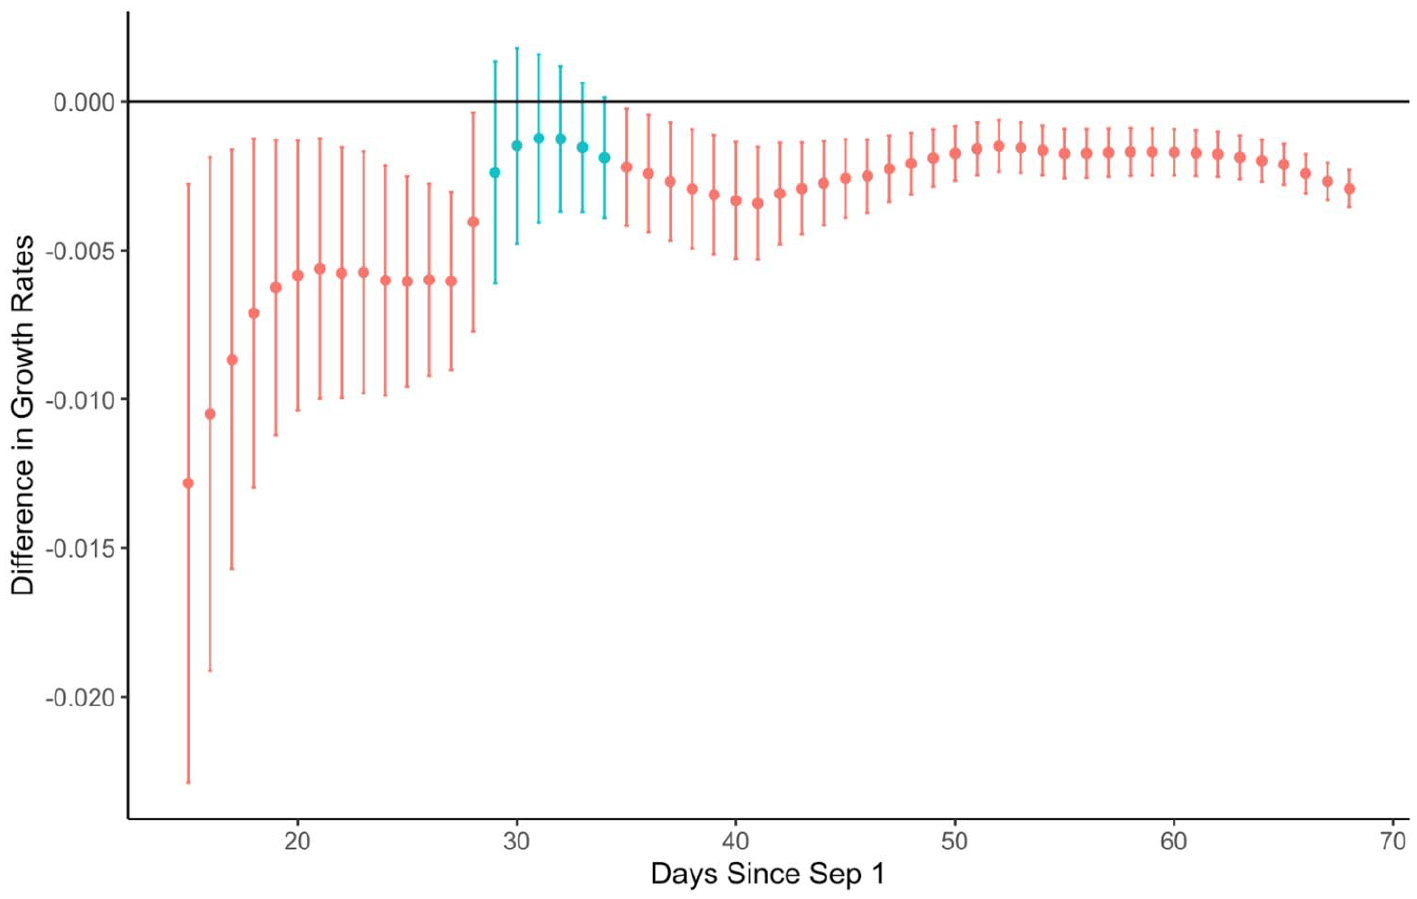
Significance of the difference in growth rate between the two candidates of the 2014 Iowa senate election with iterative fitting.
We applied the same modeling method to the four senate races in 2016 and the four races in 2018. The analyses showed that in the seven electoral contests of 2016 and 2018, observable divergences in the candidates’ support growth rates were evident already from the initial 15-day period of data collection (September 1–15). These 15-day data sets proved adequate for initiating predictive analyses. As shown in Figure 7, in seven of the eight races examined, the differences in the rates of growth in volume bandwagon between the two competing candidates were statistically significant (i.e., as indicated by red color) for most of the time. This suggests that the candidates who initially fell behind were not able to increase their rate of gaining attention at a pace that could overcome the trend. Consequently, these candidates were unable to reverse their disadvantageous position in terms of public attention and momentum on Twitter.

Significance of candidates’ growth rate differences in selected 2016 and 2018 senate elections using iterative fitting.
An exception to this trend was identified in the Missouri 2018 senate election, where the growth rate analysis indicated shifts in the leading candidate over time, implying the challenges in early election forecasting for this state.
Bot-Generated Bandwagon vs. Human-Generated Bandwagon
We classified the users into bot-likely users and human-likely users by using the overall score provided by the Botometer and a threshold of 0.5. This means, if a user is rated with a score that is higher than 0.5, than they are classified as bot-likely users; others are classified as human-likely users. Table 3 shows the number of tweets generated by bot-likely users (vs. human-likely users) in each senate election data set.
Number of Tweets Generated by Bot-Likely Users and Human-Likely Users.

Overall, about 3% to 5% of tweets were generated by bot-likely users. When we examined the accumulated number of tweets over time, bot-likely users did not show a significant impact on the Twitter volume bandwagon compared to human-likely users in any of the data sets. Figure 8 shows an example from the 2016 New Hampshire senate election data set.
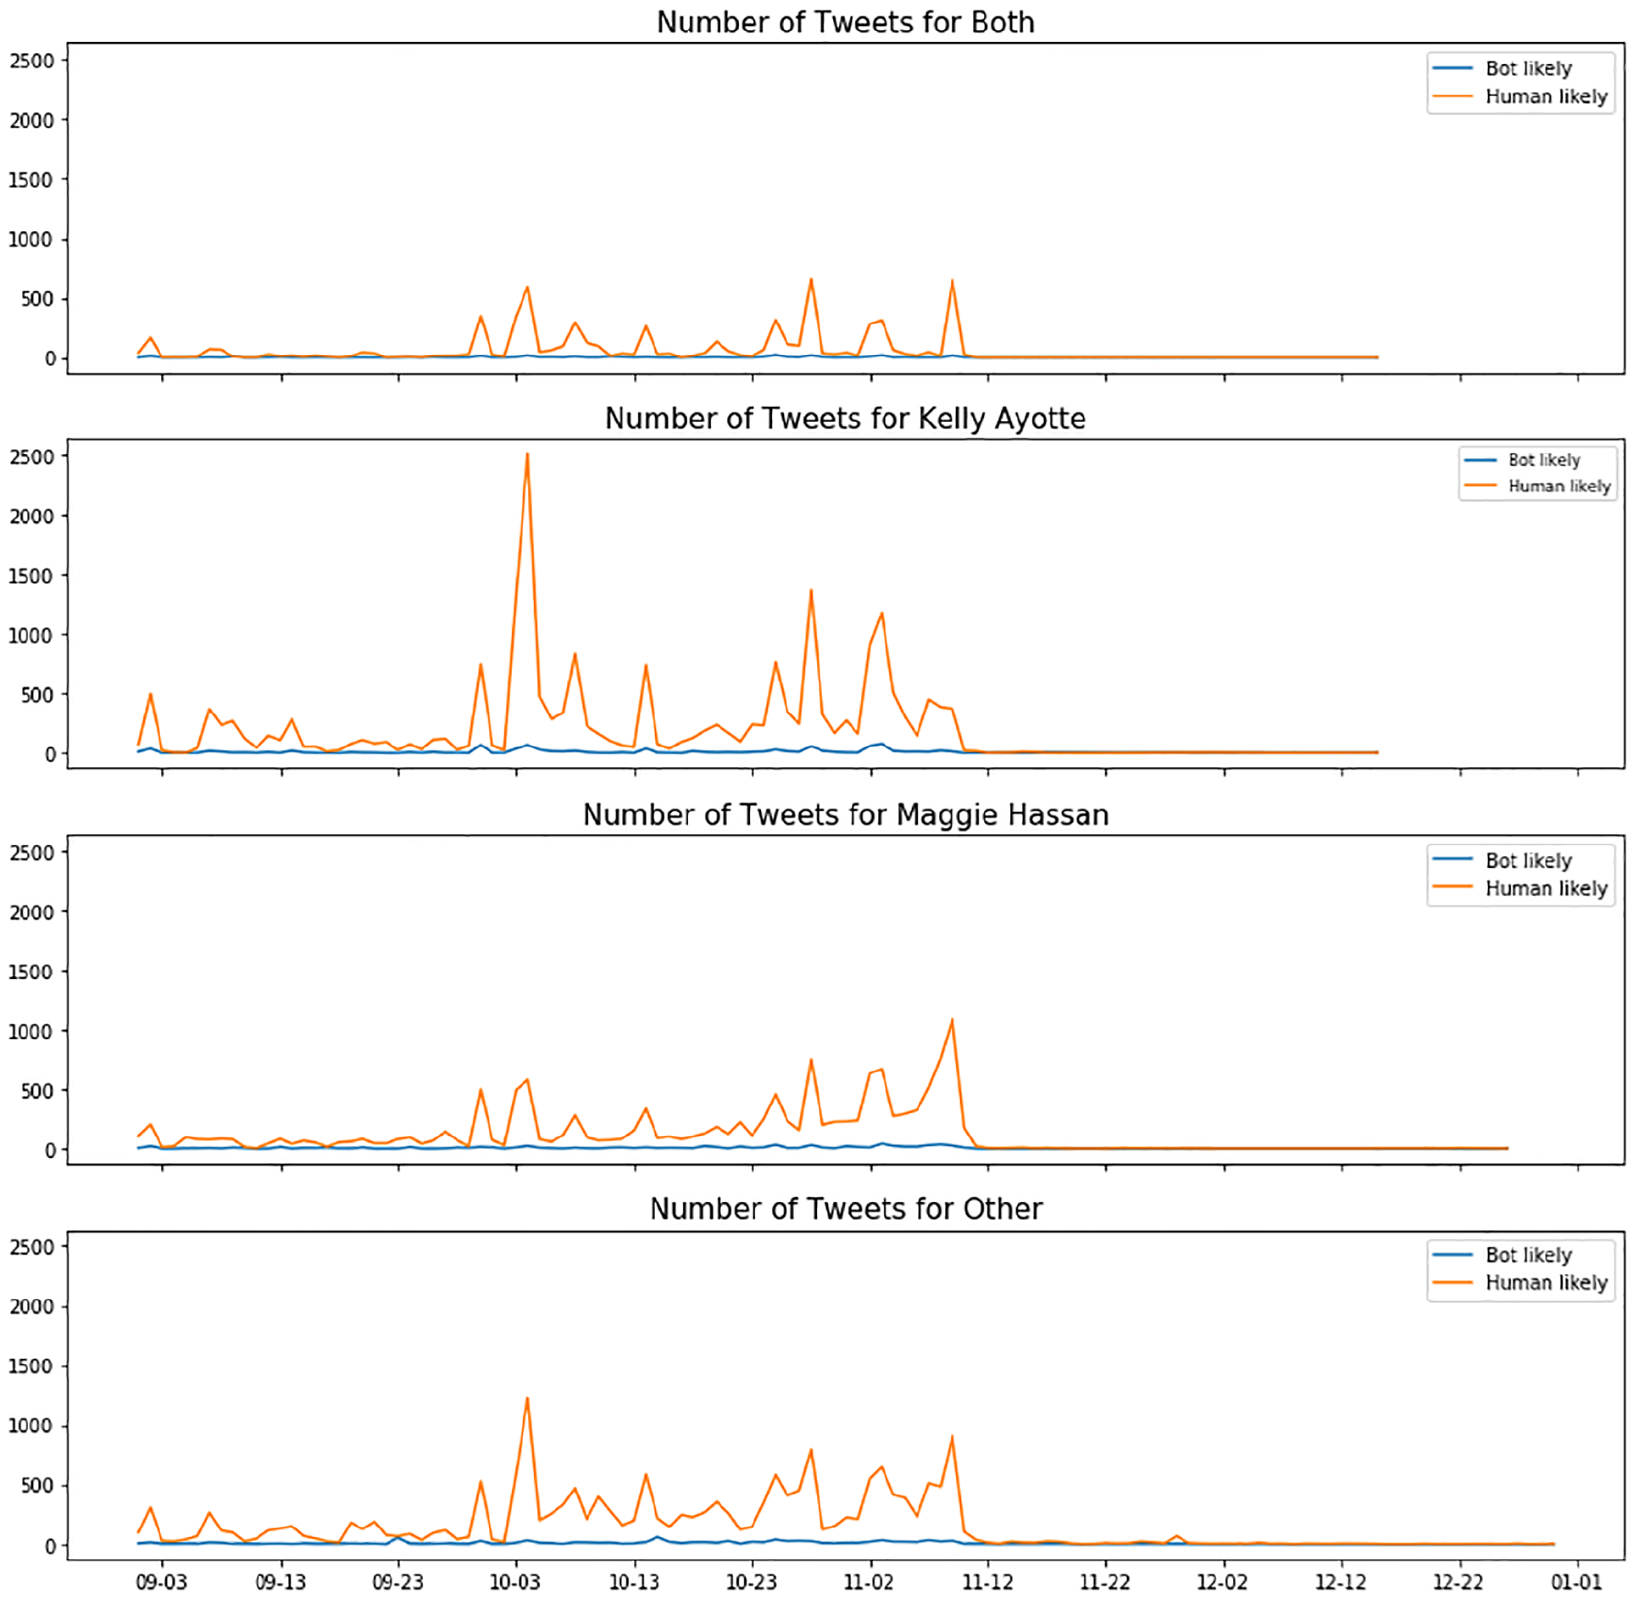
The volume bandwagons by bot-likely users vs. human-likely users in 2016 New Hampshire senate election.
Discussion
In this study, we investigated the effectiveness of Twitter bandwagon metrics as a public opinion resource to predict election results of US senate elections. By choosing several competitive races and using a key hashtag, we collected tweets related to each election. Our findings show that for a majority of the states we chose, both volume and sentiment bandwagons aggregated over time were able to predict results of US senate elections. Sentiment bandwagons performed slightly better than volume bandwagons in predicting election outcomes. By combining these two metrics, we are able to predict seven out of eight competitive elections in our sample. While we are not suggesting causality between tweet bandwagons and voters’ choices in this study, our data suggest that the use of twitter bandwagon cascades to predict senate election outcomes has validity. The reliability of the predictions is also quite good, but could be subject to the representativeness of Twitter users to voters in any given election. For instance, it is likely that users who participated in the Twitter discussion about the Nevada senate election in 2016 were quite different from the voters in Nevada.
Our focus on the single hashtag that is commonly used in each senate election also provides a parsimonious approach to examine attention and opinion of highly involved publics. That is, Twitter traffic serves as a barometer of the buzz surrounding a candidate, which seems to be associated with election victory more often than not. It is an indicator of public opinion at the very least, if not the driver of it, as campaigns increasingly migrate to social media. Indeed, our comparison of poll data and social media metrics reveals valuable insights for election forecasting. These metrics, which included factors such as volume, sentiment, and bandwagon growth rates—either individually or in combination—improved the accuracy of predictions in seven out of the eight races. For example, in the 2016 New Hampshire and 2018 Missouri Senate races, our social media sentiment bandwagons aligned with the results, potentially supplementing poll data in prediction. The 2016 Pennsylvania and 2018 Florida and Arizona Senate races were notably tight. While sentiment-based predictions were unclear for Pennsylvania, volume-based bandwagons showed an early lead for Toomey, the eventual winner. In Florida and Arizona, where the races were decided by extremely close margins, both volume and sentiment bandwagons favored the eventual winners early on. In the 2016 Illinois Senate race, social media data corroborated clear poll leads. However, in the highly competitive 2016 Nevada race, neither sentiment nor volume data aligned with the final outcome, making it the only exception. Together, the findings demonstrate that although they are not perfect predictors, there is value in incorporating social media bandwagon effects into election forecasting, particularly for closely contested senate races.
Moreover, the emphasis on temporal tracking of tweet counts in the weeks preceding Election Day allows us to observe the cascading nature of buzz surrounding a candidate. That is why we developed a nonlinear growth modeling analysis tool to explore how early we would be able to detect the divergence between the two candidates’ cumulative volume of mentions on Twitter. Using 2014 Iowa data set as an exemplar, we found that the divergence in growth of volume of tweets mentioning the two candidates was discernable after September 29, and was sustained till the end of the election. Our replication analyses for the eight races in 2016 and 2018 reveal that in seven cases, we could identify a divergence in the volume as early as September 15. It was notably challenging for the candidate who was falling behind to significantly increase their rate of gaining attention. This finding highlights the importance of establishing a strong presence on Twitter early on in the campaign. We believe that this statistical modeling approach, specifically designed to examine temporal emergence of differences in growth rate of tweet bandwagons, might facilitate early detection of changes in candidates’ momentum. While traditional polls provide valuable snapshots at specific time points, social media bandwagon data offer a continuous stream of information throughout the campaign period. This offers the possibility of continuously monitoring ongoing public engagement and discourse. In addition, depending on the clarity of emerging trends, social media bandwagon effects may potentially be observable before traditional polls might be available in some electoral cycles. This adds to the value of using Twitter metrics as predictors of election outcomes.
Furthermore, we examined whether bot users had a strong presence and active participation in the discussions related to senate elections. Prior research has shown that bot-generated posts accounted for one-fifth of all conversations related to the US presidential election (Bessi & Ferrara, 2016). In contrast, we found that only 3%–5% tweets were generated by bot-likely users, a much smaller portion. Although we did see growth in the number of tweets related to senate elections from 2016 to 2018, the proportions of bot tweets remained similar. It should be noted that we used a low threshold (0.5) to determine whether the user is a bot or a human, compared to a threshold of 0.7 used in previous research (e.g., Grinberg et al., 2019), which means more users are likely to be labeled as bots in our data set. Still, we did not see a strong presence or influence of the bots over the Twitter conversation related to the senate elections. It is likely that bots are less likely to be created or manipulated at the state level given its smaller stakes compared to the presidential election.
In summary, our research examined the predictive potential of the dynamic flow of users’ political attention and sentiment on Twitter for US senate election results. Data from nine competitive races show the value of relying on the accumulated bandwagon metrics as a predictor for senate elections and a relatively weak presence of automated accounts in relevant Twitter discussion. We acknowledge that the applicability of our method to less competitive races remains untested; future research should explore the generalizability of this approach across a wider spectrum of electoral scenarios, including both highly competitive and relatively safe races, to fully assess its broader utility in election forecasting. While we have solely focused on cascades of tweet volume and sentiment as predictors in this study, other indicators of bandwagon, such as number of retweets and likes, could help improve the already significant predictive power of social media activity on election outcomes. It is also worth exploring the influences of different content characteristics of the tweets, such as the topic and the novelty of the tweets. The novelty of tweets could also be driving the formation of political bandwagons. For example, an analysis of the spread of news on Twitter showed that fake news is more novel than real news, and tends to spread faster than real news (Vosoughi et al., 2018). Therefore, the novelty of the tweet has the potential to predict political bandwagons and thereby election results. Finally, future studies can profile social media users to determine the extent to which the social media users are different from voters using advanced techniques (e.g., Yin et al., 2018), and accordingly refine the prediction model.
While there is certainly room for improvement and expansion, the findings of this study are more than ordinarily important because of the conservative test we performed, by testing our proposition with nine regional elections that were considered toss-ups (difficult to predict) in three different years that took place in geographically and politically diverse parts of the United States. That is, despite the potential for noise from a number of local, structural and temporal variations, we were able to show an empirical connection between social media metrics and election outcomes. Parsimony is also a key feature of our approach in that we are using a small number of indicators (volume & sentiment) and minimal data (about 8 weeks of Twitter traffic data from each state associated with one key hashtag), thus making it a cost-efficient investigation.
In conclusion, this study has demonstrated the value of bringing together concepts and techniques from such disparate areas as media effects, human-computer interaction, big-data computational analysis and longitudinal non-linear dynamics to demonstrate an empirical connection between social media activity and real-world outcomes in the context of political communication. While our analysis has focused on political tweets in the run-up to US senatorial elections, the bandwagon effects demonstrated here and the analytical approaches used in our work can be applied to a number of other domains, such as the study of misinformation, health, and lifestyle-related bandwagon cascades, and thereby validate our efforts to treat social media platforms as petri dishes for predicting and understanding larger social phenomena.
Footnotes
Declaration of Conflicting Interests
The author(s) declared no potential conflicts of interest with respect to the research, authorship, and/or publication of this article.
Funding
The author(s) disclosed receipt of the following financial support for the research, authorship, and/or publication of this article: This research was supported by a Level 2 grant from the Social Science Research Institute, Penn State University, entitled, “The Predictive Power of Social Media Engagement on Election Results: An Investigation of Bandwagon Effects using Large-Scale Geo-Tagged Tweets” (PI: Sundar; Co-PI: Ram).