
Abstract
Although previous studies examined the role of digital literacy in successful identification of misinformation, scant scholarly attention has been given to users’ attention to metadata as informative areas that attest to message credibility. This study introduces a novel approach and methodology to contribute to our understanding of how users evaluate and identify misinformation, and the relationship between users’ ocular attention to metadata, misinformation identification, and digital literacy. In an eye-tracking study, participants were asked to rate the credibility of online messages posted on social media and web pages. Throughout the session, participants’ eye movements were recorded. The results indicate that digital literacy predicts successful identification of online misinformation, as well as webpage scan patterns, specifically devoting attention and focusing gaze at metadata areas that provide cues attesting to the credibility of the messages. In addition, successful identification of misinformation is positively linked to ocular attention to information metadata. In other words, technology-savvy users devote more attention to information metadata, which leads to better identification of misinformation, and they are also directly more successful at identifying misinformation online.
Keywords
Introduction
Online misinformation is a growing concern among scholars, policymakers, and the public (Shin et al., 2018). The phenomenon is not new; manipulation, lies, rumors, propaganda, and conspiracies have always been part of human communication, especially political communication (Freelon & Wells, 2020). Accordingly, research on deception detection has been a major focus for decades (Park et al., 2002). What has changed in recent years, following the rise of digital communications, especially social media, is the salience, reach, and arguably the implications of misinformation on public opinion. Scholars have argued that this may lead to a decrease in trust in social media and mainstream media (Wagner & Boczkowski, 2019) as well as in public institutions in general (Levi, 2017; Morgan, 2018), and even pose a serious threat to democratic systems (Levi, 2017; McNair, 2017; Morgan, 2018; Reuter et al., 2019).
Various scholars propose media literacy as a central solution to combat the misinformation phenomenon (Bulger & Davison, 2018; Cooke, 2018; Levi, 2017), based on the assumption that individuals spread misinformation because they mistakenly consider it to be authentic. Although previous studies have found links between education level, media literacy, and specifically digital literacy, and identification of misinformation (e.g., Allcott & Gentzkow, 2017; Kahne & Boywer, 2017; Reuter et al., 2019; Steinfeld, 2022a; Vraga & Tully, 2021; Xiao et al., 2021), other studies suggest that this link between literacy and the ability to identify misinformation is not always direct (e.g., Bulger & Davison, 2018), and that the practice of fact-checking every news item is unrealistic in today’s information highway (Mihailidis & Viotty, 2017).
However, there are cues within and around online messages that attest to their credibility. Spelling and grammar mistakes in the text should raise suspicion, and especially metadata accompanying the message: the message source, the website URL, the username and profile information in a social media page, and comments made to the message by other users, all serve as quick and effective signs of authenticity and credibility.
This study examines the role of digital literacy in successful identification of misinformation, especially as it manifests in users’ scan patterns of suspicious messages. The study introduces a novel approach and methodology to examine these questions by utilizing eye-tracking technology to measure how users scan webpages containing suspicious messages to evaluate their credibility.
Literature Review
Defining Misinformation
The term “Fake News” has garnered considerable public and scholarly attention in recent years, primarily due to its usage by former US President Trump during the 2016 US presidential election. While “Fake News” is specific to journalism, the more general phenomenon commonly discussed in academic literature is that of “misinformation” or “disinformation,” with the distinction that disinformation refers to false information deliberately spread by the sender, whereas misinformation usually denotes unintentional spread of false information (Cooke, 2018; Lazer et al., 2018; Mihailidis & Viotty, 2017).
Several definitions of “misinformation” have been introduced in the literature. Narrow definitions relate it to false, fabricated messages that resemble news messages in form but not in organizational processes and intent (Lazer et al., 2018; Quandt et al., 2019). Broader definitions also include hoaxes, hearsay, rumors (Mihailidis & Viotty, 2017), parody, propaganda, advertising (Tandoc et al., 2018), and even satire (Balmas, 2014; Tandoc et al., 2018). This article adopts a narrower definition of misinformation and utilizes the framework of Tandoc et al. (2021) for “Fake News” definition as false or fabricated messages that imitate the characteristics and conventions of traditional journalism.
The study takes into account current journalistic practices and incorporates articles published on news websites with social media posts by news organizations and personal accounts, as well as WhatsApp messages. This approach is justified as journalists today use organizational and personal social media and WhatsApp channels to communicate and report on events. The items chosen for the study include traditional news values (e.g., timeliness, negativity, and prominence) and format, that is, inverted pyramid where the most important information is placed at the top (Tandoc et al., 2021).
Misinformation is a growing concern due to its existing and potential implications. With the increasing tendency of news consumers to rely on social media as their primary source for news (Newman et al., 2022; Steinfeld, 2022b), and the increasing prevalence of misinformation on social media that is becoming increasingly difficult to identify, users are easily manipulated into adopting biased or false views that can lead to behavioral changes. A global decline in institutional trust, particularly in established media (Strömbäck et al., 2020), is arguably linked to the increasing dissemination of misinformation by politicians and public figures to discredit legitimate and established media channels (Anupam & Schroeder, 2020; Lees, 2018; Marwick, 2018; McGonagle, 2017; McNair, 2017; Wagner & Boczkowski, 2019) or public institutions (Levi, 2017; Morgan, 2018). These processes may pose a real threat to the democratic system (Morgan, 2018; Reuter et al., 2019). A recent study in Israel showed that an overwhelming majority agreed that “false messages leave the public confused about basic facts” and that “the implications of the phenomenon are severe” to a large or very large extent (Steinfeld, 2022b). Similar results were reported by studies conducted in the United States (Barthel et al., 2016), the United Kingdom, and Australia (Leung et al., 2021) and in various other countries worldwide (Newman et al., 2022).
Identification of Misinformation
Previous research has demonstrated that social media users often share misinformation, even when they are aware that it is inaccurate or false, for various reasons. For instance, users may share misinformation if the post was shared by someone they know (Duffy et al., 2019; Marwick, 2018) or a trusted public figure (Sterrett et al., 2019), to signal belonging to a specific group (Chen et al., 2015; Marwick, 2018), or if the information confirms their preexisting beliefs (Cooke, 2018; Duffy et al., 2019). Furthermore, internet trolls and users who seek to instigate heated debates online are more likely to share misinformation than those who aim to persuade or inform others (Chadwick et al., 2018).
Despite these findings, unintentional sharing of misinformation has been linked to users’ ability to accurately identify misinformation and differentiate between false and credible posts (Steinfeld, 2022a). Accurate identification of misinformation is crucial to prevent the adoption of misconceptions and mitigate the impact of false messages on opinions, actions, and decisions. Prior studies have used a combination of survey questionnaires to gather demographic and participant digital literacy data, along with experimental measurements of misinformation identification, such as asking participants to distinguish between true and false news items. These studies have found that age is a significant predictor of identifying misinformation, with contradictory results: Some suggest that age is negatively associated with successful identification (e.g., Reuter et al., 2019), while others found the opposite—age was positively linked to successful identification (e.g., Allcott & Gentzkow, 2017). Analytic thinkers were more likely to identify misinformation (Pennycook & Rand, 2019), as were democratic voters and heavy media consumers (Allcott & Gentzkow, 2017). Social media use was mostly found to have a positive correlation with the adoption of misinformation and conspiracy theories, likely due to users’ tendency to rely on social media for news and exposure to frequent misinformation messages on social media platforms (Jamieson & Albarracín, 2020; Nan et al., 2022). Higher education levels were linked to successful identification (Allcott & Gentzkow, 2017; Reuter et al., 2019), as were higher incomes (Sajjad et al., 2022). The most prominent predictors of identifying misinformation in research are media or news literacy (Kahne & Boywer, 2017; Vraga & Tully, 2021), or more specifically, digital literacy. These three literacies, media, news, and digital literacy, are distinct yet related literacies. Media literacy is often defined as the “ability of a citizen to access, analyze, and produce information for specific outcomes” (Aufderheide, 1993, p. 6), with critical thinking and media content consumption being critical components. News literacy, on the contrary, is a more specific literacy that highlights the importance of literacy for civic engagement and democracy. It encompasses knowledge of news systems and effects, an understanding of the role of news in society, and critical consumption of news (Jones-Jang et al., 2021; Vraga & Tully, 2021). Digital literacy can be seen as an extension of media literacy, emphasizing the rapid and continuous evolution of digital communication technologies and the participatory nature of digital media consumption and production. Digital literacy, therefore, adds a dynamic, participatory dimension to the original concept of media literacy, as well as the ability to adapt to new forms of communication technologies (Jones-Jang et al., 2021).
Media and digital literacy have emerged as central proposed solutions to combat misinformation (Bulger & Davison, 2018; Cooke, 2018; Levi, 2017). In a post-factual age, scholars argue that digital literacy education needs to combine fact-checking practices with critical reading and thinking, as well as awareness of data misuse (Breakstone et al., 2018; Cooke, 2018; Engel, 2017). As this study investigates the scan patterns and attention devoted to metadata areas of webpages as a literacy practice, the focus is on digital literacy rather than media and news literacy, which are more general and less oriented toward digital content consumption practices.
Metadata and Cues Signifying Information Credibility
With the various channels used for disseminating news and journalistic stories, including organizational and personal social media pages, distinguishing between credible and fabricated messages is becoming increasingly challenging. Often, the answer may not be found in the text itself but in metadata, which provides cues about the text. Metadata is simply defined as “data about data” (Mayernik, 2021). Although research and practice have expanded the scope of what constitutes metadata, at its core, it is information related to the data in question that is not part of the message. In the context of identifying misinformation, various cues about social media posts and digital content that are not part of the post text can be reliable and important predictors of post credibility. These include post/tweet length, use of exclamation or question marks, number of retweets/shares/likes or mentions, number of user friends/followers, account age, number of emojis, number of URLs contained in the post/tweet (Ajao et al., 2022; Krishnan & Chen, 2018), account bio and political affiliation (Haupt et al., 2021), image metadata (image geo-location, image credibility) (Safieddine et al., 2016), and responses to the tweet/post text, such as comments and replies (Sharma et al., 2019).
Measuring Digital Literacy Skills
Digital literacy is a term that encompasses various components, including knowledge of computers and the internet (digital information literacy), and technological skills required to use digital technologies effectively for information search, evaluation, creation, and sharing information, as well as create and share new content (or digital skill literacy). While different definitions of digital literacy exist in academic literature, common elements include these key features (E. M. Kim & Yang, 2016; Reddy et al., 2020; Walton, 2016).
Assessing digital skills presents a challenge since the dynamic nature of the internet results in constantly changing user skillsets (Litt, 2013). Consequently, many studies have proposed narrow definitions and focused on basic functions (Van Dijk & Van Deursen, 2010). Respondent self-reports, asking users to rate their digital skills on a scale ranging from beginner through average, advanced, or expert (Livingstone & Helsper, 2007), report their level of mastery in using specific tools and performing online activities (Zimic, 2009), or their confidence in their abilities to perform tasks online (Eastin & LaRose, 2000; Spitzberg, 2006), are popular measurement methods but have limited reliability. Self-reports may contain respondent social desirability bias (Livingstone, 2008), and significant gaps can exist between perceived and actual levels of digital skills (Van Dijk & Van Deursen, 2010).
To overcome the limitations of self-reports, researchers use observational methods to measure actual user performance (Litt, 2013). In this approach, participants are asked to perform tasks, and researchers observe and assess their digital literacy skills (Alkali & Amichai-Hamburger, 2004; Hargittai, 2002; Van Dijk & Van Deursen, 2010). While this method eliminates self-report bias, and enables in-depth analysis of individual digital literacy, it is limited to small samples, subject to the researcher’s subjective interpretation, and requires significant time and resources.
Another approach is knowledge-based questionnaires that ask respondents to state their level of familiarity with digital concepts. Such questions are based on self-evaluation, but since they relate to specific terms, concepts, or knowledge items, respondents have less room for subjective bias (Hargittai, 2005).
Measuring Digital Skills With Eye-Tracking
Recently, eye-tracking has been introduced as a novel, accurate, in-depth, and unbiased measurement of digital skills, as it measures psycho-physiological aspects of internet use (Steinfeld et al., 2021). Previous research has shown that ocular behavior influences and is influenced by cognitive processes (Hoffman & Subramaniam, 1995; Rayner, 2009; Steinfeld, 2016). Therefore, researchers have been using eye-tracking to measure cognitive processing and focused attention (Steinfeld et al., 2016; Steinfeld & Shaked, 2021; Williams, 2013). Eye-tracking data from online experiments can provide insights into the processes that occur while participants are performing tasks, and evaluating or acquiring information.
In recent years, there has been an increase in the use of eye-tracking to study user online behavior (Soroka et al., 2019). Website usability studies use eye-tracking to evaluate how users scan webpages to find answers to their questions and needs (Djamasbi et al., 2010; Ehmke & Wilson, 2007; Katsanos et al., 2010; Mičík & Kunešová, 2021). Eye-tracking technologies have also been employed to measure patterns of online information consumption (Liu et al., 2011). The main advantage of eye-tracking as a measurement tool is that it is not subject to bias caused by social desirability in respondents. Furthermore, it is a measurable, objective, replicable observational tool that can provide both qualitative and quantitative information on user scan patterns and ocular behavior.
In a study by Steinfeld et al. (2021), eye-tracking was employed to study the webpage scan patterns of participants in a government program aimed at increasing the digital literacy of disadvantaged populations. The researchers found that although participants’ skills improved, the improvement was mostly in basic and trivial uses. Advanced uses, such as efficient searching or more sophisticated use of digital platforms, only slightly improved. Participant gaze was still rather unfocused, indicating that participants still struggled to find answers and perform basic tasks online.
Several recent studies have used eye-tracking to study misinformation. Abeysinghe et al. (2023) found that participants exhibited more ambient processing in visual scanning of online news items when they were unsure of their truthfulness and more focal processing when they did not believe the news was real. There were no differences in terms of devoting attention to different parts of the item. Bozkir et al. (2022) found that readers regressed more with their eyes when reading fake news, indicating confusion. Lutz et al. (2020) found that a higher fixation count per second was linked to the user’s perception that an item was fake.S. C. Kim et al. (2021) used eye-tracking to study attention to tweets correcting misinformation on Twitter and found that humorous correcting tweets increased user attention to the image of the tweet, but non-humorous correction tweets were eventually more effective in reducing misperceptions. The study by Kießling et al. (2022) focused on a specific metadata section: the Fake News flag attached to a news item, user, or source on social media. They found that flags for news items received more visual attention than flags for the user or source. Their study shares resemblance with the current study in that they look at user attention to metadata. However, user literacy was not a point of interest, and other metadata areas were not examined.
Research Objectives and Novelty
Previous studies have explored predictors of misinformation identification and the role of digital literacy in successful identification of misinformation. However, there has been limited scholarly attention given to user attention to metadata as informative areas that attest to message credibility. This study proposes a novel approach and methodology to examine user scan patterns of websites and social media pages for evaluating information credibility, in order to enhance our understanding of how users evaluate and identify misinformation, and the relationship between misinformation identification, scan patterns, and digital literacy. The study aims to investigate the role of digital literacy in predicting (a) success in identifying misinformation, and (b) scan patterns of online messages for evaluating their credibility, as well as (c) the correlation between scan patterns of online messages and success in identifying misinformation.
Research Hypotheses
H1: Digital literacy predicts successful identification of misinformation (in accordance with Bulger & Davison, 2018; Cooke, 2018; Levi, 2017).
H2: User scan patterns of website or social media page predict successful identification of misinformation messages. More specifically, paying attention to metadata areas (comments sections, engagement indicators, forwarding indicators, publisher profile information and bio, hashtags, mentioned accounts, page URL) positively corelates with successful identification of misinformation (in accordance with Ajao et al., 2022; Haupt et al., 2021; Krishnan & Chen, 2018; Safieddine et al., 2016; Sharma et al., 2019).
H3: Digital literacy is linked to scan patterns of the social media or website page, and more specifically, positively corelates with attention to metadata areas on the page.
H4: The effect of digital literacy on successful identification of misinformation is mediated by focused attention to metadata. In other words, users with higher levels of digital literacy are more successful in identifying misinformation, as a result of their increased attention to the metadata providing information about the message.
Method
Participants
The study was conducted in Israel, with 83 participants (51% female) ranging in age from 18 to 63 years (M = 34.43, Mdn = 30, SD = 13.71). Of the participants, 52% had a high-school or professional, non-academic education, 31% were BA graduates, and 11% were postgraduates. Participants were informed that the study was focused on how users read and evaluate the credibility of online messages and were instructed to complete a series of tasks in a computer environment. Following the computer activity, participants were asked to complete a post-session questionnaire (the questionnaire items are discussed in detail in section “Questionnaire”). The researcher and research assistants recruited participants through personal connections. Given the complexity of the study, which involved setting up a mobile lab with eye-tracking equipment and computers, the length of the study session which took between 20 and 30 min, including setup and calibration for each participant, complex instructions regarding computer tasks, followed by the post-session questionnaire, it was decided to use a convenient sample to ensure a sufficient sample size. The sample size of 83 is quite large for eye-tracking studies (Holmqvist et al., 2011; Wedel & Pieters, 2017). Most participants were recruited and sampled in their office. The research team had set up a mobile lab in several offices in various cities in Israel, including a municipality office, and several business centers, in cooperation with the office managers. In addition, some participants were sampled in their homes, where the research team had set up a mobile lab at their convenience. To ensure a diverse sample with different backgrounds and levels of digital literacy, the research team collaborated with the Haredi Institute for Public Affairs (https://machon.org.il) to recruit participants in offices dedicated to ultra-orthodox (Haredi) populations, including a Haredi magazine and innovation centers for Haredi businesses. The Haredi population in Israel has significantly lower digital literacy compared with the non-Haredi Jewish population. All Haredi participants in this study were modern, working Haredi who access digital sources daily. The collaboration allowed the research team to include a large group of Haredi participants (n = 37), who contributed to the variability in terms of internet use and knowledge.
Most participants rely on online sources for news: 48% reported using news websites as their main source of news, while 24% consume news mainly from television and 23% rely on social media as their main source for news.
Materials
Misinformation Identification Tasks
In the first part of the study, participants worked on a computer connected to the internet and were presented with 11 items that were published online on various platforms. The items comprised five Facebook posts, three Twitter tweets, one Instagram post, and one WhatsApp message, as well as two articles posted on content websites. All items discuss different topics and present different messages. These items meet the definition for misinformation adopted in this study by including traditional news values, reporting on current events, using journalistic tone and format (prominence, inverted pyramid), and presumably report newsworthy information.
Out of the 11 items, 6 were misinformation messages. For instance, one item was a Facebook post by a page named “Little Ethiopia,” which claimed that the officer who strangled George Floyd to death was murdered in prison. The comments following the post repeatedly claim that this is false information. Another example is a Whatsapp message that warns all Israelis from answering phone calls from specific numbers, because they are calls from the Hamas organization. The message contains syntax mistakes, uses hysterical wording, and states that it is an instruction from the Israel defense forces. In addition, it adds a request to distribute the message to all family and friends. A double-arrow icon and “Forwarded many times” label is displayed above the message.
The other five items were credible authentic messages. For instance, one item was a Facebook post by a leading Israeli news site, Ynet, which stated that for the first time in Israel, entering disposable utensils into nature sites in the Upper Galilee will be prohibited. A link to the article on Ynet’s website was provided in the post as well. Another example is a tweet by an Israeli journalist (verified by Twitter) published during the COVID-19 lockdowns, retweeting a message from his news organization informing of his story about the Ministry of Health order to all hospitals to cease elective operations. The journalist adds in his retweet that officials complain that the Ministry still enables senior physicians to perform non-urgent private surgeries. The original tweet provides a link to the story on the news website.
As the examples above demonstrate, the items provide various cues attesting to their credibility, such as the author’s identity, links to familiar websites, mentions and retweets of other accounts, verification by the platforms (the blue V sign), a “forwarded many times” warning, comments by other users, and so on.
The items chosen for the study were selected based on a pilot study. At the first stage, the research team collected 27 credible and misinformation items that were published online in the months preceding the study. To prevent bias and ensure that the items used in the study were not publicly familiar or that their (non)credibility was consensual, the team organized a pilot study among 30 respondents. The respondents were asked to rate the items according to their perceived credibility and justify their decision. The researcher then removed items that several respondents stated they were already familiar with the story and items that respondents were not in agreement regarding their credibility. The items that were finally chosen for the study were those that were unambiguously and correctly coded as false or true by pilot respondents and were also unfamiliar to respondents. During the pilot, respondents also referred to metadata accompanying the items in their justifications for rating the items (e.g., “The website is dubious”; “The account is verified and known”; “The comments say that it is fake news”).
In the study, participants were presented with the chosen 11 items and asked to evaluate them. After presenting each item, they were asked to rate the item on a scale ranging from 1 = definitely false to 10 = definitely true.
A “Fake Test” score was calculated for each participant according to their rating of the items. A higher test score means better success in identification (lowest possible score was 11, and highest was 110). Test scores ranged from 45 to 107 (M = 81.98, Mdn = 84, SD = 12).
See Supplemental Appendix B for a list of all items that were qualified and disqualified for the study, based on the pilot results.
Eye-Tracking
To investigate how users evaluate and scan online social media webpages and digital content, an eye-tracking study was designed. Throughout the session, participants’ eye movements were recorded using SMI RED-m eye-tracker while they performed computer tasks. The tracker is a non-intrusive device mounted on a panel attached to the computer screen, which uses an infrared eye camera to measure eye movements. The device tracks both eyes and operates at a 120-Hz sampling rate, which is sufficient to capture all visual fixations, defined as periods when the eyes remain fairly still and consciously gaze at a visual object. The study of ocular behavior as a measurement of attention focuses on fixations rather than saccades, which are the movements of the eyes occurring between fixations.
To analyze the data, areas of interest (AOIs) were defined to export gaze data. These included the message text, image or video, user displayed name, profile information section for Twitter pages (presenting number of followers and following, blue “V” sign, profile picture), engagement information (number of shares/likes in Facebook; number of retweets/favorites in Twitter), and comment section and the top, middle, and bottom comments. Figures 1 and 2 present the AOIs for Facebook and Twitter pages, respectively.
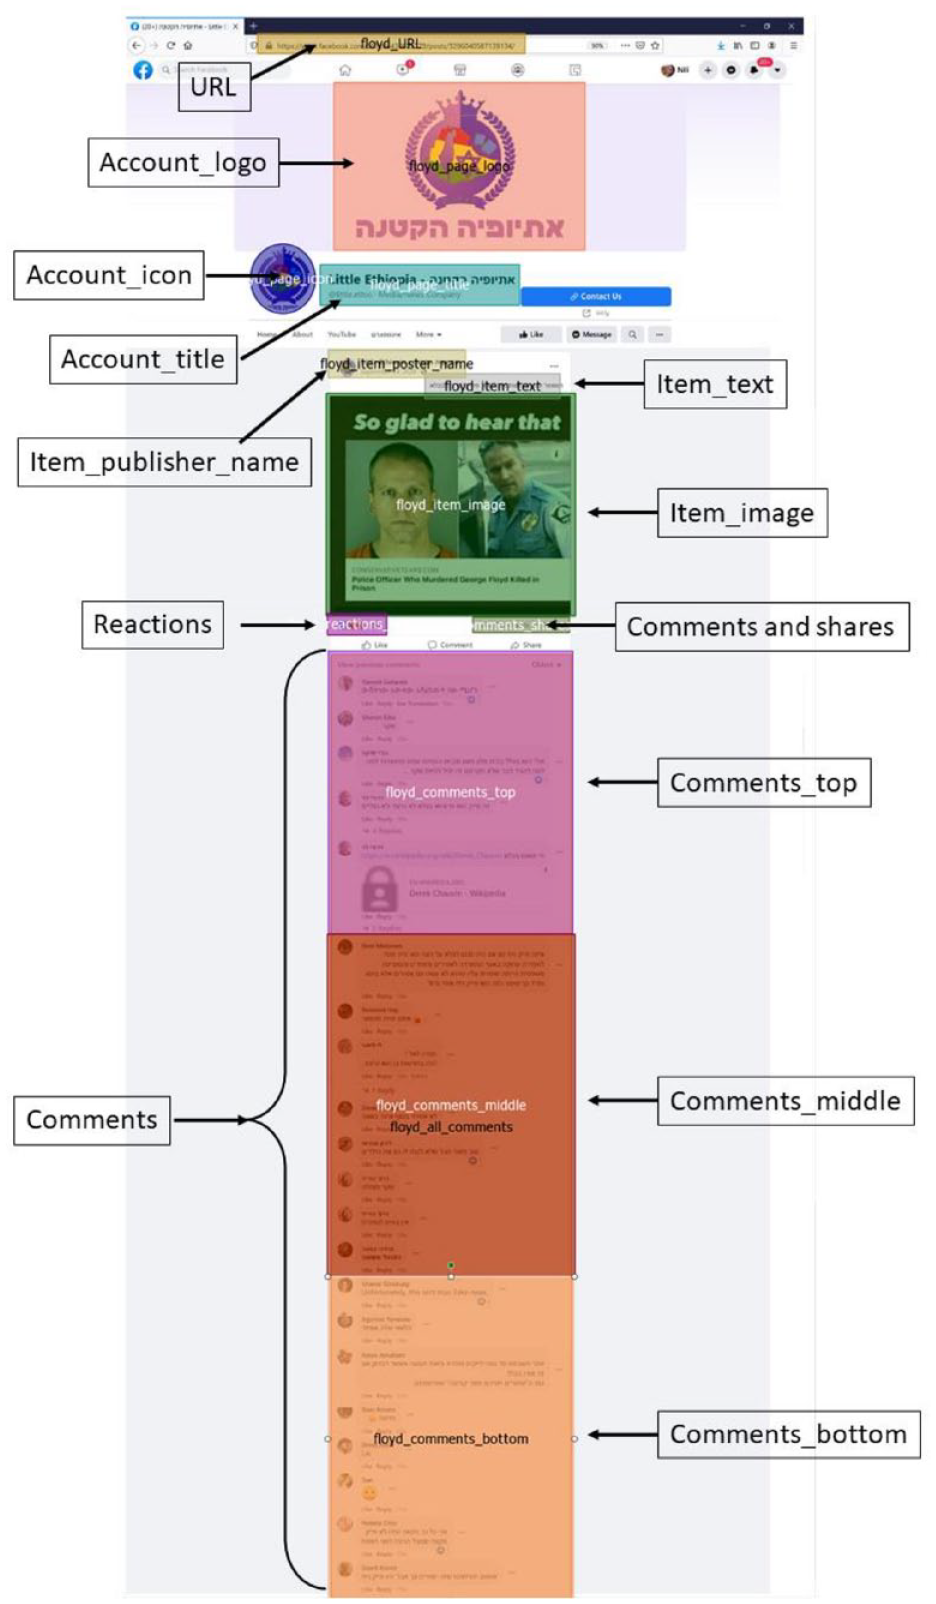
Areas of interest (AOIs) for eye-tracking analysis—Facebook pages.
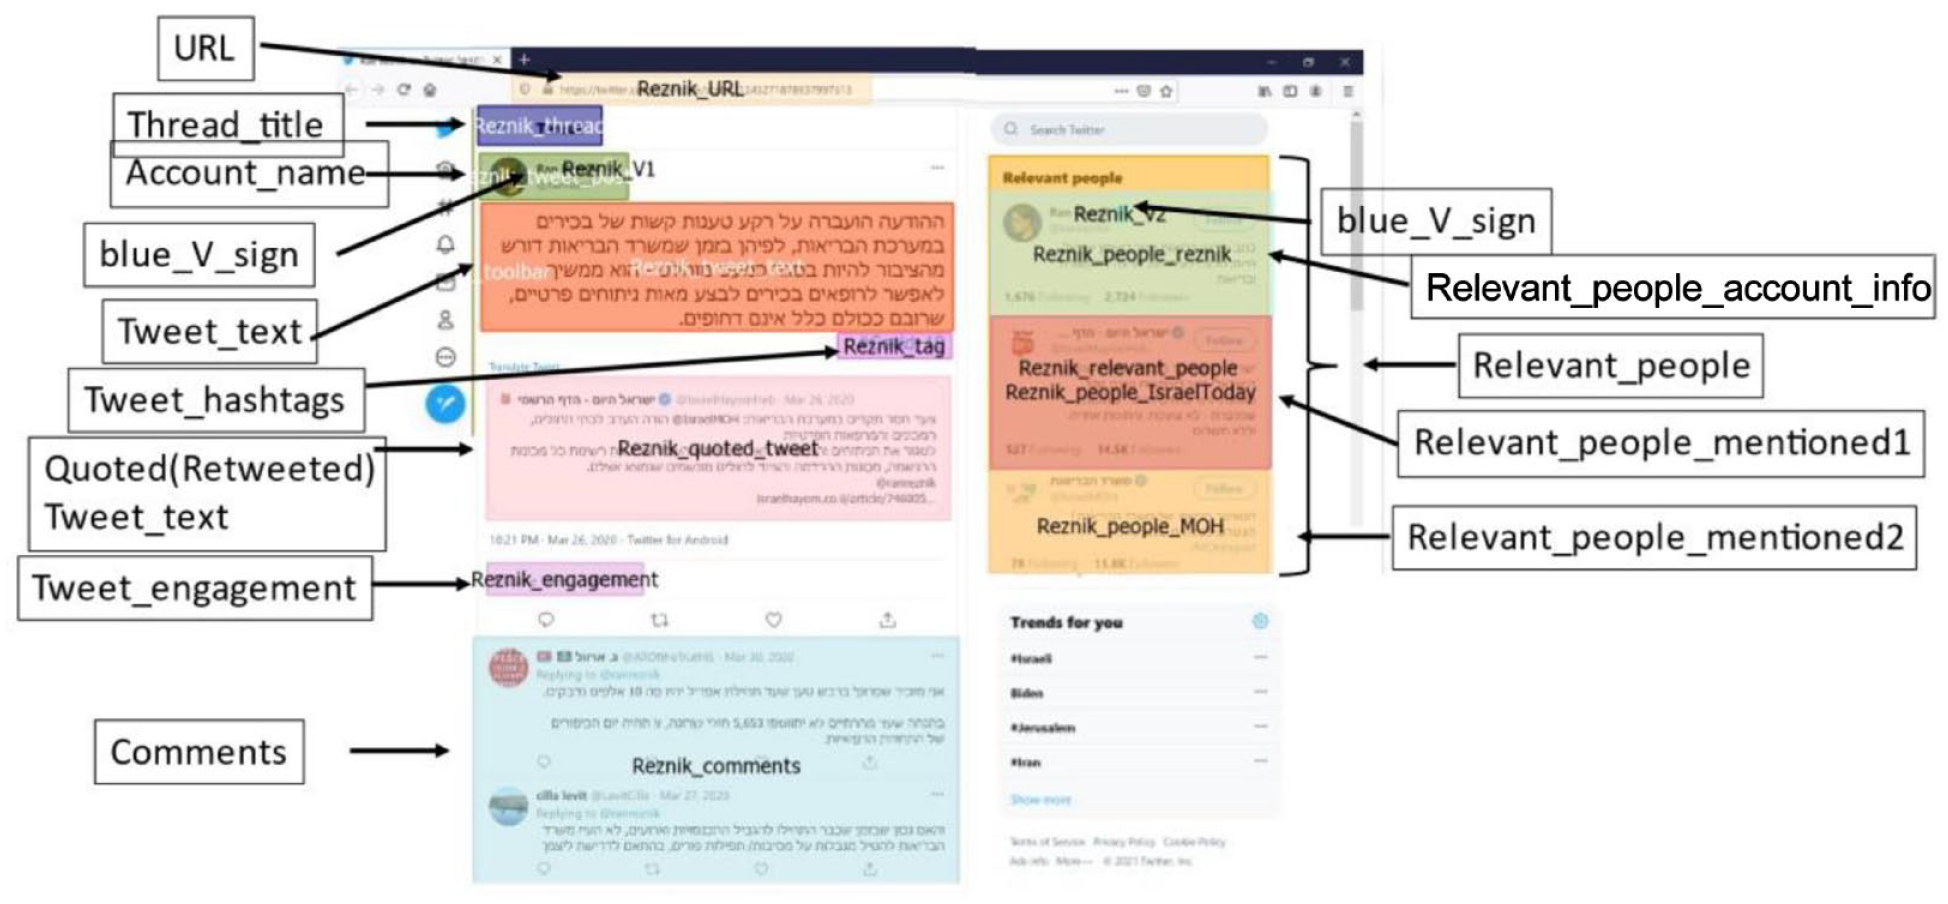
Areas of Interest (AOIs) for eye-racking analysis—Twitter pages.
Relevant eye-tracking metrics were exported for each AOI, including the fixation time as a percentage of the total time spent on the page, the number of fixations on the AOIs, dwell time (which includes both fixations and saccades), entry time to AOI (time to the first fixation from the time the page loaded to the screen), and revisits (user returning to gaze at the AOI after gazing at some part on the page that is outside the AOI).
Additional variables were created that combined (by mean calculation) the eye-tracking data from all AOIs defined as “metadata AOIs,” that is, areas displaying metadata about the message that can serve to attest to its credibility. For the social media pages, these areas include all comment sections, all engagement sections (shares, comments number, retweets, likes, reactions, etc.), the name, title, icon, logo, and blue V sign of the page or account that published the post/tweet, hashtags areas, the description section for the Instagram post, relevant people, and user bio sections for tweets, and the “forwarded many times” label for the WhatsApp message. For all pages, the URL of the webpage was included. The aggregated metadata variables calculated mean fixation count for these AOIs, mean dwell time percentage of the total dwell time on the page, and mean fixation time percentage.
Questionnaire
After completing the computer task, participants were asked to complete a questionnaire measuring their knowledge of technical digital terms as an indication of participant digital literacy, social media use, previous known experience with online misinformation, political orientation and efficacy, and demographics.
Knowledge of digital terms was assessed by asking participants to rate their familiarity on a scale from 1 (not familiar at all) to 5 (very familiar) with six technical terms from the digital domain. The questions were adapted from Hargittai and Hsieh (2012). Factor analysis confirmed that the six items loaded into one factor (KMO = .83, p < .001), and factor loadings and methods are detailed in Table 1. The index values ranged from 1 to 5 (M = 3.24, Mdn = 3.33, SD = 1.10). The questionnaire also included several other digital literacy scales based on self-reports and evaluations, but these were later found to be skewed and less reliable, and therefore were not included in the analysis. A note at the end of the “Conclusion” section addresses other measurements of digital literacy and their limited reliability as measures of digital literacy. See Table 1 for further details.
Summary of Factor Loadings of Items in the Digital Literacy Index: Knowledge of Technological Terms.

Participants were asked to rate how familiar they are with the following terms, on a scale ranging from 1 = not familiar at all to 5 = very familiar. The rotation method used for the factor analysis with PCA extraction method was varimax. KMO = .83, p < .001. RSS: really simple syndication; PCA: principal compnent analysis; KMO: Kaiser–Meyer–Olkin test.
Social media use was measured by counting the number of social media accounts participants reported owning. Participants were asked whether they owned an account on Facebook, Twitter, Instagram, WhatsApp, TikTok, LinkedIn, or Telegram, which are the main social media platforms in Israel. The index values ranged from 0 to 6 (M = 2.59, Mdn = 3, SD = 1.23). The main source for news was measured by asking participants to choose their primary source for consuming news between print newspapers, radio, TV, social networks, news websites, or no platform.
Previous known experience with online misinformation was measured by questions from Steinfeld (2022a), inspired by Barthel et al. (2016). Participants were asked to rate on a scale of 1 (never) to 4 (many times) how often in the past year they had encountered inaccurate or completely false information on the internet, shared messages on social networks that they knew were false, shared messages that they only later discovered were false, and taken an active role in preventing the spread of false messages on social media. Participants were also asked about their confidence in their own and others’ abilities to identify false messages.
Please refer to Supplemental Appendix A for a detailed description of all relevant questionnaire items.
Ethics Approval
This study was approved by Ariel University’s ethics committee (approval number AU-COM-NS-20210120).
Results
The vast majority of participants (71%) reported encountering completely false information on the internet at least once a month, with 34% stating they encountered misinformation several times a month. Furthermore, 71% of participants expressed confidence in their ability to successfully identify misinformation, with 60% indicating a large extent and 11% indicating a very large extent. On the contrary, 54% of participants reported never sharing information they later found out was false, while 24% stated they did so only once or twice. The remaining participants reported mistakenly sharing misinformation on social media several times (15%) or many times (2%) before.
Success in Misinformation Identification
A linear regression analysis was conducted to identify predictors of success in identifying misinformation. The variables included in the model were social media use, confidence in ability to identify misinformation, prior experience in combating the spread of misinformation, previously sharing misinformation, income, education, sex, age, religiosity (Haredi/non-Haredi), knowledge of digital terms, and dwell time percentage on metadata areas on the webpages. Owing to multicollinearity between the metadata ocular measurements (i.e., dwell time, fixation time, and percentage), only one ocular measurement was chosen. 1 However, the same results were obtained in models that used fixation count or time instead of dwell time.
The model predicted 51% of the variance of participant “fake test” score, F(14,43) = 5.19, p < .001, adjusted R2 = .51. Digital knowledge (digital literacy measurement) was the most significant predictor of success in identifying misinformation, followed by user gaze at metadata areas, social network use, and income. Table 2 summarizes the results of the regression analysis and coefficients. Importantly, being Haredi did not significantly predict misinformation identification, although this group was included due to their assumed lower levels of digital literacy. Haredi participants reported decreased knowledge of technological terms, but in the regression, it was the knowledge index, and not the religious factor, that predicted misinformation identification.
Significant Predictors of Successful Misinformation Identification, F(14,43) = 5.19, p < .001, Adjusted R2 = .51.

Note. SNS: social networking service.
p < .05. **p < .01. ***p < .001.
The results of the regression confirm hypotheses H1 and H2: Success in identification of misinformation is significantly predicted by digital literacy and by focusing attention on information metadata.
The test score calculated in the study may have been affected by some participants’ tendency to make decisive evaluations. Because the items were rated on a scale rather than on a binary yes/no answer, decisive ratings on the margins of the rating scales may have resulted in better scores (in the case of successful evaluations) than less decisive ratings (numbers closer to the middle). To investigate this potential bias, the participants’ ratings were recoded based on their level of “decisiveness,” which was calculated as the distance from the rating scale margins. A “decisiveness index” was then calculated for each participant and used to test for correlations with the study variables. The results of these tests revealed that there was no correlation between participants’ decisiveness regarding the credibility of the items and their overall test score, scan patterns, digital literacy, or any of the demographic or other study variables. This finding supports the conclusion that digital literacy and focused attention to metadata are significant predictors of success in identifying misinformation.
Focusing on Metadata Areas
Pearson correlation tests found significant correlations between knowledge of digital terms and ocular attention to metadata areas, that is, with fixation time (r = .30, p < .01), dwell time (r = .29, p < .01), and fixation count (r = .27, p < .05) on the metadata areas. In other words, participants who had more knowledge of technical digital terms tended to focus more on metadata areas than those who were less familiar with the terms. Since social media accounts and income were significant predictors of successful identification of misinformation items in the previous regression analysis, a regression analysis was conducted for predicting metadata dwell time. Digital knowledge, social media use, and income were included as possible predictors in the model. The model explains 9% of the variance in metadata dwell time, F(3,68) = 3.33, p < .05, adjusted R2 = .09. The only significant predictor was digital knowledge (β = .36, t = 3.13, p < .01).
The results confirm hypothesis H3: Digital literacy positively significantly corelates with attention to metadata areas on the page.
To illustrate the differences in scan patterns and attention to metadata between participants who are less familiar with digital terms and those who are more familiar with digital terms; Figure 3 presents the heat maps of participants in the lowest quartile of the digital knowledge index (score of 2 or lower) and those in the highest quartile of the index (score of 4 or higher). The page used for this example visualization is an authentic tweet by an Israeli journalist reporting a government decision to pay the costs of maternity pay for mothers who were laid off during the COVID-19 crisis. The “fake test” score of the first group (lowest knowledge score quartile) was significantly lower (M = 76.48, n = 21) than that of the second group (highest knowledge scores) (M = 87.22, n = 23), t(42) = 3.12, p < .01. From observing the heat maps, it is evident that participants in the lower knowledge score group paid most of their attention to the main tweet. Some of them continued to read the first comment (it was a follow-up to the first tweet by the reporter), but few ventured into other sections of the page. The highest knowledge score group, on the contrary, focused significantly on various metadata areas, in addition to the main tweet. Many of them have read through the comments (most of which praised the reporter for her quality reporting), read the account bio on the right side of the page, and checked the name of the account above the tweet, the date of the tweet, and the engagement metrics.

Heat maps of the lowest knowledge scores group (left) and the highest knowledge scores group (right).
Mediation of Metadata Focused Attention on the Effect of Digital Literacy on Identification of Misinformation
To further investigate these findings and test whether the relationship between digital literacy and success in identifying misinformation is mediated by focused attention to information metadata, a mediation model was employed. This model used Hayes’ PROCESS macro v3.4, with Model 4 used for testing a simple mediation. Standardized coefficients, total effects, and effect size were calculated.
The test did not find that focused attention to metadata areas mediates the relationship between digital knowledge and success in identifying misinformation. Therefore, Hypothesis H4 was not confirmed. While knowledge of technical digital terms predicted both dwelling on metadata areas and successfully identifying misinformation, and dwelling on metadata areas predicted successful identification of misinformation, the three factors did not follow a mediation pattern. This suggests that the effect of digital knowledge on metadata focus is direct, as well as the effect of digital knowledge on misinformation identification.
Conclusion
The study findings indicate that knowledge of digital terms is the primary predictor of successful misinformation identification. This discovery builds upon prior research that has identified digital literacy as central to users’ ability to assess information credibility (Bulger & Davison, 2018; Cooke, 2018; Levi, 2017). However, the current study extends this literature by investigating how digital knowledge impacts the way users scan social media and web pages to evaluate their credibility.
The study found that digital knowledge is also a predictor of user-scanning patterns on web pages. Specifically, it positively correlates with participants’ focus and attention on metadata areas. These areas provide relevant information about the post, article, or tweet, such as information about the account to indicate the publisher’s credibility (e.g., followers and following, verified blue “V” sign, account bio), other users’ reactions to the message (e.g., comments, engagement), and mentions of other users or organizations, links to reliable web pages, etc.) Since metadata often provides crucial cues for information credibility (Ajao et al., 2022; Haupt et al., 2021; Krishnan & Chen, 2018; Safieddine et al., 2016; Sharma et al., 2019), paying attention to metadata is an effective credibility-checking practice that characterizes advanced and digitally literate users.
Successfully identifying misinformation is positively associated with attention devoted to information metadata. Participants who paid attention to metadata areas were more successful in their evaluations of messages and in distinguishing between false and true information. Besides digital knowledge and attention to metadata, two other variables were significant predictors of success in misinformation identification: income (as in Sajjad et al., 2022) and the number of social media accounts. Interestingly, the number of social media accounts positively correlated with identification of misinformation, contrary to previous research findings (Jamieson & Albarracín, 2020; Nan et al., 2022). Perhaps participants’ familiarity with the structure of social media platforms helped them in searching and reading through the metadata areas to gain insight into the credibility of the messages.
The study found that the three factors (digital knowledge, attention to metadata, and success in misinformation identification) do not follow a mediation pattern. This means that the effect of digital knowledge on metadata focus is direct, as well as the effect of digital knowledge on misinformation identification. In other words, technology-savvy users who pay attention to information metadata are better able to identify misinformation online.
The study proposes a new direction in studying misinformation identification. Accurately identifying misinformation is crucial in preventing the adoption of bias, manipulation, and lies, which can lead to changing behavior, a decline in institutional trust, and, in some cases, a threat to the democratic system (Morgan, 2018; Reuter et al., 2019; Strömbäck et al., 2020). Therefore, the study’s results can serve as a practical guide for reducing the scope of this phenomenon.
Digital Knowledge as a Measurement of Digital Literacy
In this study, digital literacy was measured using a knowledge-based index, which was consistent with previous research (Hargittai, 2005; Hargittai & Hsieh, 2012). The index consisted of questions that assessed participants’ self-reported familiarity with technical digital terms. The post-session questionnaire also included digital literacy questions based on participants’ self-confidence in performing digital activities, as well as questions about the frequency of performing various tasks online, based on the tools developed in Hargittai and Hsieh (2012) and Van Deursen et al. (2014). However, only the knowledge-based index was found to be a significant predictor of misinformation identification and attention to metadata. The other indices did not correlate with any demographic variables or with success in identifying misinformation or eye gaze and scan patterns. In addition, these indices were highly skewed. As discussed in the literature review, self-assessments of digital skills are often biased and unreliable. Knowledge-based self-reports, on the contrary, are less prone to bias because they pertain to specific terms, concepts, or knowledge items.
The study also introduced eye-tracking data as an objective, reliable, and unbiased measure of digital literacy skills. This novel direction offers a new way to study various behavioral aspects of digital literacy and skills.
Study Limitations and Future Work
As with any lab research with a relatively small sample size, the results have limited validity and should be further examined with various populations and contexts.
Attention to metadata was calculated by combining ocular data for a variety of AOIs that vary in size, position, and purpose. However, for the purpose of misinformation identification, they all serve as possible cues. I acknowledge that the AOIs are quite different, and combining them into one measurement overlooks these differences. However, looking at each AOI separately would be too nuanced. Different users would make conclusions based on different cues, and comparing these parts separately would miss the larger picture. Therefore, to make the general claim that these cues combined served to make decisions regarding message credibility, they were analyzed as a group.
The study introduces eye-tracking as an unbiased, objective measurement. However, it should be acknowledged that no measurement is completely free of bias or distortion. Participants vary in their ocular behavior as well. Some participants may have been more disturbed by the tracking of their eyes and behaved differently. Some may have been more tired than others and may have scanned the webpages differently. Cultural variations may exist with respect to the study’s measurements. Therefore, repeating this study in various contexts and with different populations can serve to strengthen the findings and claims of this study.
In future studies that investigate user performance in evaluating information, it is recommended that the researchers measure and include participants’ prior knowledge of the topic featured in the messages, as well as their general knowledge and political knowledge, in the analysis. These variables may have a significant effect on how participants evaluate online messages and their ability to identify misinformation, acting as possible mediators. Prior relevant knowledge may also moderate other practices of credibility assessment, as the user may already know from reading the text whether it is dubious or reliable.
This study provided an examination of the processes that users employ when reading news messages online while trying to ascertain their credibility. The findings reveal that metadata areas are an important part of the messages and webpages, and digitally literate users devote attention to metadata as informative cues attesting to message credibility. Often, we focus on educating users about the importance of checking the information they consume online, but the practice of looking around at the metadata is often overlooked. Following the findings of this study, emphasis should be given to the practice of metadata examination and included in training.
Future work could investigate the effect of educational programs for advancing digital literacy on program graduates’ scan patterns of online information. Do users scan social media pages differently following a course guiding participants on how to evaluate online information? Eye-tracking can be used to observe changes in participants’ scan patterns while evaluating online messages after completing digital literacy courses.
The results of this study can serve as indicators for teachers and guides who wish to impart digital knowledge and skills to students, as well as IT departments developing training for employees on safe browsing. Beyond doubting information that users encounter online, there are available clues around messages that can help evaluate information credibility immediately and easily. A training that directs students to scan and search for clues in the metadata may prove efficient, practical, and lead to satisfying results in students’ abilities to accurately and quickly identify misinformation. Searching online every time one encounters questionable information is time-consuming and exhausting, but looking around the webpage may help users come to a conclusion and prove more practical. Metadata as a source for learning about information is not only important for identifying misinformation but also a useful tool to evaluate unfamiliar social media accounts (e.g., in the case of teenager training for safe internet use, an emphasis could be given to inquiring about social media accounts by their metadata) and as a source for further inquiry when users come across interesting posts or articles online and wish to expand their knowledge. Future research directions could focus on the efficiency of adopting the practice of metadata inquiry for various aims by users online, perhaps following a training emphasizing the value of metadata, and whether and how such practice helps users evaluate information and acquire information more efficiently and accurately.
Supplemental Material
sj-docx-1-sms-10.1177_20563051231196871 – Supplemental material for How Do Users Examine Online Messages to Determine If They Are Credible? An Eye-Tracking Study of Digital Literacy, Visual Attention to Metadata, and Success in Misinformation Identification
Supplemental material, sj-docx-1-sms-10.1177_20563051231196871 for How Do Users Examine Online Messages to Determine If They Are Credible? An Eye-Tracking Study of Digital Literacy, Visual Attention to Metadata, and Success in Misinformation Identification by Nili Steinfeld in Social Media + Society
Supplemental Material
sj-docx-2-sms-10.1177_20563051231196871 – Supplemental material for How Do Users Examine Online Messages to Determine If They Are Credible? An Eye-Tracking Study of Digital Literacy, Visual Attention to Metadata, and Success in Misinformation Identification
Supplemental material, sj-docx-2-sms-10.1177_20563051231196871 for How Do Users Examine Online Messages to Determine If They Are Credible? An Eye-Tracking Study of Digital Literacy, Visual Attention to Metadata, and Success in Misinformation Identification by Nili Steinfeld in Social Media + Society
Footnotes
Acknowledgements
The study was conducted with the support of the Haredi Institute for Public Affairs, and the Institute for the Study of New-Media, Politics and Society at Ariel University. The author is grateful for the contribution of my colleagues Tamar Berenblum, Yehudit Miletzky, and Elazar Korenfeld to this study. I also wish to thank Ziv Tandovsky, Netta Laor, Jordan Zeidenberg, and Tzlil Rahamim for their assistance in managing the research project.
Declaration of Conflicting Interests
The author(s) declared no potential conflicts of interest with respect to the research, authorship, and/or publication of this article.
Funding
The author(s) received no financial support for the research, authorship, and/or publication of this article.
Supplemental Material
Supplemental material for this article is available online.
Notes
Author Biography
References
Supplementary Material
Please find the following supplemental material available below.
For Open Access articles published under a Creative Commons License, all supplemental material carries the same license as the article it is associated with.
For non-Open Access articles published, all supplemental material carries a non-exclusive license, and permission requests for re-use of supplemental material or any part of supplemental material shall be sent directly to the copyright owner as specified in the copyright notice associated with the article.