
Abstract
The fear of the unknown combined with the isolation generated by COVID-19 has created a fertile environment for strong disinformation, otherwise known as conspiracy theories, to flourish. Because conspiracy theories often contain a kernel of truth and feature a strong adversarial “other,” they serve as the perfect vehicle for maligned actors to use in influence campaigns. To explore the importance of conspiracies in the spread of dis-/mis-information, we propose the usage of state-of-the-art, tuned language models to classify tweets as conspiratorial or not. This model is based on the Bidirectional Encoder Representations from Transformers (BERT) model developed by Google researchers. The classification method expedites analysis by automating a process that is currently done manually (identifying tweets that promote conspiracy theories). We identified COVID-19 origin conspiracy theory tweets using this method and then used social cybersecurity methods to analyze communities, spreaders, and characteristics of the different origin-related conspiracy theory narratives. We found that tweets about conspiracy theories were supported by news sites with low fact-checking scores and amplified by bots who were more likely to link to prominent Twitter users than in non-conspiracy tweets. We also found different patterns in conspiracy vs. non-conspiracy conversations in terms of hashtag usage, identity, and country of origin. This analysis shows how we can better understand who spreads conspiracy theories and how they are spreading them.
Introduction
Public health misinformation surrounding the COVID-19 pandemic has become a vital, time-sensitive research focus this past year. In February 2020, the World Health Organization (WHO) Director-General acknowledged that we were fighting both an epidemic and an “infodemic.” COVID-19 was later declared a pandemic in March of 2020, with the United Nations (2020) soon after warning that fake news can spread incredibly fast, even faster than the virus itself. Some of the first COVID-related misinformation studies focused on describing the types of stories and sources circulating on social media during the beginning of the pandemic. From January to May 2020, miracle cures were the most prevalent misinformation topic in a sample of both traditional and online media (Evanega et al., 2020). Other common misinformation themes included ideas that COVID-19 was a “Deep State” plot, a Democratic Party hoax to coincide with President Trump’s first impeachment, a Chinese bioweapon, a plan by Bill Gates to microchip everyone, and a virus infecting individuals via 5G towers (Evanega et al., 2020).
Conspiracy theories are especially appealing to individuals in times of uncertainty and crisis (Douglas et al., 2019; Oleksy et al., 2020; Sternisko, Cichocka, & Van Bavel, 2020). COVID-19 was a new virus at the start of the 2020 pandemic, with scientists and public health officials continuously updating their knowledge base as they learned more. Conspiracy theories offer people explanations that may give them a sense of control over their lives or a sense of uniqueness that they know something others do not (Sternisko, Cichocka, & Van Bavel, 2020). A Pew Research Center survey conducted in the summer of 2020 revealed that 36% of respondents who have heard about COVID-19-related conspiracy theories believe they are probably or definitely true (Basu, 2020). Work by Brotherton (2015) shows that no one group of people is above conspiracy theories, and in some ways, these theories act as a defense mechanism against people’s natural fear of the unknown.
While conspiracy theories may help people feel like they have regained some control, they can often have dangerous consequences. COVID-related conspiratorial beliefs are associated with problematic health behavior, such as reduced levels of self-reported handwashing and social distancing (Imhoff & Lamberty, 2020). Conspiracy theorists are less likely to trust experts, which is particularly problematic in the case of a pandemic (Douglas et al., 2019; Imhoff & Lamberty, 2020). In addition to science denial, conspiratorial beliefs have been associated with higher intentions for everyday crime, increased prejudice, extremism, and an increased tendency toward violence (Douglas et al., 2019; Sternisko, Cichocka, Cislak, & Bavel, 2020; Sternisko, Cichocka, & Van Bavel, 2020). Previous research by Sternisko, Cichocka, and Van Bavel (2020) shows that conspiracy theories can also foment dangerous anti-democratic movements. A prime example of this problem has been the recent surge in support of QAnon and various election-related conspiracy theories. These theories motivated many of the individuals involved in the violent insurrection on the US Capitol on 6 January 2021 (Brittain et al., 2021; Seitz, 2021).
The internet and social media platforms help facilitate the spread of conspiracy theories faster than ever before (Douglas et al., 2019). QAnon has gone from a fringe movement to having large amounts of social media activity. Because conspiracy theories can impact behavior in a public health crisis and social media is one of the vehicles through which they spread, it is essential to study who is spreading these conspiracy theories on social media and how.
Related Work
Conspiracy theories are attempts to explain the causes of significant social and political events with claims of secret plots involving two or more powerful actors (Aaronovitch, 2010; Byford, 2011; Dentith & Orr, 2018). There has been extensive research conducted on who falls for conspiracy theories, why they believe these theories, and what effects these beliefs may have on real-world behavior (Douglas et al., 2019; Imhoff & Lamberty, 2020; Sternisko, Cichocka, & Van Bavel, 2020). Prior work on conspiracy theories has spanned several fields, including psychology, history, political science, and sociology (Uscinski & Parent, 2014).
Belief in Conspiracy Theories
Individuals who believe in one conspiracy theory often believe in others, even other theories that may seem logically incompatible (e.g., simultaneously believing that Princess Diana faked her death, but also that she was murdered) (Georgiou et al., 2020; Goertzel, 1994; Wood et al., 2012). Most Americans believe in at least one well-known conspiracy theory. The idea that Lee Harvey Oswald was not the only person involved in John F. Kennedy’s assassination is one of the most popularly believed conspiracy theories, even decades after the event occurred (Douglas et al., 2017).
Belief in conspiracy theories is primarily motivated by a desire for information, a sense of control, and maintaining a positive view of yourself and your identity groups. When information surrounding an event is unavailable, conflicting, or incomplete, belief in a conspiracy theory can lower an individuals’ feelings of uncertainty and quench their curiosity (Douglas et al., 2017). In addition, conspiracy theories appeal to those who feel that they or their group is being threatened in some way (Douglas et al., 2017). Letters from readers of the popular New York Times newspaper over the last century in the United States were analyzed. Researchers found that the popularity of certain types of conspiracy theories in these letters tended to track with which political groups were out of power at the moment. Conspiracy theories about leftists or communists were more commonly discussed in letters to the newspaper when a Democrat was president, while conspiracy theories about the right or big corporations were more talked about when a Republican was president (Uscinski & Parent, 2014). Conspiracy theories have been an instrumental part of the political conversation throughout US history (Fenster, 1999).
Communication of Conspiracy Theories
According to Franks et al., there are three primary dimensions of a successful conspiracy theory: the stick, the spread, and the action. Effective communication of a conspiracy theory involves these three aspects (Franks et al., 2013).
The “stickiness” of a theory involves how that theory appeals to individuals and how passionate those individuals become about it. Theories that sound completely outlandish, such as “lizard people” theories, are therefore less likely to stick with a large number of individuals because that seems too bizarre. The “spread” refers to how individuals share and convince others of this theory. A successful spread involves targeting the right people and anticipating possible critiques so that they can be rebutted. Finally, the “action” refers to the degree to which believers take collective action against those they believe are conspirators.
Theories framed as a group conflict over a societal value, such as our sacred value of democracy, are more likely to inspire action. For example, those who stormed the US Capitol believed in false allegations of voter fraud and took specific action as a result. On the other hand, believers of conspiracy theories surrounding the J.F.K. assassination tend to be more casual in their belief and have also not taken any action, perhaps because there are no obvious possible actions to take.
Successful conspiracy theories are typically communicated in specific ways to maximize stick, spread, and action, and actors can exploit these theories to attain their desired goals (Franks et al., 2013; Nefes, 2017). In 2013, Erdogan, the Prime Minister of Turkey at the time, spread a conspiracy theory among his supporters to discredit anti-government protesters. The protesters were resistant to a government-planned demolition of a park to build a shopping mall. Erdogan claimed that the protesters were associated with malicious foreign agents, including the “interest rate lobby,” who were conspiring against the Turkish economy. Erdogan likely had two primary goals: discredit political opponents by labeling them as funded by foreigners and pressure the central bank to lower interest rates faster (Nefes, 2017). A study conducted on a popular Turkish forum found that pre-existing political belief strongly predicted whether an individual would believe in the conspiracy theory, with Erdogan supporters being more likely to believe it than his opponents (Nefes, 2017).
Looking at COVID-related conspiracy theories, we have seen that they have spread to large numbers of individuals, often without being challenged. A study of Spanish, French, and German social media users found that state-backed reporting from adversarial nations like China, Russia, and Iran received more engagement on average than mainstream news sources (Rebello et al., 2020). In a large study on both online and traditional media from January to May 2020, Evanega et al. (2020) found that only 16% of mentions of COVID-19 misinformation included some level of fact-checking, indicating that most of these posts were not being disputed. A different analysis of a specific conspiracy theory, the 5G/COVID-19 link, found more fact-checking. The authors collected sample tweets containing the #5GCoronavirus hashtag from 27 March to 4 April 2020, which was the week the hashtag was trending in the United Kingdom. From the sample, 65% of tweets were either countering the 5G/COVID-19 theory or were general tweets with no opinion on the matter (Ahmed et al., 2020). However, the authors found no authority figure in the network combating the misinformation, indicating that more coordination among public health officials may be needed (Ahmed et al., 2020).
Aspects of social media, including hashtags, bots, and URL links, can contribute to the spread of conspiracy theories. Prior research shows that simple and concrete messages tend to be memorable, and messages that fit in with our prior beliefs, seem credentialed, and trigger our emotions are more likely to spread (Heath & Heath, 2007). Both malicious and unwitting actors take advantage of these factors and the structure of social media to spread conspiracy theories. Since Twitter restricts the number of characters in a message, many tweets spreading conspiracy theories will have a message with a URL link to a seemingly credentialed “source.” Hashtags also facilitate the spread of content to particular audiences. In July 2020, Twitter blocked QAnon-related URL links and changed their algorithms to no longer highlight QAnon activity and hashtags in search results or recommendations (Conger, 2020). Finally, prior research on early COVID-19 Twitter data shows that the more conspiratorial a tweet, the more likely a bot was tweeting or retweeting it. There was a much higher percentage of bots originating or retweeting fakes news when compared to real news (Huang, 2020). Given that conspiracy theories can be so quickly communicated online, it is crucial to understand how they propagate on social media.
Impact of Conspiracy Theories
Belief in conspiracy theories can have real-world consequences. With the rise of social media and the internet, more people are exposed to these false stories, with many believing and acting on them. Employees who distrust their workplace and believe in organizational conspiracy theories are more likely than other employees to have higher turnover, decreased commitment, and decreased job satisfaction (Douglas & Leite, 2017). Many conspiracy theories demonize the enemy and delegitimize dissenting voices, and acceptance of these theories may encourage believers to act violently (Bartlett & Miller, 2010). While many conspiracy theories do not lead to violence (JFK assassination, 9/11 Truthers, etc.), there are several cases where belief in conspiracy theory acts as a “radicalization multiplier,” compounding with other factors that encourage extremism and terrorism (Bartlett & Miller, 2010; Douglas et al., 2019). However, it is difficult to disentangle whether conspiracy theories lead to violence or are just more prevalent in individuals who are pre-disposed to violence (Uscinski & Parent, 2014).
Research has shown that belief in COVID-related conspiracies is often associated with taking fewer preventive measures, such as social distancing and frequent handwashing (Imhoff & Lamberty, 2020; Oleksy et al., 2020). A British survey found that belief in the 5G coronavirus conspiracy was positively correlated with anger against the state and a willingness to engage in violence (Jolley & Paterson, 2020). Because belief in conspiracy theories can negatively impact offline behavior in a pandemic, it is essential to understand the spread and reach of these dis-/mis-information stories.
Detection of Conspiracy Theories
Most of the prior research on conspiracy theories has focused on the psychology behind why people believe them, the way they are communicated, and their real-world impact. While a fair amount is understood about conspiracy theories, less is known about how to detect them. Tangherlini et al. (2020) employed automated machine learning techniques to understand the narrative structures of both actual conspiracies (e.g., Bridgegate) and conspiracy theories (e.g., Pizzagate), and then later applied similar techniques to try to detect coronavirus misinformation stories (Shahsavari et al., 2020). Understanding what narratives are spreading and how they are being structured and placed into pre-existing conspiracy theories is the first step in developing ways to disrupt their spread (Shahsavari et al., 2020).
Other misinformation researchers have used clustering techniques to cluster hashtags together as a way to analyze communities and discussions surrounding the pandemic (Cruickshank & Carley, 2020). Zinoviev (2017) applied network science to quantify the relationship between conspiratorial and pseudo-science topics and between conspiratorial and non-conspiratorial topics using the title and co-purchasing information from Amazon. In some cases, research to detect disinformation or “fake news” only combines conspiracy theories with other forms of disinformation (Aphiwongsophon & Chongstitvatana, 2018). In addition, these models either rely on network connections (Zinoviev, 2017) or rely on handcrafted templates (Tangherlini et al., 2020). Networks and network inference do not scale well, which is an important factor to consider when analyzing big data. Handcrafted templates take time to create and deploy, and they are typically only useful for a limited time period before a new template needs to be created. Therefore, more work is needed to develop useful methods for quickly detecting new conspiracy theory topics on social media as they arise.
This article uses the Bidirectional Encoder Representations from Transformers (BERT) model, trained and tuned with labeled training data about COVID-related conspiracies. This model significantly changed the natural language processing (NLP) language in 2018 and is partly responsible for the popularity of transformer models. We chose to use a BERT-based model for this study for several reasons. First, it can detect conspiracies through text alone, does not require templates or network information, and therefore runs relatively quickly and scales linearly. The BERT language model also has a good track record for improving downstream NLP tasks after domain-specific pre-training and tuning. These applications include BioBERT (biomedical text (Lee et al., 2020)), SciBERT (scientific applications (Beltagy et al., 2019)), DocBERT (document classification (Devlin et al., 2018)), and COVID-Twitter-BERT (Müller et al., 2020).
We used this model to address three research questions:
RQ1. Can we rapidly and accurately identify conspiracy theory tweets related to COVID-19?
RQ2. How do users behind conspiracy theory tweets differ from non-conspiracy users?
RQ3. How are the tweets that carry conspiracy theories propagating through the extensive COVID-19 discussion?
We show that this state-of-the-art model can aid in the fast detection of conspiracy theories. Given the rising threat of conspiracy theories, it is essential to understand who is spreading these theories and how they are being spread so quickly on social media to develop effective counter-measures.
Data
Classifier Training Data
Our training dataset consists of 8,781 hand-labeled tweets. The dataset was collected from the Twitter application programming interface (API) using keywords found in Table 1 with a collection window between February 2020 and July 2020. Memon et al. developed a labeling taxonomy to classify 4,573 of the tweets in a study to characterize COVID-19 misinformation communities (Memon & Carley, 2020). Table 2 presents the labels created to characterize the misinformation communities.
Keywords Used in Twitter’s Application Programming Interface (API) to Collect Tweets That May Capture the Different Types of COVID-19 Dis-/Mis-Information (Memon & Carley, 2020).

List of Labels Developed to Characterize COVID-19 Dis-/Mis-Information Themes on Twitter (Memon & Carley, 2020).

The remaining 4,208 tweets were hand-labeled by university student volunteers participating in a summer studies course. The course leads provided instruction and labeling guidance to follow the same procedures as the Memon et al. study. We took all 8,781 previously labeled tweets and collapsed the original 16 labels in a binary fashion for our study. First, we coded all tweets classified as conspiracy in the original dataset as “1” conspiracy tweets. We then took all remaining original labels and re-coded them to “0” for non-conspiracy tweets. Thus, tweets labeled as “0” non-conspiracy include tweets that may contain truthful information but also might include dis-/mis-information in the form of a “fake cure,” “fake treatment,” or “false fact.” It is important to note that our classification task is not to label dis-/mis-information but to label a particular kind of “strong” dis-/mis-information known as conspiracy theories. In making this training choice, we believe that our model will distinguish between other forms of dis-/mis-information and conspiracy. The result is a final training dataset that consists of 8,781 labeled tweets, which is the most extensive labeled COVID-19 conspiracy theory dataset of which we are aware.
Data for Analysis
Our study focuses on the analysis of conspiracy tweets related to the origin of COVID-19. To facilitate this work, we set our collection period to encompass time before and after the beginning of the US lockdown. Our research group collected 243.6 million tweets from Twitter’s v1 streaming API between 16 February 2020 and 31 May 2020, using the “collection” terms in Table 3. The “collection” terms remained unchanged, and our collection did not miss any days during the period of our study. Figure 1 displays the number of tweets collected by day. It is important to note that v1 streaming API may produce at most 1% of the data available on Twitter’s Firehose API. Work by Morstatter et al. (2013) shows that the realized coverage is variable and at times biased.

This figure provides the longitudinal distribution of COVID-19-related tweets collected from Twitter’s API using the collection terms found in Table 3 from 16 February 2020 through 31 May 2020.
This Table Represents the List of Terms Used to Collect COVID-19-Related Tweets and the List of Terms Used by This Study to Find Conspiracy Theory-Related Tweets.

Note. Type “Collection” refers to the terms used with Twitter’s API to collect COVID-19 tweets. Type “Filtering” refers to terms used in a regular expressions search query to find conspiracy-related tweets from the COVID-19 tweets collected by Twitter’s API.
Next, we developed a set of filter terms to find tweets that might contain conspiracy theories related to the origin of the COVID-19 virus. The “Filtering” section of Table 3 provides the complete list of terms we used to search through our massive collection of COVID-19 tweets to find possible origin conspiracy content. 5G may seem like an addition to the list, but we found several origin theories that argued that the virus was created to take advantage of 5G or that 5G causes COVID-19.
Our final dataset for analysis consists of 1,508,765 English language tweets, with 953,696 unique user accounts. Table 4 provides a breakdown of the number of tweets, retweets, mentions, and replies found in our dataset.
This Table Provides the Number of Tweets by Type (Tweet, Retweet, Reply, and Mention) Found in Our Data.

Bots, Identity, and Location
We augmented the data usually provided by a tweet object with a prediction on whether an account might be a bot, an account categorization, and a prediction of the account location. The augmented data were made possible by social cybersecurity forensic tools that include BotHunter developed by Beskow and Carley (2018) and identity and location labeling techniques developed by Huang and Carley (2019, 2020a). We added these additional features to our data with the intuition that they may provide markers or trends in the spread of conspiracy theories on Twitter.
Bots are automated agents used on social media platforms. Not all bots are used for nefarious purposes, but in recent years, they have been used widely to spread dis-/mis-information (Beskow & Carley, 2018). BotHunter is a random forest regressor trained on labeled tweets from known information operation attacks on the Atlantic Council’s Digital Forensic Lab and NATO collected by Beskow and the suspended Russian bot dataset released from Twitter in October 2018. The model leverages tweet content and user metadata to provide a probability (between 0 and 1) that an account is a bot or not a bot; see Table 5 for a more comprehensive list of BotHunter features. The developers of BotHunter, in a separate study, calculated the precision/recall scores on multiple sets of Twitter data, and they recommend in their article to use a threshold of between
This Table Provides the List of Features Used by BotHunter to Classify Potential Bots (Beskow & Carley, 2018).

Social media platforms host a diverse set of actor types. Actors can be regular users, government entities, or celebrities. The availability of account profile data is inconsistent; some accounts have descriptive information, and some do not. It is often hard to determine what kind of actor an account is based on profile data alone. Huang and Carley developed a hierarchical self-attention neural network model to classify Twitter user actor types. The model uses account metadata and tweets to classify a user as one of the seven types: regular user, marketing agency, news reporter, government official, celebrity, company, or sports figure (Huang & Carley, 2020a). Unlike BotHunter, this algorithm is a neural network model and does not output a direct probability score. The final layer of the model is the Softmax layer, and the model assigns labels based on the highest Softmax score. When these researchers applied this algorithm to COVID-19 Twitter data, collected from 29 January to 4 March 2020, they had a 94.5% accuracy (Huang, 2020; Huang & Carley, 2020b). Considering the high level of accuracy and the similarity in topic and time frame to our dataset, we used this algorithm to augment our data. These labels will be useful in determining the types of accounts that spread or counter conspiracy theories.
In social cybersecurity, forensics analysis of the location of tweets can be a valuable aspect when analyzing a dis-/mis-information campaign. Determining the origin of a campaign may help determine intent, sources, and targets. A tweet object can contain geo-tag information and user-declared location data on an account’s profile. This kind of information is typically sparse and unreliable (Graham et al., 2014; Hecht et al., 2011). To solve this issue, Huang and Carley (2019) present a hierarchical location prediction neural network (HLPNN) to predict a user’s location, given tweet text and metadata features. Like the identity prediction model, the location prediction model’s final layer is the Softmax layer, and the model assigns labels based on the highest Softmax score. When these researchers applied this algorithm to their COVID-19 Twitter data, they had a 92.96% accuracy (Huang, 2020). We add this feature to aid our analysis to determine if state actors are using conspiracy theory narratives to shift blame from their handling of COVID-19.
Methodology
Language Models
NLP, a subfield of artificial intelligence, provides a robust set of tools to aid social cybersecurity analysis. These tools include but are not limited to sequence classification, parts-of-speech labeling, summarization, and knowledge extraction. The effectiveness of these tools for analysis is typically limited by the numerical representation of text for analysis. Pre-trained language representations have been shown to improve the effectiveness of these NLP tasks (Devlin et al., 2018). Current state-of-the-art language representations take transformer architecture (Vaswani et al., 2017) and word (token) context into account when forming numerical representations. A major strength of such models in our research is that they employ a general architecture and use weights tuned to specific downstream tasks.
BERT was the first language representational model to create bidirectional representations based on jointly conditioning on both left and right context of input sequences (Devlin et al., 2018). The original BERT model consisted of two versions: BERT-Base, which has 12 layers and 110 million parameters, and BERT-Large, which has 24 layers with 340 million parameters. Both versions were domain agnostic and were pre-trained using unsupervised learning on a corpus of text consisting of 800 million words from BooksCorpus and 2.5 billion words from Wikipedia (Devlin et al., 2018). Recent work shows the versatility and utility of the general-purpose language model when domain-specific data are applied to fine-tune the model. This is evidenced by the popularity of BioBert (Lee et al., 2020), SciBERT (Beltagy et al., 2019), and Covid-Twitter BERT (CT-BERT) (Müller et al., 2020).
Because of its proven success in improving downstream NLP tasks and its proven adaptability to different domains, we selected BERT to serve as our language representation model to train our conspiracy theory tweet classifier. We chose to test the BERT-Large pre-trained model and the COVID-Twitter-BERT v2 (CT-BERT) model. CT-BERT is based on the BERT-Large model but is pre-trained with 97 million unique COVID-19-related tweets collected between 12 January 2020 and 5 July 2020 (Müller et al., 2020). The tweets collected for this training were collected with similar search terms and in a similar manner as the data used in this study.
Model Training
We used the transformer library (Wolf et al., 2020) with TensorFlow 2.4 on CPU with 64 GB of RAM for classifier training. Individual tweets served as input sequences and were tokenized using their respective pre-trained language models. A Twitter message can contain up to 280 characters, but we were able to reduce the max token length needed for training down to 64 tokens. We used a batch size of 16, which is the minimum recommended batch size for training. We set a constant learning rate of 2e−5 with the ADAM as the optimizer. The conspiracy theory classifier trained on 8,781 tweets labeled as “conspiracy theory” or “not conspiracy theory” for binary classification. The data were split 80% for training and 20% for testing. We trained our classifiers for 10 epochs for approximately 6 hr per model.
Training Results
We used the area under the curve (AUC) and F1 scores as performance metrics to determine the best model. AUC provides an aggregate measure of performance across all possible classification thresholds. F1 score is another measure of accuracy that measures the balance between precision and recall of the model. The F1 scores for BERT-Large and CT-BERT are essentially the same at 0.950 and 0.948, respectively, while the AUC score for CT-BERT is slightly higher (0.971 vs. 0.966). Based on the results, we feel confident that either model would aid our analysis. In the end, we chose the BERT-CT model because of the domain knowledge captured by the model.
Results
Table 6 shows a summary of the data and their predicted conspiracy, bot, and identity labels. In the following subsections, we address our three research questions.
This Table Provides a Summary of the Data Used for Analysis.

Unique hashtags in that label.
RQ1: Can We Rapidly and Accurately Identify Conspiracy Theory Tweets Related to COVID-19?
In this section, we address whether we can rapidly and accurately identify conspiracy tweets related to COVID-19. Our classifier labeled 826,367 of 1,508,756 tweets, approximately 55%, as conspiracy tweets. The number may seem high, but we collected tweets with conspiracy theory-related search terms, so we believe this to be a reasonable percentage. Table 7 provides examples of tweets classified as conspiracy and non-conspiracy by our model. Figure 2 provides tweet classification behavior by month between February and May 2020. We can observe that conspiracy-labeled tweets follow an up-and-down pattern; this may represent a decline in coverage of one conspiracy theory and the rise in coverage of a new conspiracy, say from “covid is a bioweapon” to “5G is causing covid.” In contrast, the number of non-conspiracy labeled tweets gradually grows as the pandemic continues.

This figure provides the number of labeled conspiracy and non-conspiracy tweets by month.
This Table Shows Example Text From Tweets Labeled as Conspiracy and Non-Conspiracy.

Note. The conspiracy text was generated by an account associated with QAnon that Twitter has since suspended. The non-conspiracy text was generated by a reputable news source’s Twitter account.
To approximate the accuracy of the conspiracy classifier when applied to unlabeled data, we selected 200 tweets and provided ground truth labels. We first selected the top 10 most retweeted conspiracy and non-conspiracy tweets per month of our data; in doing so, we wanted to provide ground truth labels to the most frequently occurring text in our data. We randomly sampled an additional 120 tweets from our data, excluding the tweets we previously provided ground truth labels for and their copies. The process produced 200 unique tweets, representing 311,346 total tweets or approximately 20% of our dataset with ground truth labels.
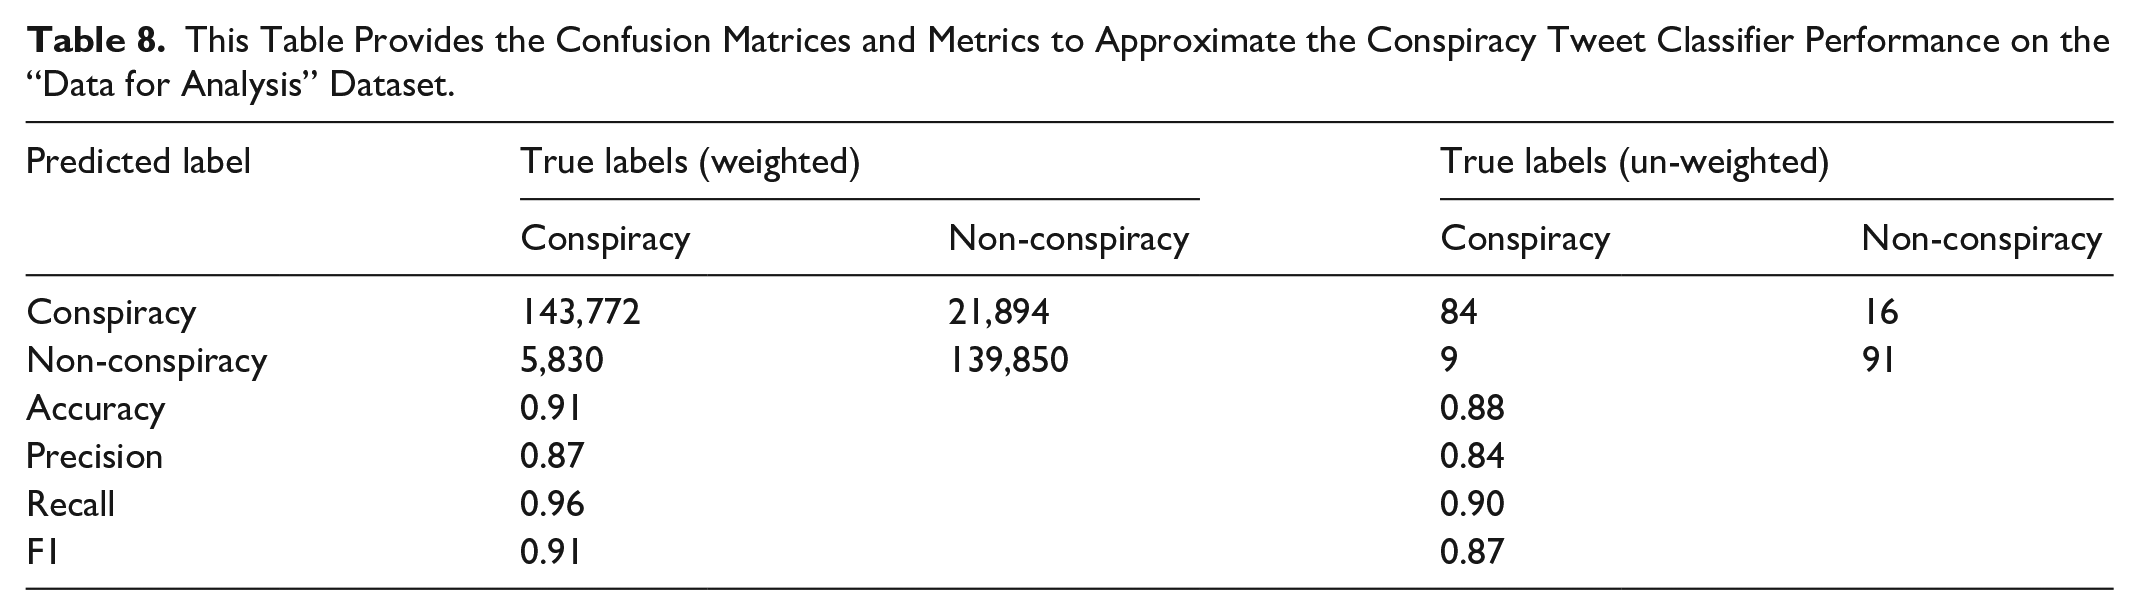
We calculated classifier metrics using only the unique tweets (un-weighted) and the total volume of those tweets (weighted). The classifier achieved accuracy and F1 scores approximately 6%–10% less than the score achieved during model training and validation. Table 8 provides a more comprehensive breakdown of model performance. We achieved weighted and un-weighted accuracy scores of 0.91 and 0.88 and weighted and un-weighted F1 scores of 0.91 and 0.87, respectively, and processed 1,508,756 tweets in under 3 hr. Our results represent a 6% increase in accuracy compared to other tools.
This Table Provides the Confusion Matrices and Metrics to Approximate the Conspiracy Tweet Classifier Performance on the “Data for Analysis” Dataset.
RQ2: How Do Users Behind Conspiracy Theory Tweets Differ From Non-Conspiracy Users?
This section compares the two groups of users on their social identities, country, and bot-like behavior.
Social Identities
For social identity labels, we were interested in seeing which types of identities participate in conspiracies the most. To determine if identity labels are independent of conspiracy labels, we conducted Pearson’s chi-square test. The relationship between these variables was statistically significant, . In the following analysis, we analyze tweets for which we have social identity predictions; 2% of the data do not have social identity predictions. Figure 3 provides a contingency table of social identity labels by classified tweet labels; the values are row-normalized.

This figure displays the row-normalized contingency table for social identity labels by predicted conspiracy label.
We find that normal and celebrity identities are more prevalent in tweets classified as conspiracy-related. The model classified 56% of tweets from predicted normal users and 62% of tweets from predicted celebrities as a conspiracy. On the other hand, companies (56%), government entities (70%), news agencies (64%), reporters (59%), and sports figures (80%) social identities are more abundant in non-conspiracy tweets.
Countries of Origin
We sought to determine if there was any unusual country representation between conspiracy and non-conspiracy tweets. Again, we apply Pearson’s chi-square test to determine independence between predicted country labels and conspiracy labels. Here, we find a relationship between conspiracy label and predicted country label likely exists, X2 (207, N = 1,465,653) = 69,127.74, p < .001. Table 9 provides a list of the top 10 predicted countries with the volume of tweets produced by that country and the percentage of those tweets classified as non-conspiracy and conspiracy. Figure 4 provides a heat-map view of the same data. Only 2% of the data did not have a country prediction. We find that the United States and China had the most considerable portions of their tweets classified as a conspiracy. In contrast, Canada and Australia had just over 50% of their tweets classified as a conspiracy.

This figure displays the row-normalized contingency table for location labels by predicted conspiracy label.
This Table Shows the Top 10 Predicted Countries by Volume of Tweets and Associated % of Conspiracy and Non-Conspiracy Tweets.

Most of the predicted conspiracy tweets have their origin in the United States. Previous work presents a similar trend in the spread of dis-/mis-information via URLs on Twitter during the COVID-19 pandemic (Huang, 2020; Huang & Carley, 2020b). This result may suggest that the United States continues to be a significant source of disinformation, or many Americans were using conspiracy stories as a mechanism to make sense of the pandemic (Douglas et al., 2017). A limitation of these results is that our dataset is English language only. In addition, while dis-/mis-information may often originate in the United States, many of those accounts could be controlled or influenced by actors outside of the country.
Bot Activity
Predicted bots produced approximately 35% of all the tweets in our data, 33% of all tweets labeled non-conspiracy, and 36% of all tweets labeled conspiracy. Figure 5 shows that the percentage of tweets sent by bots in conspiracy tweets is more significant than the rate of tweets sent by bots in non-conspiracy tweets for each month of our data. We tested the independence of bot labels and conspiracy labels using Pearson’s chi-square test and found them not independent of each other;

This figure provides bot activity as the percentage of tweets sent by predicted bots by month.

This histogram displays the bot prediction probability distribution for both conspiracy and non-conspiracy tweets.
We find an interesting observation when comparing the BotHunter scores between conspiracy and non-conspiracy tweets labeled as a bot and not a bot. BotHunter scores of non-conspiracy tweets labeled as a bot (Mdn = 0.859) were slightly higher than those of conspiracy tweets labeled as a bot (Mdn = 0.854). We computed the one-sided Mann–Whitney test statistic and reject the null hypothesis that these bot scores come from the same underlying distribution; see Table 10 for test statistics. For tweets labeled as coming from a bot, the distribution underlying non-conspiracy tweet BotHunter scores is stochastically greater than the distribution underlying conspiracy BotHunter scores. In contrast, BotHunter scores of non-conspiracy tweets labeled non-bot (Mdn = 0.477) were much lower than those of conspiracy tweets labeled non-bot (Mdn = 0.528). Again, a one-sided Mann–Whitney test was statistically significant; see Table 10 for test statistics. For tweets labeled as coming from a non-bot, the distribution underlying non-conspiracy tweet BotHunter scores is stochastically less than the distribution underlying conspiracy BotHunter scores.
This Table Provides the Mann–Whitney Test Statistics for the BotHunter Score Comparison.

When running these statistical tests, we find that conspiracy bot scores are lower than non-conspiracy bot scores for the populations above the 0.75 threshold, and conspiracy bot scores are higher than non-conspiracy bot scores for the populations below the 0.75 threshold. A possible explanation for this finding is that non-conspiracy tweets exhibit characteristics that mark them as clearly either bot or not bot. In contrast, conspiracy tweets present characteristics that make it harder to distinguish between bot and not bot, and they may have more cyborg accounts (mix of human and bot-like features). Figure 6 displays the previously described pattern, where the non-conspiracy bot scores are more numerous at the low end of the probability scale and more tightly skewed toward .9 on the higher end of the probability scale. In contrast, the conspiracy bot scores are more bunched around the threshold.
One of the significant functions of bots is amplification; they can send information at the speed of an algorithm, and they scale (Beskow & Carley, 2018). We find that bots generated 39% of conspiracy retweets and 36% of non-conspiracy retweets. While bots amplify messages more in conspiracy tweets, non-bot accounts conduct most of the amplification in the conspiracy and non-conspiracy tweets. Comparing all bot activity between conspiracy and non-conspiracy, bots found in conspiracy tweets send 3% fewer retweets than bots found in non-conspiracy tweets. Bots found in conspiracy tweets use mentions more often than bots found in non-conspiracy tweets.
RQ3: How Are the Tweets That Carry Conspiracy Theories Propagating Through the Extensive COVID-19 Discussion?
This section compares how the individual tweets differ in the conspiracy vs. non-conspiracy groups in their usage of hashtags and URLs. These tweet attributes affect a tweet’s spread and impact.
Hashtag Analysis
For hashtags found in conspiracy and non-conspiracy tweets, we were most interested in determining differences in usage behavior. We wanted to see if any distinct indicators may help identify conspiracy tweets more easily or provide insights into user behavior within a conspiracy theory topic group. Figure 7 shows a line plot of the number of hashtags per tweet for conspiracy tweets vs. non-conspiracy tweets. As shown in the figure, conspiracy tweets have a higher hashtag usage rate per tweet than non-conspiracy tweets across all 4 months of our data. This result may suggest that users perpetuating conspiracy theories or spreading conspiracy tweets rely on hashtag use to establish topic groups and attract like users to their message more than users not perpetuating conspiracy tweets.

This figure provides the average number of hashtags found in conspiracy and non-conspiracy tweets by month.
The top hashtags for conspiracy and non-conspiracy tweets are variants of “#coronavirus,” “#covid19,” and “#wuhanvirus,” which might be expected based on our data collection terms. To better understand the hashtag topics in our data, we remove all variants of “virus” and then analyze the remaining hashtags. Table 11 presents the top 15 resulting hashtags used for conspiracy and non-conspiracy tweets. We see that the total usage counts for the top 15 hashtags found in conspiracy tweets are 78,439, which is over twice as many found in the top 15 hashtags for non-conspiracy tweets at 29,950. In the conspiracy theory hashtags, we see three strong QAnon-related hashtags, #QAnon, #WWG1WGA (“where we go one, we go all”), and #DeepStateCabal. There are also hashtags with strong ties to President Trump and Bill Gates. The non-conspiracy tweet hashtags do not appear to carry the same topics.
This Table Shows the Top 15 Hashtags Found in Conspiracy and Non-Conspiracy Tweets That Are Not a Variant of the Pandemic’s Name.

URL Analysis
We wanted to discover if URL usage differed between conspiracy and non-conspiracy tweets. In doing so, we also wanted to explore the top domains shared and analyze the factuality ratings of those domains. We converted shortened URLs, mapped mobile versions to full versions, cleaned out query terms, and found fewer unique URLs present in conspiracy tweets than non-conspiracy tweets. Figure 8a shows the number of unique URLs per month by conspiracy label; we see that the number for non-conspiracy surpasses conspiracy as the pandemic progresses. We tested to see if the number of times each URL is shared is independent of conspiracy labels using Pearson’s chi-square test. We compared all URLs shared and also considered only URLs found in bothconspiracy and non-conspiracy tweets. In both cases, we found that we can reject the null hypothesis that the number of times a URL is shared is independent of conspiracy labels; total URL case:

This figure provides two views of URL usage for conspiracy and non-conspiracy tweets. (a) Unique URLs by month and conspiracy label. (b) Average number of URLs per tweet by month.
Figure 8b shows the trend for the average number of URLs per tweet by conspiracy label. The average number of URLs per non-conspiracy tweet steadily increases as the pandemic progresses. Simultaneously, we find a sharp decline and a slight rise in the average number of URLs per conspiracy tweet. The increase in URL usage for non-conspiracy tweets may result from more credible information about COVID-19 reaching news sources.
Comparing domains, we find 5,485 unique domains in conspiracy tweets compared to 10,178 unique domains in non-conspiracy tweets. There appears to be a more concentrated group of outside sources shared in conspiracy tweets. The Carnegie Mellon University Center for Computational Analysis of Social and Organizational Systems (CASOS) research group maintains a thesaurus of media sources that provide a label (real news, fake news, etc.), a factual rating (1: very low to 6: very high). We calculated the domain factual rating weighted average for domains found in conspiracy and non-conspiracy tweets and find that the conspiracy average is 3.27 and the non-conspiracy average is 4.66. Table 12 displays the top 10 domains found in each tweet label category. In addition, we found 168 domains considered conspiracy or fake news in conspiracy tweets and found 80 fake news/conspiracy domains in non-conspiracy tweets.
This Table Shows the Top 10 URL Domains Found in Conspiracy and Non-Conspiracy Tweets.

Limitations and Future Work
One limitation of our study is that in the training data, the ratio of class labels is 7 (non-conspiracy): 3 (conspiracy), representing a slight imbalance in the training data. The imbalance could lead to non-optimized results for the unbalanced class because the model never gets a good look at the underlying class. In addition, due to the timing of our data collection, our data primarily focus on conspiracy theories related to the origins of COVID-19. Future work using late 2020–2021 data could be used to analyze conspiracy theories related to the COVID-19 vaccines.
A limitation related to the model itself is that because the underlying pre-trained language model for text embedding and the training data is linked explicitly to COVID-19 text, our model may not generalize to other topics like the 2020 US election. The final limitation is related to the data collection of tweets for analysis. By collecting only English language tweets, we could have potentially introduced some bias in our downstream tasks, such as our location analysis.
Future work should continue analyzing COVID-19 data because strategies for disseminating conspiracy theories online may change over the course of the pandemic. This work could include building a more balanced training dataset to include tweets discovered during this study. In addition, creating more diverse training datasets to help new models generalize beyond COVID-19 would be useful. Another avenue for future analysis would be to apply our approach to a more comprehensive collection of tweets beyond the English language only.
Conclusion
Our usage of the BERT model (Devlin et al., 2018; Müller et al., 2020) tuned to classify the COVID-19 tweets as conspiratorial or not helped us quickly analyze large amounts of data. When comparing conspiracy and non-conspiracy labeled tweets, we found several significant differences in hashtag and URL usage, bot behavior, and the user types in each group.
Overall, we have four main findings:
Language model success—The BERT-based model (Devlin et al., 2018; Müller et al., 2020) tuned with COVID-19 discourse was able to rapidly and accurately classify conspiracy-related tweets.
User identities—Celebrities and normal users were the most prevalent identity group in the conspiracy group, and the United States originated and spread a disproportionate amount of pandemic-related misinformation.
Bot strategies—Bots were more prevalent in the conspiracy group and were more likely to link to prominent Twitter users compared with bots in the non-conspiracy group. This strategy is also a way to build their community.
Credibility differences—Users in the conspiracy group linked to less credible sources and used fewer unique URLs and hashtags, perhaps as a way to more effectively build groups and spread their message.
A long-term goal of our research is to develop an NLP-based system capable of solving a wide range of dis-/mis-information classification tasks (not just conspiracy theories). We have shown that the BERT-based model is scalable, fast, and effective in classifying conspiracy theories specifically, separate from other types of dis-/mis-information. The success of the BERT-based model in this context gives further evidence to language models’ effectiveness in various applications and datasets. Future work should apply language models to other important dis-/mis-information classification tasks.
We also found that those in the conspiracy group were more likely to be bot accounts and originate from the United States. Disingenuous actors may be employing bot accounts to help spread their message more effectively in an automated or semi-automated fashion. Social media companies often target unauthorized bots for removal, and this study shows that this approach may be effective. Understanding where these conspiracy theories originate can help social media companies and public health officials appropriately target their prevention or response efforts.
Compared with non-conspiracy tweets, we found fewer unique URLs and domains in the conspiracy-labeled tweets. Conspiracy-related tweets also contained fewer unique hashtags than non-conspiracy tweets, but the average hashtag usage per tweet was higher. Using a smaller set of unique hashtags can help consolidate content and make it easier to find for interested users. The presence of fewer unique URLs in the conspiracy dataset may be because either more real-news domains currently exist or conspiracy theorists consolidate on certain web domains to, again, make their content easier to find. These results show the importance of community building when propagating conspiracy theories and that conspiracy theory promoters are effective communicators. Therefore, de-emphasizing or countering their commonly used hashtags and URLs in social media search results could be an effective policy response by social media companies.
Leveraging language models was crucial for quickly analyzing conspiracy theories in the COVID-19 pandemic. We found that the user types and communication strategies of those in the conspiracy group differed noticeably from regular users. This type of analysis can be used going forward for responding to real-time events where it is vital to know who is promoting conspiracy theories, what strategies they are using, and how we can best apply potential counter-measures.
Footnotes
Declaration of Conflicting Interests
The author(s) declared no potential conflicts of interest with respect to the research, authorship, and/or publication of this article.
Funding
The author(s) disclosed receipt of the following financial support for the research, authorship, and/or publication of this article: The research for this article was supported in part by the Office of Naval Research (ONR) under grants N00014182106 and N000141812108, the Knight Foundation, the US Army, and by the Center for Informed Democracy and Social—cybersecurity (IDeaS). The views and conclusions are those of the authors and should not be interpreted as representing the official policies, either expressed or implied, of the Knight Foundation, the ONR, the US Army, or the US Government.