
Abstract
This article explores how Twitter’s algorithmic timeline influences exposure to different types of external media. We use an agent-based testing method to compare chronological timelines and algorithmic timelines for a group of Twitter agents that emulated real-world archetypal users. We first find that algorithmic timelines exposed agents to external links at roughly half the rate of chronological timelines. Despite the reduced exposure, the proportional makeup of external links remained fairly stable in terms of source categories (major news brands, local news, new media, etc.). Notably, however, algorithmic timelines slightly increased the proportion of “junk news” websites in the external link exposures. While our descriptive evidence does not fully exonerate Twitter’s algorithm, it does characterize the algorithm as playing a fairly minor, supporting role in shifting media exposure for end users, especially considering upstream factors that create the algorithm’s input—factors such as human behavior, platform incentives, and content moderation. We conclude by contextualizing the algorithm within a complex system consisting of many factors that deserve future research attention.
Introduction
Despite the high stakes of social media platforms exercising gatekeeping power in the digital media ecosystem, little is known about the specific effects of these platforms sorting and filtering content for millions of users every day. According to a 2019 survey by Pew Research Center (Shearer & Grieco, 2019), most US adults say that social media companies have too much control over the news people see and that the companies’ efforts “result in a worse mix of news for users.” A growing body of evidence supports this perception. The 2016 US presidential election, the COVID-19 pandemic, and other recent events have vividly demonstrated how social media platforms and their driving algorithms can impact the public. They have been shown to spread conspiracy theories that spark violence (Amarasingam & Argentino, 2020), amplify misinformation that threatens public health (Islam et al., 2020), provide false information that undermines voting rights (Scott & Overly, 2020), and more.
Yet platforms still lack sufficient accountability for their gatekeeping power, especially when it comes to algorithms’ role in spreading problematic media that can cause harm. While some general patterns are becoming clear (Guess et al., 2021; Singh, 2019) and Facebook and Twitter provide some transparency such as how many fake accounts they remove 1 and generally how their community standards are enforced, 2 key points remain opaque. In particular, this work addresses the question: how do social media platforms’ driving algorithms shift exposure to different types of news for end users? Prior work has explored how curation algorithms affect “echo chambers” (Auxier & Vitak, 2019), source concentration (Nechushtai & Lewis, 2019), and partisanship (Robertson et al., 2018), and we build on this work by undertaking a descriptive study exploring how Twitter’s algorithms affect news exposure in terms of quality.
Our method involves a direct comparison between algorithmic timelines and chronological timelines for a sample of emulated Twitter agents (see Figure 1). We created eight agents to emulate real-world archetypal users, which were identified through a network analysis of following behavior. Then, we used automation software to check their timelines twice a day for 4 weeks. By comparing each agent’s algorithmically sorted timeline to their baseline chronologically sorted timeline, we measured the extent to which Twitter’s curation algorithm shifted media exposure in the timeline. With a focus on quality, we build on recent theoretical work by Bradshaw et al. (2020) that delineates various types of sources, from professional news outlets to junk news outlets that “deliberately publish misleading, deceptive, or incorrect information packaged as real news.”

Screenshots of the “Home” algorithmic timeline (left) and the “Latest Tweets” chronological timeline (right) for one emulated agent in our study. Note that the algorithmic timeline contains recommended tweets from accounts the agent does not follow. To measure the effect of algorithmic curation, we compared these two types of timelines for a group of emulated Twitter accounts.
Evidence from our study suggests that Twitter’s curation algorithm significantly reduces overall exposure to external links: on average, 50% of tweets in chronological timelines contained an external link, compared to 23% in algorithmic timelines. Despite this large reduction, the proportional makeup of external link exposures remained fairly stable, although notably Twitter’s curation algorithm slightly increased the proportion of junk news exposures, especially for right-leaning agents in our study. Analyzing individual news sources, we found that the algorithm decreased proportional exposure to some high-volume professional news sources (e.g., Reuters, Washington Post) while increasing proportional exposure to other professional news sources (e.g., CNN, New York Times [NYT]) as well as junk news sources. Finally, a focused analysis of one prominent professional news source—the NYT—showed that algorithmic timelines increased proportional exposure for the outlet’s “softer” news (Reinemann et al., 2012) from news desks covering culture, sports, and styles, for example. We conclude by discussing our evidence of the algorithm’s “supporting role” in a complex media ecosystem, with many other upstream factors that create the input for the algorithm.
Related Work
This study fits into a rich body of literature grappling with rapid changes in the news ecosystem amid the rise of social media platforms and their new gatekeeping power. This interdisciplinary literature spans computer science (Starbird & Maddock, 2014), political science (Grinberg et al., 2019a), journalism studies (Bechmann & Nielbo, 2018), mass communication studies (Beer, 2017), and social media studies (Auxier & Vitak, 2019). We are especially motivated by looming questions in this literature as to how the algorithms behind these platforms shift exposure to external media—we address these questions through descriptive comparison of media observed in chronological and algorithmic timelines. To accomplish this, we build on methodological scaffolding for algorithm audits, which are defined here as empirical studies aiming to characterize public algorithmic systems for potential problematic behavior (Bandy, 2021). This section groups related work based on our general research problem (auditing social media algorithms), the audit method we used (agent-based auditing), and the key analysis dimension (news quality).
Auditing Social Media Algorithms
Following theoretical claims that social media algorithms may create “echo chambers” and/or “filter bubbles” (Flaxman et al., 2016), some research has empirically explored how these algorithms affect exposure diversity for users (Bechmann & Nielbo, 2018; Eslami et al., 2015). The phenomenon has generally failed to materialize in experimental studies (see Bruns, 2019b, for a review). In one study, Bakshy et al. (2015) measured how Facebook’s algorithmically curated News Feed affected exposure to ideologically cross-cutting news. The study intended to address the role of the News Feed algorithm in reinforcing users’ political leanings by reducing visibility of ideologically cross-cutting content and/or increasing visibility of ideologically consistent content. Facebook conducted the study internally, using real-world data to compare exposure at four levels: randomly sampled content from the platform, content from users’ friends, content shown to users in the News Feed, and content clicked on by users. For a subset of Facebook users who self-reported their political ideology, the News Feed algorithm slightly decreased exposure to ideologically cross-cutting content, both for conservatives and for liberals. However, users’ friends and click choices played a greater role in creating the echo chamber effect.
Facebook’s study received substantial interest both inside and outside the academic research community, given its implications for the popular echo chamber hypothesis. Many pointed out the study’s limitations, such as non-random sampling and reliance on users’ self-reported political ideology (Hargittai, 2015). Also, the study excluded more than 90% of all unique URLs from the original dataset because they were classified as “soft news” (Bakshy et al., 2015; Supplementary Materials). But further research efforts and replication studies to address these limitations have proven difficult, if not impossible. This is mainly because Facebook and other social media platforms now restrict access to key information required for such research (i.e., attention data in the form of exposures or impressions). The challenges have been documented and discussed as a significant challenge to studying human attention on the Internet, for example, see Freelon (2018), Bruns (2019a), and Lazer (2020). Some researchers have devised workaround methods such as auditing with crowdworkers (Robertson et al., 2018) and/or sock puppets (Bandy & Diakopoulos, 2020). While these workaround methods have their own limitations, they provide meaningful insights about algorithms that would otherwise remain “black boxes.”
Agent-Based Auditing
Agent-based auditing addresses the aforementioned data restrictions that can impede research, and also provides flexibility for other data collection challenges. Social scientists have used similar methods when comprehensive sampling is not possible. For example, an influential study of employment discrimination in the United States (Bertrand & Mullainathan, 2003) sent fictitious résumés to job applications in just two cities, Boston and Chicago. Similar to audit studies in the social sciences, some technical audit studies involve agent-based user impersonation achieved through computer programs, which means auditors must choose a subset of users to impersonate. As Sandvig et al. (2014) explain in their taxonomy of algorithm audit methods, this “sock puppet” method uses impersonation to provide “a great deal of control over the manipulation and data collection.” Note that we conduct a sock puppet audit but mainly refer to it as an “agent-based” audit, following recent suggestions for a more unified framework in these types of studies (Haim, 2020).
Two agent-based audits pertain closely to our work. Haim et al. (2018) studied personalization and exposure diversity in Google News, creating four agents based on a media-user typology (MUT) (Brandtzæg, 2010) intended to represent archetypal life standards. For example, one agent represented “a bourgeois father in his fifties.” The authors trained the agents on different interests via web browsing activity, collected personalized Google News stories for 1 week, and then analyzed search results to show that all four agents encountered almost the exact same 100 articles for any given search query. In a similar agent-based audit, Le et al. (2019) trained browser profiles to represent pro-immigration, anti-immigration, and control users, based on Twitter accounts with corresponding political views. They then collected Google search results for these users over a 1-week period, finding a substantial degree of personalization, which varied across search terms. Unlike Haim et al. and other similar work (Hannák et al., 2013), Le et al. created agents based on ideological views rather than demographic information.
We build on these studies in several important ways. First, we similarly employ a method for creating archetypal agents, but we do so based on US political ideology rather than the demographics used by Haim et al. or the immigration-specific ideology used by Le et al. We also apply our audit to a social media curation algorithm (Twitter’s timeline algorithm) rather than a news or Internet search algorithm. Finally, our analysis does not focus on diversity and “echo chamber” effects, which have been explored in many previous experiments (Bruns, 2019b). Instead, we focus on the quality of the content curated by the algorithm, building on previous work that seeks to address content quality on algorithmic platforms (Zhang et al., 2018), including search engines like Google and Bing (Makhortykh et al., 2020) and media platforms like YouTube (Hussein et al., 2020) and Twitter (Huang & Carley, 2020).
News Quality
News quality on digital platforms has become an urgent and important topic for many researchers. An overarching concern that guides this work is that new platforms and technologies may threaten the free and open exchange of credible information—a foundational aspect of well-functioning democracies (Helberger, 2019). Some researchers have explored methods for improving this exchange, for example, by identifying credible sources through methods like MediaRank (Ye & Skiena, 2019) and developing signals to help identify credible articles (Zhang et al., 2018). Closely related to our work are studies that help characterize how information (as well as misinformation) flows in the digital media ecosystem, including on platforms like Twitter.
A recent literature review by Orellana-Rodriguez and Keane (2018), scoped to “news and its dissemination on Twitter,” emphasized the spread of fake news as a primary way that Twitter can “negatively impact the provision of news and journalism.” Studies of news dissemination on Twitter and other platforms have paid significant attention to “fake news,” especially following the Brexit referendum in the United Kingdom and the 2016 US presidential election. For example, one study by Grinberg et al. (2019a) used a panel of registered US voters to measure news exposure during the 2016 election season, finding that most political news came from mainstream sources, and a small number of “supersharers” were responsible for the vast majority of fake news shared on the platform.
One important lesson from Grinberg et al. and related work is the contested definition of “fake news.” Similar concepts have been referred to as “false news” (Vosoughi et al., 2018), “misinformation” (Nørregaard et al., 2019; Starbird & Maddock, 2014), “alternative narratives” (Starbird, 2017), and more (see Tandoc et al., 2018, for a review). The concept faces epistemological complications due to appropriation by meme culture and elite political figures. Crucially, the concept of “fake news” also fails to capture a broad category of problematic media that platforms often classify as “news,” although it fails to meet basic standards for journalism. In this work, we leverage recent efforts by Bradshaw et al. (2020) to develop a comprehensive typology that captures the variety of information being shared over social media, which includes the concept of “junk news.” Junk news is operationalized within a grounded, comparative typology that evaluates news sources (i.e., web domains), an aggregate proxy for news content, using five criteria related to (1) professionalism, (2) style, (3) counterfeit, (4) bias, and (5) credibility. Any source that meets three of these five criteria is labeled junk news, and other sources are labeled based on other categories in the typology, which was developed and refined over the course of almost 2 years. We adopt the same typology in our work and discuss it further in the “Methods” section.
Methods
Creating Archetypal Agents
A key issue for agent-based audits is the creation of agents whose behavior mimics dimensions of interest. Twitter’s policies constrained the number of accounts we could emulate, so we devised a method for creating a small number of representative agents for our audit. Here, we provide an overview that summarizes the approach, although further technical details for the method are in previous work (Bandy & Diakopoulos, 2021). Figure 2 and Table 1 show the main steps involved.

Flowchart depicting the archetype selection pipeline.
The Main Steps Involved in the Archetype Selection Pipeline.

Future researchers who use this archetype selection framework may vary specific inputs or methods based on their needs, starting with the initial pool of users. As in related research exploring news on social media (Bradshaw et al., 2020; Guess et al., 2021; Vosoughi et al., 2018), our work focuses on US political news, which has tangible impacts on public perception, voting, and government behavior. To generate a pool of users engaged in US political news, our initial input comprised all Twitter accounts that followed US congresspeople in March 2020. This surfaced over 20 million unique accounts engaged in US politics and the accompanying news cycle. Because of Twitter’s API (Application Programming Interface) rate limits, it was necessary to take a random sample of 10,000 accounts from the initial pool of 20 million (collecting network data for these 10,000 accounts, that is, their friends and followers, took approximately 1 week). The archetypes that emerge in subsequent steps should be considered archetypes within this scoped group of politically engaged accounts, rather than from the entire universe of Twitter users. The steps after this initial input and subsampling are likely more generalizable.
In the community detection step, we ran the standard Louvain algorithm (Blondel et al., 2008) on the co-following network of the sample of 10,000 users. The Louvain algorithm works by assigning each user its own community and then iteratively joining closely linked communities, which in this case would indicate similar following behavior. We used this algorithm because it has been successfully applied in related work (Grinberg et al., 2019b; Stewart et al., 2017) and because it incorporates weighted edges by default. Alternative community detection algorithms may be explored in future work.
To identify archetypal users in terms of exposure, community detection was not run on the following/follower network, but rather the network defined by two users being connected if they both follow the same third user. This co-following network allowed us to identify typical users based on what would appear in a chronological timeline, as this is determined by which accounts a user follows. Each edge in the network was weighted by the Jaccard coefficient of the connected users’ friends lists 3 —if user A’s friends list included 100% of user B’s friends list, the edge weight was 1, and if it contained 0%, the edge weight was 0. Thus, the Louvain algorithm detected communities of users with similar following behavior.
We ran community detection on two subsets of users: left-leaning users who mostly followed Democratic congresspeople, and right-leaning users who mostly followed Republican congresspeople. The Louvain algorithm detected four major left-leaning communities and four major right-leaning communities, which together included 99% of the inputted users. Within these eight communities, we calculated normalized degree centrality and selected the user with the highest centrality as the community archetype. In the co-following network, high degree centrality indicates similar following behavior to other users in the network. Because these archetypes capture representative following behavior in their respective communities, we posit that their timelines and content exposure should also be fairly representative. We validated the archetype users by verifying that they followed influential users in their community and confirmed that their bot score was below a commonly used threshold of 0.5, using software from Yang et al. (2020).
Overall, this network-oriented pipeline has several merits. It generates a small number of distinct, representative accounts that reflect broad communities on Twitter based on following behavior. The pipeline therefore aligns with modern understandings of news exposure dynamics, namely, that the traditional “two-step flow” model must now be expanded to account for the newsmakers, users, celebrities, algorithms, advertisers, and other actors that make up more complicated “curated flows” (Thorson & Wells, 2016). Within these flows, a user’s network plays a key role in shaping the news they encounter. By selecting archetypal accounts based on network analysis, our study naturally incorporates important dynamics of curated flows, such as incidental exposure from social networks (Fletcher & Nielsen, 2018) and network propagation of information (Starbird, 2017). To measure and account for the dynamics of algorithmic curation, the next step was to collect data directly from Twitter timelines.
Data Collection
We collected timeline data twice per day for four full weeks, with the first data point collected at 9 a.m. Central Time on Monday 13 July 2020 and the last data point collected on Sunday 9 August 2020 at 9 p.m. Central Time. The time and frequency of collection were determined based on social media usage habits reported by Pew Research (Wojcik & Hughes, 2019). At each point and for each of the archetype agents, our program collected the first 50 tweets in the algorithmic timeline and then the first 50 tweets in the chronological timeline. As described by Twitter, the algorithmic timeline shows “Top Tweets” which “you are likely to care about most,” algorithmically curated based on “accounts you interact with most, Tweets you engage with, and much more” (Twitter, 2021). The chronological timeline shows “latest tweets,” sorted by time.
Of the 56 scheduled scrapes (twice per day for 28 days), 4 failed due to Twitter verification checks that required us to manually log in and complete CAPTCHA tests. In total, the algorithmic and chronological timelines contained 31,791 unique tweets. After all scheduled scrapes finished, we collected canonical data (namely, favorite count, retweet count, precise timestamps, and external links) directly from Twitter’s API for 31,008 of them. The remaining tweets (2%) had either been deleted by users or were from accounts that Twitter suspended.
Link Collection and Annotation
Our analysis focused on external media exposure, partly motivated by prior observations that Twitter’s curation algorithm drastically reduced the number of external links in the timeline (Bandy & Diakopoulos, 2021). Some preprocessing steps were required to further analyze this effect across the 11,038 unique external links in the dataset. We used a python program to unwrap each unique external link through all redirects to its final URL and manually visited links that blocked the crawler. For example, we manually visited many shortened links from the Washington Post due to the website’s strict paywall that blocked the python program.
After unwrapping links, the dataset included 1,244 unique domains, which we labeled based on the typology from Bradshaw et al. (2020). As noted in the “Related Work” section, this typology includes subcategories (and parent categories) for classifying news sources. The parent categories of sources are professional news outlets (e.g., major news brands, local news), professional political sources (e.g., political parties, government), divisive and conspiracy sources (e.g., junk news, state-funded Russian propaganda sites), and other political news and information (e.g., political humor, fundraising). The full typology is detailed in Table A1, which includes descriptions of each subcategory.
We chose to use the typology from Bradshaw et al. for several reasons. First, the political scope of the typology fit well with the focus of our work, providing clear labels for political news and information sources that would appear to politically engaged users. The typology also emerged from a long process of development, revision, and application, with proven usefulness in prior work. For the task of labeling individual sources, Bradshaw et al. report a Krippendorf’s alpha of .89 when labeling the mutually exclusive subcategories, indicating high intersubjective agreement and strong concept formation following almost 2 years of iteration. Finally, the typology includes a rigorous system for labeling low-quality “junk news” sources that were of particular interest to our study. Bradshaw et al. labeled a source as junk news if it met three out of five criteria related to (1) professionalism, (2) style, (3) counterfeit, (4) bias, and (5) credibility. Table A2 details how each criterion indicates either junk news or professional news.
The supplementary materials from Bradshaw et al. provided labels for 95 of the domains observed in our data, which accounted for 50% of all unique links. The first author manually labeled the remaining domains using the Bradshaw et al. typology detailed in Table A1, including the junk news criteria described above and detailed in Table A2 (a source received the junk news label once it met three of the five criteria). Our labeling method entailed visiting the home page and about page for each domain, and then assigning the source’s subcategory based on general information, authors, owners, and funding. Following Bradshaw et al., we also found that some junk news sources required viewing individual articles and/or checking source information from third parties such as Politifact, Wikipedia, and Media Bias Fact Check. Many domains we labeled fell under the “other non-political” category, such as sites focused on sports (N = 68), music (N = 37), finance (N = 31), and adult content (N = 7), and some domains were unreachable (N = 46). In total, 1,103 domains were successfully labeled for analysis.
Analytical Framework
Our descriptive analysis measured how Twitter’s algorithm influenced exposure to external media in the timeline, with a focus on different categories of external sources. For this study, we defined and operationalized an exposure as the appearance of a domain in an agent’s timeline. We used this definition to address four research questions, starting with a broad look at overall external link exposure (RQ1) and then analyzing exposure to different categories of sources (RQ2), different individual sources (RQ3), and different types of content from one professional source (RQ4). We address each research question through a framework of quantitative description, in line with a growing body of literature that recognizes descriptive work as an important contribution in and of itself (Munger et al., 2021).
RQ1. How does the algorithmic timeline influence overall external link exposures, compared to the chronological timeline?
RQ2. How does the algorithmic timeline influence exposure to different categories of sources, particularly junk news and professional news sources?
RQ3. How does the algorithmic timeline influence exposure to individual sources?
RQ4. How does the algorithmic timeline influence exposure to different types of content (e.g., politics, metro, op-eds) from a single high-quality source—the NYT?
RQ1, External Links
A key initial question regarding Twitter’s timeline algorithm was how it generally affected exposure to external links, given that social media platforms can have a significant influence on referrals for many publishers. For example, when Facebook changed its News Feed algorithm in 2017, publishers saw a drastic decrease in overall traffic, driven by a decrease in referrals from Facebook, which led many publishers to prioritize more direct engagement with their audiences (Winkler, 2018). Over 70% of Twitter users get news on the platform (Shearer & Matsa, 2018), so it is especially important to understand how Twitter’s timeline algorithm may affect exposure to external media and referrals to news publishers. For this part of the analysis, we measured the exposure rate of external links in the agents’ timelines to determine whether the timeline algorithm promoted news and other external media, or promoted other internal content (e.g., pictures or text-only tweets).
RQ2, Categories of News Sources
The second focus of our analysis was to determine how the timeline curation algorithm affected exposure to junk news sources in the agents’ Twitter timelines, as well as other categories of sources. We calculated the junk news rate (as well as professional news rate, local news rate, etc.) for the chronological and algorithmic timelines: the number of exposures to junk news domains as a percentage of total exposures to tweets with links. Each appearance of a domain in a collected timeline counted as one exposure.
Note that, consistent with previous work such as Bakshy et al. (2015), the denominator in these rates only includes tweets with external links. Also, in most cases, it includes aggregated link exposures for all eight agents in our study—although for RQ2 we also analyze rates for partisan-aggregated agents, as well as for some individual agents. Reporting exposure rates, rather than raw exposure counts, aligns with the “random surfer” framework often used in theoretical analyses of attention on the Internet (Blum et al., 2006; Chebolu & Melsted, 2008). That is, it assumes that each external link exposure has an equal likelihood of producing a click. While attention and navigation are more complicated in the real world, the random surfer model helps identify how categories are likely to be impacted by algorithmic curation, controlling for the overall shift in external link exposures. Future work by the platform itself (or by entities with sufficient data access) may wish to further model the relationship between exposure and click-through rates.
RQ3, Individual Sources
Observing the algorithm’s disproportionate effects on junk news and other categories of news, we then measured how the impact played out for individual sources in different categories, including some professional outlets (e.g., ABC News) and some junk news outlets (e.g., True Pundit). We again scoped the analysis to tweets with external links. After tabulating exposures for each external source in the data, we examined which sources saw the greatest losses and gains in exposure share, among the eight agents in our study. We also measured raw exposure counts to identify some sources that defied overall patterns.
RQ4, NYT News Desks
We finally explored how Twitter’s algorithm affected exposure to different types of news from one professional news source. The NYT was among the most popular sources in both the chronological and algorithmic timelines. It also provides generous archival access through a public API, 4 which allowed us to access all news stories published by the outlet for the duration of data collection. As a baseline for comparison, we collected all articles from the API, published between the first day and the last day of data collection (13 July to 9 August 2020). We also collected all external links tweeted by the @nytimes Twitter account during the same period.
Our analysis measures how opinion articles, political articles, locally focused “metro” articles, and other topics fared on Twitter in chronological and algorithmic timelines. The “news desk” labels from the NYT API (see Note 4) allowed us to label articles from these topics and others (e.g., sports, obituaries, science, and business). We then compared the prevalence of these news desks across (1) the full NYT archive from the API, (2) NYT articles tweeted by the @nytimes Twitter account, (3) NYT articles appearing in chronological timelines, and (4) NYT articles in algorithmic timelines.
Results
RQ1, External Links
One of the most salient effects of Twitter’s timeline curation algorithm was drastically reducing exposure to external links. On average, agents’ chronological timelines contained 50.0 external links per day (out of 100 tweets), compared to 23.3 in the algorithmic timeline (see Figure 3). The effect was consistent, as each of the eight agents experienced reduced exposure to external links regardless of the political affiliation. The agent with the smallest effect saw a decrease from 29.7 external links per day to 25.3 in the algorithmic timeline, while the agent with the largest effect went from 73.3 external links per day to 7.0.

Twitter’s timeline algorithm decreased exposure to external links.
Given the variation in the effect size, we explored which account features may have contributed to the differences. While the baseline differences can be attributed to different link-sharing behavior across the agents’ different networks, we found no other factors that clearly explained the varied reduction rates. The account with the smallest effect also had the fewest number of friends, but otherwise variation showed no clear relationship to baseline link volume, volume of unique links, or partisan affiliation. At the very least, this evidence supports the notion of personalized “curated flows” (Thorson & Wells, 2016), although future work and further data collection may be helpful to understand precisely why some accounts experienced a greater reduction effect than others.
Finding this reduction effect guided our analysis toward exposure rates for different categories of sources (RQ2), different individual sources (RQ3), and different types of news from one professional source (RQ4).
RQ2, Categories of Sources
In both the chronological and algorithmic timelines, professional news sources claimed the most exposures of any category—despite the algorithm decreasing overall exposure. Across the eight agents, professional news outlets saw a 51.4% decrease in average exposures, from 23.9 exposures per day in the chronological timeline to 11.6 in the algorithmic timeline (see Table 2). Junk news outlets saw a 33.0% overall decrease, from 3.5 in the chronological timeline to 2.3 in the algorithmic timeline.
Algorithmic Timelines Decreased External Link Exposures for Both Junk News and Major Professional News Brands.
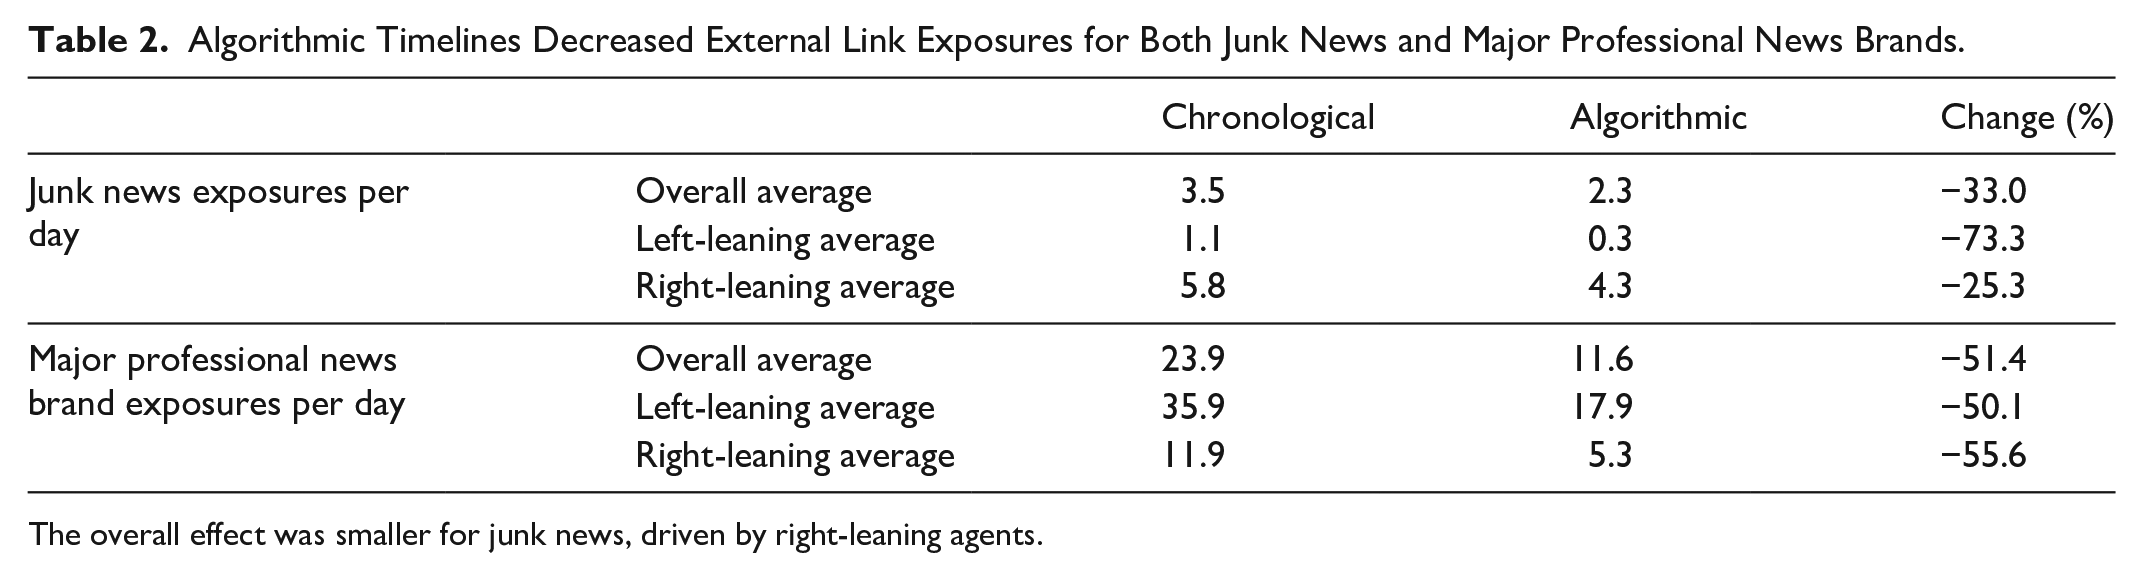
The overall effect was smaller for junk news, driven by right-leaning agents.
On the whole, there was only a slight shift in the proportion of exposures across external media categories, meaning that a random surfer would see roughly the same distribution of categories in their chronological timeline and their algorithmic timeline. Professional news claimed the largest share of exposures in both chronological and algorithmic timelines, with 47.3% and 49.0% of all external links, respectively. Junk news saw an increased share of external links, from 6.9% in chronological timelines to 9.9% in algorithmic timelines, such that a random surfer would see proportionally more junk news in the algorithmic timeline.
We also found notable partisan differences in exposure to junk news sources and major professional news brands. As shown in Table 2, the four agents from right-leaning communities were exposed to more junk news than the four agents from left-leaning communities (5.8 exposures per day vs 1.1 exposures per day in the baseline chronological timelines). Furthermore, one right-leaning agent was responsible for 76% of all junk news exposures. These metrics only pertain to our small sample of eight emulated users over the course of 4 weeks; however, they do corroborate large-scale research suggesting that (1) right-leaning users tend to encounter more junk news and related content, and (2) exposure to such content is highly concentrated (e.g., Grinberg et al., 2019a; Guess et al., 2021).
A sizable portion of exposures (13.7% in chronological timelines, 10.5% in algorithmic timelines) came from “other non-political” domains, but the vast majority of exposures were to politically related links. Table 3 shows how most individual categories experienced fairly subtle changes in exposure share in the algorithmic timeline.
Exposure Share for Different Categories of Sources, in Chronological and Algorithmic Timelines.
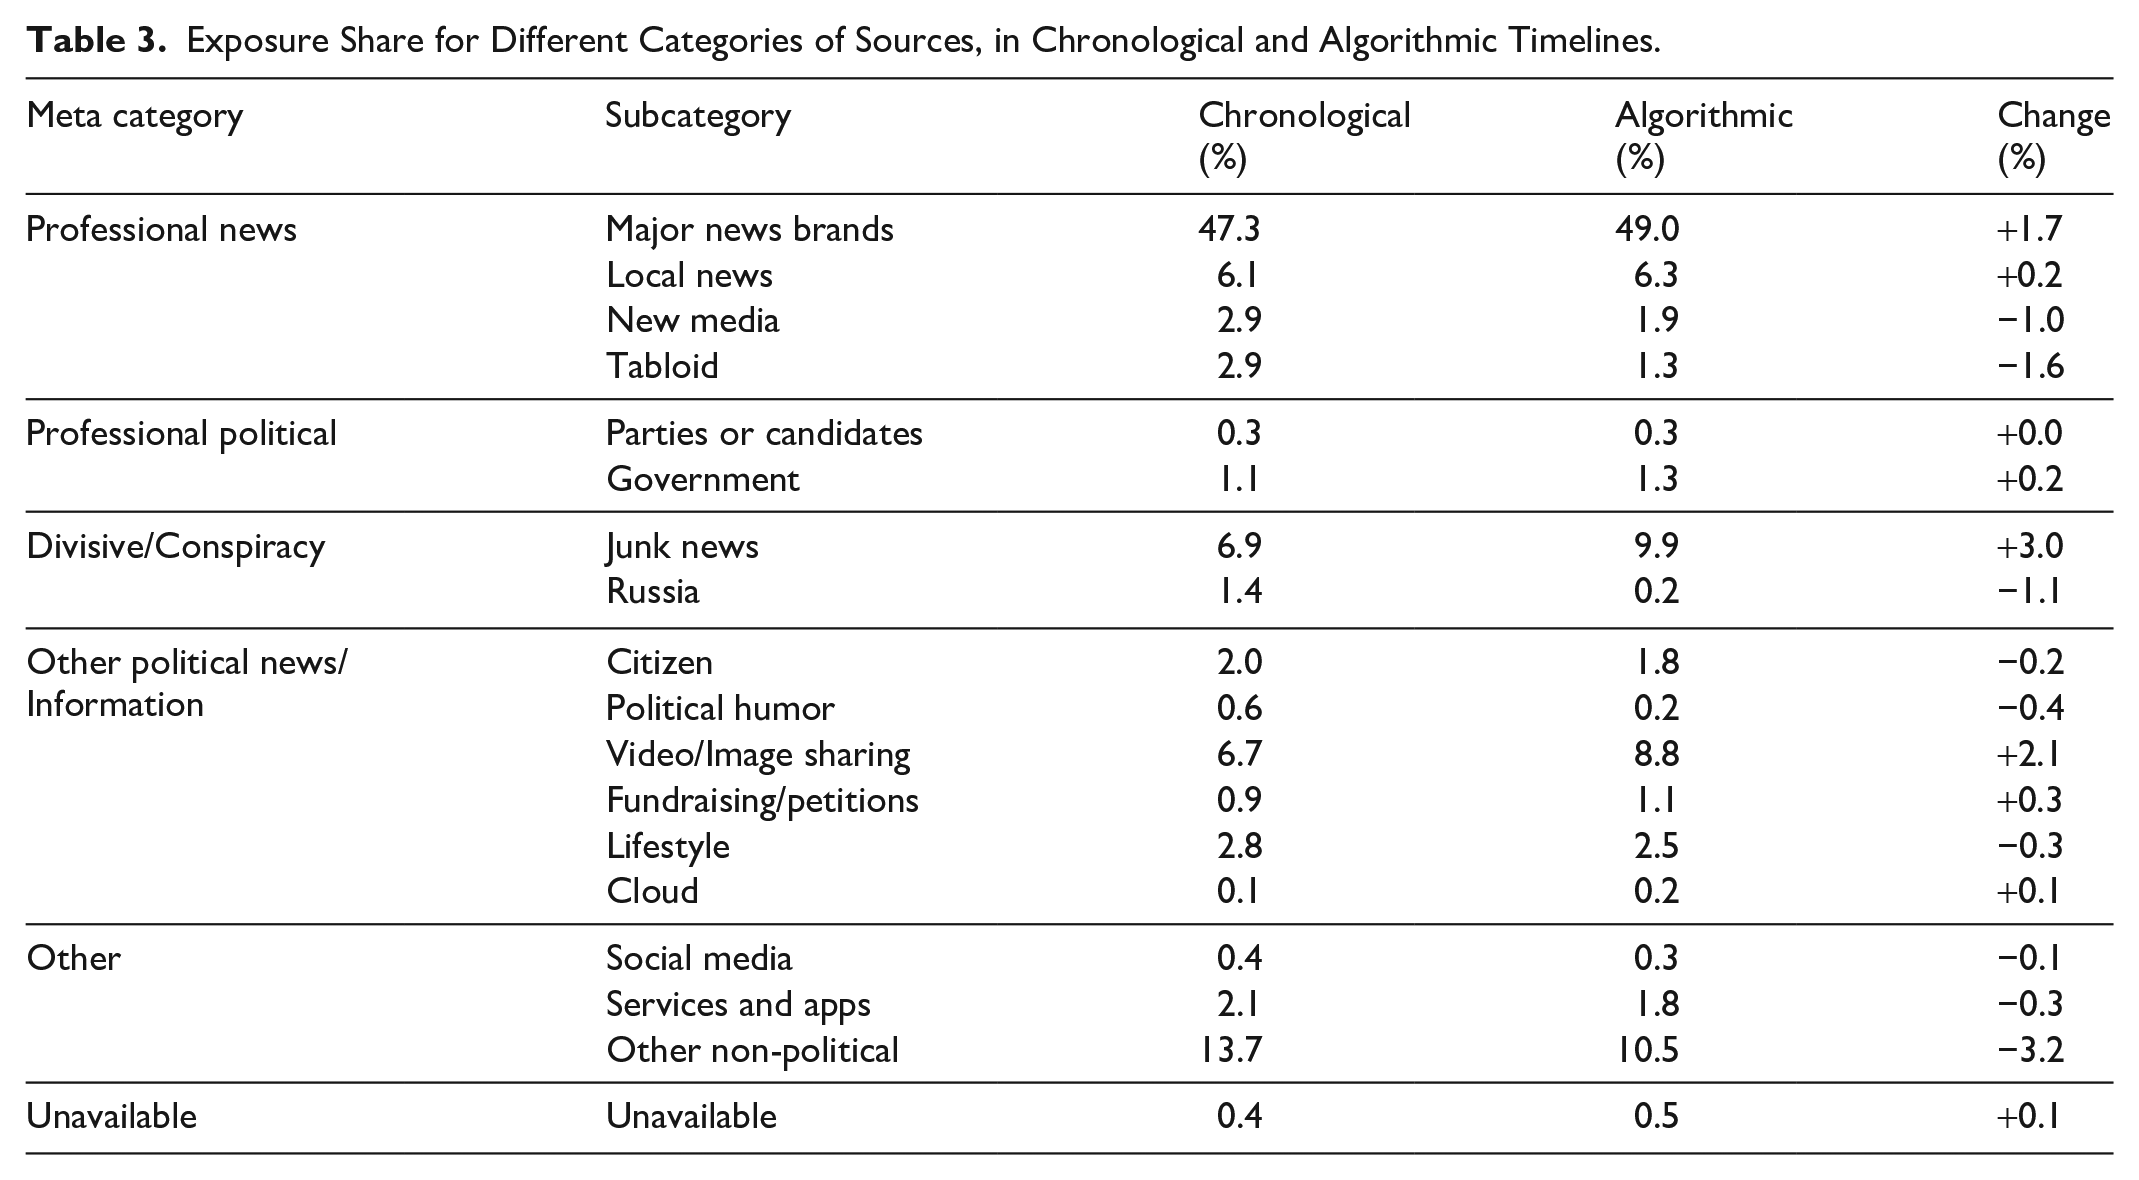
The increased exposure share for junk news is notable and troubling, as it suggests junk news websites were among the greatest benefactors of algorithmic curation. Despite the overall decrease in exposure to external links, junk news websites would receive a greater proportion of web traffic from Twitter’s algorithmic timelines, based on a random surfer model. It is also notable that tabloids, political humor sites, new media sources, and sports sites experienced a decrease in exposure share. The individual source analysis helps to further illuminate these shifts.
RQ3, Individual Sources
Most domains (55.1%, N = 685) experienced a decrease in exposure share in the algorithmic timeline, 39.1% (N = 487) experienced negligible change, and 5.7% (N = 72) experienced an increase of at least +0.1%. Table 4 shows the 10 domains with the greatest increase in exposure share, with two major news brands leading the way. Notably, one of these sources (the NYT) uses an internal algorithm, “Blossom,” to predict social media engagement for different articles (Napoli, 2015). This strategy may help explain why the Times gained exposure share, even though most sources (including many professional news sources) lost exposure share.
The 10 Sources that Experienced the Greatest Increase in Exposure Share from the Chronological to the Algorithmic Timeline.
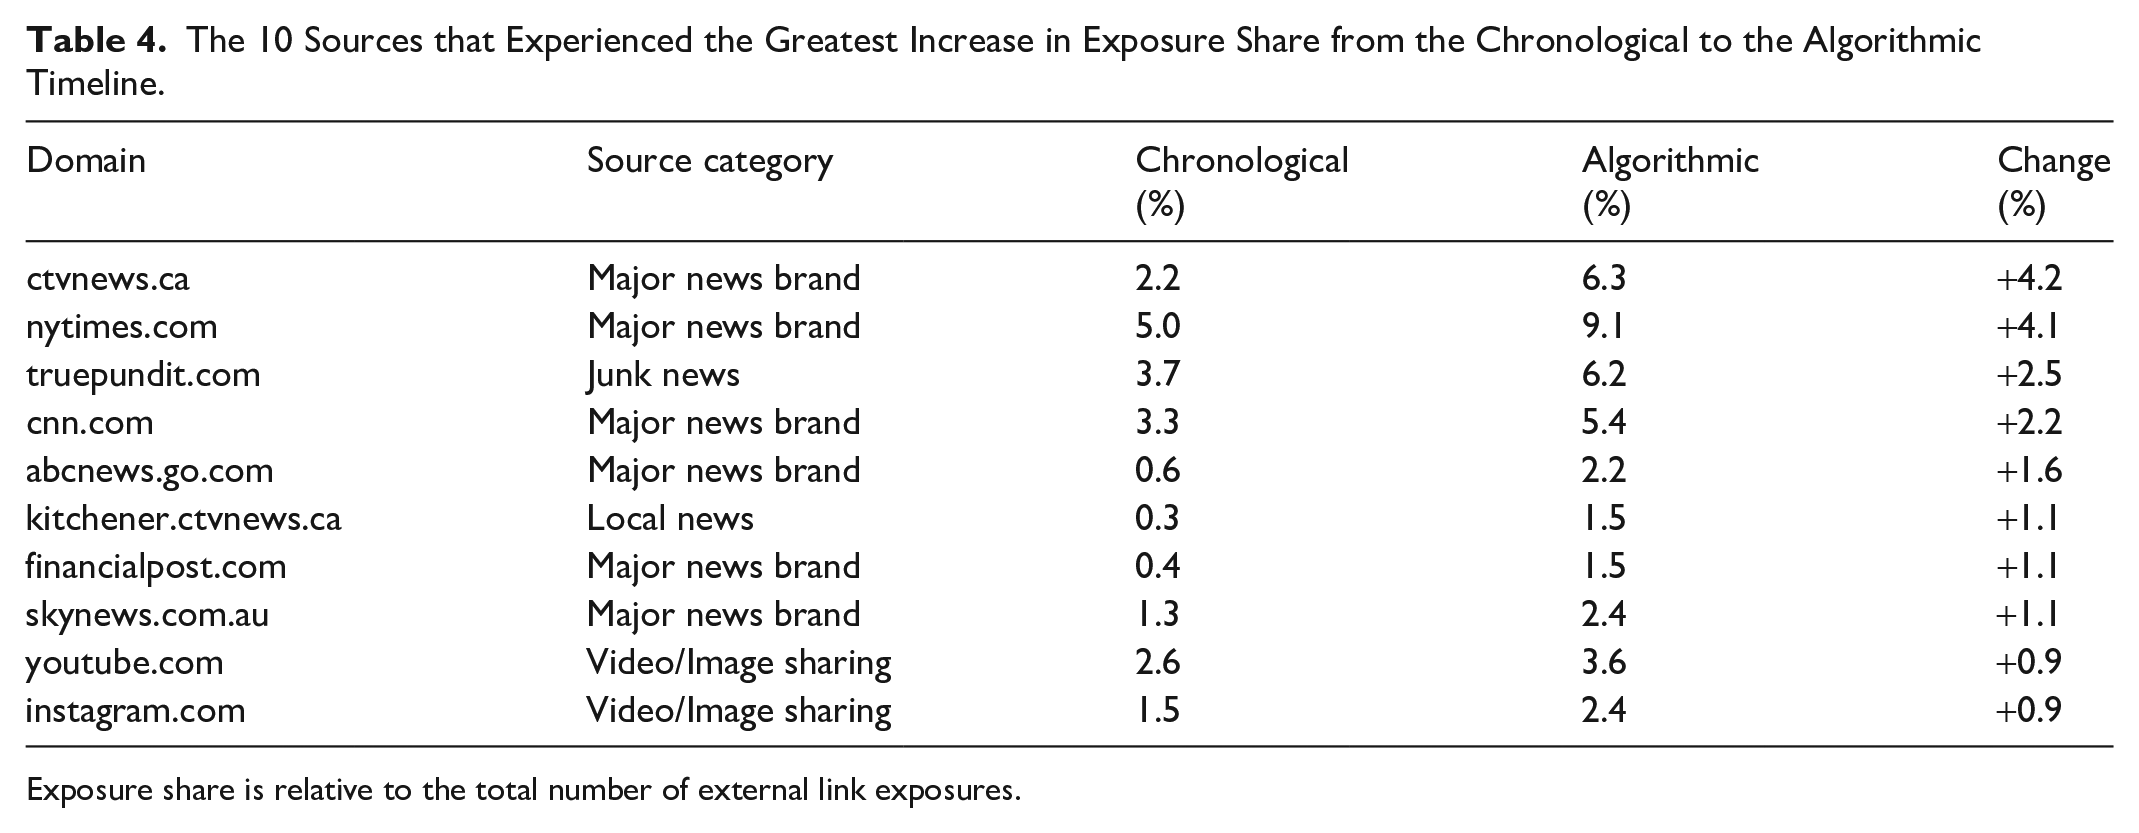
Exposure share is relative to the total number of external link exposures.
While some professional and local news sources gained exposure share, these rates also suggest a slight proportional amplification of junk news. The website truepundit.com was labeled as junk news by Bradshaw et al. and confirmed this classification on Media Bias 5 and through our own review (it did not meet professionalism standards, used clickbait-style headlines and significant partisan signaling, and failed to provide sources and fact-checks). Twitter’s curation algorithm increased the share of links to the website in the algorithmic timeline; however, only two of the eight users in our sample were exposed to the site.
While some junk news sources gained exposure share in the algorithmic timeline, we also analyzed domains that lost exposure share, shown in Table 5. Notably, 7 of the 10 domains with the greatest losses were major, professional news sources. In addition, the tabloid nydailynews.com lost exposure share, as did broadwayworld.com, a website with theater-related news. Russia’s government-funded rt.com, associated with a corresponding television channel, also experienced a decrease. Bradshaw et al. labeled the source as divisive and conspiracy, and Media Bias rates it as questionable 6 due to propaganda and conspiracies. See Helmus (2018) for an in-depth discussion.
The 10 Sources that Experienced the Greatest Decrease in Exposure Share.
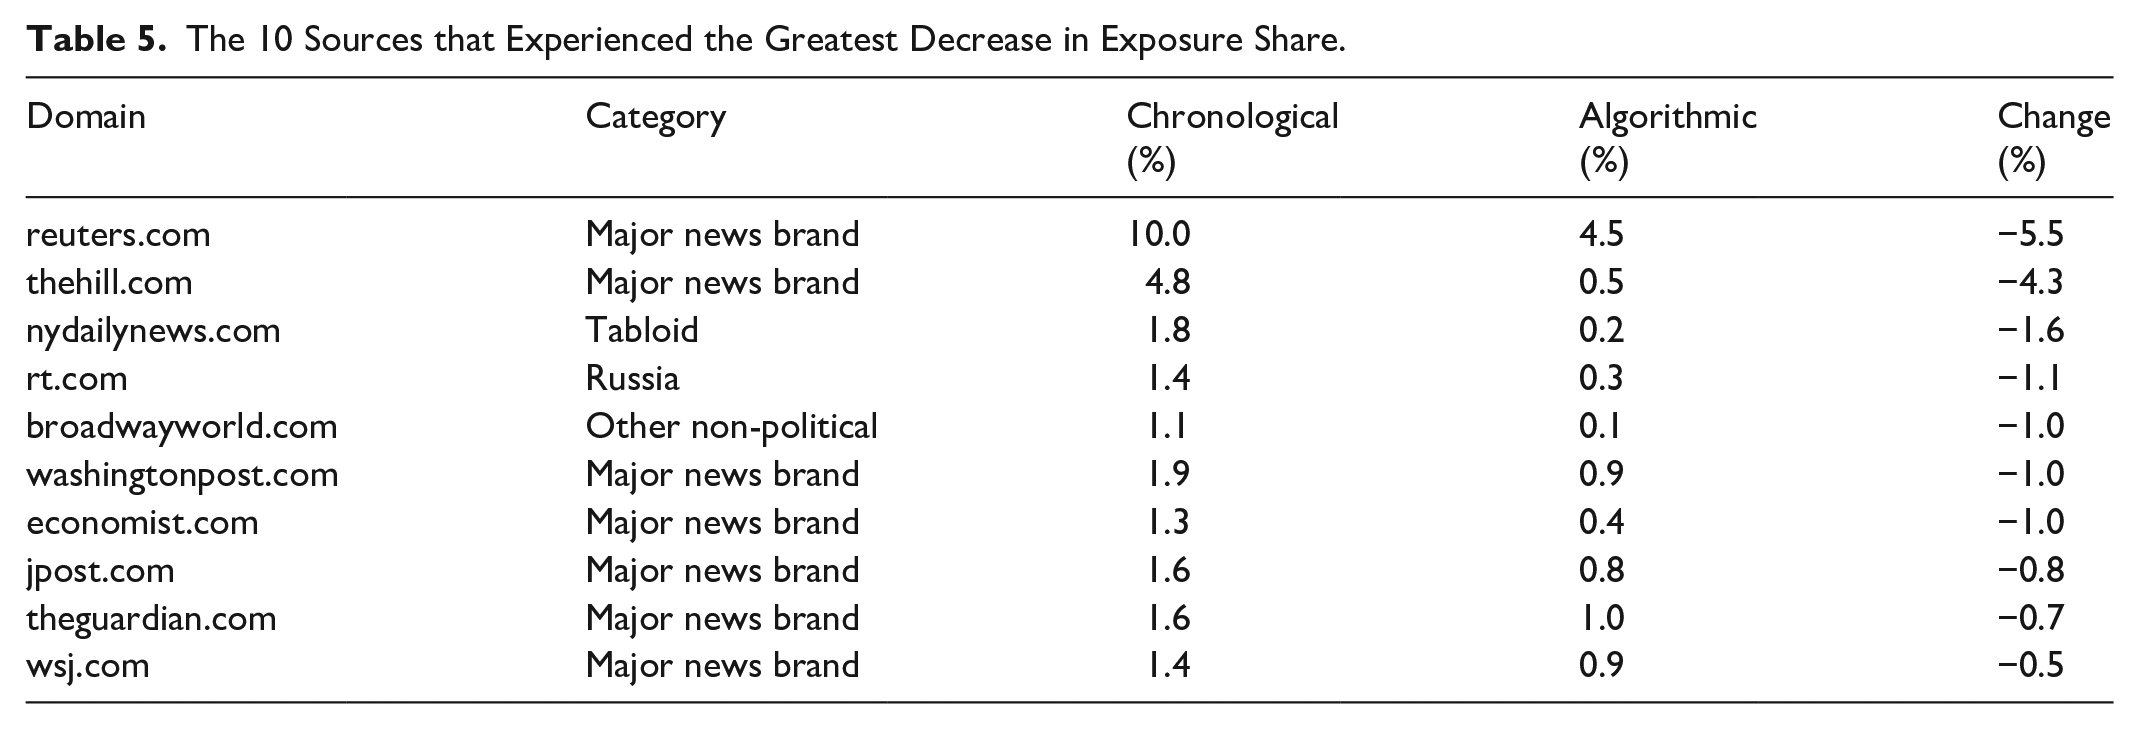
Some of the lost exposure share for professional outlets may be explained by the high volume of news tweets. For example, Reuters’ Twitter account publishes many tweets with links to the latest stories from their newswire. Twitter’s curation algorithm diversifies content in the timeline (Twitter, 2021), and accounts that share content in high volumes threaten homogenization; thus, the algorithm seems to dilute them with other sources. Notably, Reuters went from receiving the most attention of any domain in the chronological timelines, to receiving the fifth most attention of any domain in the algorithmic timelines, leapfrogged by the NYT (first), CTV News (second), True Pundit (third), and CNN (fourth). Reuters’ ranking remained high, meaning that Twitter’s algorithm generally preserved the distribution of attention compared to the chronological timeline; however, the effect was inequitable.
The last part of individual source analysis was motivated by the notion of “strategic amplification” (Donovan & boyd, 2019), which suggests that amplified content matters as much as (if not more than) “silenced” content. We thus explored junk news websites, adult websites, and citizen news websites which gained exposure in the algorithmic timeline, shown in Table 6.
Junk News, Adult, and Citizen News Websites Which Gained Exposures in the Algorithmic Timeline.

In addition to six junk news websites, the two amplified citizen websites (bongino.com and waynedupree.com) feature hyper-partisan content from amateur commentators. While they did not meet the junk news criteria in our review, both are considered “questionable sources” by Media Bias 8 due to conspiracy theories, poor sourcing, and failed fact-checks. Twitter’s curation algorithm also increased exposure to two adult websites with pornographic content, onlyfans.com (see Note 7) and nudiez.tv. Together, Twitter’s curation algorithm allotted 18 exposures to the adult sites, compared to just one exposure in the chronological timeline. This presents a potential conflict with Twitter’s sensitive media policy, 9 which states that “you can’t include violent, hateful, or adult content within areas that are highly visible on Twitter.”
RQ4, NYT News Desks
Finally, we analyzed exposure specifically to external links to the NYT to glimpse how Twitter’s algorithm treats different types of news (i.e., news desks) produced by one high-quality, professional news outlet. Returning to the random surfer model, where each exposure to the Times is equally likely to produce a click, a few news desks made notable gains from overall publication rates to tweet rates by @nytimes to exposure rates in algorithmic timelines. See Table 7, which includes metrics for all news desks that published more than 100 stories during the data collection period.
Share of Stories by News Desks in all Stories Published by the New York Times, All Stories Tweeted by the @nytimes Account, and all Stories that Appeared in Agents’ Timelines.

Includes metrics for all news desks that published more than 100 stories during the data collection period.
One high-level pattern in our data was increased exposure to “soft news” (Reinemann et al., 2012) from the culture, sports, styles, metro, and weekend news desks of the Times. The algorithm also increased exposure share to the NYTNow news desk, which publishes “briefing” articles that summarize the day’s news. On the contrary, “straight news” tended to lose exposure, with the politics, national, science, and business news desks seeing decreased exposure share in the algorithmic timelines. While each agent in our study encountered the Times, 89% of exposures were among left-leaning agents. Thus, left-leaning agents largely drove the patterns observed in addressing RQ4. This aligns with prior work showing the Times is more popular and more trusted among left-leaning users than right-leaning users (e.g., Flaxman et al., 2016; Jurkowitz et al., 2020; Robertson et al., 2018).
Two news desks (Washington and foreign) provided notable exceptions to the soft news pattern. The Washington news desk published 340 articles, generally focused on the White House and the Supreme Court, with 133 mentioning “Trump” in the headline. The Times tweeted these articles at a higher rate than they published them (7.3% of tweeted articles vs 5.8% of published articles), and the algorithmic timeline provided them exposures at an even higher rate (8.9% of all Times exposures). The increase may reflect Twitter users’ tendency to be more politically engaged than the general population (Wojcik & Hughes, 2019).
Showing similar gains to the Washington news desk, the foreign news desk claimed 8.0% (463) of the Times’ published articles and 19.1% (521) of their tweeted articles. Twitter’s algorithm increased exposure share for these articles, from 8.0% in chronological timelines to 11.2% in algorithmic timelines. We initially suspected this was due to the pandemic news cycle. However, while coronavirus was often mentioned in headlines from the Foreign desk (N = 39), the pandemic did not at all dominate coverage. Also, the stories covered a variety of international locations, including China (N = 22), the United Kingdom (N = 21), Hong Kong (18), Russia (N = 17), and Brazil (N = 8). Although fully explaining these patterns is outside the scope of the current work, one possibility is that if many Twitter users following @nytimes live outside the United States, the Times may use this account to share international news stories, leaving domestic news for other scoped accounts (e.g., @nytpolitics, @nytopinion).
Discussion
This work explored how Twitter’s timeline algorithm shifts end users’ exposure to external media. We first found that algorithmic timelines surfaced external links at roughly half the rate of the chronological timeline (RQ1). Despite this drastic decrease, the proportional distribution of source categories remained fairly stable (RQ2), such that a “random surfer” would encounter a similar distribution of source categories whether browsing a chronological or algorithmic timeline. One notable shift was that the algorithm slightly increased exposure rates to junk news sources, particularly among right-leaning agents. In analyzing individual sources (RQ3), we found that most (55.1%) experienced decreased exposure share. Sources that gained exposure share included some major news brands (e.g., CNN, NYT, ABC News) and also junk news websites, amateur citizen sources, and adult websites. Finally, exploring how Twitter’s algorithm affected different types of news from one professional news outlet (RQ4), we found a general pattern that benefited “softer” news desks from the NYT, mostly driven by left-leaning agents.
Overall, while our evidence is not entirely damning of Twitter’s algorithm, it does suggest that the algorithm plays a supporting role in creating what is perceived as “a worse mix of news” (Shearer & Grieco, 2019) for users. Below, we discuss some potential ramifications of our observations (particularly when considered at scale) while also noting that our evidence characterizes Twitter’s algorithm as having a fairly subtle proportional effect on media exposure for end users. This adds to existing evidence that social media algorithms may not be the main culprit of online harms. Researchers and regulators should consider algorithms as part of a complex sociotechnical system, which includes upstream factors that shape the algorithm’s input. Before discussing these implications, it is first important to note some limitations of our work.
Limitations
Some limitations of this work stem from our choice of methods and analytical framework. To analyze media quality, we relied on a previously developed typology for classifying news sources. Although the typology provided effective proxies for quality (i.e., junk news sources as low-quality, major professional news sources as high-quality), it also created some gray area and potential for misclassification. The work of Bennett and Livingston (2020) even suggests that junk news and similar content evolved from the deteriorating quality of some news published by “professional” news brands. Although RQ4 analyzes different sections of one major news brand, the rest of our findings are based on each source belonging to just one category of news. More granular analyses might instead assign categories to individual sections, authors, or articles, leading to further insights about the networked flow of high-quality and low-quality news.
This work is also limited by ecological validity, on several fronts. First, while the experimental methods allowed us to control many factors in data collection, it limited our findings to a small sample of agents simulating “typical” users. Also, the pool from which we identified users was non-representative, as all of them followed US congresspeople. This initial pool and the random subsample focused our analysis on accounts engaged in US news and politics, making the resulting archetypes typical accounts within the same population. It also means the accounts may have been atypical in terms of the entire universe of Twitter users, potentially causing Twitter’s algorithm to behave atypically. A larger sample of real-world users would help to identify the extent of the effects we observed, exploring a wider range of cases over a longer period of time. Alternative sampling strategies might further explore archetype users in pockets of the network where junk news proliferates (Grinberg et al., 2019a). Finally, the agents did not emulate any dynamic behavior, such as clicking links or liking tweets, although such behavior is known to affect the timeline algorithm (Twitter, 2021). Thus, our results help characterize the timeline algorithm “out of the box,” without personalization, but this further limits the results’ applicability to real-world settings, making user behavior an important dimension to consider simulating in future agent-based auditing work.
One way to establish ecological validity for our findings would involve Twitter sharing more data related to exposure. The questions addressed in this work could help meaningfully orient and inform a transparency policy which platforms could use to share data: What proportion of tweets in algorithmic timelines contain external links? What proportion of these links points to junk news sources and other low-quality media? What proportion points to professional news outlets? What would these proportions look like without algorithmic curation? Twitter could also provide data in ways that allow the academic community to conduct further research. In the absence of more transparency from Twitter, one promising path forward is to conduct audits similar to this work, but use crowdsourcing to collect real-world exposure data from a sample of real-world users. The Markup has embarked on a project called “Citizen Browser” that does just that (The Markup, 2020), using a nationally representative panel of 1,200 people. The Markup’s early findings help demonstrate the importance of further researching this topic to better understand the ramifications of algorithmic curation.
Clarifying the Algorithm’s Effect
Our study describes two effects of Twitter’s algorithm that carry important implications. First, as the largest effect observed, the algorithmic timeline exposed agents to external links at roughly half the rate of the chronological timeline. This effect is troubling given that 70% of Twitter users report using the platform to get news (Shearer & Matsa, 2018)—but in the algorithmic timeline, these users could see half as many links to professional news sources including major news brands, local news, and new media outlets. While the algorithm had a more subtle effect on the proportional makeup of source exposure, the overall reduction in links remains concerning.
The effect may stem from the algorithm’s aim to deliver users the content they are “likely to care about most” (Twitter, 2021). But if the algorithm emphasizes content from within the platform, it may disrupt users’ ability to distribute and encounter external content they care about, including the journalistic media that many users seek from Twitter (Shearer & Matsa, 2018). In short, the reduced link exposure suggests that Twitter’s algorithm may impede users’ goal of retrieving news on the platform. While news may still circulate in the absence of external links, the reduced connections to the provenance of information in credible primary sources could hinder users’ ability to assess information quality. As a result, the reduced link exposure may also impede the goal of journalistic institutions, “to provide citizens with the information they need to make the best possible decisions about their lives, their communities, their societies, and their governments” (American Press Institute, 2020).
The second effect with important implications involved exposure to junk news sources. The algorithm slightly increased the proportional exposure, although total exposures decreased due to the overall reduction in external links. In terms of partisanship, we also found that junk news exposures were more common among right-leaning agents. The timeline algorithm somewhat amplified the difference by only slightly reducing junk news exposure for right-leaning agents, from 5.8 to 4.3 exposures per day (a 25.3% decrease). The algorithm could more effectively combat junk news (while maintaining exposure to quality news) by maintaining the volume of external links but specifically reducing the proportion of junk news. The total daily exposures may seem relatively small, but they become more significant when considered at Twitter’s scale and over long periods of time. Two or three daily exposures to junk news sources amount to hundreds of junk news exposures over the course of a year, with compounding effects. Experiments suggest that users become more susceptible to misinformation over time, unless given an “inoculation” (Maertens et al., 2020). Still, junk news surfaced in both chronological and algorithmic timelines, so it is important to consider Twitter’s algorithm in the context of upstream factors that lead to junk news exposures.
Clarifying the Algorithm’s Context
With the exception of significantly reducing external links in the timeline, our analysis suggests that Twitter’s algorithm has fairly subtle effects on media exposure for different categories of sources, different individual sources, and different types of news from one source. Our study is not the first to suggest that algorithms play only a supporting role in media dissemination and related phenomena of extremism, misinformation, and polarization. In their large-scale study of the Facebook News Feed, Bakshy et al. (2015) found that Facebook’s algorithm only slightly exacerbated partisan echo chambers on the platform, compared to the effect of users’ friends and click behavior. Haim et al. (2018) found a negligible “echo chamber” effect from Google’s personalization algorithm. Similarly, Vosoughi et al. (2018) found that algorithms spread true and false information at equal rates, and false news spread faster because people were more likely to share it, not algorithms. Our data support the notion that algorithms exacerbate underlying problems—that the “worse mix of news” perceived by users (Shearer & Grieco, 2019) results not only from algorithms but also from upstream factors.
While algorithms deserve further scrutiny, especially in terms of reducing external link exposure, researchers and regulators should continue addressing algorithms within the context of broader complex sociotechnical systems. Concretely, while it is a real issue (and a promising point for intervention) that Twitter’s algorithm slightly increased the overall junk news exposure rate from 6.9% to 9.9%, future work should also address the various factors that create such an underlying volume of junk news to feed as input to the algorithm. Taking this systems-based perspective, the algorithm may sit within a broader feedback loop, receiving input from upstream factors and systems related to individual cognition (e.g., motivated reasoning and media literacy), social contexts (e.g., groups and communities), and structural incentives (e.g., business models and platform affordances). Much work also remains to improve algorithms themselves, as the Twitter algorithm could be adjusted to systematically decrease attention to junk news. For instance, part of this may involve accounting for selective exposure effects and other factors that impact engagement metrics and sometimes push junk news into algorithmic timelines. In addition to any technical changes, the most promising interventions will also address upstream factors within the feedback loop.
Conclusion
In conclusion, this study provides empirical evidence of how Twitter’s timeline algorithm subtly shifts end users’ exposure to external media, particularly in terms of external source quality. Overall, we found a notable reduction in exposure to external links, but only slight changes in the proportional makeup of these links (in terms of source categories, individual sources, and different types of news from a single source). While Twitter’s algorithm may be somewhat implicated in disseminating junk news and other low-quality media, our evidence suggests that it is not the main culprit. That is, proportionally, the algorithm appears to only slightly worsen the quality of media compared to its upstream input, and it should therefore be addressed as part of a broader feedback loop influencing the media ecosystem.
Footnotes
Appendix
The five criteria used by Bradshaw et al. to classify junk news sources.

| Professional News | Junk News | |
|---|---|---|
| Professionalism | Provides names and contact information for authors, editors, and owners. Publishes corrections | Provides generic or made-up names. Withholds contact information. Does not publish corrections |
| Style | Uses clear and descriptive language in headlines and text. Presents accurate and informative imagery | Uses emotive expressions and symbolism, ad hominem attacks, exaggeration, excessive capitalization, logical fallacies, and other manipulative techniques |
| Counterfeit | Uses original branding, including its name, logo, and other aesthetic elements such as color | Mimics the aesthetic of legitimate news organizations with counterfeited fonts, branding, content strategies, and other techniques to feign legitimacy |
| Bias | Takes measures to present and contextualize multiple perspectives | Publishes opinion pieces as news. Uses hyper-partisan framing |
| Credibility | Consults and vets multiple sources, checks facts, and avoids debunked information and conspiracies | Presents claims without proper sourcing practices such as vetting and fact-checking |
Domains meeting at least three of the five criteria are considered junk news.
Acknowledgements
The authors thank the Social Science Research Council and participants in the “News Quality in the Platform Era” workshop for their feedback on an early draft of this paper. We especially thank Johanna Dunaway, Efrat Nechushtai, and Emily Vraga for their constructive feedback.
Declaration of Conflicting Interests
The author(s) declared no potential conflicts of interest with respect to the research, authorship, and/or publication of this article.
Funding
The author(s) disclosed receipt of the following financial support for the research, authorship, and/or publication of this article: This work was supported by NSF grant, Award IIS-1717330