
Abstract
Since changing its algorithm in January 2018 to boost the content of family and friends over other content (including news), Facebook has signaled that it is less interested in news. However, the field is still trying to understand the long-term impacts of this change for news publishers. This is a problem because policymakers and legislators across the world are becoming concerned about the relationship between platforms and publishers. In particular, there are worries that platforms’ ability to make unilateral decisions about how their algorithms operate may harm the economic sustainability of journalism. This article provides some clarity around the relationship between these two parties through a longitudinal study of the Australian news media sector’s relationship with Facebook from 2014 to 2020, with a particular focus on the January 2018 algorithm change. We do this by analyzing Facebook data (2,082,804 posts from CrowdTangle) and external traffic data from 32 major Australian news outlets. These data are contextualized by additional desk research. We identify a range of trends including the decline of news sharing, the collapse in the performance of “social news,” the variable position of social media as a source of referral traffic, and, most critically, the diffused nature of the 2018 algorithm change. Our approach cannot make direct causal inferences. We can only identify trends in on-platform performance and referral traffic, which we then contextualize with industry reportage. However, the data provide vital longitudinal insights into the performance and responses of individual media outlets, news categories, and the Australian media sector as a whole during a critical moment of algorithmic change.
The ability of social media platforms to independently adjust their recommender systems and preference certain types of content over others has been an issue of ongoing concern, particularly in regards to news. Governments, policymakers, researchers, and journalists have worried about the extent to which these platforms can shape public discourse on the platform, and whether metrics influence how journalism is produced (Tandoc, 2014). This has been a prominent narrative since empirical research revealed that platforms were starting to have an outsized influence on news distribution and journalism practice (E. Bell & Owen, 2017; Rashidian et al., 2018). Commentators and scholars have also paid a lot of attention to Facebook, which became one of the dominant online distributors of news content during the 2010s (E. Bell & Owen, 2017; Myllylahti, 2018). However, this relationship has recently undergone a period of significant change. News organizations are now turning away from social media in favor of reader-focused business strategies (Meese & Hurcombe, 2020; Rashidian et al., 2018). Facebook has changed its algorithm to show more content from family and friends, and governments are introducing new regulatory frameworks to manage the relationship between these two parties (Flew & Wilding, 2021; Meese, 2020). One reason why Facebook has attempted to distance itself from news content is because of growing concerns about the ability of misinformation and disinformation to spread widely across the platform (Benkler et al., 2018). Facebook has even considered reducing the visibility of “political content” (K. Bell, 2021), following reports that the platform was used to spread misinformation in the lead up to the insurrection of the US Capitol building on 6 January 2021 (Gilbert, 2021). These developments require scholars to take another look at the relationship between these two sectors.
Our article takes a step toward this goal by, first, assessing how the Australian media industry performed 1 on Facebook from 2014 to 2020 and, second, assessing the impact of Facebook 2018 algorithm changes on the Australia media industry. We do this by analyzing Facebook data from CrowdTangle and external traffic data. As noted earlier, Facebook has made several changes to its algorithm related to the distribution of news. In late-2017, the News Feed was changed to demote clickbait (content which withholds information from people to encourage them to click) (Facebook, 2017b) and what Facebook defines as engagement bait (exhortations to “like this post”), impacting news organizations who had previously used these strategies (Facebook, 2017a). Another change occurred in January 2018 when Facebook (2020) reduced “audience exposure to public content from all Pages, including news” in favor of posts from family and friends (p. 10). This saw the platform pivot away from content distribution and return to its roots as a social network. As a result of these changes, some news organizations reported a loss of audience traffic to their sites and lower engagement on their posts (Samios, 2018). The period also comes just after the famed “pivot to video.” There is no clear starting date for this trend, but early adopters invested into video production around 2015 (Tandoc & Maitra, 2018). The peak was around 2017 with the collapse of this strategy coming shortly after in 2018 (see Willens, 2018). The dataset does not encompass the brief period in February 2021 when Facebook banned news in Australia, but we contextualize our results in relation to these more recent developments.
Our analysis allows us to see how the Australia news media responded to these changes. The addition of audience traffic data also allows us to see if news organizations turned to Google as an alternate distributor, following Facebook’s algorithm changes. While our study cannot attribute causal inferences between algorithmic changes and the activities of news media outlets, our findings allow us to identify whole-of-sector trends and map future potential research sites. It also offers a much-needed empirical perspective on this period of transition by showing how a national media sector engaged with digital platforms during a critical moment of change. There are limitations to “big data” studies (boyd & Crawford, 2012; Puschmann, 2019), so we also refer to our qualitative research (Meese & Hurcombe, 2020) and desk research on occasion to provide further context to our findings. However, we argue that there is value in attempting to discern patterns across an entire sector. Even though many of these developments, such as the famed pivot to video (and the subsequent abandonment of the format) are common knowledge in the industry (Tandoc & Maitra, 2018), it is useful to understand how developments played out in specific countries and explore how different news categories and even individual mastheads reacted.
The article proceeds as follows. We begin by situating our study in relation to existing work, which focuses on the relationship between platforms and journalism before offering a brief overview of the Australian news industry and its engagement with digital media. We then outline our methods, which include using CrowdTangle to query Page engagement data over time, before detailing our findings. We conclude the article with a discussion of what our findings tell us about the future of news on Facebook.
Platform Data, CrowdTangle, and Approaching Journalism Institutionally
Journalism scholars regularly base research projects on platform data with much of this work examining how social media platforms have changed journalism (Lewis & Molyneux, 2018). One prominent research agenda draws on such data to explore how the distribution of news on social media has impacted long-standing journalistic values and editorial decision-making. Notable examples include Al-Rawi’s (2019) and Harcup and O’Neill’s (2017) study of news values on social media, as well as Bastos’ (2015) exploration of what news is deemed to be of public interest and what actually garners public attention on specific platforms. Other contributions use platform application programming interfaces (APIs) to examine on-platform interactions and explore how individuals engage with the Facebook Pages of media organizations (Hille & Bakker, 2014; Larsson, 2018). Work has also been conducted on the publishing, distribution, and consumption of news and commentary on Twitter (particularly in reference to politics), a development partially due to the access provided via the Twitter API (Hermida, 2013).
In addition to the above research, an adjacent body of qualitative research also focuses on similar issues. These scholars are largely interested in how journalists have adapted to the emergence of metrics within newsrooms (Anderson, 2011; Bunce, 2019; Tandoc, 2014). The work of Sacco and Bossio (2017) and Hanusch (2017) is of particular relevance to this study as they have both conducted qualitative research in the Australian media sector. Hanusch (2017) has identified “the emergence of more specialized decision-making in relation to newsrooms’ activities on different digital platforms” (p. 1581). Sacco and Bossio (2017) have found that while social media is generally well-integrated in the newsroom, “media management policy sometimes clashed with the individual professional expectations of journalists” (p. 189).
Despite this wealth of research into newsrooms, scholarship that explores the broader institutional impacts of social media platforms on journalism is only starting to emerge. As Kleis Nielsen and Ganter (2018) point out, the existing journalism literature “has less to say about how news media adapt to the wider, ongoing, transformation of the environment in which they operate” (p. 1604). Our article contributes to this research agenda but takes a different methodological approach. Large datasets allow us to examine these structural relationships at scale. While this approach cannot delve into the nuances of specific decisions around distribution and posting, it allows us to see how an entire national media sector has interacted with Facebook, one of the most dominant sites for online news distribution in recent years.
In other words, our dataset provides a longitudinal perspective on institutional relationships. Instead of focusing on how individual outlets have interacted with the platform, we explore how different news institutions, from the public service media to print-centric media companies, have performed over time. This approach allows us to account for “path dependencies,” from the historical development of specific news categories to more recent social strategies (Bannerman & Haggart, 2015). Through this, we see how paths that institutions have taken can both shape and constrain future decision-making. Viewing news institutionally can also help us identify “critical junctures.” These are “moments of significant change that drive institutions from one ‘path’ to another” (Bannerman & Haggart, 2015, p. 8). We focus on the January 2018 algorithm change and consider whether this moment was one such juncture for the Australian news sector.
Before continuing, it is worth providing a brief background to the Australian sector and relevant media consumption habits. The provision of news online has diversified what has been a heavily concentrated media sector (Noam, 2016). Since 1987, metropolitan news provision in Australia was largely left to two major newspaper organizations (News Corporation and Fairfax, now part of Nine) and three commercial television stations (Seven, Nine, and Ten). However, the emergence of the Internet saw some new players enter the market. The most notable early entrant was online site Crikey, which was launched as an outlet for political and corporate gossip in 2000, gradually professionalizing over time. This trend has become more pronounced over the last decade, and Australia has seen various international publishers setting up local offices (Guardian Australia, Daily Mail Australia, and The New York Times), 2 the emergence of various digital native (Brisbane Times) and social news sites (BuzzFeed, Mamamia, Junkee), as well as the launch of a new print publication (The Saturday Paper).
Both long-standing publications and these new entrants have embraced social media as a method of news distribution, and Australians have turned to it as a source of news. The University of Canberra’s Digital News Report 2020 shows that more people use social media to access news (37%) than brand websites or apps (31%) (Park et al., 2020, p. 61). The global report confirms this trend, revealing that “just over a quarter (28%) prefer to start their news journeys with a website or app” and that 72% of consumers access news from the “side door” (Newman, 2020, p. 24) rather than going directly to a website. However, this trend in news consumption needs to be qualified. In Australia, there is still a preference for accessing news through websites from Generation X onwards (Park et al., 2020). While internationally, accessing news through social media is more pronounced in Generation Z (Newman, 2020, p. 24), there is still a latent group of consumers who access news websites directly.
The other important factor to note is that various issues related to algorithmic distribution have been canvassed through the Australian Competition & Consumer Commission’s (ACCC) Digital Platforms Inquiry. It has sparked a prominent debate across media and technology sectors in Australia; so, these data have been collected during a particularly sensitive time, when publishers have been particularly introspective about their use of social media (Meese & Hurcombe, 2020). The ACCC released a final report featuring analyses based on confidential data from media companies and social media platforms. However, the inquiry has not provided a detailed public-facing analysis of their online data (Flew & Wilding, 2021). The News Media Bargaining Code, which tried to get Facebook and Google pay for Australian news content, came out of this policy process. While Google began to make some deals with media companies, Facebook (2021) responded by preventing Australian users from viewing local or international news and wiping the Pages of Australian news outlets for a week. News has returned to Facebook for the moment, but the long-term future of Australian news on the platform is unclear at the time of writing. As a result, this study provides an important historical perspective while also offering some insight into the potential impacts of any future bans.
Methods
We began by constructing a sample of 32 national and metropolitan news organizations. It consisted of Australia’s public service media organizations (ABC and SBS), major News Corporation newspapers and online sites (Daily Telegraph, Herald Sun, Courier Mail, Adelaide Advertiser, The Australian, The NT News, news.com.au), Nine Entertainment newspapers and online sites (Australian Financial Review, The Sydney Morning Herald, Brisbane Times, The Age, nine.com.au, WAToday, Pedestrian), newer websites (BuzzFeed Australia, Junkee, Mamamia, The New Daily), significant publications outside the Nine-News Corporation oligopoly (The Guardian Australia, Daily Mail Australia, The West Australian, The Canberra Times, Crikey, New Matilda, Huffington Post AU), television news outlets (Seven, Nine, Ten), and popular morning news shows (Sunrise, Today). While Canberra and Hobart are more accurately defined as regional media outlets with respect to audience size, Canberra’s newspaper (the Canberra Times) was included because the paper is based in the Australian capital and is nationally significant. The Mercury in Hobart was excluded for reasons of size. We specifically selected two smaller but mature digital outlets to gain a sense of how small publishers were reacting to these changes (Crikey and New Matilda). 3
In order to get a better understanding of how news business models were affected, we split the sample into categories for further analysis. Companies that were predominantly online were categorized as Digital Native (Brisbane Times, The Guardian Australia, WA Today, The Canberra Times, Crikey, Daily Mail Australia, New Matilda, Huffington Post AU, The New Daily, nine.com.au, news.com.au); companies that still published newspapers in Australia were categorized as Print (Daily Telegraph, Herald Sun, Courier Mail, Adelaide Advertiser, The Australian, The NT News, Australian Financial Review, The West Australian, The Sydney Morning Herald; The Age); publicly funded organizations were categorized as public service media (ABC and SBS), companies that were mainly oriented toward social media were called Social News (Pedestrian; Mamamia, BuzzFeed Australia; Junkee), and broadcast shows were categorized as Television (Seven, Nine, Ten, Today, Sunrise).
Once the sample was constructed, we queried the CrowdTangle database to collect data from the organizations’ major news-producing Facebook Pages (CrowdTangle Team, 2021). 4 Data collection occurred between September and December 2020 and resulted in 2,082,804 unique posts being collected from 1 January 2014 to 15 December 2020. CrowdTangle only collects public content, but this is not a significant limitation as media organizations generally post publicly. The major limitation of our study was that CrowdTangle (n.d.) does not provide any information on reach (how many people saw the post), impressions (how many times a post was seen), or clicks (how many times a link was clicked). As a result, the data can only tell us whether people are engaging with news content on Facebook. The above limitations mean that it would be inaccurate for us to treat on-site engagement as a proxy for reach. Indeed, as we go on to explain in our discussion, we also cannot attribute the rise and fall in engagement to any one factor. Instead, our findings emerge from a complex mix of changing user practices, Facebook algorithmic changes, and individual newsroom strategies. Despite these qualifications, these results can reveal whether news organizations had changed their posting routines and if people were still liking, commenting, and sharing news content.
We were able to measure engagement performance over time by drawing on CrowdTangle’s own metrics and analytic tools to develop a performance score (Fraser, n.d.). To reduce the relevance of posts receiving extreme levels of attention, our performance score replicates CrowdTangle’s construction of an “Overperforming score.” In both cases, the 25% best and 25% worst performing posts are removed. Then the attention attracted by the remaining posts is averaged. 5 Using this approach, we constructed a daily performance score for each page between 2014 and 2020 for the remaining 50% of posts in the middle of the distribution. We created a separate average for each of the three dominant Facebook metrics generally used to identify audience engagement: reactions (like, love, care, haha, wow, sad, and angry), comments, and shares. We then combined the daily averages across 30-day rolling intervals for each metric.
We then divided it against the average measured across an identified baseline period (January–April 2017). We selected this period because it was before the major algorithm changes of late-2017/early-2018 that specifically affected news but came after the mid-2010s period when news was performing well on Facebook (E. Bell & Owen, 2017). To aggregate performance scores at the news outlet level and across the entire industry, we averaged them while weighting each outlet based on the number of links published by each page over a 30-day rolling interval. This allows for an important distinction between our approach and CrowdTangle’s. While their “overperforming score” (Garmur, n.d.) focuses on the performance of any one post relative to the previous 100 posts, our score captures the performance of a page on any given day relative to a fixed point in time (our baseline period) allowing for a longitudinal comparison.
We also downloaded audience traffic data from marketing analytics company SEM Rush to see how audiences found their way to the websites of news organizations in our sample. 6 We collected traffic data from October 2017 to March 2018 to capture the impacts of Facebook’s algorithm changes. SEM Rush makes traffic estimates based on “which channels (search traffic, direct traffic, referral traffic, or social traffic) [companies] are investing in and gaining traffic from, based on clickstream and third-party provider data” (Marvin, 2019). An early study of the tool by an independent marketer has found that the company tended to underestimate traffic (Landridge, 2016); however, the company has increased the amount of data it collects over time in order to improve its accuracy. SEM Rush also established their own categories, with certain web addresses being tagged as social (Facebook, Twitter, Reddit, LinkedIn, Instagram, Pinterest, YouTube), some as Search (Google; DuckDuckGo, Bing), and some as referrals (other sites on the web). We also focused on traffic share, so while we could tell how much social traffic was coming to these sites, we could only see the percentage of traffic that was coming from social media platforms (for example). It is likely that internal metrics from news outlets are more reliable, but since these are confidential, commercial data are the best available proxy.
Findings
Situating Facebook and Social Distribution
We begin our analysis by focusing on Australian online news distribution trends to provide some wider context before discussing Facebook specifically. A number of news organizations originally turned to social media to build large online audiences. This has led to concerns that news media companies may become reliant on digital platforms for audience traffic, giving these new digital gatekeepers an inordinate amount of power over the news ecosystem (Nielsen & Ganter, 2018). The profound market power that platforms hold notwithstanding, some of us have critiqued this view of dependency elsewhere (Meese & Hurcombe, 2020) and desk research, and available traffic data support this position.
A major benefit of the Digital Platforms Inquiry process is that some news media companies have publicly stated how much traffic they receive from social and search. Seven West Media (who own a national television network) noted that “around a third of traffic to its various digital properties came from Facebook, a third from Google (via paid and organic search) and the remainder from other sources” (ACCC, 2018, p. 100). One of Australia’s major commercial news websites 9news.com.au “obtains approximately 30 percent of its referral traffic from Facebook’s News Feed and 10 per cent from Google” (ACCC, 2018, p. 100). Other outlets are more dependent, with almost 75% of social news outlet Junkee Media’s (2021) traffic “driven through search and social.” Further information became publicly available when Facebook banned Australian news. Analysis from social analytics firm Chartbeat revealed that at a whole of sector level, traffic to news websites “fell by about 13 per cent from within Australia and 30 per cent from overseas” (Meixner, 2021).
As noted earlier, our traffic data focused on the months surrounding the January 2018 algorithm change, so we have a smaller sample to draw on, albeit one that focuses on a critical period. However, our data reflect the variability publicly reported by the above media companies, with some outlets heavily dependent on social traffic and others less so. For example, Junkee is also exposed to platforms in our dataset, receiving only a small percentage of direct traffic. Other social news publishers like Pedestrian and Mamamia have similar results. Online versions of print publications are more variable with some publications like The Age relying on direct traffic, whereas other outlets like the Daily Telegraph have a mixture of direct, social, and search referrals. Unsurprisingly, Facebook is the most dominant platform in the social category.
However, once we look at different news categories (Figure 1), 7 Google search (in yellow) is often more important than social media (in blue) for referrals. Social only plays a prominent referral role in the social news category. These findings provide some important context for our discussion of news performance on Facebook. While Facebook is clearly a dominant social platform and is worth studying considering an increasingly tense policy debate (Flew & Wilding, 2021), most Australian news media outlets were not wholly reliant on the platform for audience traffic in 2018. Some of the public statements made by Australian media companies, our own qualitative research (Meese & Hurcombe, 2020), and outcomes from the Facebook ban suggest that this is still the case for many outlets. Of course, Facebook referral traffic is still valuable for news outlets who want as many people viewing their content as possible, but these numbers suggest that most outlets across the country are not in a state of complete dependence.

Mean traffic share (by source type).
The Complex Numbers Behind the Social Collapse
Turning to on-platform performance, the first headline finding from our dataset is that we can see that in terms of engagement, Australian news content experienced a clear period of success on Facebook before a reset occurred. If we take the 2014–2020 period, the sector had the highest level of Facebook reactions 8 in April 2015 with a performance score of approximately 2. This is almost double the levels captured in early 2017 (our baseline period) and almost three times the performance score we measured at the end of our times series on 30 November 2020, which returns a performance score of 0.57 (Figure 2).
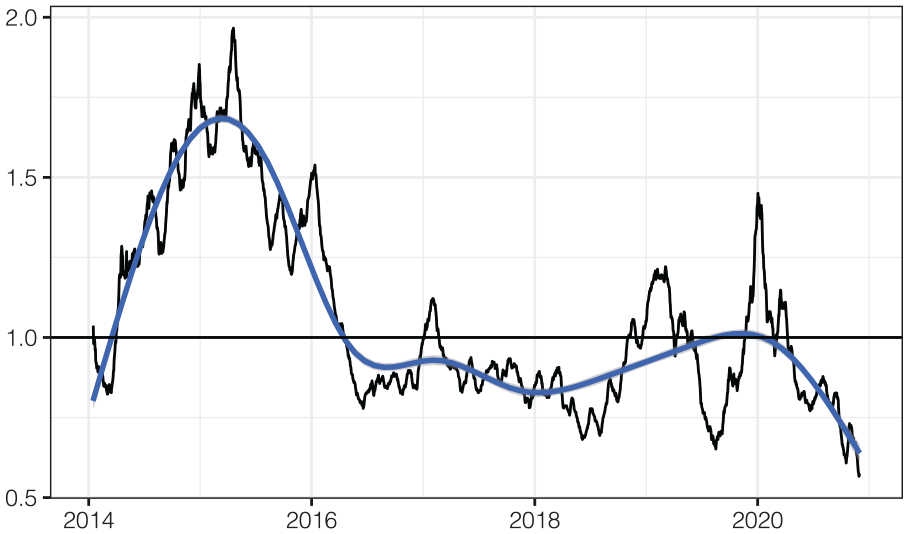
Whole of sector performance score of Facebook reactions (weighted 30-day moving average in black and LOESS trendline in blue).
Once we look at specific news categories, it becomes clear that there are winners and losers among this sector-wide picture. Digital native publications have had a mix of success and failure, and print publications have faced a gradual decline. Conversely, television and social news publications have collapsed, with social news publications going from a performance score of 3.9 in January 2016, to 0.18 in late November 2020. It is an entirely different story for Australia’s two publicly funded media outlets, who have seen an increase in reactions after the 2018 algorithm change (Figure 3).

Facebook reactions performance score by news category (weighted 30-day moving average and LOESS trendline).
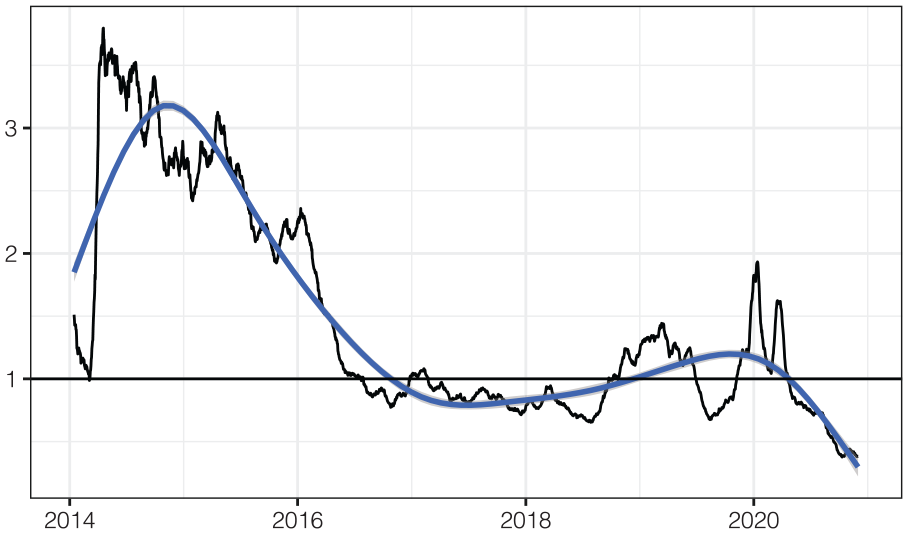
Once we turned to comments, an equally complicated picture emerged. 9 As part of the January 2018 algorithm change, Facebook (2019) said that they would prioritize “posts that spark conversations.” While people were less likely to see news posts as a result of the change, we thought that news organizations might try to generate comments on their posts to boost visibility. We could not test if this was true, but what we could see was whether there were more comments on news content. Our hypothesis was partially confirmed with the overall sector peaking in the first half of 2019, when the performance score grew from 1 to 1.56 in May (Figure 4). Yet most of the growth in 2019 and early 2020 is because of public service media pages which are consistently above our baseline across this period. Among the other news categories, we see a limited trend over the baseline between 2019 and 2020, except for social news. This points to a longer term countertrend around the comments performance score of social news and public service media. Social news reached a peak performance score of 3.14 in May 2015 when public service media was near its long-term minimum, and public service media reached a peak performance in early 2019 when social news was close to its long-term minimum.

Whole of sector performance score of Facebook comments (weighted 30-day moving average in black and LOESS trendline in blue).
Another notable trend was the decline of news sharing (Figure 5). In a now common story for much of our dataset, there was a peak of activity around 2014–2016 followed by a collapse. While there was some resistance to this downward trend (particularly around early 2020, perhaps attributable to the coronavirus), there was a further decline as the year went on. This is notable because at one stage, news sharing was seen as central to the Facebook experience (Dwyer & Martin, 2019). The sharing performance score declined across the entire industry with the November 2020 performance score only 15% of the score measured in November 2014.
Whole of sector performance score of Facebook shares (weighted 30-day moving average in black and LOESS trendline in blue).
Digging deeper, we see that the television, social news, and digital native categories were heavily impacted (Figure 6). The sharing performance score of television media pages peaked in mid-2014 at 10.8 and then quickly declined over 2015 and 2016. The performance of television posts in November 2020 was only 13% of the performance for 2014, which could well be attributable to Facebook’s pivot away from video (Tandoc & Maitra, 2018). In a slightly less dramatic fashion, social news outlets went from a sharing performance score of about 5.8 in November 2015 to 1 in April 2017 and then 0.40 at the end of November 2020. This is notable because these outlets famously targeted Facebook’s sharing feature to build their audience and generate traffic (Hurcombe et al., 2021). While all of the above categories (including television and social news) stabilized after 2017, public service media experienced a boom in sharing between 2018 and early 2020, with a performance score consistently between 2 and 6.

Facebook shares performance score by news category (weighted 30-day moving average and LOESS trendline).
These trends show that there has been a decline in the number of reactions and shares with comments resisting the decline to some extent. Among these sector-wide trends, two news categories stand out. The first is social news, which went from dizzying heights across 2014 and 2015 across reactions, comments, and shares to eventually collapse below our benchmark from the early 2017 period onwards. Conversely, public service media outlets were more resilient, seeing comments, reactions, and shares rise well after the supposedly best years for news on social media (Meese & Hurcombe, 2020). There are a number of reasons for these trends, and we will go on to discuss some of these factors in our final analysis. But before we do so, we will turn to the specifics of the January 2018 algorithm change and see how the Australian news media responded.
Unpacking Algorithmic Change
We cannot assess the specifics of the algorithm change because it was focused on reach, a metric CrowdTangle does not provide. However, this dataset is still useful because we can clearly see how news outlets responded to the change by looking at their posting habits. We can also assess the impacts of this change by interrogating our traffic data. Once again, public statements from the ACCC inquiry give us some guidance about what we might find. Seven West Media “indicated that traffic to some of its websites fell around 40 per cent from June 2017 to April 2018” (ACCC, 2018, p. 114). SBS also noted that they had “seen a marked drop in reach for its news content on the platform” since the algorithm change (ACCC, 2018, p. 114). From this reporting, we can presume that the algorithm change had a negative impact on some news outlets.
This was supported by our traffic data, which revealed that there was a general decline in Facebook’s traffic share across most of our categories (Figure 7). Once again, social news had the most dramatic collapse with Facebook traffic referrals falling from almost 40% to 20%. Traffic from Facebook to Print and Public Service Media websites also fell but they appeared to be less reliant on Facebook in the first place with the platform accounting for around ~10% of traffic. Digital native news outlets did not witness a clear decline, and again, Facebook accounted for a small proportion of their overall traffic. There were clear signs of traffic decline among individual social news outlets. Facebook referrals fell among a number of outlets including BuzzFeed (social news), Pedestrian (social news), as well as the Herald Sun (print) and the Guardian (digital native) (Figure 8).

Mean percentage traffic share over total traffic from Facebook.com by news category.

Percentage traffic share over total traffic from Facebook.com of individual outlets.
In light of this decline in referral traffic from Facebook, publishers explored other options. Our qualitative research revealed that some organizations had started to focus on Google around this time and sought to boost search engine results for their articles (Meese & Hurcombe, 2020). Our traffic data support this trend, with all of our categories seeing a small uptick in traffic share from Google. Digital natives had the largest jump with Google going from 10% to 20% of traffic share but all rose to some degree. Our traffic share data also show that search is generally more important than social media across all categories throughout the time period in question. Taken together, these results point to the growing importance of Google as a news distributor following Facebook’s declining interest in news.
Another way we can piece together the impact of the algorithm change is from looking at what news organizations did in response. We looked at the link posting habits of our sample and found that while outlets did not immediately leave Facebook, some of them appeared to adjust their posting schedules as they attempted to work out the new algorithm. Once again, the Herald Sun (print) stands as an interesting example of a publication that slowed down their posting rate in 2018 before posting more content in 2019. The Daily Mail (digital native) followed a similar pattern. Other outlets seemed to respond to 2018 by slowly moving away from the platform. Mamamia (digital native) tried to adjust to the algorithm across 2018 and 2019 (Figure 9) but then slowed their rate of posting considerably across 2020, providing supporting evidence to the owner’s public statements that they were moving away from Facebook (Samios, 2018). ABC News (television) and Today (television) also lowered their posting rate but started to return to the platform in 2020, most likely as a result of the pandemic. The other side of the story is that publishers like The Guardian did not dramatically alter their output immediately after January 2018, with many posting consistently or making changes at other times (most likely as part of a wider rest of their social media strategy).

Number of posts from individual outlets across 2017–2018 algorithm changes (7-day moving average).
Finally, we return to our engagement data to complete the story of this algorithm change. What we see from our trends is that there was not a dramatic collapse in on-platform engagement around the time of the algorithm change. Comments or reactions did not suddenly fall in 2018, which suggests that people who did see news content were still engaging with it as before. However, our trends show that news started to decline from 2016 onwards. Apart from some notable exceptions, news categories have been returning a significantly lower performance score after 2016 than in the years before. In November 2020, the sharing performance score for reactions, comments, and shares were 42%, 64%, and 15% lower than the November 2014 results across the sector. For us, this suggests that the algorithmic changes in late-2017 and early-2018 formed part of a wider collapse in business models based around the social distribution of news. Facebook clearly stopped rewarding news outlets, but our data suggest that this was a phased social and technological transformation, involving changing user practices and Facebook’s own corporate decisions.
The Changing Context of Online News Distribution
Based on the data points we have available to us; our dataset shows that the Australian news media sector is performing worse on Facebook. We also see this at a category level, with the vast majority of categories doing badly and contributing to this poor performance (Print, Digital Native, Television, Social News). While the decline in sharing, reactions and comments has been gradual for most categories, it has been more dramatic for social news. The category was performing exceptionally well from 2014 to 2016 and its numbers have fallen since then. As of November 2020, the category has a performance score of 0.18, 0.20, and 0.40, respectively, for reactions, comments, and shares. There are a number of complex reasons for this decline, and only some are related to Facebook’s decisions. As we saw in our traffic data, these companies relied on Facebook to drive traffic to their site. For publications in this category, this formed part of a wider strategy that saw outlets engage with the unique vernaculars of social media (Hurcombe et al., 2021). During the middle of the 2010s, social news companies and Facebook were generally happy to support each other. Many of these companies were relatively new to journalism, and using Facebook helped social news outlets establish their brand with a key audience. On the other side of the ledger, Facebook benefited because these companies were posting engaging content on their platform.
So how did this mutually beneficial partnership unravel? We argue that this was partially because Facebook made a series of decisions around the 2016 election of Donald Trump that affected this emerging news genre. After the election, it soon became clear that Russian actors had used the platform to spread misinformation in the lead up to the vote (Benkler et al., 2018). The quality of news on Facebook became a central issue and one that the company was keen to address. While the company had already started to favor social content over news in algorithm changes made in late-2015 and early-2016, it ramped up this effort after Trump’s election. As noted earlier, at the end of 2017, the platform made specific changes to the algorithm, to target companies who were trying to game the News Feed (Facebook, 2017a, 2017b). Our previous research showed that while people working in social news claimed to not engage in these practices, many also stated that their company was reliant on the Facebook algorithm and worked to game it (Meese & Hurcombe, 2020). As a result, we suggest that these companies were more likely to feel the impacts of algorithmic changes that specifically sought to target this behavior.
However, changes in user practices also contributed to this decline. The practice of news sharing has declined since the middle of the 2010s, with less people circulating news among their networks and more people engaging with news in new ways (Kang et al., 2020). Second, young people have also been moving off Facebook and turning to other apps like Instagram and Tik Tok and many of these social news outlets have followed their audience there (Vázquez-Herrero et al., 2020). While industry reportage and our own interviews (Meese & Hurcombe, 2020) suggest that Facebook’s decisions have the most consequential impact with regard to the short-term performance of news, the behavior of users cannot be excluded from any analysis of this longitudinal decline.
In contrast, public service media experienced a post-January 2018 increase across our available data points (shares, comments, and reactions). As of November 2020, shares and reactions are returning to our early-2017 baseline, but comments are still overperforming. Many of the same developments best explain the performance of this category, which runs counter to wider sectoral trends. Facebook has worked to ensure more trusted content ends up on its platform post-Trump and introduced an internal “trusted sources” score for their News Feed algorithm in 2018 to help. The company surveyed a number of people to gauge which news sources they trusted and combined these results with existing studies that sought out rankings on the informativeness of news updates (Facebook, 2018). Australians have the highest trust in public service media outlets and so it is entirely possible that Facebook’s News Feed has preferenced these outlets as a result of the changes (Park et al., 2020).
Once again there are also off-platform drivers that explain these numbers. Australia’s public service media organizations have an obligation to reach as many citizens as possible and are predominantly non-commercial. They can focus on ensuring that content circulates and do not have to worry about advertising revenue or subscriber numbers. Our interviews revealed that this gave them more freedom when dealing with platforms and allowed them to engage more substantially with social media, since they were obligated to go where citizens were (Meese & Hurcombe, 2020). People of all political persuasions are also likely to engage with their content and most importantly, comment on it, which would have been particularly valuable after the January 2018 algorithm change. These outlets also do not have a paywall, which means that Australians can easily access news without paying for it directly.
The decline in sharing is also worth exploring in more detail as shares were a core metric for many of the social news providers who appeared across the 2010s (Hurcombe et al., 2021). Witnessing a stark decline across the entire sector and a majority of categories is therefore surprising. Once again, we cannot discount user practices. In addition to the increase in tagging friends in comments instead of sharing posts, there has also been a rise in “dark social” (Kang et al., 2020). This refers to people sharing content on messaging applications like WhatsApp and iMessage, which have historically been excluded from social media metrics. However, one possibility that we cannot discount (but also cannot prove) is that successive Facebook algorithm changes have also contributed. We argue a changing algorithm seems to be a likely additional factor considering the scale of the decline.
Finally, it is important to note the ongoing importance of search engines and Google in our dataset. There has been a fascination with social media among news and journalism scholars (Lewis & Molyneux, 2018). However, our dataset also reveals that search is not only a dominant site of referrals historically but has potentially become even more important since the algorithm change of 2018. Indeed, many news organizations are focusing on search engine rankings. Despite this, lots of scholarship is still focused on Twitter and Facebook because of the comparative availability of data. Our own article, based mostly on CrowdTangle data, stands as a salutary example of this tendency. Google’s search algorithms and aggregation services like Google News may warrant greater attention, even if data from these services is harder to access.
Conclusion
This article offers a comprehensive but necessarily incomplete story of how the Australian news media sector has engaged with Facebook over a critical 6-year period and has identified responses to the 2018 algorithm change at a whole of sector and news category level. Because Facebook’s algorithms operate in a “black box,” we can only draw on available data and make our best guesses about what occurred. However, we can identify some sort of general decline in performance, one that is supported by our own qualitative work (Meese & Hurcombe, 2020), Facebook’s public statements about their loss of interest in news content, recent evidence from Facebook’s withdrawal from Australia, and public statements from media outlets. Our findings also emphasize the importance of business models (which we organized into categories for analysis) when telling this story. While social news suffered, public service media outlets appeared to survive the algorithm changes, thanks to a range of on-platform and off-platform factors. These results point to the importance of viewing news institutionally and recognizing that the histories and goals of different outlets can lead to very different social strategies (Bannerman & Haggart, 2015).
Our findings are also consequential for future research in this area, because it provides a useful map of an entire sector. It outlines a range of trends and can guide Australian scholars to productive areas of future inquiry around the relationship between platforms, news organizations, and audiences. While we cannot make claims about international outlets, we anticipate that there may be potential similarities at the category level. It is also possible for researchers in other countries to replicate our method. Finally, we also reveal that Facebook is often not the core intermediary for online news distribution and suggest that ongoing attention needs to be paid to Google’s role as a growing gatekeeper and aggregator of news.
This trend may be exacerbated in light of recent events. While Australian news has been restored to the platform, the continued existence of Facebook as a major platform for Australian news distribution remains in question. Some outlets are already encouraging readers to access and follow their news on other platforms or their own apps (Lenton, 2021). This strategy already appears to be working: the ABC, who have been outliers in their Facebook success since 2018, have had a significant increase in app downloads since the ban (Campbell, 2021). Concerns remain about how this post-Facebook future will impact journalism. Our findings suggest that currently, Facebook may not be as critical to certain news outlets as the associated public furore appears to indicate.
Footnotes
Acknowledgements
We are grateful to Cheyne Anderson for support with research assistance and Michael Riethmuller for advice and initial testing of data collection strategies.
Data Availability Statement
Declaration of Conflicting Interests
The author(s) declared the following potential conflicts of interest with respect to the research, authorship, and/or publication of this article: Bailo is currently completing an unrelated research project funded by Facebook. The authors have also been granted access to CrowdTangle by Facebook. The authors have reported no other conflict of interest.
Funding
The author(s) disclosed receipt of the following financial support for the research, authorship, and/or publication of this article: This research was supported by the Australian Research Council (ARC) grant DE190100458.