
Abstract
Facebook plays a substantial role in shaping exposure to news and information, a role that is particularly significant during democratic elections. This article aims to characterize Facebook’s contribution to news exposure during the 2020 US election. Using internet browsing data from 1.3 million desktop panelists in the United States, we analyze audience flows from Facebook to news and information publishers (N = 3,247 websites) labeled according to quality (high or low) and geography (non-local or local). We find that Facebook ranked as the fourth largest external referral source to publishers. Our analysis further shows that, among the panel of 1.3 million US adults visiting these publishers via desktop computers, Facebook disproportionately amplified low-quality publishers and extended their audience reach during the study period. We also find evidence that Facebook’s intervention to improve “news ecosystem quality” by tweaking their News Feed algorithm was associated with fewer daily visits to low-quality publishers, but seemed to have a similar effect on other publishers and, according to Facebook-provided data, had little effect on month-over-month traffic. We discuss limitations, open questions about platform impact, and directions for future work.
Introduction
Algorithmic platforms like Facebook shape human communication at unprecedented scale, but their actual contributions to online attention remains somewhat ambiguous. Mounting evidence demonstrates how platforms can influence voting decisions (Bond et al., 2012; Epstein & Robertson, 2015), personal well-being (Allcott et al., 2020), emotional behavior (Hagey & Horwitz, 2021; Kramer et al., 2014), and other high-stakes aspects of society (Nielsen & Ganter, 2022). Yet scientific research is still exploring how platforms’ potential influence translates to real-world impact.
The influence of algorithmic platforms is especially high stakes during democratic elections. By shaping people’s exposure to news and information, platforms can influence voters’ ability to make factually informed decisions about legislation and governing officials—decisions that are foundational to functioning democracies (Kuklinski et al., 2000). Many are thus concerned that platforms may be undermining democratic processes: in the United States, 73% of adults had “little or no confidence in tech companies to prevent the misuse of their platforms to influence the 2020 election” (Green, 2020). Given the widespread concern, urgency, and ambiguity surrounding the topic, researchers have devoted increasing attention toward understanding how platforms contribute to news audiences during elections (Edelson et al., 2021; Hecht et al., 2017; Kennedy et al., 2022; Mustafaraj et al., 2020).
This study specifically explores Facebook’s contribution to news audiences throughout the 2020 US election season, in other words, how news consumers flowed from facebook.com to news websites like cnn.com. Our empirical analysis primarily relies on internet browsing data from 1.3 million US desktop panelists (age 18 or older), and characterizes Facebook’s impact on 3,247 publishers, which were labeled by prior work (Allen et al., 2020; Bradshaw et al., 2020; Grinberg et al., 2019) according to quality (high or low) and geography (non-local or local). Throughout the study period (October, November, and December 2020), Facebook referred 3.1% of panelists to labeled publishers in our data set—1.1% were referred to low-quality publishers and 2.9% to high-quality publishers. We find that Facebook disproportionately amplified low-quality non-local publishers among panelists in our data, thus corroborating some initial work focused on Facebook and the 2020 election (Edelson et al., 2021). A number of low-quality publishers (e.g., theblaze.com, awm.com, dailywire.com, and pjmedia.com) doubled their audience reach from Facebook referrals. Time series analysis suggests that Facebook’s intervention to improve “news ecosystem quality”—a tweak to the News Feed algorithm intended to direct more attention to mainstream publishers and less attention to low-quality publishers (Roose, 2020)—had mixed success, reducing visits to publishers indiscriminately. Facebook’s URL shares data set (Messing et al., 2020) further suggests that Facebook’s tweak made little to no difference in terms of month-over-month traffic.
This article contributes to the growing body of social media research aimed at understanding news dissemination on platforms, especially with respect to the quality of news and information that people share and consume (Bandy & Diakopoulos, 2021; de León & Trilling, 2021; Savolainen et al., 2020). Using large-scale, real-world panel data, we address open questions about Facebook’s real impact on news and information quality during the 2020 US election season: What is Facebook’s relative contribution to publishers? Which types of publishers benefit most from Facebook? How do these dynamics change when Facebook makes tweaks and changes to their algorithms? In addressing these questions, the article makes two notable contributions to research in social media and algorithm auditing: (1) analyzing Facebook’s impact on audiences for local news publishers, compared to more commonly studied (non-local) publishers and (2) isolating the impact of a specific algorithmic intervention that Facebook made in attempt to moderate access to quality information.
Related Work
When it comes to the topic of social media and news dissemination, related work is extensive and spans many disciplines. This section overviews related work in two specific areas pertaining to our study: (1) studies that audit algorithmic platforms and (2) studies that focus on the relationship between news, social media platforms, and democratic elections.
Auditing Algorithmic Platforms
Audit studies, and particularly algorithm audit studies (Metaxa et al., 2021), have become an important part of social media research. Many of today’s influential platforms and algorithms are proprietary, such that, private companies share limited information about how they work and how they impact people. Researchers and journalists have thus developed auditing methods to generate some degree of algorithmic transparency and accountability. Audit methods vary across different platforms and research questions, but often entail “repeatedly querying an algorithm and observing its output in order to draw conclusions about the algorithm’s opaque inner workings and possible external impact” (Metaxa et al., 2021).
Given their broad impact on communication and society, algorithmic platforms, such as Facebook, Google, and Twitter, have attracted significant attention in audit research. Such research has identified racist stereotypes in Google search results (Noble, 2013, 2018), discrimination in Google’s advertising system (Sweeney, 2013), and discrimination in Facebook’s advertising systems (Imana et al., 2021; Sapiezynski et al., 2022). Beyond bias and discrimination, auditors often analyze algorithms and algorithmic platforms in terms of effectiveness, transparency, and other impacts (Brown et al., 2021).
Most relevant to our study are audits that explore the impact of algorithmic platforms in disseminating news and information. These audits have important implications, since platforms can shape public opinion (Epstein et al., 2017; Vargo et al., 2018) in ways that resemble the agenda-setting influence of traditional media (McCombs, 2005; McCombs & Shaw, 1972). Some research illustrates how platforms can undermine traditional news values. For example, work by Trielli & Diakopoulos (2019) found significant source concentration in the “Top Stories” component of Google’s search results—half of all article impressions went to just 20 news sources. Nechushtai & Lewis (2019) found similar concentration in their audit of Google News, with just five news organizations accounting for 49% of all recommendations.
A number of audit studies have analyzed news dissemination on social media platforms like Facebook and Twitter. These studies often address the concern that Facebook’s algorithms may amplify low-quality content (i.e., “fake news,” “untrustworthy news,” “junk news”). Many quantitative studies of low-quality content on Facebook use some kind of panel data, survey data, or more recently, data from Facebook’s URLs data set (Messing et al., 2020). This includes work by de León & Trilling (2021) identifying a potential bias toward sadness in news sharing on Facebook. Emotional dynamics in news engagement have been similarly explored by Savolainen et al. (2020), who focus on the category of “junk news” outlets. Bandy & Diakopoulos (2021) also analyze Twitter’s timeline algorithm, along dimensions of quality.
Furthermore, qualitative work by DeVito (2017) used Facebook patents, press releases, and other documents to reveal that most curation by the News Feed algorithm is “based on your behavior, the behavior of people you are connected with, and the behavior of the affinity and personality-based sub-group of users the system judges you belong to.” These personalized features can contribute to the spread of low-quality information, as they clash with traditional news values, such as diversity and timeliness (Harcup & O’Neill, 2017).
Another common concern about news attention on social media and other algorithmic platforms is the creation of “echo chambers” or “filter bubbles” that limit people’s exposure to diverse information (Resnick et al., 2013). Many studies exploring this hypothesis have not found supporting evidence (Bruns, 2019b; Fletcher et al., 2023; Robertson et al., 2018), and research that tests this hypothesis on Facebook is quite limited due to restricted data access (Bruns, 2019a; Lazer, 2020; Tromble, 2021). One exception is an internal study by Bakshy et al. (2015), which analyzed partisan news audiences using data from Facebook users who published political identification. Their results suggest that Facebook’s News Feed algorithms had little effect on partisan news consumption for these users, while individual user choices were more likely to create echo chambers. This work complements the study from Bakshy et al. by exploring the systemic influence of Facebook’s algorithms and user choices on publishing websites’ desktop audiences.
Some extant work offers concrete evidence as to how Facebook contributes to news and information exposure. These studies consistently show that low-quality content appears to be relatively rare on Facebook (and in general/0). A study from Guess et al. (2019) found that 90% of Facebook users never shared stories from domains that publish false information. In another study, Guess et al. (2021) analyzed Facebook’s URLs data set and found that articles from credible news sources are shared five times more often and viewed seven times more often than articles from low-credibility sources. Allen et al. (2020) estimate that false information only makes up about 0.15% of the daily media diet for US adults.
In addition to the potential to create echo chambers and spread low-quality content, platforms may also exacerbate the challenges of local news publishers. Many local publishers are struggling to find audiences and remain viable, especially in the United States (Abernathy, 2018). Local publishers produce content focused on a specific geographic region, which often improves civic engagement and public accountability (Darr et al., 2018; Gao et al., 2020; Shaker, 2014). But a number of audit studies show that platforms like Google News feature a relatively low volume of local news (Fischer et al., 2020; George & Hogendorn, 2020). Limited work has analyzed local news on Facebook, though a study by Toff and Mathews (2021) found that “hard news stories at the national rather than local level generated modestly higher levels of engagement on Facebook.” Our analysis seeks to build on this important work of assessing how platforms (and specifically Facebook) can impact local news audiences.
The aforementioned studies (Allen et al., 2020; DeVito, 2017; Guess et al., 2021; Toff & Mathews, 2021) offer high-level views into Facebook’s impact on news publishers. Taken together, they suggest that the values driving algorithmic news dissemination on Facebook often differ from traditional news values. However, it remains somewhat unclear how these differences manifest in real-world news consumption, especially given the low prevalence of false information. Our study aims to further explore the real impact of algorithmic news dissemination on Facebook, specifically focusing on impacts during the 2020 US election with respect to key values of content quality and locality. We build on prior audit studies that have also analyzed social media platforms during election seasons, as described below.
Platforms and Elections
The topic of platforms and elections has been a growing area of concern in the past decade. Some of the earliest evidence of Facebook’s influence on elections used randomized trials on 61 million users during the 2010 US midterm elections, finding evidence that Facebook could systematically increase voter turnout (Bond et al., 2012). The study sparked widespread concern about Facebook’s potential to interfere with democratic elections (Albergotti & Dwoskin, 2014), and led many scholars to devote more research attention to Facebook’s impact.
Research attention to fake news, misinformation, and disinformation grew substantially in scholarly research agendas following the US presidential election in 2016. One aspect of the research agenda in human–computer interaction (Hecht et al., 2017) explores how specific platforms may have led audiences toward false and low-quality publishers. For example, Grinberg et al. (2019) studied exposure to fake news on Twitter during the 2016 election season, using a panel of 16,442 Twitter accounts linked to US voter registration records. Their analysis found highly skewed exposure patterns: 1% of individuals accounted for 80% of exposures to sources that published fabricated stories and questionable claims. Using the same method for linking Twitter accounts to voter registration records, Green et al. (2022) found that engagement with 2020 election misinformation was slightly associated with lower voter turnout in the 2021 runoff election in the state of Georgia.
Besides leading voters to untrustworthy news, platforms might also interfere with democratic processes if they systematically favor certain political parties. While questions of platform political bias are difficult for external researchers to address, some internal work offers helpful insights. For example, recent work from Twitter (Huszár et al., 2022) analyzed the impact of algorithmic curation for political parties in seven different countries, with results suggesting Twitter’s algorithms consistently amplify tweets from right-leaning political parties.
Closely related to our article is work focused on news dynamics during the 2020 election season. Edelson et al. (2021) provide evidence that misinformation received widespread engagement on Facebook during the 2020 election. Their analysis relies on data from CrowdTangle, a Facebook-owned tool that provides engagement metrics for popular pages (including pages from news outlets). However, as Facebook notes (Schultz, 2020), CrowdTangle engagement metrics do not represent what people actually see on the platform.
This study extends prior work about platforms and elections in several ways. First, our analysis measures exposure rather than engagement, by looking at real-world audience navigation from Facebook to news websites, rather than likes and comments on Facebook posts. Likes and comments can be a helpful proxy for exposure, but the large-scale panel data used in this study allow direct measurement of exposure to news websites.
Our analysis also responds to prior work that calls to “consider all potential sources of problematic content,” including “junk news” and other low-quality publishing besides “fake news” websites (Allen et al., 2020). While many studies about platforms and elections focus on false or misleading information, our work intends to use a broader scope of analysis. To do this, we analyze audience flows to four different types of websites: high-quality non-local news outlets, high-quality local outlets, low-quality non-local sites, and low-quality local sites. The methods section contains definitions, examples, and more details about each category.
Finally, this study addresses gaps in algorithm auditing related to temporality. We offer one of the first large-scale analyses of news exposure during the 2020 election season, from October 2020 through December 2020. This analysis window also allows us to analyze a “tweak” to Facebook’s algorithm. In related work auditing news dissemination on algorithmic platforms (Huszár et al., 2022), analyses treat algorithms as unchanging mechanisms rather than the dynamic, evolving processes they truly are. But, by analyzing activity from the last 3 months of 2020, we are at least able to analyze a “tweak” that Facebook made to the News Feed algorithm after the 2020 election (Roose, 2020).
In summary, we aim to clarify open questions from prior work regarding Facebook’s overall impact on news publishers, its impact on different types of publishers across levels of quality and locality, and the impact of a “tweak” to its News Feed algorithm during the 2020 US election. More formally, we use internet browsing data from a panel of 1.3 million desktop users in the United States to address three main research questions:
RQ1: What was Facebook’s contribution to audience flows to online news audiences during the 2020 US election season?
RQ2: How did Facebook’s contribution vary across different publishers, in terms of quality (high vs low quality) and geography (non-local vs local)?
RQ3: What happened when Facebook “tweaked” their ranking algorithms to improve “news ecosystem quality” after the 2020 US election?
We also use Facebook’s URL shares data set to address one additional research question and further contextualize the “tweak” that Facebook made to their ranking algorithms after the election:
RQ4: How do Facebook’s contributions during the 3-month study compare to longer-term, macro-level, month-by-month, trends?
Methods and Data
We use two data sources for this chapter: (1) panel data from Comscore to address RQ1–RQ3 and (2) Facebook’s URL shares data set to address RQ4.
Internet Browsing Data from Comscore
The first portion of this analysis uses internet browsing data from 1.3 million US panelists in 1.0 million households during October, November, and December 2020. The panel data come from Comscore, which recruits and registers participants to consensually measure their internet activity via passive software meters. The meters monitor transmission control protocol/internet protocol (TCP/IP) traffic, thus capturing internet activity “across all web entities, regardless of browser type” (Comscore, 2020).
As application programming interface (API)-based data have become more difficult for researchers to access (Tromble, 2021), panel data have proven helpful for studying information diffusion at scale. For example, researchers have used panel data to analyze misinformation on Twitter (Green et al., 2022), radical content on YouTube (Hosseinmardi et al., 2021), and general internet browsing (Wu et al., 2021). Commercial panels have a number of unique benefits for academic research, especially the scale and quality of the data (Taneja, 2016), and related work has studied audience flows using the Comscore panel (e.g., Nelson & Taneja, 2018) and a similar Nielsen panel (e.g., Allen et al., 2020).
This study uses unweighted measurements directly from Comscore’s panel (as opposed to the “unified” measurements that combine weighted panel data with site-centric data). In total, the panel includes 1,359,529 panelists from 1,029,215 households across all 210 unique designated market areas (DMAs) and all 50 United States. According to Comscore, 53% of the panelists identify as male, 47% identify as female, and the median age of the panelists is 43 (min = 18, 25th percentile = 29, 75th percentile = 57, max = 97). 1
Because Comscore collects data passively, it allows the analysis to account for the choices people make from the course of viewing a post to clicking on it. Recent work has analyzed likes, shares, and comments on news URLs during the 2020 US election (e.g., Edelson et al., 2021), but limited work has analyzed real-world engagement. The Comscore panel data allow us to build on related work by analyzing real-world views and clicks.
The study period was selected to include the month of the election (November 2020), as well as the month before and the month after the election. Agenda-setting research suggests that news dynamics in the weeks before elections can significantly affect voting decisions (McCombs & Shaw, 1972), and related research (Guess et al., 2023) has analyzed similar time periods. Also, in the weeks after the election, news plays an important role in legitimizing election results. To explore these key pre-election and post-election periods, our analysis includes data from October, November, and December 2020.
While the panel data have many advantages, they also have some limitations. Most notably, they only measure desktop internet traffic and do not include mobile traffic. We explore this and other limitations in the “Discussion” section.
URL Shares Data from Facebook
To address RQ4, we use the URL shares data set provided by Facebook and managed by Social Science One (Messing et al., 2020).
The data set summarizes information about URLs shared more than 100 times publicly on Facebook, with each “row,” including the total count of likes, shares, views, and clicks at the URL–year–month level, as well as some other attributes not used in this analysis. The data set was processed through a differential privacy framework, with Gaussian noise added systematically. The results thus offer noisy estimates of the metrics in question (total views and total clicks), but with sufficient precision for macro-level, longitudinal analysis.
For both the Comscore panel data and the Facebook URL shares data, we scope analysis to 3,247 publishing websites labeled by prior work (Allen et al., 2020; Bradshaw et al., 2020; Grinberg et al., 2019) and visited by at least one panelist. The websites and their labels are detailed and summarized in Table 1.
Summary Table of Publisher Labels.

Note. In total, 4,636 publishers were labeled, 70.0% of which (N = 3,247) were visited by at least one panelist during the main study period (October 2020–December 2020).
Publisher Labels
This chapter’s analysis focuses on two dimensions, quality and localness, with two groups for each dimension. This generates four broad categories: high-quality non-local publishers, high-quality local publishers, low-quality non-local publishers, and low-quality local publishers. Category labels are derived from Comscore labels and prior research (Allen et al., 2020; Bradshaw et al., 2020; Grinberg et al., 2019), as summarized in Table 1.
First, high-quality non-local publishers are news websites with “known fact-checking operations and credible standards of production,” as well as “clear information about real authors, editors, publishers, and owners” (Bradshaw et al., 2020). Similarly, high-quality local publishers follow journalistic standards, such as fact-checking operations and clear distinctions between news and commentary, with most articles focused on a specific geographic region.
Low-quality publishers publish content that is misleading, deceptive, or otherwise problematic and not adhering to professional journalism standards. Responding to suggestions (e.g., Allen et al., 2020; Bradshaw et al., 2020) that researchers study broad categories of potentially problematic sources in addition to misinformation, this category of low-quality publishers combines several different sources and labels. Low-quality non-local publishers include all those labeled “fake” or “hyperpartisan” by Allen et al., labeled “junk news” by Bradshaw et al., and labeled low quality by Grinberg et al. 2
The fourth category analyzed is low-quality local publishers. Prior work related to this category is limited, however, researchers have identified a large network of “pink slime” websites that are low quality and geographically focused. Pink slime websites are fictitious local news publishers that mimic professional news in their aesthetic, but do not follow professional journalistic standards. Also, unlike some low-quality non-local publishers, they do not have real newsrooms with real employees. Rather, they often rewrite stories from other sources, present opinion-based articles as factual reporting, and/or use automated story generation without attribution (Bengani, 2019). In 2020, the Columbia Journalism Review published a database of pink slime websites 3 that provided labels for low-quality local publishers.
For research consistency, we defer to labels from prior research when they conflict with Comscore labels. This involved labeling 52 domains as low quality that would have been labeled high quality if only the Comscore label were used. While reviewing website labels, we also identified and relabeled two websites (oann.com and newsmax.com) that Bradshaw et al. previously labeled as professional news, but currently meet the criteria for junk news. Finally, there were 12 high-quality domains with conflicting labels (local vs non-local), most of which were focused on small geographic regions but still had large audiences (e.g., bostonglobe.com, coloradosun.com, chicagotribune.com). We labeled these as local outlets since most of their articles focus on specific geographic regions.
Table 2 shows the ten publishers from each category with the greatest overall audience reach among Comscore panelists.
Ten Websites with the Greatest Reach from Each of the Four Categories, Where Reach Corresponds to the Portion of Comscore Panelists Who Visited the website.

Results
RQ1: Facebook’s Relative Contribution
Analyzing all referred visits to labeled publishers in the data set, Facebook ranked as the fourth largest source of referred visits. Google, Bing, and the BBC were the top three referral sources (in terms of total referred visits), and Yahoo was the fifth largest. Figure 1(a) plots these top five referral sources and Figure 1(b) plots referred visits per day from these sources for the full study period. Election Day (November 3) saw a sharp increase in referred visits from Google, Bing, BBC, and Yahoo, but not from Facebook.
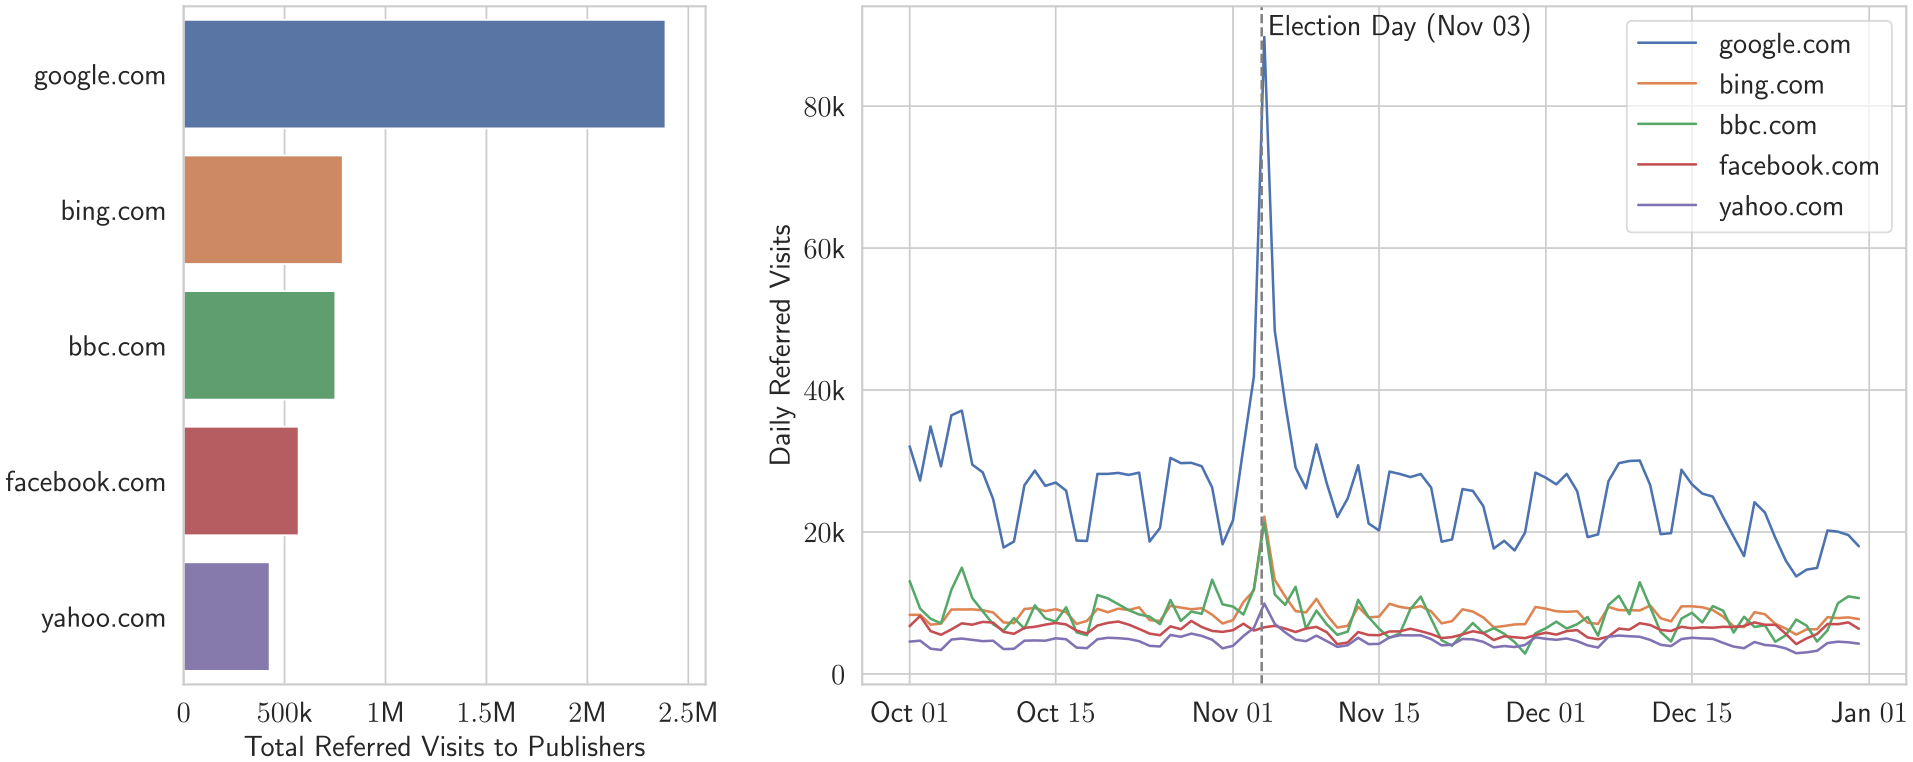
Referred visits from Facebook compared to other major referral sources for publishers (among Comscore panelists only). Left (a): total referred visits to publishers among desktop panelists, cumulative over the course of October–December, 2020. Right (b): daily referred visits throughout the same period.
Over the main 3-month study period, Facebook referred 10.2% of all panelists to external websites, and 3.1% to labeled publishers in the data set. Notably, Facebook referred 1.1% of all panelists to low-quality publishers (including local and non-local publishers). These results corroborate recurring findings from related work (e.g., Allen et al., 2020; Grinberg et al., 2019; Guess et al., 2019; Moore et al., 2022), namely, that news websites only account for a fraction of content exposure, and low-quality publishers have relatively small audiences.
While other referral sources made larger contributions, especially on Election Day, the panel data show that Facebook remains one of the largest contributors to news audience flows. RQ2 aims to characterize Facebook’s contribution across different types of publishers.
RQ2: Facebook’s Contribution across Categories
To characterize Facebook’s contributions across different categories of publishers, we calculate four metrics for each of the 3,247 labeled publishers in the data set:
• Reach:
Total Reach: the percentage of panelists who viewed the publisher’s website;
Facebook-Added Reach: the percentage of panelists that Facebook referred to the publisher who did not visit the publisher through any other means. 4
• Visits:
Total Visits: the number of total visits to the publisher’s website (excludes self-referrals, e.g., bbc.com/1 to bbc.com/2);
Facebook-Referred Visits: the number of visits to the publisher’s website that came from Facebook referrals.
Figure 2 plots the Facebook-added audience reach for all labeled websites in the four different categories (removing one outlier, faqtoids.com, which received visits from browser hijackers and malicious programs 5 ).
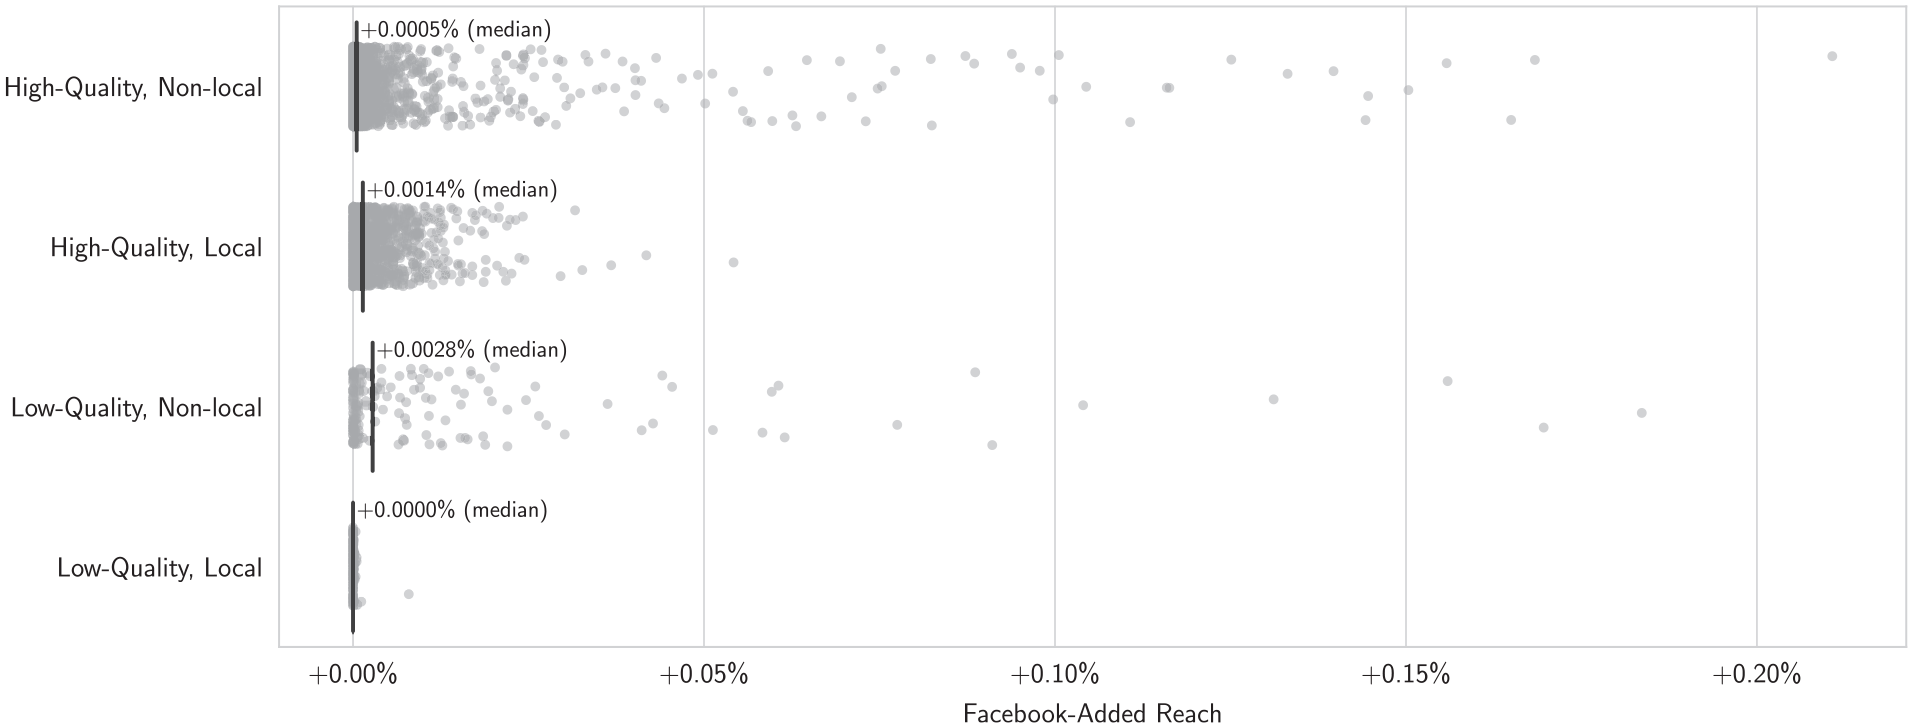
Added reach from Facebook referrals for labeled news publishers. Each dot represents a publisher, and vertical lines show the median added reach in the respective category. An added reach of 0.10% corresponds to 1,360 additional panelists who did not visit the publisher’s website except through a Facebook referral.
Analysis for RQ1 showed that Facebook referred 3.1% of panelists to labeled publishers, however, RQ2 results suggest that panelists often visited the same publishers through other means (i.e., direct visits, search engines, and/or other external referral sources). Facebook-added reach was 0.01% or less for 89.6% of publishers—that is, for 89.6% of publishers, Facebook referrals expanded their audience by no more than 136 of the 1.3 million total panelists during the study period.
Insofar as Facebook did expand audiences for publishers in the data set, it was more likely to expand the reach of low-quality publishers than high-quality publishers. For example, consider theblaze.com, unanimously labeled as low-quality in prior studies. When excluding Facebook referrals, the website reached 1,321 panelists. Facebook referrals more than doubled the reach of theblaze.com to 2,735 panelists—an additional 0.1% (N = 1,414) of the total panel.
As shown in Figure 2, low-quality non-local publishers had the highest median Facebook-added reach of any category. And theblaze.com was not the only low-quality publisher to double their audience—many low-quality publishers would have had little to no audience without Facebook referrals. For instance, without Facebook referrals, awm.com only reached four panelists, but it reached 840 panelists when including Facebook referrals. Table 3 shows the five most-amplified publishers in each category based on Facebook-added reach.
Top 5 Amplified Publishers in Each Category According to Added Reach Among Comscore Panelists. A Facebook-added Reach of 0.10% Corresponds to 1,360 Additional Panelists Who did not Visit the Publisher’s Website between November and December 2020 Except through a Facebook Referral.

The visits metric tells a similar story: Facebook referrals made a fairly small contribution to most publishers, but benefited low-quality publishers more than others. Of all labeled publishers, 73.5% received 100 or fewer added visits from Facebook throughout the study period, and 83.2% received 200 or fewer (see Figure 3). But many low-quality publishers received thousands of Facebook-referred visits. This includes theblaze.com (+5,676 visits, a 59.3% increase), breitbart.com (+4,652 visits, a 21.0% increase), dailycaller.com (+2,354 visits, a 48.7% increase), thegatewaypundit.com (+1,690 visits, an 11.4% increase), and cnsnews.com (+1,028 visits, a 139.7% increase). Several of these publishers spread misleading narratives about a “stolen election,” particularly breitbart.com and thegatewaypundit.com (Election Integrity Partnership, 2021).

Facebook-referred visits for labeled news publishers. Each dot represents a publisher, and vertical lines show the median number of Facebook-referred visits in the respective category; +16 visits indicates that Facebook-referred panelists to the publisher’s website a total of 16 times during the study period.
In the days after the election Facebook made an “emergency change” to their News Feed algorithms that intended to reduce the spread of misleading narratives and improve overall “news ecosystem quality.” Facebook employees said the changes led to “a spike in visibility for big, mainstream publishers like CNN, The New York Times and NPR, while posts from highly engaged hyperpartisan pages, such as Breitbart and Occupy Democrats, became less visible” (Roose et al., 2020). The following research question (RQ3) explores what happened during this algorithmic intervention, and RQ4 puts the intervention in broader context.
RQ3: Facebook’s Tweak
Analysis for RQ3 focuses on what happened during Facebook’s intervention, mostly in terms of total visits to publishers’ websites. First, to estimate when Facebook implemented the intervention, we apply a change point detection algorithm from the ruptures python package (Truong et al., 2020) to identify when the intervention was put in place and when it concluded. We use Facebook-referred daily visits to each category as the time series. Since low-quality local publishers received very few referred visits from Facebook, we exclude the category from this analysis and use the others as a three-dimensional time series for the segmentation algorithm.
The dynamic programming segmentation algorithm identifies November 10 as the first change point in this time series and December 10 as the second change point. These dates align with reports that the intervention began after the election (Roose et al., 2020) and ended a “few days” before December 16 (Roose et al., 2020), suggesting these dates as a plausible approximation of the intervention period.
To estimate the effect of Facebook’s intervention, we use regression discontinuity models from the beginning of the study period (October 1) to the estimated end of the intervention period (December 10). Figure 4 plots regression discontinuity models for Facebook-referred visits, with November 10 as the discontinuity point.
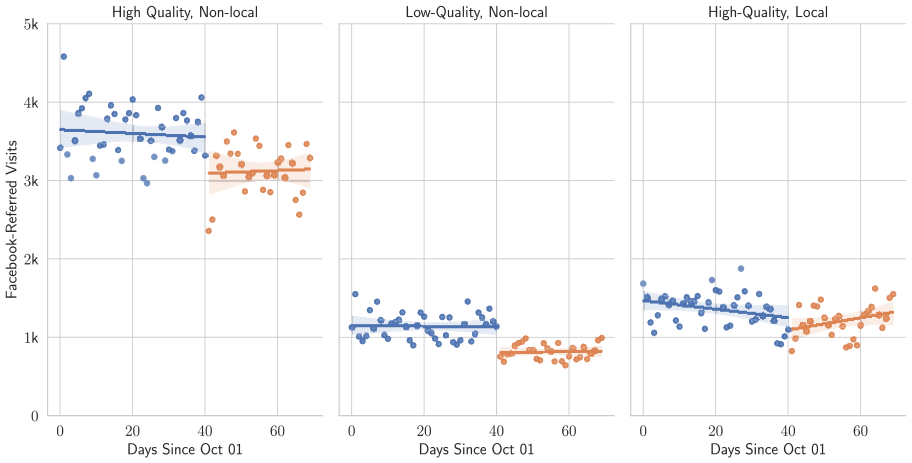
Regression discontinuity models predicting Facebook-referred visits using November 10 as the discontinuity point. The discontinuity is statistically significant (p < .01) for high-quality non-local publishers (left) and low-quality non-local publishers (center), but not statistically significant for high-quality local publishers (right).
The high-quality non-local and low-quality non-local models return a statistically significant treatment effect (p < .01) on Facebook-referred visits, with decreased visits for both categories during the intervention period. Facebook’s intervention was associated with 288 fewer Facebook-referred visits per day to the set of low-quality non-local publishers (95% CI = [149, 427] fewer daily visits)—a 25.1% reduction in daily visits. For the set of high-quality non-local publishers, Facebook’s intervention was associated with a 12.6% reduction in daily visits (456 fewer visits per day, 95% CI = [140, 772] fewer daily visits). The effect on high-quality local publishers was not statistically significant.
For a more granular look at the intervention, we analyze Facebook-referred visits to each publisher’s website using the Dickey–Fuller test for time series stationarity (MacKinnon, 1994). Running this test on thousands of publishers introduces the multiple comparisons problem, so that, we apply Holm’s (1979) method for p-value correction, with a p-value cutoff of .05. This correction method, also called the Holm–Bonferroni method, builds upon the standard Bonferroni correction method (Bonferroni, 1936), and comparisons of the methods have shown Holm’s procedure to be more robust (Aickin & Gensler, 1996).
In total, 1,719 publishers had sufficient daily visits to run the time series stationarity test. Of the publishers tested, 82.9% did not experience a statistically significant change in Facebook-referred visits from October 1 through December 10 (the end of the intervention), and 82.8% did not experience a statistically significant change in Facebook-added reach. In other words, referrals from Facebook were stable for the vast majority of publishers.
Notably, referrals from Facebook were stable for high-quality publishers that reportedly would have experienced a “spike in visibility” from Facebook’s intervention (Roose et al., 2020). This suggests that any increase in visibility within Facebook did not translate to additional visits to these publishers’ websites. Figure 5 shows Facebook-referred visits per day for npr.org, nytimes.com, and cnn.com—three publishers that Facebook considered “authoritative” (Roose, 2020). While public reporting states that Facebook increased the visibility of these websites during the “tweak” to their algorithm, the intervention period does not correspond to any statistically significant changes in terms of total visits, Facebook-referred visits, or the portion of total visits referred from Facebook. Dickey–Fuller tests suggest that each series in Figure 5 is stationary.

Daily visit metrics for three high-quality non-local publishers from October 1 to December 10 (the estimated end date of Facebook’s intervention). MacKinnon’s approximate p-value for the augmented Dickey–Fuller test suggests all nine time series in this Figure are stationary (i.e., a unit root exists for each). Thus, Facebook’s intervention is not associated with any statistically significant changes in daily visits to these three websites, as was the case for 82.9% of all websites tested.
Figure 5 also illustrates that Facebook’s contribution was stable during the study period as a proportion of total visits to the three sites—cnn.com (4.03% on the median day), npr.org (9.89% on the median day), and nytimes.com (median = 5.67% on the median day). This stable proportion further suggests Facebook’s contributions to desktop traffic followed a sort of equilibrium.
Since the Comscore data set does not include visibility within Facebook (i.e., what people see in their Feeds), we conclude the results with analysis of the Facebook URL shares data set. Granular time series analyses are not possible in the Facebook data set, since it is aggregated by month and treated with Gaussian noise (Messing et al., 2020). Still, Facebook’s data are more comprehensive than the Comscore panel and they allow for high-level analysis of visibility within Facebook.
RQ4: Long-Term Visibility Within Facebook
The prior research questions (RQ1–RQ3) estimate Facebook’s contributions based on daily traffic among Comscore panelists. But how do these contributions compare to larger-scale, longer-term trends of visibility within Facebook? The Facebook URL shares data set offers monthly estimates of the total internal views received by each publisher in the study. The codebook (Messing et al., 2020) describes the “view” count as the “number of users who viewed a [Facebook] post containing the URL.”
Even when analyzing views within Facebook, the URL shares data set suggests no substantial changes associated with the post-election “tweak” to improve news ecosystem quality. As shown in Figure 6, the five publishers publicly described as being impacted by Facebook’s post-election “tweak” saw no significant changes in November 2020.
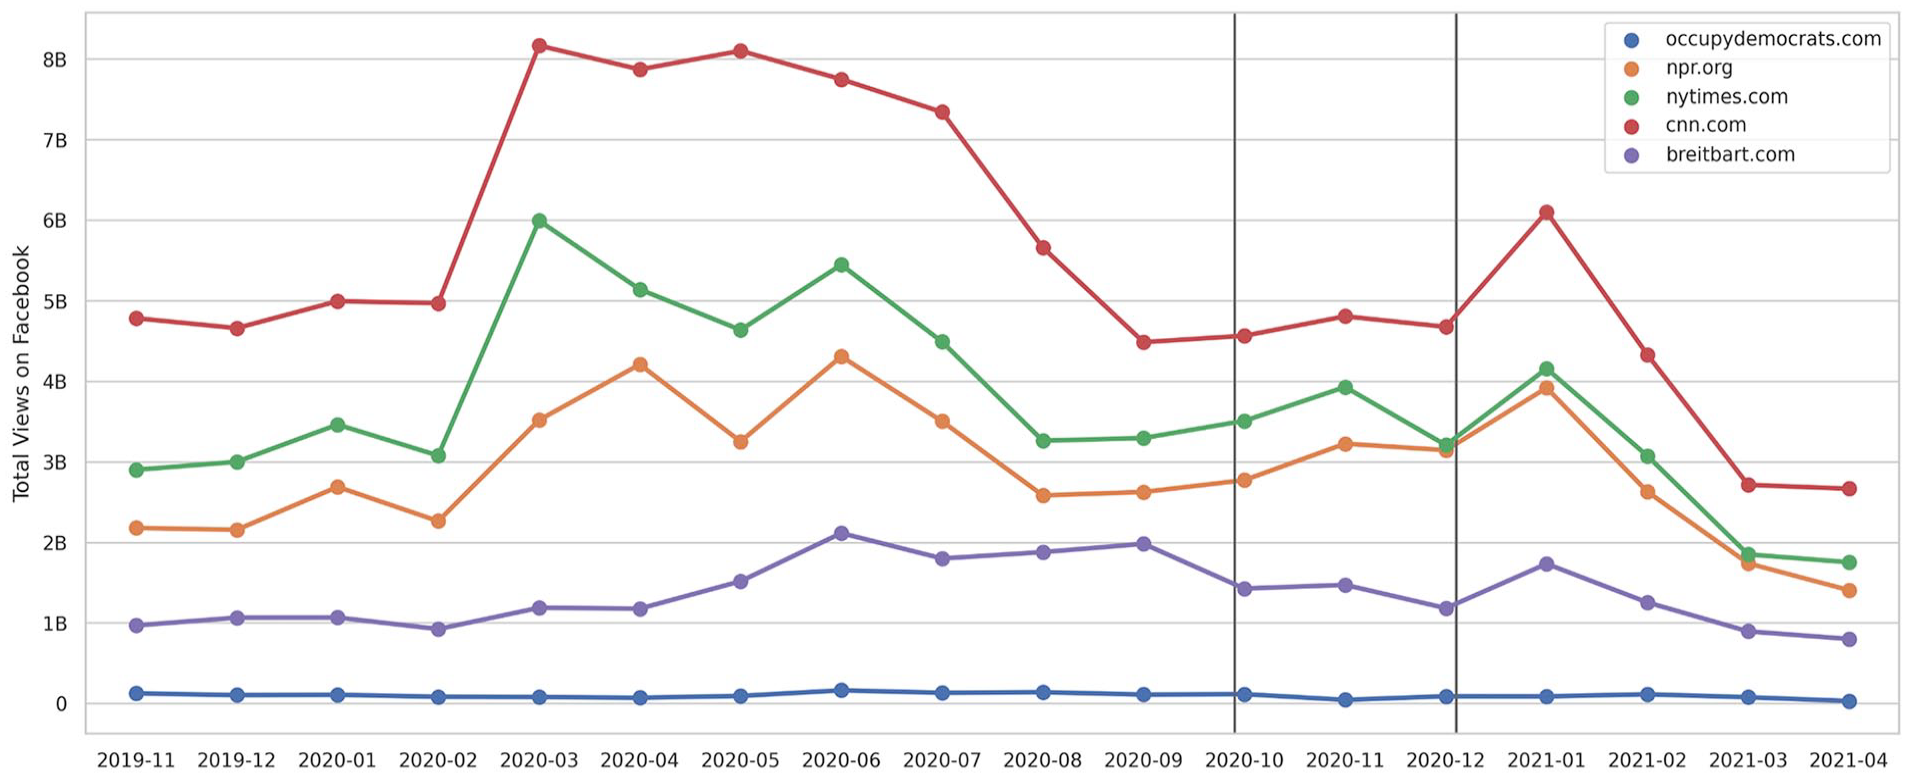
Total views of URLs on Facebook for five publishers, which were impacted by the “tweak” to improve news ecosystem quality. Gray lines surround the 3-month period analyzed in RQ1–RQ3, within a broader 18-month window.
Both visual inspection of Figure 6 and formal time series analysis suggest a sustained disruption starting in early 2020 and lasting for 5–6 months. Change point analysis (again via the ruptures package) suggests this disruption lasted from April 2020 through September 2020, coinciding with the first wave of COVID-19 infections in the United States.
Daily measurements may reveal other changes in visibility during the election period and/or the post-election intervention, but daily metrics are currently not available in the Facebook URL shares data set. We describe potential frameworks for daily analysis and other potential future work in the following section.
Discussion
This study has explored Facebook’s contribution to news audiences during the 2020 US election season, using a panel of 1.3 million desktop users. It finds that Facebook referred 3.1% of all panelists to publishers in our data set and ranked as the fourth largest source of external referrals (RQ1). We also show that Facebook amplified low-quality publishers more than other publishers (RQ2). Finally, analysis shows that Facebook’s “tweak” to the News Feed algorithm after the election had mixed success, with the vast majority of websites statistically unaffected (RQ3) and minimal impact in terms of long-term, month-to-month traffic (RQ4). Here, we discuss some key implications of our findings.
Facebook Decisions Versus Audience Decisions
When it comes to platforms like Facebook and their influence on the news ecosystem, an important recurring question from prior work is whether audience decisions outweigh structural factors such as platform design and algorithmic ranking. For instance, Bakshy et al. (2015) argued that audience decisions influenced exposure more than Facebook’s algorithms, while work by Malik and Pfeffer (2016) suggests that platform-wide changes can have a systemic impact. Our results demonstrate Facebook’s systemic influence in several ways.
First, RQ1 shows that Facebook was the fourth largest source of referrals to news publishers, referring 3.1% of all panelists to one of the labeled news websites in our data set. This equates to 6.9% of the subset of panelists who visited Facebook. Extrapolating 6.9% to an estimated 231.1 million US Facebook users 6 in 2020, 7 we can roughly estimate that Facebook referred 14.6 million US users to news publishers during the study period—more than double the popular vote margin in the 2020 US presidential election (7.1 million) (Federal Election Commission, 2020).
But clarifying the scale of Facebook’s impact still leaves an open question: would publishers reach the same audience anyway? For 89.9% of publishers in our data set, we found that Facebook referrals extended their audience reach by 0.01% (136 of 1.3 million panelists) or less. In other words, 89.9% of publishers reached essentially the same audience with or without Facebook referrals, as panelists often visited the same publishers through other means (e.g., direct traffic or search engines).
However, we found evidence that Facebook disproportionately amplified low-quality news websites, both in terms of audience reach and total visits. Several low-quality websites (e.g., dailywire.com, theblaze.com, awm.com, and pjmedia.com) more than doubled their audience reach from Facebook referrals, meaning most of their audiences did not visit the publisher through other means. In these cases, Facebook had a systemic impact that outweighed audience decisions and amplified low-quality, non-local publishers.
Our analysis of Facebook’s intervention (RQ3) adds further evidence of their systemic impact. After Facebook adjusted the News Feed algorithms to emphasize “news ecosystem quality,” daily visits to low-quality publishers dropped by an estimated 288 visits per day among panelists. Roughly extrapolating this effect on 1.3 million panelists to Facebook’s 231.1 million US users, referrals to low-quality publishers could have been reduced by approximately 51,200 visits per day. Facebook’s ability to make such an impact raises important questions about the platform’s ability to influence news audiences (including potential voters) during election seasons.
At the same time, Facebook’s influence depends on the boundaries and contexts within which it is understood. In some ways, our findings demonstrate that Facebook may not be as dominant of an influence over news consumption as some writers and researchers have worried. In the main 3-month study period, Facebook was one of the largest referral sources, and their algorithmic “tweak” had statistically significant influence. However, within a broader, 18-month study period (RQ4), there were no discernible changes associated with the post-election tweak. In short, the framing of “Facebook decisions vs. audience decisions” proves to be a false “either/or” binary, and a co-constitutive “both/and” framing is more helpful in many contexts.
Facebook and Elections
Social media platforms have the potential to influence voters’ ability to make well-informed voting decisions in democratic elections. This study found that Facebook referred 1.1% of panelists to low-quality news websites—consistent with the notion of a “relatively small” audience that is common in prior work (Moore et al., 2022). However, this portion amounts to a substantial impact on audiences when extrapolated to Facebook’s scale: 1.1% of the estimated 231.1 million US Facebook users would amount to 2.5 million people that Facebook referred to some kind of low-quality, misleading, and/or deceptive publishers during the election season.
Perhaps more concerning is that many low-quality publishers relied on Facebook to reach most of their audience and attract more visits. This includes sites such as breitbart.com and thegatewaypundit.com, which spread misleading narratives about a “stolen election” (Election Integrity Partnership, 2021). At the same time, we observed minimal referral traffic from Facebook to pink slime websites (low-quality local publishers; Bengani, 2020a), suggesting that low-quality publishers cannot consistently rely on amplification from Facebook.
Facebook also had a negligible impact on high-quality local publishers, adding to growing concerns that algorithmic platforms fail to elevate local news and information (Fischer et al., 2020; George & Hogendorn, 2020; Toff & Mathews, 2021; Weber et al., 2019). This can be seen as both a shortcoming and a promising opportunity. Researchers, platforms, and journalists should explore methods for connecting local publishers to their relevant audiences, especially since people in the United States tend to trust local news more than national news (Fioroni, 2022). Furthermore, local news is associated with increased civic engagement (Shaker, 2014), reduced polarization (Darr et al., 2018), and greater public accountability (Gao et al., 2020), thus benefiting communities online and offline.
Overall, our results do not characterize Facebook as having a uniformly positive or uniformly negative impact. On one hand, many low-quality publishers substantially increased their audience due to Facebook referrals, while high-quality local publishers hardly benefited. On the other hand, it could have been worse, as Facebook did not increase audience reach for pink slime websites. Additional data may be helpful to paint a more detailed picture of Facebook’s impact, for example, through further analysis of visibility within Facebook and its impact on exposure. This points to one of several limitations worth mentioning from our study.
Limitations
Some important limitations apply to this study, many of which stem from common challenges in platform research that also create limitations for related work. First and foremost, our analysis relies on panel browsing data that do not include mobile traffic. This is a significant limitation and we encourage future work to explore methods that account for traffic from mobile apps as well as general mobile browsing. Relatedly, the panel is limited to US adults and should not be generalized to other countries or age demographics.
Another set of limitations relates to granularity. Our analysis offers a broad characterization of Facebook’s impact at the expense of some finer-grained details. As in related work, our results measure reach and visits at the website (i.e., domain) level rather than the page level, which obfuscates some audience behavior across different pages and sections. For example, two panelists may have visited usatoday.com, but one may have visited a weather article while another visited an opinion article. Our analysis counts these visits the same, even though they have different implications. The four categories used to label publishers’ websites are also rather broad, and future work might use more granular labels for publishers and/or pages.
Our study also analyzes the impact of Facebook’s platform as a whole, rather than isolating a specific feature, such as advertisements, the News Feed, groups, messages, and/or the news tab. When we did analyze the impact of a specific feature (Facebook’s post-election intervention), we had to estimate when it was in effect, and only measured its impact on visits to news publishers—not visibility within Facebook (i.e., when a publisher shows up in the News Feed, but the user does not click on it). Finally, the analysis focuses on direct referrals from Facebook (e.g., facebook.com to cnn.com) and therefore likely underestimates Facebook’s impact. We expect some of Facebook’s impact on audiences was indirect, for example, some Facebook users likely reached additional websites from Facebook referrals (e.g., facebook.com to cnn.com to usatoday.com), and some users likely saw content on Facebook and then spread it further through other channels (e.g., messaging, word-of-mouth, or other social media platforms).
The Facebook URLs data set used for RQ4 addressed two key limitations of the Comscore panel data, allowing analysis of URL visibility within Facebook and also accounting for mobile traffic. However, the Facebook data provide monthly rather than daily metrics, thus limiting analysis of the post-election intervention (estimated to be in effect from November 10 to December 10). The monthly aggregation makes it difficult to isolate the day-to-day changes associated with the tweak. It is also impossible to analyze other specific Facebook features, such as advertisements, the News Feed, groups, messages, and/or the news tab, and the data set does not include the vast majority of Facebook posts that do not contain a URL. Future work may explore methods to account for these specific features, and also analyze these features during non-election periods.
While the two data sets each have their own limitations, preliminary analysis shows alignment and suggests desktop-only click behavior is a useful proxy for overall click behavior that includes mobile traffic. To explore this, we analyzed monthly click metrics (November 2020–December 2020) in Comscore data and Facebook data for each of the 3,247 publishers. Across all publishers, the Pearson correlation coefficient between Facebook-referred visits (from Comscore data) and URL clicks (from Facebook data) was 0.77 (p < .01). This statistically significant relationship suggests a meaningful degree of validity in the Comscore data for the purposes of this study, however, longer time frames (e.g., multiple years), more granular data (e.g., daily clicks on Facebook), and more extensive analysis (e.g., statistical modeling), could be helpful in future work.
Future Work
A number of open questions remain for future research into algorithmic platforms and their impact on the news ecosystem. For one, future work might address the limitations of our study by incorporating mobile data, accounting for potential exogenous factors, and/or conducting more granular analysis (e.g., at the page level rather than the domain level). Furthermore, future work might shift or expand the scope of this study. We focused on one particular platform (Facebook) at one particular time (the 2020 US election season) and in one geopolitical context (the United States). Researchers might explore other platforms, other time periods, and/or other geopolitical contexts. For instance, analysis focused on January 2021 could offer further insight into the tangible political influence of Facebook, especially if performed as a comparative analysis that includes other platforms like Google and Twitter.
Given that Facebook referred 3.1% of all panelists to news websites, another important area of inquiry is what posts and sources people see when they browse exclusively on Facebook (or other platforms). Future work might benefit from analyzing a wider range of websites (rather than just news publishers). It could also expand the scope to account for Facebook’s indirect impact, in addition to direct referrals. For instance, news content posted on Facebook includes a snippet of information, which may stimulate comments, information uptake, or sharing, even if users did not click through to visit the original publisher. On the other hand, future work might narrow the scope even further, such as by focusing on local news publishers.
Finally, the research questions in this study were platform-centric, and future research might pursue more audience-centric analyses. Such analyses might explore demographic attributes for the 3.1% of panelists that Facebook referred to publishers, and/or the 1.1% of panelists that Facebook referred to low-quality publishers.
Conclusion
In conclusion, this work has explored Facebook’s impact on news audiences using desktop internet browsing data from a panel of 1.3 million US adults. It contributes new empirical findings about algorithmic platforms and their influence on democratic elections, with some of the first real-world exposure data surrounding the 2020 US presidential election. Our analysis shows that Facebook only referred 3.1% of panelists to news publishers (RQ1). While panelists often visited the same publishers’ websites through other means, we find that Facebook disproportionately amplified low-quality, non-local publishers (RQ2). Finally, we show that Facebook’s post-election intervention had mixed effects (RQ3): it reduced daily visits to low-quality non-local publishers, but also reduced visits to high-quality non-local publishers, and the vast majority of publishers were statistically unaffected. We also observe limited changes in comprehensive month-over-month traffic provided by Facebook (RQ4). Taken as a whole, this study contributes large-scale empirical evidence that demonstrates and clarifies Facebook’s role in the news ecosystem. In addition to providing new information about Facebook and the 2020 election, the study contributes new evidence of Facebook’s impact on local news publishers, as well as an analysis that isolates a specific change that Facebook made to their algorithm. The study also motivates further research into other influential platforms, as well as further analysis of Facebook’s “internal audience” and the content people see while on the platform.
Footnotes
Acknowledgements
The authors appreciate support from the Medill School of Journalism, Media, Integrated Marketing Communications at Northwestern University, as well as the Kellogg School of Management, for providing data access that supported this study. They also acknowledge the insightful feedback and constructive comments provided by anonymous reviewers of this study.
Declaration of Conflicting Interests
The author(s) declared no potential conflicts of interest with respect to the research, authorship, and/or publication of this article.
Funding
The author(s) received no financial support for the research, authorship, and/or publication of this article.