
Abstract
Many states in the United States allow a “belief exemption” for measles, mumps, and rubella (MMR) vaccines. People’s opinion on whether or not to take the vaccine can have direct consequences in public health. Social media has been one of the dominant communication channels for people to express their opinions of vaccination. Despite governmental organizations’ efforts of disseminating information of vaccination benefits, anti-vaccine sentiment is still gaining momentum. Studies have shown that bots on social media (i.e., social bots) can influence opinion trends by posting a substantial number of automated messages. The research presented here investigates the communication patterns of anti- and pro-vaccine users and the role of bots in Twitter by studying a retweet network related to MMR vaccine after the 2015 California Disneyland measles outbreak. We first classified the users into anti-vaccination, neutral to vaccination, and pro-vaccination groups using supervised machine learning. We discovered that pro- and anti-vaccine users retweet predominantly from their own opinion group. In addition, our bot analysis discovers that 1.45% of the corpus users were identified as likely bots which produced 4.59% of all tweets within our dataset. We further found that bots display hyper-social tendencies by initiating retweets at higher frequencies with users within the same opinion group. The article concludes that highly clustered anti-vaccine Twitter users make it difficult for health organizations to penetrate and counter opinionated information while social bots may be deepening this trend. We believe that these findings can be useful in developing strategies for health communication of vaccination.
Introduction
Measles is a highly contagious disease and before the widespread coverage of measles vaccinations in the 1980s, it had caused an estimated 2.6 million deaths each year before the introduction of measles vaccine. Immunization is often considered to be the most successful medical intervention with significant reduction in morbidity and mortality from infectious diseases (Hobson-West, 2003). However, in some developed countries, measles, mumps, and rubella (MMR) vaccine refusal rate is becoming higher. Measles outbreaks happen each year even though the majority of the population have easy access to the vaccination. Parents who refuse to vaccinate their children are often skeptical about the safety of the MMR vaccine and consider mandatory vaccinations as violations of personal freedom of choice. One common argument against vaccination is the linkage between MMR vaccine and autism, which originates from Andrew Wakefield’s well-known research published in The Lancet claiming the correlation between the MMR vaccine and autism, although the study was later proved to be incorrect and thus was retracted by The Lancet from the publication record (Wakefield et al., 1998). Other than the fear of those risks, some parents believe in homeopathy, seeing health as evidence of human body’s natural and automatic efforts of heal itself, in contrast of the common belief that health is the absence of disease (Frank, 2002; Meyer & Reiter, 2004).
Some states in the United States allow for medical and/or non-medical exemptions (i.e., for religious and philosophical reasons). The US Centers for Disease Control and Prevention (CDC) and the World Health Organization (WHO) have made efforts to propagate information regarding the benefits of MMR vaccine for minimizing personal risk of measles infection and for minimizing the social risk of measles outbreaks. Social media is considered to be a communication channel with advantages over traditional mass media for its possibility of reaching out a bigger audience and smaller communities (as will be discussed in section “Related work”). For instance, the WHO (n.d.) published the Global Vaccination Action Plan for 2011–2020, which emphasizes that social media should be taken advantage of to build trust with the public.
Even with current social media strategies, measles outbreaks are still happening in several developed countries including the United States. In this article, we aim to explore the communication patterns of vaccine discussions in Twitter. More specifically, we will answer the following research questions: first, do vaccine discussions on Twitter show a highly clustered pattern in the sense that users tend to communicate more often with those who have same opinions toward vaccination than those who do not? Second, if the communication is highly clustered, to what extent do pro-vaccine users reach out to anti-vaccine users (i.e., anti-vaxxers) and vice versa? Third, how much do social bots, computer algorithms designed to mimic human behavior and interact with humans in an automated fashion, contribute to the conversation, as previous research has shown that social bots can have certain impact on human communication in social media? (Boshmaf, Muslukhov, Beznosov, & Ripeanu, 2013; Ferrara, Varol, Davis, Menczer, & Flammini, 2016; Lazer et al., 2018). To answer these research questions, we use machine learning to label each user’s vaccination stance, which allows us to quantify the communication result with higher fidelity and accuracy than keywords counting or dictionary-based methods. In the remainder of this article, we first discuss related work with respect to the vaccination debate and social network analysis methodologies (section “Related work”), before outlining our methodology in section “Methodology.” We then move onto the results (in section “Results”) and provide a discussion of our findings and highlight areas of future research in section “Contribution, discussion, and future work.”
Related Work
Over the last several decades, a rich body of work has been carried out with respect to vaccination uptake. These works include vaccine refusal and hesitancy, reasons of anti-vaccine sentiment, and strategies of improving vaccine uptake (Dubé et al., 2013; Dubé, Vivion, & MacDonald, 2015; Kumar, Chandra, Mathur, Samdariya, & Kapoor, 2016; Luyten, Desmet, Dorgali, Hens, & Beutels, 2014; Ritvo et al., 2003). However, current public health strategies concerning the benefits of vaccination are often considered ineffective due to their lack of information and lack of persuasive power (Poland & Jacobson, 2011). Public health messages on vaccination are sometimes vague or merely dry probability statements, even though they are evidence-based scientific research (Dubé et al., 2013; Reyna, 2012). As people are always searching for meaning, unexplained adverse health outcomes such as the link between MMR vaccine and autism propagates. In addition, the literature has identified that the role of health care workers is crucial for conveying positive and effective messages about vaccination (Bester, 2015; Omer, Salmon, Orenstein, deHart, & Halsey, 2009; Tafuri et al., 2014).
Research on the upsurge of anti-vaccine sentiments shared on social media and the Internet more broadly has gained attention over the past few years. Social media has been shown to both benefit and challenge vaccination uptakes (e.g., Betsch et al., 2012; Radzikowski et al., 2016; Rosselli, Martini, & Bragazzi, 2016; Stefanidis et al., 2017; Wilson & Keelan, 2013). It has also been found that the anti-vaccine stance is often supported by conspiracy theories and is sometimes dominating the social media debate about vaccination (Dredze, Broniatowski, Smith, & Hilyard, 2016; Mitra, Counts, & Pennebaker, 2016; Salathé & Khandelwal, 2011). To examine vaccination sentiments, social media data have been collected and analyzed in real time to build effective media surveillance systems and develop more timely strategies to counter anti-vaccine sentiments (Larson et al., 2013). There is also research using Internet search engine data on vaccinations, which has shown that for pro-vaccine or anti-vaccine users, the same messages have different impacts on their future browsing choices (Yom-Tov & Fernandez-Luque, 2014).
Methodology wise, combining social network analysis with sentiment analysis techniques provides a new way to explore such information especially when it comes to opinions in social media (Meyer & Reiter, 2004). Traditional research approaches that have treated sentiment as independent and identically distributed are not sufficient to handle the complexities of short, noisy social media data, and it has been argued that this leads to substantial information loss (Pozzi, Fersini, Messina, & Liu, 2016). One active area of research is to detect partisan segregation within social media by tagging users into different political groups and analyzing how such tagging information relates to network communities that form (e.g., Conover et al., 2011; Yardi & Boyd, 2010). For health topics, Zhou et al. (2015) have used social media information to enhance results of machine learning classification to identify negative sentiment on human papillomavirus (HPV) vaccines in Twitter. By applying various community detection algorithms and centrality measures, Bello-Orgaz, Hernandez-Castro, and Camacho (2017) demonstrated how data mining techniques can be utilized to enhance online health strategies. However, most research exploring polarity of sentiment within social media do not take into consideration the role of social bots, which have seen a rise in activity over recent years. There are currently only a handful of studies that analyze the effects of social bots. Most of these are within politically charged online conversations, including the United Kingdom’s Brexit referendum (Howard & Kollanyi, 2016), the ongoing Ukraine–Russia conflict (Hegelich & Janetzko, 2016), and the 2016 United States Presidential Election (Bessi & Ferrara, 2016). Research efforts dedicated to analyzing social bot influence in online vaccination discussions primarily stem from the 2015 Defense Advanced Research Projects Agency (DARPA) Twitter Bot Challenge (Subrahmanian et al., 2016). This particular challenge tasked research teams to detect known “ground truth” social bots supportive of pro-vaccination sentiment within Twitter conversations. Mønsted, Sapieżyński, Ferrara, & Lehmann (2017) conducted a large-scale information diffusion experiment in Twitter using social bots to deliver intervention-related messages, including a message to encourage users to vaccinate. More recently, Broniatowski et al. (2018) analyzed the messaging patterns and effects of known Russian troll accounts and limited samples of detected social bots within various online vaccination conversations from July 2014 through September 2017. It discovered that accounts classified as bots posted vaccine-related content at higher rates than average users but provide equal attention to both pro- and anti-vaccination sentiment. While previous research has used similar methods in isolation, we have combined community detection that is often used in analyzing segregated online political discourse with machine learning and bot detection. The next section explains our methodology in further detail.
Methodology
To understand the rise of various vaccine-related groups and opinions on social media, this research uses the combination of sentiment analysis with machine learning and community detection on online social networks to unveil the communication patterns of pro-vaccine and anti-vaccine users on Twitter. Following this, we explore the role of social bots in such communication pathways. The steps of the process are outlined in Figure 1. Specifically, we first needed to collect the Twitter data (section “Data”), however, since tweets are short and messy, the data corpus needed to be cleaned (section “Preprocess”). The tweets can then be converted to features (e.g., unigrams or bigrams), after which we are able to use such features for training a variety of classifiers (section “Machine label”). Thus far, the focus has been on identifying each user’s opinion (i.e., as a pro-vaccine, anti-vaccine, or neutral user), we then constructed a retweet network to understand how in-group and cross-group communicate (section “Building a retweet network”) in the structural communities detected in the retweet networks (section “Community detection”). Section “Bot detection” describes how we carried out the bot analysis. These steps, shown in Figure 1, are further elaborated in the following subsections.

Steps used in our study to unveil the communication patterns of pro-vaccine and anti-vaccine users on Twitter with bot detection and analysis.
Data
We use Twitter data collected using a geosocial system (Croitoru, Crooks, Radzikowski, & Stefanidis, 2013) from 1 February to 9 March after the measles outbreak in California Disneyland in 2015 with keywords related to vaccination. The keywords included “vaccination” and its derivatives, that is, “vaccine,” “vaccines,” “vax,” “vaxine,” and “vaxx.” This measles outbreak began with the first suspected case identified on 5 January 2015 and cases were reported up until end of February 2015.
According to the CDC, this caused total 147 cases of infections and almost 45% of the patients were unvaccinated. We choose this period of time for analysis because this event stirred a high-volume of discussion on MMR vaccine online, which prompted California to change its state legislation from allowing medical, philosophical, religious exemptions to only allowing medical exemptions. Thus, this time frame provides us with a valuable opportunity to understand the narrative and online communicative patterns in regard to vaccination. Over the study period, we collected 669,136 tweets published by 268,055 distinctive users in total. Since the objective is to analyze how anti-vaccine and pro-vaccine users communicate on Twitter, we first have to identify each user’s ideological group. As a subtask of sentiment analysis, we completed polarity classification using supervised machine learning. To carry out supervised machine learning, we needed some hand-labeled tweets. We hand-labeled a small portion of the dataset to three class labels: pro-vaccine, anti-vaccine, and neutral to vaccine. However, to decide which tweet belongs to which ideology class is subjective as interpretations of subtlety expressed opinions may differ. Table 1 is an example of the hand-label results. Note that in the dataset, very few tweets expressed real “neutral opinions” toward vaccination with no leaning toward either pro- or anti-vaccine. Therefore, we defined “neutral” as tweets that reported certain facts, which are often news articles. It is well known that people often tweet jokes and sarcastic content in social media, which can be difficult for algorithms to identify. In this article, our machine learning model performs well without dealing with sarcasm separately. The reason for this could be related to the fact that our dataset is very domain-specific. Even for sarcastic tweets, there are certain words that users with a certain opinion like to use. For instance, anti-vaccine users like to use “big-pharma” and “#CDCwhistleblower,” while pro-vaccine users rarely do. In all, of the whole data corpus, 2% of it was hand-labeled following this heuristic. For interested readers, the hand-labeled tweets are available at: bit.ly/POVDT.
Examples of Hand-Labeled Tweets.

CDC = Centers for Disease Control and Prevention.
For classification, we trained different supervised learning models with different parameters to find the best-performing one. In the following subsections, we outline the steps for choosing features and models that achieved the best results.
Preprocess
We cleaned out contents such as emoji icons, URLs, “#,” and “@” from each tweet. By observing the data, we noticed that hashtags tended to store very important content. For instance, a lot of the anti-vaccine tweets contained “#CDCwhistleblower.” Therefore, instead of deleting the content of hashtags, we only deleted the “#” symbols and used the hashtag content as part of the content of tweets to train the models (as will be discussed in section “Machine label”). In addition, we lemmatized and spell-checked the tweets to make the model easier to train. Lemmatization is an important step for preprocessing textual data, as it allows for the grouping together different forms of a word as the same one, such as using “be” to include “am,” “is,” and “are.” By doing this, it helps make the features more general and therefore easier to classify.
Feature Extraction
After preprocessing the tweets, each tweet was converted into feature vectors that are learnable for the machine learning models. Three parameters need to be tuned with classifiers for vectorization: N-gram, weights of each feature, and minimum appearance of features. N-gram refers to ways of bagging words as features. Unigram means using one word as a feature, whereas bigram uses every two words as a feature, and so on. Also, not every feature has the same importance in classifying the tweet to either class. Some frequent words such as “but” and “of” appear frequently; however, they do not help classification because tweets from any class could contain such words. To overcome this, we used TF–IDF (term frequency–inverse document frequency), which gives higher weights for features that appear often in a given tweet but less often across the whole dataset. This technique filters out common words and enables classification model to perform better. Moreover, controlling minimum appearance of each feature helps to reduce dimensionality and make the model faster to train with less noise.
Machine Label
Multiple classifiers were trained with the labeled data, including logistic regression, support vector machine (linear and non-linear kernel), k-nearest neighbors, nearest centroid, and Naïve Bayes. Since the distribution of the three labels is disproportionate, we balanced class weights before training. After splitting the labeled data into training data (80%) and test data (20%), the parameters were tuned by k-fold cross-validation (k = 5) on the training data. The accuracy scores on the unseen test dataset showed that the support vector machine (SVM) with a linear kernel had the best performance. The parameters that generated best performance with the linear SVM are presented in Table 2.
Parameter Values That Generate The Best Performance With Linear SVM Classifier.

SVM = support vector machine; TF = term frequency; TF–IDF = term frequency–inverse document frequency.
Linear SVM achieved a mean accuracy of 70.70% and the best accuracy of 74.64%. It was higher than the majority class prediction baseline accuracy score of 45.61%, meaning that the content of the tweets has contributed to the prediction. Table 3 reports the performance metrics. Since this is a multi-label classification, the performance scores in Table 3 were based on their unweighted means.
Performance Measurements Of Linear SVM Classification Based on k-Fold Cross Validation (k = 5).

SVM = support vector machine.
Then, we used linear SVM with the tuned parameter to machine label the rest of the corpus (i.e., 659,489 tweets). After all the tweets were labeled, the labeled tweets were aggregated to decide users’ opinions. We used majority vote as a rule to aggregate tweet labels by each user, that is if a user has majority of his or her tweets labeled as one class, that user is identified as having an opinion of that class. By the majority vote rule, we assumed that people do not change their opinion within the data collection period of time (approximately 1 month), and users with tweets labeled as more than one class is due to its ~30% learning error rate. Table 4 presents the distribution of three classes with hand-labeled and machine-labeled. The sum of users is the number that users from each class added together and the total is the sum with no overlap between each class. With 268,055 distinctive users with their opinion labeled, their retweet network was then constructed.
Number of Tweets And Users in Each Class for Manual And Machine-Labeled Data.

Building a Retweet Network
If a user (user A) retweeted another user’s (user B) tweet once, an edge from user A to user B is created, and if the edge existed, add 1 to the edge weight. The network, therefore, is a directed and weighted one with 268,055 nodes and 214,550 edges. Out of all the nodes, there are 113,153 isolates (i.e., nodes that are not connected with any other nodes in the network). Since the isolates did not participate in the communication process, we took the giant component of the network, which has 154,902 nodes and 214,550 edges in total.
Community Detection
The Louvain method is a widely used community detection method for large-scale network that is based on modularity maximization (Blondel, Guillaume, Lambiotte, & Lefebvre, 2008). This algorithm first looks for small communities by optimizing modularity locally and then repeats the process iteratively until a maximum modularity is reached. This method does not predefine the number of communities to be detected but creates hierarchical communities from the bottom up. The major drawback of the modularity optimization-based community detection algorithm is that it cannot identify communities under a certain size. Therefore, one important parameter to be determined is the “resolution” which affects the size of the smallest community to be detected.
When alternating several resolution options on this network using a social network analysis and visualization tool named Gephi (Bastian, Heymann, & Jacomy, 2009), we noticed that several general patterns remained constant: first, a large number (i.e., ~8000) of communities were detected with less than 10 “big” ones. Second, the number of the big communities (i.e., more than 4% of the nodes) remained similar. The rest of the analysis was based on community detection using a resolution that is equal to 3. With the four big communities constituting the majority of the nodes (66.18%), we can now present the results by analyzing the combination of the structural communities and opinion groups of these four big communities.
Bot Detection
To determine the presence of bots within the corpus of tweets in this study, we extracted the associated Twitter usernames of all tweet, retweet and response users. We then submitted the resulting 268,055 distinct usernames for bot classification via the open-source DeBot detection platform (Chavoshi, Hamooni, & Mueen, 2017). We deliberately selected the DeBot platform for bot classification based upon its available archival repository of historically detected bot accounts, which was necessary given the age of our tweet corpus in this study and its overall performance in comparison to other available detection systems. DeBot relies upon an unsupervised warped correlation method focusing on synchronous activities of Twitter accounts and has historically proven to outperform other bot detection platforms in terms of precision, including internal Twitter efforts, by a wide margin (Chavoshi, Hamooni, & Mueen, 2016; Chavoshi et al., 2017). Broniatowski et al. (2018) limited bot classification to just a sampling of its overall tweet corpus because that study used the Botometer bot detection platform (Davis, Varol, Ferrara, Flammini, & Menczer, 2016). Botometer requires account processing within a relatively narrow period of time as it employs a supervised random forest learning method based on over 1,000 features derived from metadata and information extracted from Twitter interaction patterns and content (Varol, Ferrara, Davis, Menczer, & Flammini, 2017).
Results
Structural Communities and Opinion Groups
We identify two types of communities: (1) structural communities and (2) opinion groups. Figure 2 shows the result of community detection of the four biggest communities and how the opinions are distributed in these communities. Communities in Figure 3a are colored by belongings of structural communities: Community A has 26.48% of the total number of users and Communities B, C, and D has 17.77%, 12.79%, and 9.15% of the total number of users, respectively. The nodes in Figure 3b is colored by belongings of opinion groups—red refers to anti-vaccination users, blue refers to pro-vaccine users, and yellow is for users with neutral opinions.

Distributions of opinion groups in the four largest structural communities.
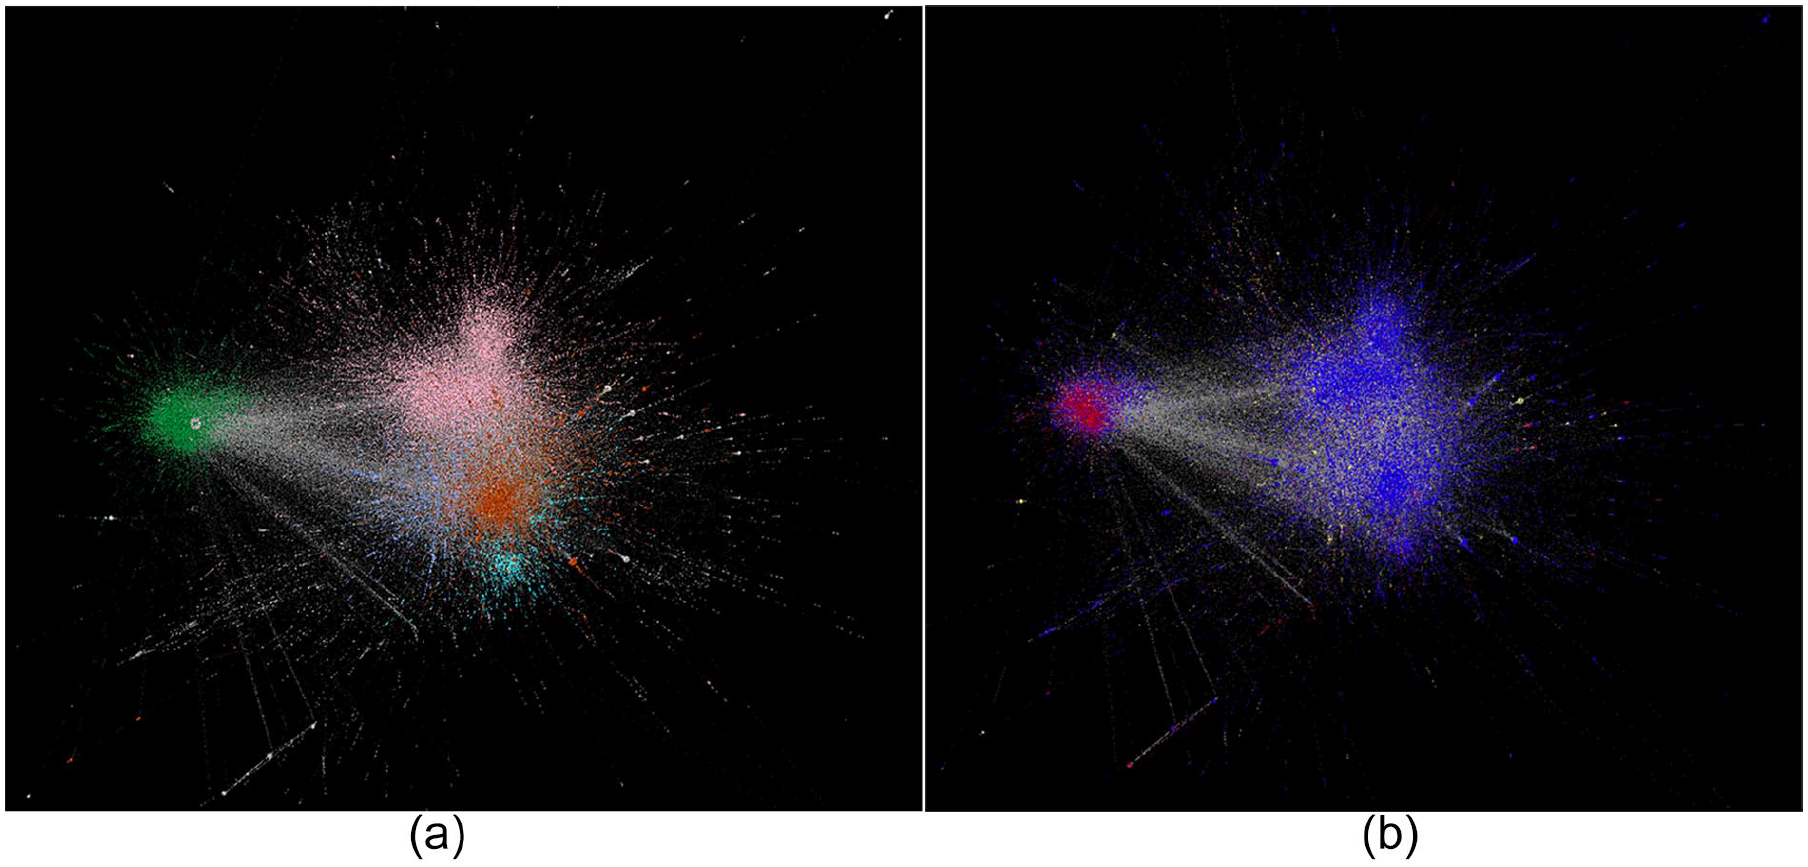
Network visualizations of the four largest communities (a) is colored by the belongings to a structural communities and (b) is colored by belongings to opinion groups.
By juxtaposing structural communities and opinion groups, we noticed that Communities A, B, and C are dominated by pro-vaccination nodes (i.e., blue nodes in Figure 3b), while Community D is dominated by anti-vaccination nodes (red nodes in Figure 3b). The neutral nodes (yellow), however, are distributed relatively evenly in multiple structural communities. Figure 2 shows the distributions of each opinions in every structural community.
In addition, the “anti-vaxxer” community (i.e., Community D) is not completely consisted of anti-vaxxers. Although anti-vaccine users have constant communication between themselves, there is also a small amount of constant communication between anti- and pro-vaccine users in this community. By examining the frequency of retweet activity of in-group and cross-group, we found that within the “anti-vaxxer” community, the cross-group communication is dominated by pro-vaccine users retweeting anti-vaccine users instead of vice-versa as shown in Figure 4. It indicates that anti-vaccine users tend to communicate with users of same opinion group, while pro-vaccine users communicate with both in-group users and out-of-group users (anti-vaccine users). This pattern holds true for communication across all users in this dataset as well. Figure 5 is the retweet patterns in the whole retweet network. Both anti-vaccine and pro-vaccine users have much higher retweet frequency in the in-group communication than in the cross-group communication. This “echo-chamber” like communicative pattern for anti-vaccine users has useful implications for public health strategies on social media, which is further discussed in section “Contribution, discussion, and future work.”

Frequency distributions of in-group and cross-group communication of the “anti-vaxxer” community (i.e., Community D).

Frequency distributions of in-group and cross-group communication of the whole retweet network.
Bot Analysis
Overall, the bot detection results obtained through DeBot classified 3,913 unique Twitter users as likely to be bots in our vaccination tweet corpus responsible for publishing 30,332 tweets, which represented 1.45% and 4.59% of all Twitter users and tweets, respectively, in this study. The breakdown for each opinion group is shown in Table 5. Over 77% of the user accounts identified as bots belonged to the pro-vaccine opinion group. Among all users, there are about 80% are pro-vaccine (Table 4). Therefore, although there are 77% bots which are pro-vaccine, proportionally, these pro-vaccine bots only contribute 1.51% toward all the pro-vaccine users. It is close to the result that 1.16% anti-vaccine users are bots. Therefore, there is no obvious difference of the opinion distributions among regular users and bot users.
The Results of Bot Detection.

Furthermore, we analyzed the communication frequencies between bots and between human and bots. We found out that 675 (3.38%) of the retweets are “bot-retweets-bot” and 8,452 (42.33%) are “bot-retweets-human,” and 10,838 (54.28%) are “human-retweets-bot.” In other words, bots prove themselves to be hyper-social in this conversation with 9,127 retweets being initiated by bots (i.e., the sum of “bot-retweets-bot” and “bot-retweets-human”).
Table 6 shows that among all the retweets that are initiated by bots, the number of retweets belongs to pro-vaccine, anti-vaccine, and neural to vaccine opinion group. It is interesting to see that the “echo chamber” like pattern exists in the bot-initiated communication as well, with pro-leaning bots primarily connecting with pro-target nodes (both bots and regular users). The same pattern holds true for the “anti-to-anti” pairs.
Retweet Analysis of Bot-Initiated Communication Among Opinion Groups.

Contribution, Discussion, and Future Work
This research has explored how opinion groups are distributed in structural communities in social media with respect to the vaccination debate. Our main research contributions are as follows:
We automate the identification of tweets with anti-vaccine, pro-vaccine, or neutral to vaccine using supervised machine learning algorithms. By doing so, it facilitates large-scale data analysis, which is complementary to most of the other research on vaccine refusal focusing on qualitative analysis of vaccine discussions.
We combine the results of labeled opinions with the retweet network community detection by identifying two kinds of “communities.” One community is a “structural community,” generated by network community detection algorithms based on the structure of the network, which is unrelated to how each node is labeled. The other community, “opinion group,” is defined by user’s attributes (opinions). It is similar to the concepts of member-based (characteristics of members) community and interaction-based (density of interactions) community in community detection algorithms (Bello-Orgaz et al., 2017). Investigating how two kinds of community interact with each other has been seen more often in political communication research and not in health communication. Moreover, in health communication studies, the tweets were generally hand-tagged and not automated. Therefore, we believe that this research sheds light on potential health communication strategies.
This research discovers that users with anti-vaccination opinions are highly segregated from users with pro-vaccination opinions while users with neutral opinions are distributed more evenly across different structural communities. Although overall the users are predominantly pro-vaccination, “anti-vaxxers” reside in their own enclosed structural community. It means that retweeting happens much more often within their own opinion groups than cross groups. This frequent in-group communication pattern also discovered in bot-initiated communication as well. Moreover, the less frequent cross-group communication is dominated by pro-vaccination users retweeting anti-vaccinations than the other way.
This research studies not only the overall trend of communication patterns within and across opinion groups but also social bots and their role in the discussions. We discovered that bots are hyper-social (1.45% bots producing 4.5% of retweets) and share similar retweeting behaviors as the overall pattern—retweeting from their own opinion group.
This research demonstrated the potential of using social media as a way to directly monitor the impact of pro-vaccine information in anti-vaccine communities, as health care professionals have focused a lot on designing more effective ways to disseminate information of the benefits of vaccination (e.g., Grant et al., 2015; Reyna, 2012). Using machine learning model to label a large number of tweets and the combination of two kinds of communities, we can learn about the communication within and across opinion groups on social media. Such a method provides a way to timely measure online vaccination discussions, in comparison with indirect measurements such as vaccine hesitancy rates. Our research also shows that currently, the cross-group communication is sparse for anti-vaccine users. This pattern echoes a theory in psychology named “intergroup contact hypothesis,” which argues that contact between members of different groups can reduce existing negative intergroup attitudes (Wright, Aron, McLaughlin-Volpe, & Ropp, 1997). In other words, an effective online strategy to change anti-vaxxer’s attitude might start from some “contact.” For instance, instead of producing dry statistics of why vaccination benefits everyone, health practitioners could produce more emotionally appealing content to at least “start the conversation” (Bean, 2011; Kata, 2010). Situating our findings within the research on the importance of health care workers (Bester, 2015; Tafuri et al., 2014), we believe that mitigating against the extreme online anti-vaccine opinions still (at least partially) requires offline efforts. In addition to the implications for health communication, the method used in this research that analyzes the combination of structural communities and opinion groups can be applied in various domains for interpreting communication within and across opinion groups. In terms of bot analysis, the classification of a majority of suspected bot accounts as pro-vaccination differs with the recent social bot participation findings of Broniatowski et al. (2018). This is not surprising as the emerging field of social bot research is still working toward establishing norms (Cresci, Di Pietro, Petrocchi, Spognardi, & Tesconi, 2017; Ferrara et al., 2016) and a multitude of different methodologies must be employed to account for the vast array of different types of social bots (Abokhodair, Yoo, & McDonald, 2015; Ciampaglia, 2018; Subrahmanian et al., 2016).
That being said, there are several limitations to this research. First, it lacks the picture of vaccine hesitancy continuum. Vaccine refusal is complex and hard to define (Dubé et al., 2013; Dubé et al., 2015; Kumar et al., 2016; Poland & Jacobson, 2011). Also, Twitter tends to provide us with a limited view of vaccine discourse because users with extreme opinions are often the most vocal group. In addition, during data preprocessing stage, we did not take emojis into consideration for the machine learning models. Emojis can potentially store useful information that help us increase machine learning accuracy rate, such as sarcasm identification when analyzed alongside the text of the tweets. For future research, we hope to improve our findings by including data such as emojis and other network data in the machine learning model. Also, in this research, we assumed that the opinion of each user did not change within the time frame of data collecting (~1.5 month). We used the “majority vote” when merging users tweets into opinion labels. However, it would be interesting looking into users’ tweet history over longer periods of time and see if opinions do change over time (Wang, Wang, & Zhu, 2013). Furthermore, our results might be skewed with respect to the timeframe of the study, which was just after the measles outbreak in California Disneyland and it would therefore be interesting to carry out the analysis over a more longitudinal timeframe and also without assuming each user (including each bot user) to have same opinion. However, work by Vraga et al. (2017) on the discussion of cancer in social media showed peaks of traffic during awareness months and little in other time frames, which could be broadly considered similar to the disease outbreak studied here. In addition, as Bello-Orgaz et al. (2017) found that influential users (i.e., those with high degree centrality) are often in pro-vaccine communities and Love, Himelboim, Holton, & Stewart (2013) discovered that no particular subject is dominating the vaccine conversation in Twitter, it would, therefore, be interesting for future research to explore whether “influential” users are more of those with high degree centrality or those who they agree, and thus understand what defines a user to be influential in the context of anti-vaccination or other highly divided online discussions (Cha, Haddadi, Benevenuto, & Gummadi, 2010). Other than influence, characterizing users in terms of partisanship can also be useful for understanding online vaccine discussions. Another area for future work would be to analyze data on other social media platforms (e.g., Facebook, blogs, online message boards) to investigate the formation and the dynamics of opinion distribution in structural communities and test if the findings in this article are seen elsewhere.
Footnotes
Acknowledgements
Declaration of Conflicting Interests
The author(s) declared no potential conflicts of interest with respect to the research, authorship, and/or publication of this article.
Funding
The author(s) received no financial support for the research, authorship, and/or publication of this article.
Author Biographies
![]() .
.