
Abstract
Crime monitoring tools are needed for public health and law enforcement officials to deploy appropriate resources and develop targeted interventions. Social media, such as Twitter, has been shown to be a feasible tool for monitoring and predicting public health events such as disease outbreaks. Social media might also serve as a feasible tool for crime surveillance. In this study, we collected Twitter data between May and December 2012 and crime data for the years 2012 and 2013 in the United States. We examined the association between crime data and drug-related tweets. We found that tweets from 2012 were strongly associated with county-level crime data in both 2012 and 2013. This study presents preliminary evidence that social media data can be used to help predict future crimes. We discuss how future research can build upon this initial study to further examine the feasibility and effectiveness of this approach.
Introduction
High crime rates negatively influence health-related quality of life, public safety, and economic growth (Dilulio, 1996; Ditton, Short, Phillips, Norris, & Armstrong, 1999; Furstenberg, 1971; Stafford, Chandola, & Marmot, 2007; Wallace, 1990). To date, law enforcement agencies have had to rely heavily on historical data, such as arrest patterns and crime rates, to identify areas vulnerable to crime (Chainey, Tompson, & Uhlig, 2008; Schoen, Gayo-Avello, Metaxas, Mustafaraj, & Gloor, 2013). To combat crime, government agencies and public health officials need to know not only the current locations of crime “hot spots” but also the shift of those “hot spots” in the future. Geographic prediction could be used to predict these events (Jefferson, 2018) so that appropriate resources may be deployed and targeted interventions can be developed.
Many studies have established a connection between drug use, especially crack, heroin, and cocaine, and crimes such as shoplifting, theft, and prostitution (Young et al., 2013; Young & Jaganath, 2013; Young, Rivers, & Lewis, 2014). The strength of the association between drug abuse and crime varies by type of drug used. Meta-analyses over the past 25 years have reported a consistent positive association between crime rates and drug use (Conklin & Jacobson, 2003; Corman & Mocan, 2000; Gerber, 2014; Goldstein, 1985; Malleson & Andresen, 2015; Mestyán, Yasseri, & Kertész, 2013; Mistry, 2006). However, existing methods to monitor crime have several limitations in terms of spatial pattern and temporal monitoring due to the lack of available data sources and effectiveness of monitoring and reporting tools (Chainey et al., 2008). It is necessary to explore state-of-art techniques to monitor substance abuse behavior and eventually generate the innovative and cost-effective strategies to monitor and identify high crime areas in real time (Gerber, 2014; Mistry, 2006; Schoen, et al., 2013).
Social media refers to websites and online tools that “facilitate interactions between users to share information, opinions and interests” (Khan, 2012; Khan, Swar, & Lee, 2014). The advent of social media has made way for innovative analytics tools and scientific methods, such as mining and analyzing large amounts of user data in real time (Chew & Eysenbach, 2010; Signorini, Segre, & Polgreen, 2011). Social media has also demonstrated potential as an innovative tool to monitor the public and predict events (Asur & Huberman, 2010; Cheng, Caverlee, & Lee, 2010; De Choudhury, Counts, & Horvitz, 2013; Kalampokis, Tambouris, & Tarabanis, 2013; Panagiotopoulos, Bigdeli, & Sams, 2014; Schmidt, 2012; Schoen, et al., 2013; Shirky, 2011; Young et al., 2014). This surveillance method may be applied to monitor crime rate and additional resources can be provided to the outbreak areas.
One of the more popular social media sites, Twitter, is a micro-blogging platform that allows users to post brief messages called “tweets” to the public or small group of followers. Tweets can be up to 280 characters long as of 2017; however, at the time of our study, the limit was 140 characters (Isaac, 2017). Twitter has 328 million active users monthly (“Number of Monthly Active Twitter Users Worldwide From 1st Quarter 2010 to 4th Quarter 2017 (in Millions),” 2018; Olanoff, 2015) worldwide as of 2017. The Twitter users in the population are increasing among urban, young, African American or Hispanic populations, which is the demographic of high crime rates (Lenhart, Purcell, Smith, & Zickuhr, 2010). This suggests that Twitter can be a valuable data source to be used to monitor crime rate. The association between younger age group and crime has been demonstrated in the literature (Farrington, 1986). Nowadays, crime victimization is a common feature of many young people’s lives (Anderson, Kinsey, & Smith, 2017; Farrington, 1986). They experienced crime based on things happen to them and see happening around them. The impact of the young age on crime is not only the experience but also the witness. Twitter attracted a lot of young middle class (Gerbaudo, 2018).
The use of social media services such as Twitter has been growing rapidly, and research has already shown that data from these technologies can be used as a novel approach to public health surveillance (Asur & Huberman, 2010; Bodnar, 2013; Cheng et al., 2010; Chew & Eysenbach, 2010; Chou, Hunt, Beckjord, Moser, & Hesse, 2009; Gerber, 2014; Karami, Dahl, Turner-McGrievy, Kharrazi, & Shaw, 2018; Khan, 2012; Sakaki, Okazaki, & Matsuo, 2010; Signorini et al., 2011). Twitter usage increased 30% from 2012 to 2014, and currently one in four adults in the United States use the service. Twitter differs from other social media platforms such as Facebook in that most posts are public and thus can be readily accessed by anyone. Currently, there is a massive amount of accessible Twitter data. In addition, previous studies have shown that users are willing to share highly personal information, such as sex- and drug-related behaviors, in their tweets (Young et al., 2013; Young & Jaganath, 2013; Young et al., 2014). Information extracted from tweets, such as location, time, and content, can be used to monitor and predict infectious disease outbreaks (Chew & Eysenbach, 2010; Ritterman, Osborne, & Klein, 2009; Signorini et al., 2011), health-related outcomes, movie ratings (Liu & Young, 2016; Liu, Zhu, Yu, Rasin, & Young, 2017; Mestyán et al., 2013), student experiences, election results (Elson, Yeung, Roshan, Bohandy, & Nader, 2012; Liu, Zhu, & Young, 2018; Metaxas & Mustafaraj, 2012; Skoric, Poor, Achananuparp, Lim, & Jiang, 2012; Wang, Can, Kazemzadeh, Bar, & Narayanan, 2012), and so on.
Using social media to monitor crime is an emerging field of study (Hipp, Bates, Lichman, & Smyth, 2018; Ristea, Kurland, Resch, Leitner, & Langford, 2018; Vomfell, Härdle, & Lessmann, 2018; Williams, Burnap, & Sloan, 2017). Williams et al. (2017) demonstrated that tweets that contained keywords about broken windows were associated with reported crime rates. Based on these studies and the increasing popularity of social media, an association between drug-related tweets and crime may exist and provide an opportunity to predict and monitor crime using social media.
We hypothesized that the frequency of drug-related tweets would be positively associated with both 2012 and 2013 county crime rates, with and without adjustment for income inequality and population density. Positive associations could serve as preliminary evidence that social media data can be used as an additional tool for crime surveillance and prediction.
Methods
This study was approved by the UCLA Institutional Review Board. City-level crime data for 2012 were obtained from city-data.com. City-data collects reports of murder, rape, robbery, assault, auto theft, and arson and calculates an overall crime score (Goodin, 2012; Han, Cohen, Derose, Li, & Williamson, 2018; Johnson & Snyder, 2017; Tulumello, 2018). The calculation assigns more weight to violent crimes (City-Data), adjusts for the number of visitors and daily workers commuting into cities. The cumulative city-data.com crime index from each city of the county was used as an outcome variable. If crime data for a particular county were not available in 2012, the crime rate was imputed by the historical crime rate index (the past 10-year average crime rate). City-data was available directly from the website for each city and for any given address or zip code. We included additional data to adjust the population characteristics at the county level (U.S. Census Bureau, 2012).
Tweets were collected between 26 May and 9 December 2012, using Twitter’s free advanced programming interface (API) using the “garden-hose” method, which allows for the real-time collection of 1% of all tweets (Thelwall, 2015; Young et al., 2013; Young et al., 2014). We also collected the metadata associated with the tweets including the users’ IP address and time the tweet was sent (Young et al., 2014). All tweets were coded to remove potentially identifiable information. Pew research indicated that almost 44% of tweets were from youth group whose age are from 18 to 44 years (Smith & Brenner, 2012).
Building on methods used in previous studies, a list of keywords associated with drug and substance use was compiled (Young et al., 2013; Young & Jaganath, 2013; Young et al., 2014). For example, tweets were classified as being “drug-related” if they contained one or more keywords related to substance use (e.g., opiates, heroin, or crack). Due to the broad context of certain drug-related keywords, we manually screened a subset of drug-related tweets to ensure accuracy of subject matter. The original sample included 553,196,061 tweets; of those tweets, 2,157,260 (0.04%) contained geolocation information. Of the tweets with an author’s location available, 1,323 (0.06%) contained at least one or more drug-related keywords. Two researchers independently verified a random sample of tweets to ensure an accurate description of substance use. Examples of drug-related tweets included the following: “Who wanna get high today?” and “More drugs, more high please.” All tweets in our dataset were geotagged with latitude and longitude coordinates. We then used the Google Maps API (Boulos, 2005) to extract state and county information for each tweet.
For the purpose of our analysis, we created one observation for each county. An observation was considered complete if it included the geocoded tweet data, city-level crime data, and Gini index data which were linked together by zip code in SAS 9.4 (SAS Institute, 2015). The data were aggregated further at the county level and merged with the county-level income data. We collected a total of 1,323 drug-related tweets from 453 counties, and 9,428 records of crime data at the city level. In addition, we had Gini index and population data at the county level for 3,222 data points. The final contained 437 completed observations with drug-related tweets, Gini index data, and crime data (14% of total 3,142 counties) from 46 states.
Studies have shown that there is a positive association between income inequality and crime rate and that the association between income inequality and crime rate is stronger when measured in large areas and over the short term (Brush, 2007; Carroll & Jackson, 1983; Choe, 2008; Hsieh & Pugh, 1993; Pickett & Wilkinson, 2015). To address this effect, we used data from the Gini index. The Gini index is a measure of wealth inequality and distribution of income. The index measures on a scale of 0–1, where 0 is maximum income equality and 1 is maximum inequality (Hirschman, 1964; Lerman & Yitzhaki, 1984; Silber, 1989). It can directly affect population health and societal well-being and is positively associated with crime rate in cross-sectional analysis (Brush, 2007; Choe, 2008; Jiang, Lu, & Sato, 2012; Pickett & Wilkinson, 2015). Although the Gini index was not available for counties in some rural areas, our datasets were unaffected given the number of tweets in these counties was very low. Urban areas generally had a higher crime rate, especially in city centers, and were also high in tweet density (Malleson & Andresen, 2015).
Statistical Analysis
Data analysis was conducted in February 2017. Pearson’s correlation coefficient was used to determine the pairwise linear relationship among the aggregated county-level crime data, drug-related tweets, and Gini index.
A pre-analysis indicated initial positive associations between crime rates and drug-related tweets at the state level. Based on this correlation, we developed methods for modeling a more detailed analysis of further associations to explore at the county level.
We used a negative binomial regression model to show the association between crime data and drug-related tweets, while taking into account the over-dispersion of crime data (Hilbe, 2011). The association between crime data and tweets data at the county level was modeled and adjusted using the Gini index. We compared model performance using Akaike Information Criterion (AIC) scores (Ver Hoef & Boveng, 2007), with a smaller AIC value suggesting better fitness of the model.
We further adjusted for general population in each county due to the unbalanced number of tweets in different locations. Large urban counties generally had higher crime rates and higher numbers of tweets. The crime rate and drug-related tweets were modeled hierarchically with data clustered within states, given state-level laws determine the punishment for drug crimes and thus influence public attitudes and likelihood of boasting about drug-related tweets. We modeled the association between the crime rate per 1 million people and rate of drug-related tweets per 1 million people. We then adjusted for the Gini index at the county level with a multilevel regression model. The two rates were log transformed to take into account the skewness and over-dispersion present in the model. We used a random intercept and slope (RIAS) model for counties that were clustered within a state in terms of geolocation, policy, and culture.
As in the literature, the population characteristics at county level were associated with the crime rates. We additionally adjusted the percentage of young people who contributed more than half of the tweets (age = 15–44 years), the percentage of White in the population at county level, and the percentage of African American in the population.
Results
State-Level Results
Figure 1 shows the positive association between crime rate index and drug-related tweets. Drug-related tweets and crime index rate were highly correlated, with a correlation coefficient equal to 0.82 at the state level. We plotted the relationship between drug-related tweets and crime index for each state.

Association between crime rate index and drug-related tweets at the state level.
County-Level Results
A total of 437 county-level aggregated complete records were available for further analysis with crime rates for the years 2012 and 2013. The mean crime rate at the county level in 2012 and 2013 was 336.43 (SD = 184.02, range = 31–1075.2) and 341.81 (SD = 179.93, range = 53.8–995.3), respectively. The mean number of drug-related tweets at the county level was 2.54 (SD = 3.33, range = −31) in 2012. The mean Gini index in 2012 was 0.44 (SD = 0.04; range = 0.33–0.60). Table 1 shows the correlation results between drug-related tweets, crime rate, and Gini index. For 2013 data, we included the previous year’s crime rate. The frequency of 2012 drug-related tweets was highly correlated with both the 2012 and the 2013 crime indexes at the county level. We included the population characteristics (mean age, percentage of age 15–44 years, Caucasian, and African American) in 2012. The correlation is highly significant with crime rate and tweets as shown in Table 1.
Correlation Results Between Crime Rates, Drug-related Tweets, Gini Index, Mean Age, and % of Young, White, and Black at the County Level (2012–2013).

SD: standard deviation.
Correlation at county level: *p < .05; **p < .001.
Overall, we used three negative binomial regression models and two multilevel RIAS models to examine the association between drug-related tweets and crime rate at the county level in the year 2012 and 2013, respectively, as shown in Tables 2 and 3. The associations between drug-related tweets and crime rate were statistically significant in all five models for both years. The best performance (smallest area under the curve [AUC]) was achieved by model 5—the model adjusted for Gini index, county-level percentage of young people (15–44 years), White, and African American. In both Tables 2 and 3, the multilevel models (model 4 and model 5) performed better with smallest AIC. In addition, we found that drug-related tweets from 2012 were significantly associated with crime rates from 2013 (Table 3). The best-fit model (model 5) for predicting the 2013 crime rate at the county level included the 2012 drug-related tweets and Gini index.
Negative Binomial Analysis for 2012 Drug-related Tweets and 2012 County-level Crime Rate.

AIC: Akaike Information Criterion (smaller value indicates better model); NS: not statistically significant in the model.
Negative Binomial Analysis for 2013 Drug-related Tweets and 2013 County-level Crime Rate.
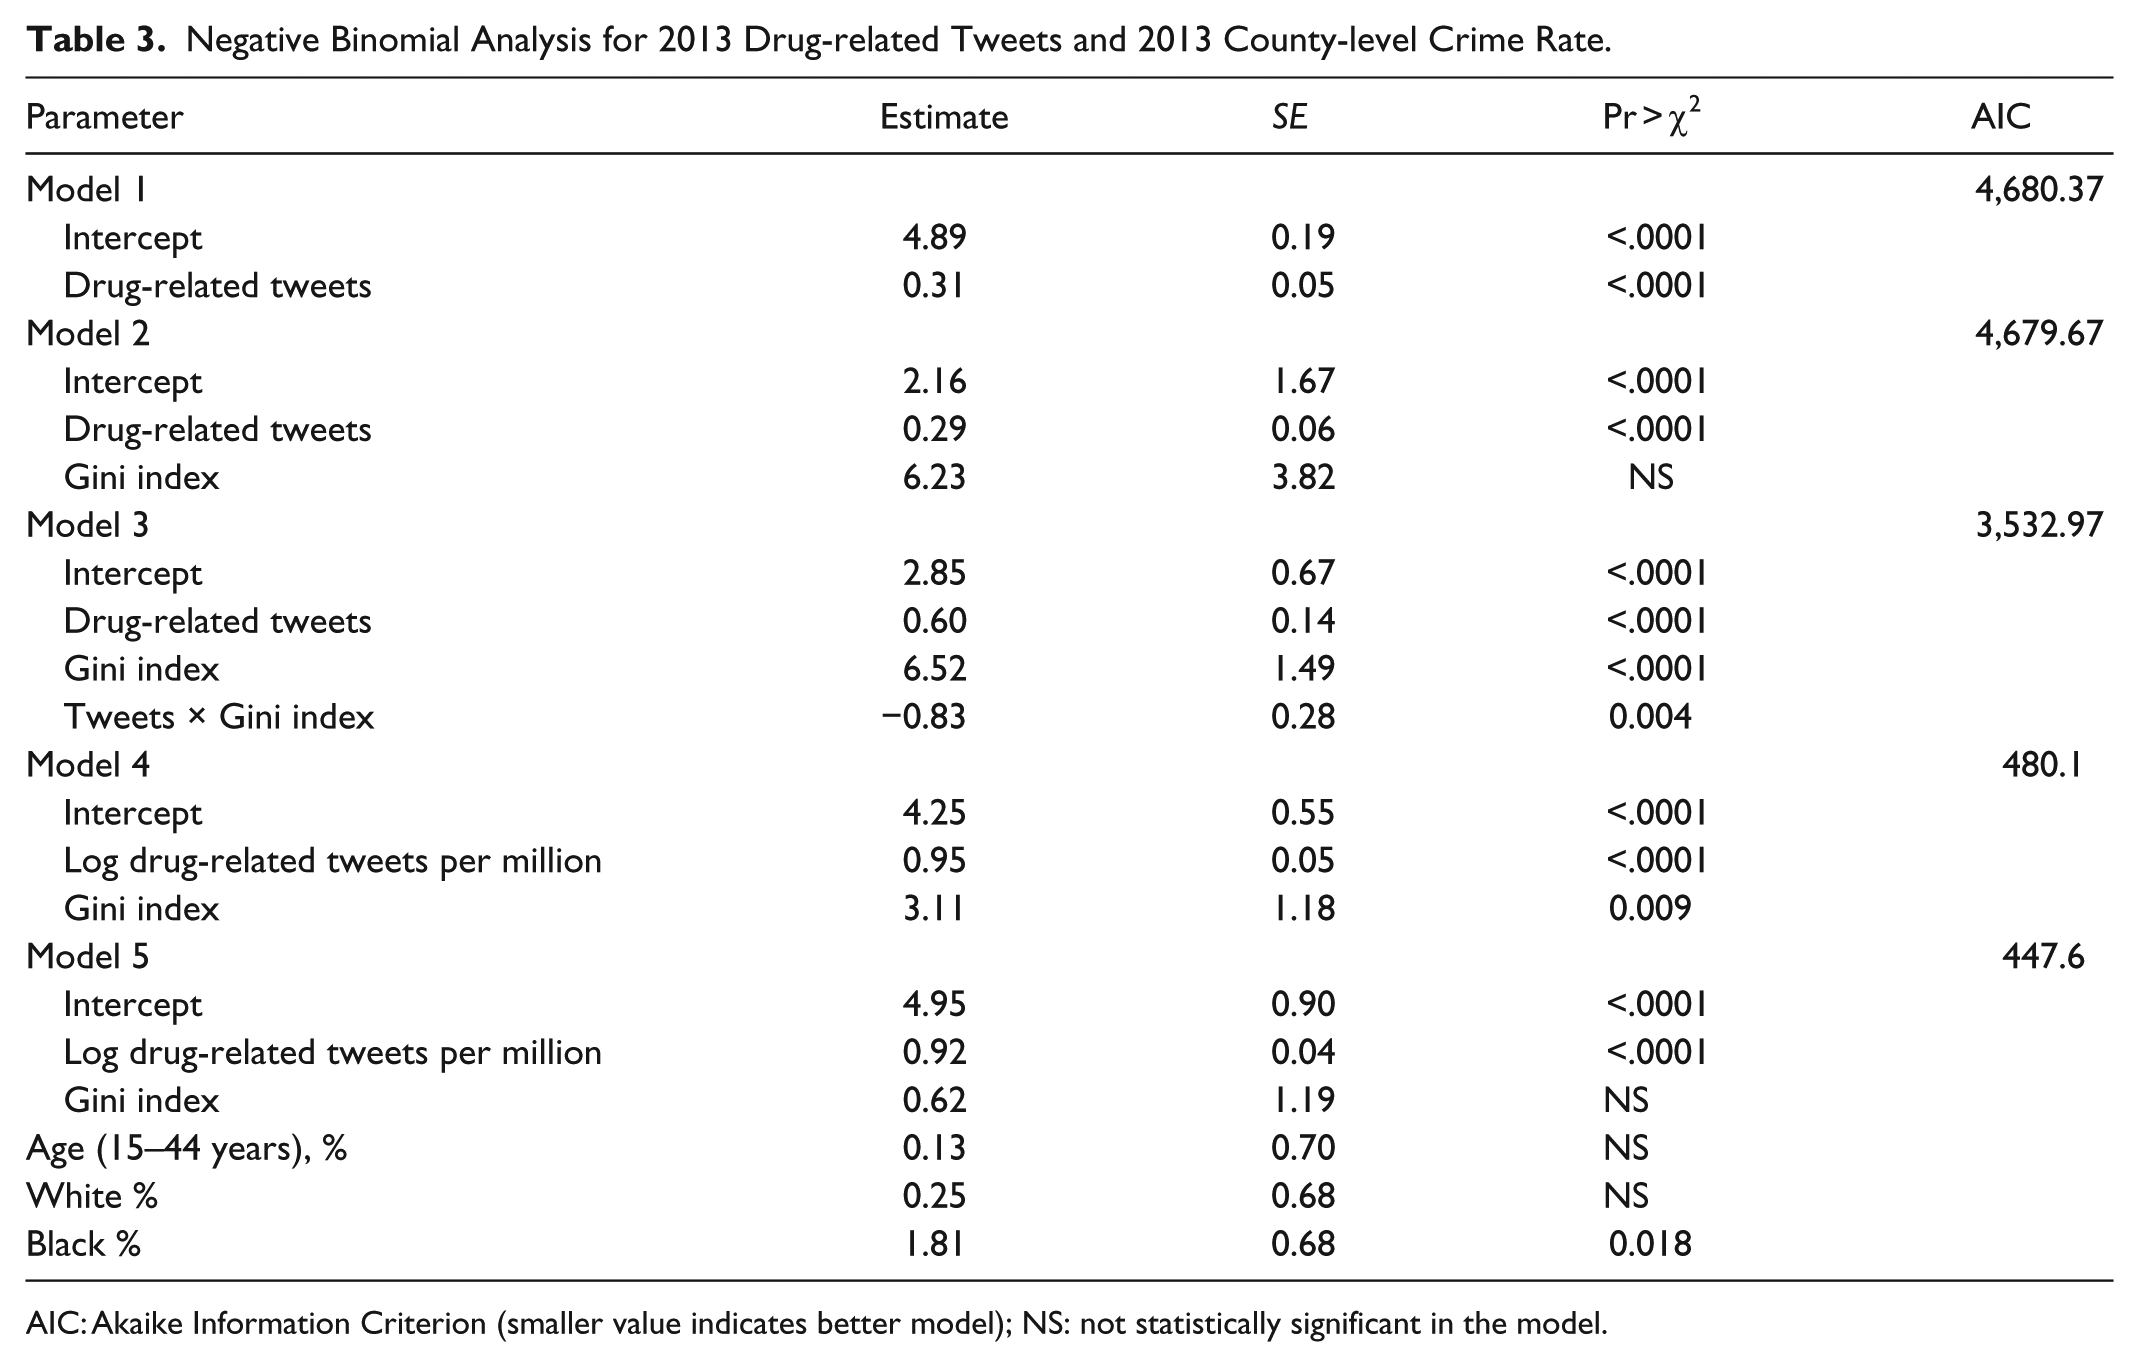
AIC: Akaike Information Criterion (smaller value indicates better model); NS: not statistically significant in the model.
The results of the multilevel RIAS model generated a similar association between log-transformed crime rates and drug-related tweets at the county level, while the fixed effects indicated a positive association (p < .001) between the mean effect of crime rate and drug-related tweets. The fixed effects of coefficients indicated a significant association between crime and tweets when controlling for income inequality—we expected a 9.5% increase in the crime index rate per 1 million population when drug-related tweets increased by 10%. The negative correlation between the random-effects intercept and slope was estimated to be −0.14, with a p-value of 0.01 indicating that the effect of the drug-related tweets depended on the average number of crimes in the county. The association was positively lower when the crime index rate was higher than the average in the state. A similar trend was identified by the model with a log-transformed crime rate index for 2013.
Discussion
We found that drug-related tweets in 2012 were associated with county-level crime rates in 2012 and 2013. To our knowledge, this is the first study to demonstrate the feasibility of using social media data (e.g., drug-related tweets) to monitor and predict crime rates. Our findings provide evidence that it is possible to use social media in addition to existing tools to monitor crime. Finally, results from the study can inform the design of future models that more accurately monitor and predict crime rates.
We have seen similar types of surveillance been piloted to monitor public health events (e.g., infectious disease outbreaks [Ahmed, Bath, Sbaffi, & Demartini, 2018; St Louis & Zorlu, 2012] for quick detection and disaster response). Thus, a potential implication of our approach to monitor crime is that this could help government agencies allocate appropriate resources to lower the crime rate in high-risk areas. Although crime itself can be considered a public health issue, but we would expect that a crime outbreak would be handled much differently than an infectious disease. A public health crisis is likely to be addressed with intervention efforts meant to aid people such as providing them with information, increasing access to medical assistance, and working to reduce the rate of transmission. Using similar surveillance methods to target crime outbreaks is much more likely to result in increased social control through enhanced policing, arrests, and incarceration and particularly in poor communities and potentially people of color (Alexander, 2012; Beckett, Nyrop, & Pfingst, 2006; Chambliss, 1994; Elliott et al., 1996; Provine, 2008). Thus, it is important to consider how our technology could be leveraged disproportionately against populations who are already subjected to greater levels of social control.
There were several limitations associated with this study. For example, the drug-related tweet data were extracted using Twitter’s API, which provides a random sample of approximately 1% of all tweets. We then extracted geolocated tweets only if users had enabled geolocated data. Consequently, geolocated drug-related tweets were not available in certain areas, which limits our ability to generalize the findings. Although the drug-related tweets were filtered using keywords, additional research incorporating sentiment may help to improve the models (Young et al., 2013; Young & Jaganath, 2013; Young et al., 2014).
This study only explored the relationship between drug-related tweets and crime rates. Further research should examine the relationship between non-drug-related tweets (possibly tweets related to gun violence, racism, and sexual behaviors) and crime. In this study, we did not examine the association of drug-related tweets with different type of crimes due to the limitation of data source. Although we found a relationship between tweets and crime, we do not have evidence to suggest that tweets are causing more crime and tweets about crime do not necessarily reflect the crime rate. Nevertheless, previous studies have shown that a large proportion of crimes are drug-related, providing support for the findings (Dilulio, 1996; Ditton et al., 1999; Furstenberg, 1971; Stafford et al., 2007; Wallace, 1990).
Using Twitter to monitor and predict crime would have a number of benefits and drawbacks. Communities would likely be concerned about the ethical implications of this type of surveillance as well as the cost to implement the program. However, due to the high availability of social media data, it would be worth exploring real-time prediction methods. In this article, we did not consider age group and race or ethnicity into the analysis due to the limitation of the data. This consideration is especially important given the high and increasing frequency of social media use among African Americans and Latinos (Smith & Brenner, 2012). The data used in this article were retrospectively obtained from 2012. In the tweets data, only IP address was available besides the contexts and the time of the tweet. We also did not include “ghost accounts” in our analyses. We manually check for “pseudos’ or street name for drugs when identifying drug-related tweets. However, it is possible that we may not have included all the names. The tweets data were only available with text contents and location determined by IP address. Twitter users were not identifiable. Thus, this limited the factors adjusted in the model.
Privacy and ethical concerns are important to consider in this type of research, especially given the recent privacy breaches and ethical issues (e.g., Facebook and Cambridge Analytica) involving social media data (Booth, 2014; Greenfield, 2018). Twitter, by nature, is a platform for free speech; however, people may be uncomfortable sharing their tweets with the entire general public. To address this, Twitter allows users to set their profiles to private so only approved accounts can view their tweets. In addition, Twitter users can hide their location data in user settings. While many people tweet about crime-related content, they might choose to opt to hide or opt sharing their data from the general public if they knew law enforcement might use their data for surveillance and public safety. Thus, a clear and transparent guideline on how law enforcement and institutions use social media data is needed. These guidelines on ethical conduct should be based on current evidence and standardized while consideration of various laws and practices in different jurisdictions. Future research needs to further explore the ethical issues in social media monitoring research on people’s attitude and willingness to share social media data for crime prevention.
Social media continues to grow in popularity and is now widely used in public health arenas to predict outcomes of large events (Chou et al., 2009; Jaganath, Gill, Cohen, & Young, 2012; Malleson & Andresen, 2015; Metaxas & Mustafaraj, 2012; Oghina, Breuss, Tsagkias, & de Rijke, 2012; Schoen, et al., 2013; Young et al., 2013; Young & Jaganath, 2013; Young et al., 2014). This study suggests it is possible to identify emerging crime hot spots using social media. There are some social media monitoring companies that already provide online data for law enforcement to use for surveillance. These new mining tools can help give law enforcement additional tools to ensure public safety. Future research can build upon this study to monitor local crime rates and highlight the possible emerging new spots to determine how law enforcement officials can use social media data as a surveillance tool. Finally, we need to establish good ethical practices in social media research, especially given how social media and personal data are increasingly being used in unintended ways by institutions and social control agents (e.g., Cambridge Analytica; Cadwalladr & Graham-Harrison, 2018; Persily, 2017; Solon, 2018).
Footnotes
Declaration of Conflicting Interests
The author(s) declared no potential conflicts of interest with respect to the research, authorship, and/or publication of this article.
Funding
The author(s) disclosed receipt of the following financial support for the research, authorship, and/or publication of this article: This study was supported by the National Institute of Health (grant nos. U01: 5U01HG008488, R01MH106415 and R01AI132030).