
Abstract
Twitter is now a key platform for public communication between a diverse range of participants, but the overall shape of the communication network it provides remains largely unknown. This article provides a detailed overview of the network structure of the Australian Twittersphere and identifies the thematic drivers of the key clusters within the network. We identify some 3.72 million Australian Twitter accounts and map the follower/followee connections between the 255,000 most connected accounts; we utilize community detection algorithms to identify the major clusters within this network and examine their account populations to identify their constitutive themes; we examine account creation dates and reconstruct a timeline for the Twitter adoption process among different communities; and we examine lifetime and recent tweeting patterns to determine the historically and currently most active clusters in the network. In combination, this offers the first rigorous and comprehensive study of the network structure of an entire national Twittersphere.
Introduction
Twitter is now widely recognized as a particularly important global platform for public (as opposed to private or semi-private) communication, even more so than the considerably larger Facebook. This is due mainly to three key factors: the fact that the vast majority of Twitter accounts and their tweets are publicly visible to all other users, and even to logged-out visitors to the Twitter Website, because only a small percentage of accounts are set to “private”; its flat and non-reciprocal network structure, where it is generally possible for users to follow other accounts without a need for that relationship to be approved by the followed account (such approval is necessary only for accounts set to “private”); and the very short message format, which enables and privileges near-live conversations between users that resemble oral exchanges rather than written communication.
Clearly, the publicness of most communication on Twitter does not mean that ordinary users’ tweets regularly reach large audiences; indeed, the majority of all tweets are likely to be seen only by a handful of other users, and Twitter itself remains a platform for small subsets of the overall population in many nations. However, the default public accessibility of most Twitter accounts and their messages, the lack of barriers for connecting more permanently with these accounts, and the comparative ease with which individual posts may be shared horizontally through the network (through retweeting) and vertically to other platforms (through embedding) have on many occasions enabled rapid information cascades that amplify the visibility of individual tweets well beyond their sender’s original audience of followers, and indeed (through vertical redistribution) well beyond the Twitter user base itself. This is most common for the tweets of politicians, celebrities and other figures in public life, but will also occur as ordinary users find themselves in extraordinary circumstances—for instance at the scene of a major crisis event.
These factors also position Twitter, more so than its major competitors, as a network for covering live events and breaking news (Kwak, Lee, Park, & Moon, 2010; Osborne & Dredze, 2014) and lead it to represent “a first draft of the present” (Bruns & Weller, 2016), ahead even of journalism’s “first rough draft of history.” Facebook, by contrast, is a considerably less public medium: here, communication largely takes place in private or semi-private settings, friendship connections between accounts require reciprocity, and mechanisms for the rapid gathering of publics around shared topics of interest, such as the hashtag, are available but rarely used.
It is unsurprising in this context that the common collective term for Twitter’s networked communicative environment is “the Twittersphere.” This alludes to the Habermasian notion of the public sphere (1962), even if it should also be noted that a substantial part of the public communicative activities conducted on Twitter do not fit the rational deliberative criteria set by Habermas himself; instead, as Papacharissi (2014) has shown, there is also a considerable affective element to Twitter communication. Overall uses of Twitter range from phatic social interaction through business and cultural uses to intense political debate (Weller, Bruns, Burgess, Mahrt, & Puschmann, 2014). However, it seems clear that the term “Twittersphere” points clearly to Twitter users’ (and Twitter researchers’) innate understanding of Twitter’s social networking and interaction space as a circumscribed environment with distinct internal structures that channel the flow of information and communication between individual actors and groups, and thus ultimately represent a set of power relations as well. Such structures have the potential to substantially affect the news and information diet available to Twitter users, as well as the repertoire of accounts with whom they connect (Schmidt, 2016); they indicate the extent to which “echo chambers” (Sunstein, 2009) and “filter bubbles” (Pariser, 2012) affect communicative flows across the Twitter network.
However, there is a comparative paucity of scholarly research that provides the empirical evidence to develop a more robust and rigorous understanding of these structures and their implications. This is due largely to the considerable practical challenges in gathering the data required to pursue such a research agenda: Twitter, Inc. has made it increasingly difficult for researchers to gather large-scale datasets on Twitter user activities through the platform’s standard Application Programming Interface (API), pointing inquiries instead to its commercial data reseller GNIP (whose pricing is likely to be unaffordable for ordinary research projects; cf. Burgess & Bruns, 2015); furthermore, even services like GNIP remain focused largely on providing data on the day-to-day communicative activities of Twitter accounts rather than offering straightforward access to large-scale data on the underlying networks of interconnection, via follower/followee relationships, between those accounts. As a result, the vast majority of scholarly research into the uses of Twitter remains focused on smaller-scale communicative events as represented by shared hashtags and keywords (Bruns & Burgess, 2015), while large-scale studies of global Twitter activity patterns or network structures are mainly conducted by commercially sponsored research institutions or by in-house researchers at Twitter, Inc. itself (e.g., Huberman, Romero, & Wu, 2009; Myers, Sharma, Gupta, & Lin, 2014).
Perhaps most crucially, these obstacles to independent scholarly research mean that there are very few studies that examine the structures of interconnection (via follower/followee relationships) and interaction (via @mentions and retweets) at intermediate levels, below the generic, global level of studies such as Huberman et al. (2009) or Myers et al. (2014) and above the particular, momentary observations of user interaction documented in hashtag and other small-scale studies. There is a profound lack of studies that examine, for instance, the internal structures of entire Twitterspheres in particular nations or for specific fields of interest: structures that have been established over longer periods of time by the gradual accumulation of follower/followee connections. The development of such structures may be driven, inter alia, by a mixture of pre-existing personal connections outside of Twitter, the pursuit of individual interests in specialty topics, preferential attachment to already well-connected nodes in the network, orchestrated campaigns to increase the follower numbers of selected accounts (including both user-driven practices such as “Follow Friday” and artificial mechanisms such as “guaranteed followback”), and/or built-in platform affordances that recommend new accounts to follow. The analysis of non-random patterns of connection among Twitter accounts, then, can reveal the operation of such drivers and—where densely connected regions in the overall network (that is, clusters) can be associated with specific user identities or interests—points to the relative representation of particular thematic publics or sociodemographic groups within overall society in the national Twittersphere.
To date, only a small number of such analyses have been attempted, however. Maireder and Schlögl (2015), for instance, mapped part of the Austrian Twittersphere by identifying accounts that participated in key political hashtags and gathering data on their followee networks, resulting in networks of up to 8,000 accounts; Sloan, Morgan, Burnap, and Williams (2015) use automated analysis methods in an attempt to systematically derive demographic information from the profiles of users that appear to be located in the United Kingdom; and Bruns, Burgess, and Highfield (2014) mapped the follower/followee connections of some 120,000 Australian accounts identified through a multi-stage snowball crawl that started with accounts participating in selected Australia-centric hashtags. This study builds on this preliminary overview of the Australian Twittersphere and offers a considerably more in-depth analysis of the internal follower/followee connection patterns that determine its structure and shape; it does so by deploying a substantially more comprehensive approach to identifying the Twitter accounts associated with a specific national context, and therefore provides a significantly more rigorous and reliable basis for further research.
Such further research will be able to address a number of key questions: for instance, which specific demographic, thematic, or other factors may be responsible for the formation of distinct connection structures in different parts of the follower/followee network; whether the structures identified in this study might be interpreted as evidence for the existence of “echo chambers” (Sunstein, 2009) that are likely to affect the flow of discussion and information across the network; whether actually observable patterns of engagement and discussion between users (through @mentions and retweets) are homologous with follower/followee networks, or also connect freely between accounts that do not follow each other (perhaps due to the connective shortcuts created by shared hashtags or widespread retweet cascades); whether the information sourcing practices in different parts of the network (as evident in the URLs shared in tweets) point to the existence of “filter bubbles” (Pariser, 2012) in network clusters with vastly divergent information diets; whether and how different parts of the network engage with specific current events and issues, and how such engagement proceeds over time.
To address any and all of these questions is well beyond the scope of this article, which is instead designed to provide the baseline for such further analysis by establishing, in the first place, the fundamental underlying structure of follower/followee networks in the Australian Twittersphere. (Building on the analysis presented here, the specific question of “echo chambers” and “filter bubbles” has been addressed further in Bruns, 2017.) The task of addressing such questions is crucial not least in the present context of considerable and often comparatively evidence-free debate about the role that social media such as Twitter play in enabling the creation and coordination of niche and fringe political groupings, disseminating or debunking “fake news” and other forms of propaganda, and promoting or combating abuse and hate speech. At a time when more than 20% of the 18- to 34-year-olds surveyed across 36 national news markets by the 2017 Digital News Report regard social media as their main source of news (Newman, Fletcher, Kalogeropoulos, Levy, & Nielsen, 2017, p. 11), for example, there is an urgent need for more detailed evidence on the network structures through which such news reaches them. This article takes the first major step toward that goal by documenting who follows whom in the Australian Twittersphere, and showing how this is likely to affect information flows; our further research has already combined this with an analysis of who interacts with whom, and whether these patterns reinforce or counteract one another. In addition, of course, it would also be useful to replicate this study in other national Twitterspheres, or for the global Twitter network; to aid further studies in pursing this goal, in the following section we therefore discuss our research approach and dataset in detail.
Dataset
Bruns et al. (2014) and Maireder and Schlögl (2015) both pursued a snowball approach that started from a verified set of national Twitter accounts which had been identified from the participants in selected hashtags with a strongly domestic focus, and then examined the followers and followees connected to those starting accounts. This approach is valuable, but the selection of the starting hashtags also introduces immediate biases. First, the thematic focus of such hashtags (such as politics, sports, or business) may make it more likely that the snowballing process will find other accounts with the same focus, rather than also capturing accounts that would not participate in discussing these topics; political accounts are unlikely to be followed by users with no interest in politics, for instance, and a snowballing effort that starts with a selection of political hashtags might find it difficult to break out into the wider Twittersphere beyond politics, therefore. (In the study by Maireder and Schlögl, in fact, this was the desired effect, as its focus was largely on the Austrian political Twittersphere.) Second, the initial focus on hashtag participants could also serve to skew the snowballing effort away from Twitter accounts that do not usually participate in hashtags; given the self-selecting nature of hashtag communities, participants who use Twitter largely for interpersonal, everyday purposes away from public discussion may end up being underrepresented in studies that draw on hashtag users as their starting point.
In this study, we therefore pursue a different approach: we filter a much larger, global dataset for those accounts which meet any one of a number of criteria for “Australianness,” rather than snowballing out from a set of confirmed Australian accounts in search of more Australians. In doing so, we draw on the fact that—until early 2016—each Twitter account was assigned a unique numerical ID in consecutive order; this made it possible to use a brute-force approach to gradually test each possible ID for the corresponding account profile and to retrieve the publicly available profile metadata, through the Twitter API. (Twitter, Inc. has since changed its ID system, moving away from consecutive numbering and introducing significantly larger ID numbers; this will make a repeat of our approach impossible, although we will be able to test for changes to the metadata of the profiles we have already identified, if their existing IDs remain the same.) Over the course of several months, from late 2015 to early 2016, we therefore requested the public profile metadata for each numerical ID from 0 to 5,000,000,000; we terminated the process—shortly before the changes to the Twitter ID system were implemented—once we verified that we could not find any new account IDs above 4,930,000,000, which we saw as a clear indication that we had reached the upper bound of currently assigned old-style IDs. The most recent account included in our global dataset was created on 19 February 2016; the earliest account—with a user ID of 12, created on 22 March 2006—belongs to Twitter co-founder and CEO Jack Dorsey (@Jack).
This does not mean that there are nearly 5 billion Twitter accounts in existence, however: Twitter ID assignments skip numbers, sometimes in blocks of considerable size. This may be due to accounts being deleted or suspended, so that the IDs no longer return profile information; we also assume that in the ongoing process of development and testing of the evolving Twitter infrastructure, its engineers will from time to time set aside blocks of IDs that are not assigned to ordinary accounts. Because of the traditionally consecutive approach to assigning Twitter IDs to accounts, such ID ranges, once skipped over, are never used, therefore. Overall, our brute-force approach to gathering public Twitter profile information resulted in a dataset comprising nearly 1.38 billion unique accounts; these represent the total number of Twitter accounts that were in existence at the time of our gathering data.
Having established this dataset of global Twitter accounts, we then proceeded to identify those accounts we considered to be “Australian.” Here, we applied a number of criteria: first, we tested for profiles that had set their Twitter Web interface timezone to one of the nine distinct Australian timezone settings available. Here, we benefit from the comparative distinctiveness of Australian timezones: while in Europe, for instance, timezones such as Central European Time cover multiple countries, and the identification of accounts from specific national backgrounds based on timezone would therefore be difficult, Twitter offers individual timezone options for each of the eight Australian states and territories, as well as for the offshore dependency Lord Howe Island. Furthermore, Australian account holders appear to be comparatively obedient in choosing a timezone setting as they create their account profiles; in total, our timezone filter alone identified more than 1.8 million accounts that were set to an Australian timezone.
We further supplemented this group by filtering the free-form “Description” and “Location” fields of each profile for recognizable identifiers of “Australianness.” Here, we drew on Wikipedia’s list of the 45 largest urban areas in Australia, ordered by population (Wikipedia, 2017), as it is common for Twitter users to provide an indication of their location in these fields; in doing so, we also benefitted from the considerable concentration of the Australian population in a small number of major cities: Sydney, Melbourne, Brisbane, Perth, and Adelaide alone account for well over 60% of the total population, while the smallest on our list of 45 locations is inhabited by barely more than 30,000 residents. (While this approach to filtering could be repeated for other nations, therefore, it may need to draw on a significantly larger number of filter terms than is necessary in Australia.) In addition to these urban areas, we also used filter terms for the eight states and territories (both spelt out and in abbreviation), as well as generic terms such as “down under,” “Oz,” and “Australia.”
We then manually reviewed the results of a first pass at filtering the global dataset using these terms, and on this basis constructed a substantial number of filter exceptions to eliminate the majority of false positives. These arose largely where Australian location names were not unique, and also matched locations such as Perth in Scotland, Brisbane in California, or Sydney in Nova Scotia; as the Queensland regional city of Townsville shares a name with the fictional setting of animated TV series Powerpuff Girls, we also identified a substantial number of profiles that gave their location as “City of Townsville” or “Ciudad de Townsville.” After several iterations, both positive and negative filters were implemented as case-insensitive regular expressions and used to filter the entire global dataset. This produced 2.45 million matches on the “Location” field and 555,000 on “Description.” Allowing for overlaps between the filters (where the same profile meets two or three of these criteria), the combined total number of matching profiles was 3.72 million.
We note that this dataset could still contain false positives and omit false negatives: it would also match false-positive accounts with descriptions such as “Australian living in London” or locations such as “I wish I was in Brisbane,” and as our elimination of false positives focused on the most common cases, there is a chance that some relatively unusual false positives might not have been addressed. In addition, there may be accounts where an Australian timezone was chosen by accident and has remained uncorrected. Similarly, Australian accounts might not have been detected if they did not set an Australian timezone and misspelt the relevant location markers or used non-standard variations (e.g., “Melbs,” “Brisvegas”; we did include the common misspellings “Tasmaina” and “Tasmainia” in our filter for “Tasmania,” however). Finally, of course, accounts without any public profile information—traditionally known as Twitter eggs, after the long-standing generic profile picture—would also be excluded from our dataset. We also did not test for GPS coordinates falling into Australian territory, as only a vanishingly small percentage of the global Twitter user base geolocates its accounts in this way, and—rightly so—Twitter does not provide any publicly available information on the IP addresses from which users log into its systems, which could otherwise be used to identify Australian-based users.
Finally, for each of the profiles we identified through this approach, we then gathered a full list of the accounts followed by the profile in question, using the open Twitter API. (As we are interested here in mapping follower/followee connections within the Australian Twittersphere, we gathered each profile’s outbound connections only: we expect any inbound connections to appear in turn as outbound connections as we gather the corresponding data from the follower’s own profile.) Due to the limitations of the application programming interface (API), this again took place over a period of several months, so that our data both on accounts and on their follower/followee connections represent a somewhat elongated snapshot: by the time we gathered data on the final accounts, the profile details for the earliest might well have changed again; by the time we gathered the followee list for the final accounts, the earliest may have made new connections already. This is unfortunate, but unavoidable under the present API access regime; we note here, however, that follower connections tend to evolve relatively slowly for most accounts, so that the fluctuations introduced by a prolonged data gathering period should remain limited. Furthermore, the Twitter API does not reveal which accounts are followed by a “protected” profile; for those profiles, we can therefore determine only what other accounts in the Australian Twittersphere they are followed by, but not what accounts they themselves are following.
In total, this final stage in the data gathering process resulted in some 720 million outbound followee connections from our 3.72 million Australian accounts (that is, we identified a total of 720 million connections where an Australian Twitter account follows another Twitter account), directed at 84 million unique accounts; of these, 167 million followee connections remain within the Australian Twittersphere, and are directed at 2.4 million unique accounts. Per capita for an Australian population of more than 24 million, this population of Twitter accounts would translate to a Twitter adoption rate of above 15%; however, we note that it is very likely that single individuals might operate multiple (e.g. personal and professional) accounts, and that individual accounts (e.g. for companies or organizations) might be run by multiple operators. In addition, as flagged above, there is also an unknown—and unknowable—number of false negatives: Australian accounts that are not detectable as Australian because of their lack of relevant profile information. These factors, which would variously lead us to over- or underestimate the number of distinct Twitter users (as opposed to accounts) in Australia, could well cancel each other out, but this is impossible to gauge in the absence of reliable independent information; we note in this context that the survey-based Sensis Social Media Report 2016 (Sensis, 2016) reports a 19% adoption rate for Twitter among Australian Internet users, which converted to the entire population would closely match our 15% take-up rate. We are therefore confident that our approach has identified the vast majority of Australian Twitter accounts.
It is this dataset of 3.72 million Australian accounts, with 167 million follower/followee connections between them, that we draw on in the following analysis; indeed, for the purpose of processing and visualization, we further limit the analysis to the best-connected accounts in the overall network.
Analysis
Our analysis is directed at examining the internal structures of the Australian Twittersphere, identifying the thematic and other drivers that appear to be responsible for the formation of more densely connected clusters and the interrelationships between those clusters, and comparing the Twitter activity metrics of these clusters. To do so, we focus here especially on the best-connected accounts in the network, as these are likely both to exert the greatest influence over their networked environments and to be of greatest use in interpreting the thematic or other patterns driving cluster formation. In the first place, we therefore filtered our full dataset of 3.72 million accounts for those accounts with a global Twitter network degree of 1,000 or more—that is, for those accounts whose combined number of followers and followees adds up to 1,000 or above.
We utilized the global follower and followee numbers here, rather than corresponding degree values within the Australian network only, because we sought to retain in our analysis those Australian accounts that, for whatever reason, mainly follow and/or are followed by non-Australian users; these accounts would have a high degree in the global Twittersphere, but a comparatively lower degree in the Australian Twittersphere. Retaining these accounts provides us with an opportunity to identify potential isolated groups of Australian accounts that are more focused on global connections—for instance because of their interest in European politics, American sports, or Asian pop music—than they are on Australian contacts and content. By contrast, a more conventional approach to graph decomposition—for example, by applying a k-core filter with k = 1,000 to the network among our Australian accounts—would retain only those accounts that are well connected within Australia, yet exclude accounts that may have substantial connections at an international level, but fail to reach the domestic k threshold. Instead, the approach we have chosen here effectively applies a k-core filter (with k = 1,000) to the global Twitter network (based on the sum of follower and followee numbers reported for each profile by the Twitter API), and then retains from that core only those accounts that we have identified as Australian, according to the criteria above.
This final filter leaves 255,000 Australian accounts with a global followership degree of 1,000 or above, and 61 million follower/followee connections between them; this represents 6.9% of the total Australian account population, but 37% of the total number of follower/followee connections within the Australian Twittersphere. We utilize the degree threshold of 1,000 here in the first place to match the threshold used in Bruns et al. (2014) and thus aid the comparability of network structures between our two studies. Any such filter—for whatever value of k—necessarily eliminates less connected nodes and strengthens the influence of more central accounts; this is desirable in the present context as such less connected accounts are also more likely to belong to more casual, infrequent Twitter users or might have been abandoned altogether, and should therefore not be regarded as particularly active contributors to public discussion. Indeed, during the first quarter of 2017, the 255,000 Australian accounts that met our degree threshold posted 51.4 million, or 43.6%, of the total number of 118 million tweets posted by the 3.72 million Australian accounts we have identified. The focus of our subsequent analysis is therefore on the most densely connected, most highly active core of the Australian Twittersphere. (In subsequent studies, we intend to explore the extent to which their structures and activities match or diverge from those of the entire Australian Twittersphere.)
We imported this dataset of accounts into the open-source network visualization software Gephi (Bastian, Heymann, & Jacomy, 2009) and used the Force Atlas 2 algorithm (Jacomy, Venturini, Heymann, & Bastian, 2014) to generate a visualization of the network. Force Atlas 2 creates a force-directed graph layout that positions multiple nodes—our Twitter accounts—in close proximity to each other if they share a high number of edges—our follower/followee connections—among them, and places them further apart if they are less densely connected. We used Force Atlas 2 in LinLog mode (which encourages clusters to be positioned more tightly), with the standard Edge Weight Influence and Gravity settings of 1.0 and at a scaling level of 0.0004, to obtain a visualization of the network that clearly shows the internal patterns of clustering and inter-cluster relations in the Australian Twittersphere.
Furthermore, we used the Louvain community detection algorithm (Blondel, Guillaume, Lambiotte, & Lefebvre, 2008, implemented in Python in Aynaud, 2016), at varying resolution levels, to algorithmically identify clusters of densely connected accounts within the overall network. This algorithm assigns nodes to different communities (or clusters) in the network, based on their connection patterns; the number of communities it seeks to detect—that is, the coarseness or distinctiveness of the clusters found—is controlled by a modularity resolution parameter, where (in the implementation of the algorithm that we used here) lower resolution values result in more, smaller clusters and higher values result in fewer, larger clusters. We imported the results of this community detection process into Gephi as additional data points for each account, for the modularity resolution parameters of 0.5 and 0.25, and used these data points to assign a unique color to each cluster in the network.
Finally, we resized the nodes—which each represent a single Twitter account—according to their indegree within the Australian Twittersphere, so that larger nodes in the network visualization represent accounts with a larger number of Australian followers. We also removed the edges—the follower/followee connections—from the visual representation of our network, to achieve greater visual clarity. The resulting network visualization shows only the nodes, therefore, held in their particular place relative to each other by the invisible force of the network edges that connect them.
Network Structure
Figure 1 shows the network visualization that results from these steps, using a modularity resolution of 0.5. It documents widespread agreement between the Force Atlas 2 positioning of nodes relative to each other, and the Louvain community detection algorithm’s assignment of nodes to the (colored) clusters: distinct parts of the overall network are generally uniform in color, too. Only at the center of the network do the colored clusters intertwine to a significant degree, and this is to be expected: here, Force Atlas 2 will position those accounts that are followed to a similar extent by others from across the entire network, and the Louvain community detection algorithm will struggle to conclusively assign these accounts to any one distinct cluster.
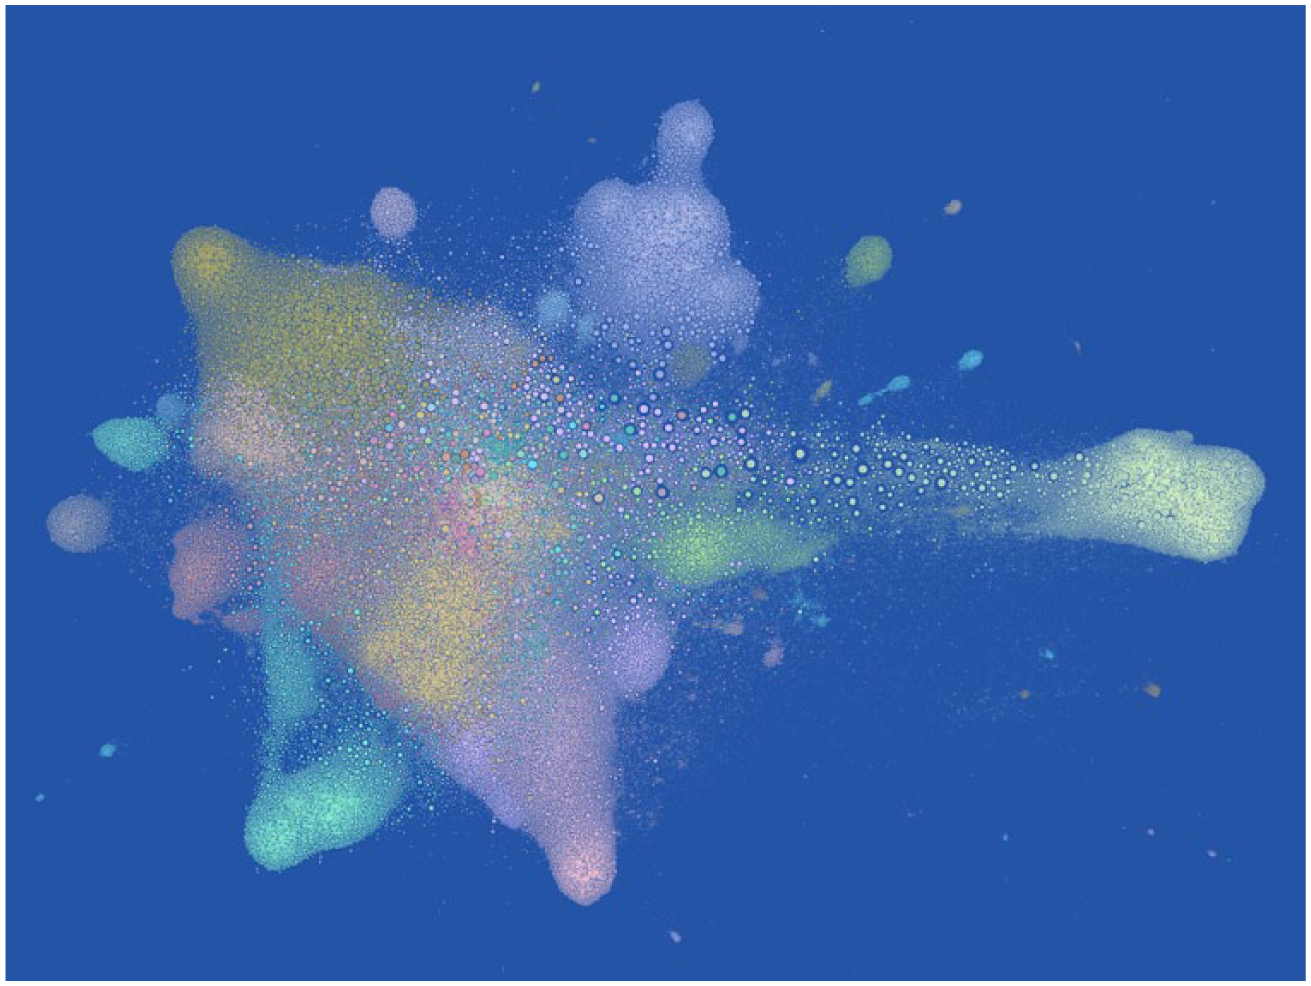
2016 Australian Twittersphere network. Nodes with global degree ≥1,000 shown only (n = 255,362); edges not shown. Nodes positioned using Force Atlas 2 algorithm in Gephi (Jacomy et al., 2014); node color using Louvain community detection algorithm (modularity resolution 0.5; Blondel et al., 2008) implemented in Python (Aynaud, 2016).
Figure 2 replicates this visualization at a modularity resolution of 0.25; we now see that some of the clusters previously shown as unified in Figure 1 have been subdivided into smaller, distinct sub-clusters, some of which are mirrored by the visual structure of those clusters. A mauve cluster at the center top of Figure 1, for instance, already showed signs of internal structuration; the sub-clusters identified in Figure 2 match those internal distinctions. We note here that the point of this is not that either of the community detection results is more correct than the other; rather, in combination, such multiple community detection steps at different modularity resolution levels can be used to create a quasi-hierarchical assignment of nodes to clusters, sub-clusters, and so on.

2016 Australian Twittersphere network. Node color using Louvain community detection algorithm (modularity resolution 0.25).
To examine the drivers of cluster formation in the Australian Twittersphere, we next moved to a qualitative inspection of each of the major clusters. Here, we filtered our overall dataset of Australian accounts in turn for the accounts belonging to each of the clusters detected by the Louvain community algorithm, at both the 0.5 and 0.25 modularity resolutions, and ordered these accounts in descending order of degree. For the most connected accounts in each cluster, we reviewed their profile information (in particular, the information provided in the Description and Location fields), noting any obvious commonalities between these leading accounts and assigning a descriptive label to each cluster.
For this review, we used the standard method of close reading, common for the assessment of unstructured texts, to examine the 100 leading accounts in each cluster. We chose this manual and qualitative approach to the surfacing of common themes between these accounts over available computational and quantitative methods (which may also have been applied to the full contingent of all accounts assigned to a specific cluster) for two main reasons. First, while the lesser accounts in a cluster are still likely to be part of the cluster because they share the same interests, they are less likely to explicitly state those interests in their profile information, and an automated analysis of such information might therefore fail to produce meaningful pointers to the cluster’s thematic focus. This might be addressed by focusing only on the most connected accounts in each cluster, as we have done in our manual close reading, but second, the set of distinct key terms that an automated content analysis and topic modeling based on their available profile information might generate would still require further qualitative interpretation to arrive at a set of clearly descriptive, distinct cluster labels. Therefore, we chose to bypass any quantitative, automated content analysis and instead relied immediately on manual, qualitative interpretation to develop our cluster labels; we undertook this process for the 100 leading accounts in the 30 largest clusters (in terms of their account population) at modularity resolution 0.5, and in the 75 largest clusters at the finer-grained modularity resolution 0.25; in each case, these clusters cover some 99% of the entire population of 255,000 accounts. Subsequent tests of automated keyword identification methods (not discussed in detail here), applied to the leading accounts in each cluster, have produced results that validate the outcomes of our close reading approach.
Figure 3 presents the combined results of this labeling exercise; to aid readability, we have restricted ourselves to labeling only the most immediately visible clusters and sub-clusters in the network. It is immediately evident that the cluster structure and their positioning relative to each other follow an internal logic: themes relating to news and politics, including specific political topics such as agriculture and (especially environmental) activism appear adjacent to each other and further away from unrelated topics; specialist or divisive topics ranging from teen culture and education to hard right politics and pornography present as comparatively more isolated clusters at a distance from the main body of the network than generalist and widely followed topics such as news or popular music. The network map presented in Figure 3 can be understood as a representation of relative affinity between issues and topics, as expressed through Twitter follower/followee patterns. Ignoring any visual layout differences caused by different Force Atlas 2 settings, the overall structure of these clusters and their affinities remains remarkably consistent on the whole with the preliminary map of the Australian Twittersphere presented in Bruns et al. (2014), even though that visualization was based on data gathered through a snowball crawl in 2011 and 2012; this suggests that the overall structuration of the Australian Twittersphere occurred relatively early, and that subsequently created accounts have largely settled into that structure rather than forming genuinely new clusters.

2016 Australian Twittersphere network. Clusters labeled following qualitative review of leading accounts in each community.
It is also notable that clustering patterns in the Australian Twittersphere largely appear to be thematically driven; geography appears to play a comparatively minor role in networking between Twitter accounts, even despite the considerable geographic distances between Australian population centers. This is in keeping with common assumptions about Twitter’s overall network structure, especially in comparison with Facebook, as we outlined them in the introduction; as a network that builds more commonly on weak, non-reciprocal ties, Twitter should be expected to transcend geographic settings more easily than Facebook, where strong, reciprocal online connections more often replicate pre-existing offline friendships and acquaintances. Some smaller geographically focused clusters do emerge in the Australian Twittersphere, however, including the South Australia cluster shown in Figure 3; that cluster, however, is centered not simply around ordinary Twitter users from the state of South Australia, but rather around Adelaide and South Australia tourism, events, and gourmet operators (which also explains its placing between the Arts & Culture and Food & Drinks clusters).
Table 1 presents the key metrics for the 30 largest clusters identified by the Louvain community detection algorithm, using a modularity resolution of 0.5. It shows a number of broad divisions within the Twittersphere. Users in the Teen Culture cluster (at the right of the map) make up the largest individual community by a considerable margin, comprising nearly 61,000 accounts (or 24%) of the total 255,000 accounts examined here; combined with their nearest network neighbors in the Television, Celebrities, Fashion, and Popular Music clusters, these accounts represent nearly one third of the entire population we examine here. But the Teen Culture cluster is also a remarkably recent development: while the 2011/2012 network reported in Bruns et al. (2014) contained a small cluster of such accounts, the vast majority of them have joined Twitter only significantly later. For each cluster, we calculated a median join date as the date at which half of the accounts now identified as belonging to the cluster had joined Twitter; for the Teen Culture cluster, that date is 20 May 2012, while for other large clusters it is much earlier—half of all Sports accounts had joined by 7 June 2011, for instance, while half of all Netizens and Aspirational Accounts were already on Twitter in the first half of 2010. (The overall median join date for the 255,000 accounts considered here is 22 July 2011.) This is evidence of a second wave of Twitter adoption among teen users in Australia, then (following a first wave during 2009 and 2010, during which some of the earlier clusters formed); this second wave was driven perhaps by encouragement from major teen idols such as One Direction and Five Seconds of Summer, for whom many of these accounts profess enthusiasm in their profile descriptions. Figure 4 documents this demographic shift, showing that during 2012 and 2013, some 40% of all newly created Australian accounts in each month settled into the Teen Culture cluster. (We note here that Figure 4 does not include any Twitter accounts that were created in the past but had been deleted or suspended by the time of our data gathering in late 2015 and early 2016, of course; this unavoidably skews the reported patterns to some extent.)
Key metrics for the 30 largest clusters identified by the Louvain community detection algorithm (modularity resolution 0.5).

List ordered by number of accounts in each cluster. Q1/2017 tweet data sourced from TrISMA (Bruns et al., 2016).

New Australian Twitter accounts per month in each cluster, expressed as a percentage of the total number of newly created accounts for that month. Accounts with global degree ≥1,000 shown only (n = 255,362).
The Aspirational Accounts and Followback Networking cluster (at the bottom of the map) represents the second most populous community in the network, and might be seen as a polar opposite to the Teen Culture cluster. As noted, this is one of the earliest communities to be established in the Australian Twittersphere. This has been one of the most difficult clusters to label: its members largely appear to have joined Twitter at the height of the early social media marketing hype, and include a number of social media marketing businesses and self-declared social media gurus; service providers in real estate, finance, and legal fields; self-improvement and life coaching practitioners; and other accounts promoting aspirational goals in personal and professional life. Mixed with this are a number of automated inspirational accounts (posting bible quotes and similar content), and we also detected a considerable presence of “guaranteed followback” services offering a quick boost to an account’s social media metrics. Especially compared to the Teen Culture cluster, however, this part of the network is now relatively inactive: while the teen accounts have posted nearly 707 million tweets to date (translating to 11,596 tweets per account), the aspirational accounts have contributed only 163 million tweets (or 6,354 tweets per account)—even though their considerably greater median age gave them two more years to do so. Unlike the Teen Culture accounts, we therefore interpret this cluster as a community in long-term decline, whose member accounts might still exist, but no longer engage on Twitter particularly actively. It is also possible, however, that these accounts still actively follow others’ Twitter activities, “listening” for new updates (Crawford, 2009), with limited interest in posting new content of their own.
The third largest cluster, Sports (with two separate adjacent clusters for Cycling and Motorsport; at the top of the map), emerged as part of the major wave of Twitter adoption in Australia and has exhibited comparatively steady growth since then. It is notable especially for a particularly high percentage of verified accounts: nearly 11% of all accounts in this cluster have received Twitter’s “blue tick,” while only 0.6% of accounts in the Teen Culture and 0.2% of the Aspirational Accounts cluster are similarly verified. As the Politics cluster, which we discuss below, shows a similarly high percentage of more than 9%, we interpret this as evidence of Twitter’s proactive approach to offering verification especially for accounts in conventional areas of public communication, including media, entertainment, sports, and politics; indeed, past reports suggest that in sports and politics Twitter Australia has directly approached key actors and organizations to fast-track their account creation and verification (Jackson & Christensen, 2012). It should be noted, however, that Twitter has recently relaxed its verification regime, opening up verification to more ordinary users (Griffin, 2016); a future repeat of this study may well find a change in verification patterns, therefore.
The Netizens cluster (at the center bottom left) represents another very long-established community in the Australian Twittersphere. Its median join date of 4 May 2010 is slightly later than that of the Aspirational Accounts, but this is due to the Netizens cluster’s continued activity and evolution. Figure 4 shows that Netizens constituted by far the largest group of new accounts joining Twitter in Australia until late 2008, when a more diverse range of new users became interested in the platform—but contrary to the Aspirational Accounts, the Netizens cluster has also experienced a recent renaissance: since early 2014, some 7% to 12% of the new accounts joining Twitter per month have settled in the Netizens cluster. (As our analysis here is focusing on accounts that have accumulated a total of 1,000 or more follower/followee connections, however, this could also indicate that it is comparatively easier for accounts in the Netizens cluster to make such connections than it is in other clusters. In a future analysis, we will test whether the present pattern holds if all 3.72 million Australian Twitter accounts are considered.) It is notable in the network visualization that the Netizens cluster is considerably less distinct in its positioning relative to the remainder of the network; this indicates that these accounts are also generally more readily followed by others in the network, regardless of topical interests. As one of the Australian Twittersphere’s earliest populations, Netizens have remained central to its activities in a way that other long-present groups—such as the Aspirational Accounts—have not.
The final major segment of the Australian Twittersphere (top left in the map) is concerned with politics; it comprises the main Politics cluster as well as a number of adjacent clusters with a political focus, including a distinct Hard Right Politics cluster, Activism and Charities, and one part of the Food and Drinks cluster that is concerned especially with agricultural policy, farming, and environmental protection. This latter segment is categorized as part of the Food and Drinks cluster at modularity resolution 0.5 (turquoise in Figure 1), due to the obvious links (in shared interests as well as explicit follower/followee connections) between food production and food consumption, but becomes a separate agriculture sub-cluster at modularity resolution 0.25 (purple in Figure 2); the Force Atlas 2 network visualization algorithm already places this sub-cluster close to Politics and Activism, and at some distance from the rest of Food and Drinks. The Politics cluster also transitions by degrees into the Miscellaneous and Generic cluster at the center of the map, which contains a number of the major news accounts in the Australian Twittersphere; this demonstrates the considerable role that Twitter plays as a platform for information dissemination (rather than “only” for social networking).
Cluster Activity
While the network analysis and interpretation of the cluster structures already provides valuable insights into the make-up of the Australian Twittersphere, it is just as important to review the extent to which any of these clusters actually contribute to tweeting activity in Australia; large clusters that are present in the network but fail to contribute a substantial volume of tweets will be comparatively invisible to ordinary Twitter users, while smaller clusters of extraordinarily active accounts may make themselves disproportionately visible. For the following analysis, we draw both on the total number of lifetime statuses (i.e. tweets) that the Twitter API reported for each of the profiles we identified as Australian and on an additional data source: the TrISMA infrastructure (Bruns et al., 2016), which tracks the public tweets of all 3.72 million Australian accounts identified by 2016 on an ongoing basis. From TrISMA, we have selected all tweets posted by the 255,000 accounts in our dataset during the first quarter of 2017, resulting in a dataset of some 51.4 million tweets. As noted above, these constitute 43.6% of the 118 million public tweets posted in Q1/2017 by the 3.72 million accounts in the overall Australian Twittersphere, proving that the 255,000 most connected accounts are also among the most active.
Table 1 shows the total number of tweets posted by accounts in each cluster (at modularity resolution 0.5) during their lifetime, the average number of tweets per account that this represents for these clusters of different sizes, as well as the average and median number of tweets posted per day by the accounts in these clusters (this calculation uses the specific join date for each account). In addition, we show the total number of tweets per cluster in Q1/2017, the average number of tweets per account, and the average and median number of tweets per day per account in each cluster.
It is immediately obvious from these figures that posting activity is very unevenly distributed across the clusters, both historically and in Q1/2017. In particular, the comparatively small Hard Right Politics cluster with its 1,540 member accounts is exceptionally active; accounts here have posted an average of 17,094 tweets in their lifetime, or 12.51 tweets per day (the median is 4.65). In Q1/2017, these accounts posted an average of nearly 1,200 tweets each, or 13.32 tweets per day; this amounts to well over half the number of tweets posted by the Netizens cluster, which contains more than 10 times more accounts. The overall Politics cluster constitutes the next most active group in the Australian Twittersphere, with a historical average of 7.19 tweets per day and some 750 tweets per account, or 8.34 tweets per day per account, in Q1/2017; here, however, the historical median is only 1.90 tweets per day per account, suggesting a far greater discrepancy between a small number of very active posters and a large majority of much less active participants than is present in the Hard Right Politics cluster. This is likely to point to considerable differences in posting styles and commitment between the highly partisan group in the latter cluster and the more balanced population of accounts in the former. Meanwhile, the overall heightened level of posting activity among political accounts in Australia, in comparison to their less political counterparts, might be explained by the considerable political instability that Australia has experienced at state and federal levels since 2007 (see, for example, Highfield & Bruns, 2016), while the further increase in Q1/2017 is likely driven also by intensified discussion of the US presidential transition and the early steps taken by the Trump administration. For both the Politics and Hard Right Politics clusters, however, the Q1/2017 median remains just below one tweet per account per day, showing that a handful of very high-volume contributors are now dominating proceedings.
In contrast, the Teen Culture cluster displays a highly variable tweeting behavior. Historically, it has the second highest average number of tweets per account per day, at 9.00; at 3.08, the median is similarly high and indicates a notable but nonetheless comparatively smaller skew between more and less active posters. For Q1/2017, however, the total number of tweets posted per account is only 179, producing an average of 1.99 tweets per day that is well below the cluster’s historical performance. The median is 0: some 36,625 accounts in this cluster, or 60%, had not yet posted a single tweet in 2017. It remains to be seen whether this is a seasonal pattern—teenage users may be more likely to be away from Twitter during the Australian summer school holidays, which generally last until the start of February–, or whether this indicates that ordinary teen users have largely transitioned from posting to listening (i.e. following their favorite stars, but not interacting with them), or even that they have already moved on from Twitter to other, more recent social media platforms.
The Aspirational Accounts cluster, finally, similarly appears to have become largely dormant. Historically, it records a mid-range level of posting activity, with an average of 3.31 tweets per account per day; the comparatively low median of only 0.38 tweets indicates a substantial divergence between a handful of very active and a majority of comparatively inactive accounts. By Q1/2017, that rate has dropped even further: accounts in the cluster posted only an average of 1.13 tweets per day—the lowest posting rate of any of the most populous clusters in the network. Its median is also 0: here, 17,644 accounts, or 69%, had not yet posted in 2017. This adds evidence to our earlier interpretation of the Aspirational Accounts community as a cluster in long-term decline: since 2013, it has attracted only a comparatively small number of 1,533 new members (with more than 1,000 global follower/followee connections), and the posting activities of its existing members have declined considerably over time. Perhaps the era of personal advancement and self-promotion through social media marketing, which many of the accounts in this cluster represent, has come to an end as Twitter and other social media platforms have become normalized into everyday use.
In comparison to historical performance, we note that in Q1/2017 the average number of tweets per account per day has dropped in all clusters except for Politics and Hard Right Politics; the average difference is −1.60 tweets per account per day. The Q1/2017 median has similarly declined across all clusters, including the politics communities; here, the average difference is −1.04 tweets per account per day. It is tempting to interpret this as a general decline in tweeting activity in Australia, as well as (in the politics clusters) a growing concentration of active tweeting activities around a small number of very active accounts. However, we note again that Q1/2017 includes the Australian summer holidays in January and February, which may well account for this overall reduction, and that the turmoil surrounding the early months of the Trump administration would readily explain why politically focused accounts (and especially a smaller group of accounts with an interest in US politics) would have been comparatively more reluctant to take a break from Twitter over the summer. Longer-term observation of posting trends in each cluster throughout the remainder of 2017 will reveal the relative increase or decline in posting activity in different parts of the network—and with reference to Crawford (2009), we again note that an absence of active posting does not necessarily translate to an absence of active yet unobservable engagement with what happens on Twitter.
Conclusion and Further Outlook
Our analysis here presents a fundamental overview of population and activity structures and dynamics in the Australian Twittersphere; it serves as a first general baseline against which more specific and short-term patterns can be measured. Further work will also need to address the considerable computational challenge of mapping and analyzing the full network of 3.72 million Australian accounts and their 167 million follower/followee connections among each other.
That analysis may well find significantly different patterns: the effect of our choice to limit this study to accounts with at least 1,000 follower and/or followee connections within the global Twittersphere has yet to be fully understood, but it is likely to have privileged older, better established, and more active accounts as these are more likely to have amassed the required number of follower/followee connections. This limitation may also have served to produce more clearly defined network clusters: Twitter accounts with fewer connections in the network may well remain more random in their following choices, thereby increasing the blurring across cluster boundaries. We note that these assumptions, too, are yet to be tested in further research, however.
What our study has already demonstrated, though, is that among the 255,000 best-connected accounts in the Australian Twittersphere—which we regard as a critical backbone to the overall network—there is a tendency to form clear clusters, and that for the most part these clusters show remarkable long-term stability, as a comparison with Bruns et al. (2014) shows. Furthermore, it is notable that these clusters are predominantly thematically focused; geography plays only a very limited role here. The Australian Twittersphere is indeed a space for nationwide public communication, even in spite of the substantial geographic distances between participants. It would be desirable to apply our approach to other national Twitterspheres, to compare their patterns with those we have presented here; the methodological detail we have presented here should enable other researchers to join this effort, even if Twitter, Inc.’s increasingly hostile approach toward independent public-interest research serves to create additional obstacles to doing so.
Our analysis of account join dates and comparison of lifetime and Q1/2017 tweeting activities also demonstrates that the presence of these clusters in the network, and their contribution to the public conversation, has ebbed and flowed over the years. The Australian Twittersphere has evolved from an environment that was dominated in earlier times by technologists and self-styled social media experts to a far more diverse space where topics such as sports, politics, and celebrity culture led the discussion; any long-term analysis of prominent keywords and hashtags in tweets, or of the major trending topics of the day, should also demonstrate these trends. In particular, our analysis shows a major influx of accounts with an interest in teen bands such as One Direction and Five Seconds of Summer that is most pronounced in 2012 and 2013 and represents a kind of secondary adoption of Twitter by Australian users of a different demographic, who for a time are also exceptionally active in their tweeting; however, the more recent data sourced from TrISMA also indicate that this cluster is by now significantly less enthusiastic about its active tweeting than it once was, even in the context of a general slow-down in tweeting activity across most clusters during Q1/2017. Against this trend, by contrast, political accounts are currently performing well above their long-term average, and we strongly suspect that this is due to current political uncertainties at domestic as well as international levels.
Thus, while—as we noted in the introduction—past studies such as Kwak et al. (2010) sought to determine whether Twitter was predominantly used as a platform for social networking or as a medium for tracking current news events, and while Osborne and Dredze (2014) clearly see Twitter as responding most rapidly to breaking news, for the Australian Twittersphere there is no one predominant use. Groups that may be associated particularly with news and information dissemination (such as the various News, Politics, and Sports clusters) as well as communities for whom social networking should be assumed to be a major driver of participation (including Netizens, Aspirational Accounts, and Teens) have each been prominent at various times during Twitter’s history in Australia, both in terms of new accounts joining the platform and in terms of their posting activity. Such gradual fluctuations in their presence on the platform, occurring at a timescale of months and years, are to be explained partly by contemporary developments, and partly by broader shifts across the overall social media ecology: they are likely to result both from external news events that attract users to active participation, and from the network effects of population shifts between Twitter and its competitors, and in tandem these two factors again document the dual social network/news medium nature of Twitter.
The Australian Twittersphere remains a lively, continuously mutable environment, therefore, and at present it appears that news-related uses are once again in the ascendancy. Our TrISMA data do show a slow-down in tweeting during Q1/2017, but the extent to which this is due merely to the January/February summer holidays is as yet unclear; we note that overall TrISMA data for the entire population of 3.72 million Australian Twitter accounts point to a stable weekday level of about 1.3 million tweets per day in 2017 to date. The network clusters we have identified and defined in this study will enable us to study the relative thematic interests, participatory patterns, and communicative contributions to that overall activity that each community in the Australian Twittersphere makes to its overall public conversation; over time, then, this points to the relative presence of different groups and interests within Australian public debate.
Footnotes
Declaration of Conflicting Interest
The author(s) declared no potential conflicts of interest with respect to the research, authorship, and/or publication of this article.
Funding
The author(s) disclosed receipt of the following financial support for the research, authorship, and/or publication of this article: This research was supported by the Australian Research Council through the ARC Future Fellowship project Understanding Intermedia Information Flows in the Australian Online Public Sphere and the ARC LIEF project TrISMA: Tracking Infrastructure for Social Media Analysis.