
Abstract
Purpose
This study designs and provides a pilot evaluation of a novel surrogate lower limb (SLL) that provides anatomically realistic three-dimensional (3D) foot motion, based on a literature consensus of passive lower limb motion. This SLL is intended to replace single axis surrogates currently used in mechanical testing of ankle-foot orthoses (AFO).
Material and Methods
The SLL design is inspired by the Rizzoli foot model, with shank, hindfoot, midfoot, forefoot, and toe sections. Ball and socket joints were used between hindfoot-midfoot (HM)-forefoot sections. Forefoot-toes used a hinge joint. Three-dimensional printed nylon, thermoplastic polyurethane (TPU) and polylactic acid (PLA), as well as casted silicone rubber were used to re-create foot components. After fabrication, motion capture was performed to measure rotation using fiducial markers. The SLL was then loaded under both static and cyclic loads representing a 100 kg person walking for 500,000 cycles.
Results
Most joints were within 5° of target angles. The SLL survived static loads representing 1.5 times body weight for both static and cyclical loading.
Conclusions
This SLL moved as designed and survived testing loads, warranting further investigation towards enabling essential mechanical testing for AFO currently on the market, and helping to guide device prescription.
Introduction
Ankle-foot orthoses (AFOs) assist individuals who have problems controlling their lower limb. While many AFO designs exist, 1 the principal goal is to control ankle rotation by providing additional stiffness to the joint. Since AFOs are highly diverse in their designs, a method for evaluating device durability and function would be valuable to inform prescription. However, AFOs cannot be mechanically evaluated without a lower limb. Since a human limb could be damaged during testing, a surrogate limb is required.
While ISO testing standards remain in development, several methods were developed for testing AFO properties, including stiffness and range of motion (RoM). DeToro 2 and Golay et al. 3 studied AFO motion using passive surrogate lower limb (SLL) designs with simple single-axis joints located at the ankle. DeToro also had a passive hinge joint at the metatarsophalangeal (MTP) joint. These testing apparatuses required destructive fasteners to secure the AFO to the SLL and other apparatus components. Kobayashi et al. 4 created a surrogate shank to test AFO stiffness in a non-destructive manner, with the AFO retaining structural integrity after testing. However, since the shank had no joints, Kobayashi’s surrogate design did not reproduce anatomical motions. Bregman et al. 5 designed a testing apparatus that included the ankle joint and MTP joint. Their testing apparatus was non-destructive and included six different passive SLL sizes for better anthropometric representation; however, the testing apparatus could only be used along a single-axis.
Given that most modern AFO designs move in three-dimensions, testing methodologies should incorporate realistic motion beyond plantarflexion/dorsiflexion. Since AFOs assist individuals with different pathologies and limitations, SLLs used for testing should represent three-dimensional (3D) movement specific to the pathologies and limitations of interest to better direct clinical decisions. Passive motion is especially critical given that AFO users may have limited active rotation within the ankle-foot complex and may be limited to passive motion. No SLL designs that provide appropriate 3D representation of passive ankle-foot complex movement and that are suitable for mechanical testing have been reported. Therefore, this study looks at the design and pilot evaluation of a novel SLL that replicates 3D passive foot-ankle ranges of motion and can be used with an AFO for load and cyclic testing.
Overall design
Surrogate lower limb design criteria
Anatomical joint rotation angles required by the SLL design.

Furthermore, the SLL should be capable of bearing loads representative of real AFO use cases, under both static and cyclic conditions. The SLL will, therefore, be designed to withstand critical loads during AFO testing corresponding to a 80–100 kg user weight range, based on an average Canadian adult male weighing 86.8 kg. 8 When used in conjunction with an AFO, the SLL should be designed to survive critical loads inspired by ISO 10328:2016 (Prosthetics. Structural testing of lower-limb). Although this standard was created for lower limb prosthetics, ISO 10328 provides a reasonable basis on which AFO testing loads can be considered, especially since no AFO testing standard currently exists.
The design should also represent the individuals’ anatomy and joint movement. As such, the SLL should be designed to scale anthropometrically based on foot size, going from adult US male size 6 to 16. Different scaling options will be implemented in the future to include female sizing, as well as different foot size scaling ratios.
To allow clinicians, industry experts, and researchers to easily obtain or print components, materials and fabrication processes should be chosen to be readily available and components should be chosen to be cost-effective and easily procured (i.e. specialty components should be avoided). Fabrication tools that can be used in the lab (i.e. 3D printers) are selected as the main fabrication method for these reasons, assisted by minimal and simple component machining. Since cost is often a limiting factor, minimizing fabrication costs should be considered during the design phase. Fabrication costs should enable cost-effective prototyping. The SLL should cost no more than $1000 USD to ensure cost is minimally restrictive.
Design description
To simplify ankle-foot motion analysis, researchers have segmented the lower limb into multiple rigid bodies and ignored certain joints. The Rizzoli Foot Model 9 accurately and effectively modeled lower limb motion during gait, 10 using 3D body landmark coordinates. While designed for motion capture, this model was the basis for the SLL CAD model. The Rizzoli model simplifies the 28 ankle-foot bones into shank, rearfoot, midfoot, and forefoot sections. The shank includes the tibia and fibula, the rearfoot represents the calcaneus, the midfoot represent the navicular, cuboid, and cuneiform bones, while the forefoot includes the metatarsals. The hallux was defined as a vector instead of a full segment.
Using the Rizzoli model as inspiration, the SLL design segmented the ankle-foot complex into five segments connecting at four joints: shank-hindfoot (SH) mimicking the combined talocrural and subtalar joints; hindfoot-midfoot (HM) simulating the midtarsal joints; midfoot-forefoot (MF) mimicking the metatarsal-tarsal joints; and forefoot-toes (FT) representing the MTP joints. The goal of this simplification was to reproduce normal ankle-foot-complex physiology, while retaining essential motions. Figure 1 shows the final SLL model with these joints highlighted. All SLL CAD files, along with engineering drawings, are available via a persistent online repository.
11
SLL assembly (left) and foot joints (right).
Ball and socket joints were used for the SH, HM, and MF joints because the required motions were across multiple planes. Since the MTP joint only rotates in the sagittal plane, a hinge-type joint was designed, consisting of double cantilever snap-fit connectors to ensure a secure connection.
Two different ball and socket joints were used for the SLL design. The SH involved a metal ball stud that sat inside a nylon socket. The socket was sectioned into two components (heel base and heel plate) so that the ball stud could be properly inserted. The HM and MF ball and socket joints were integrated inside the foot components (Figure 2). These joints were centered on the foot segment proximal and distal surfaces to better control 3D rotation and accommodate all motion-defining features. These two ball and socket joints were secured with annular snap-fit connectors, preventing separation, but allowing rotation via the connector’s bending action. Joint stiffness was related to the connector’s material properties and geometry. Midfoot (blue outline) meshing with forefoot (green outline) to form the MF joint.
Joint connectors
The three distal joint (HM, MF, FT) connectors were designed to be flexible yet sturdy, providing joint stiffness that matched anatomical joint stiffness.
Cantilever snap-fit connectors
The toe segment integrated both motion-defining features and connecting elements. To constrain FT RoM, the toe segment’s proximal surface facing the forefoot was rounded according to a geometry that provides appropriate rotation (Figure 3). From the apex of the curved surface, two cantilever snap-fit connectors protruded out, connecting the toes to the forefoot. Toe segment (red) and forefoot segment (gray) forming the FT joint.
The curvature’s apex height and length were calculated with a constant arc length and known rotation, providing proper RoM.
The connector involved two back-to-back snap fit cantilever beams (Figure 4). Given that snap-fit hooks are not intended to move once installed, the two connectors were attached to a bending strip that enabled FT joint rotation. The bending strip’s dimensions were designed to replicate MTP joint stiffness. Heng et al.
6
determined that MTP joint stiffness can vary between 0.66 and 56 FT connector top view, with main features highlighted. A and B = snap-fit cantilever beams, C = bending strip, D and E = snap-fit connector notches.
Annular connectors
The HM and MF ball and socket joints required a connector to hold both components together during rotation. These connectors were designed to be inside the ball joints, allowing rotation in all anthropometric directions while defining joint stiffness from within. These connectors were made circular to also allow rotation in the frontal plane. The connectors had three main sections: a solid middle section that defined the bending and torsional stiffness of each joint, notched ends that locked the connectors in place, and torsion rails preventing free rotation in the frontal plane (Figure 5). Annular connector, main features.
Both HM and MF connectors were dimensioned to create identical bending stiffnesses, based on a male ankle stiffness of 100
Along the connector lengths, two rails were added to provide torsional resistance during HM and MF eversion-inversion. These rails prevented the connectors from freely rotating inside their sockets during frontal motion. These rails were dimensioned to add stiffness and prevent slipping or shearing. Adding stiffness to frontal rotation was essential, given that anatomical kinematics are hindered by some resistance to rotation in this plane.
Motion constraints
Target versus experimental (pre-cast and post-cast) joint rotation angles.

Shank-hindfoot tapered opening
The SH socket was created with an opening to let the ball stud neck through. This opening tapered to allow the neck to move with the desired maximum RoM in all directions (Figure 6). To create a tapered opening that dictated maximum possible rotation, four guiding points were added to the frontal and sagittal planes. These corresponded to maximum eversion and inversion (Figure 6-right, points A and B, respectively) on the frontal plane and maximum dorsiflexion and plantarflexion (Figure 6-right, points C and D, respectively) on the sagittal plane. Since maximum eversion and dorsiflexion can occur simultaneously, an additional point was defined at their orthogonal cross-section (Figure 6-right, point E). Similarly, maximum inversion and plantarflexion can occur simultaneously and was defined by an additional point at their orthogonal cross-section (Figure 6-right, point F). These points were used to create an irregular oval (Figure 6-right) that guided the tapered opening design. The opening enabled the shank to rotate with respect to the heel in the appropriate manner, replicating talocrural and subtalar kinematics. Side view of the SH ball and socket joint (left) with top view of opening (right).
Joint stiffness was controlled by four elastics connecting the upper SH plate to the shank shaft. Each elastic band was cut from extra-heavy resistance bands made by Haquno, 12 having a resistance of 10.4 N/mm, measured experimentally. This stiffness was selected for its ability to hold the weight of the foot. The four elastics covered the shaft’s circumference, separated by a small gap to prevent overlap.
Hindfoot-midfoot and MF angled surfaces
To enable proper sagittal and transverse motion, material surrounding the HM and MF joints were tapered inward (Figures 7 and 8). These surfaces were created by removing triangular wedges from the midfoot digital file, centered on the joints, and extending to the outer edges. The cuts were defined by the relevant maximum motion angles for the joint (Table 2). All these motion limiting features were added on the midfoot so that, if RoM alterations are required, fewer segments would need to be modified to reflect foot rigidity or slackness. Foot deformities or abnormalities were not considered for this pilot study, since the scope was limited to healthy foot physiology. These cuts created an asymmetric pyramid on each side since some wedges were shallower than others. The digital cuts were created first, then the joint’s protruding ball features were added so that the balls properly connected to the angled surfaces. These angled surfaces enable rotation while preventing overextension. SLL side view with HM and MF angled surfaces highlighted (dorsiflexion-plantarflexion). SLL top view with HM and MF angled surfaces highlighted (abduction and adduction).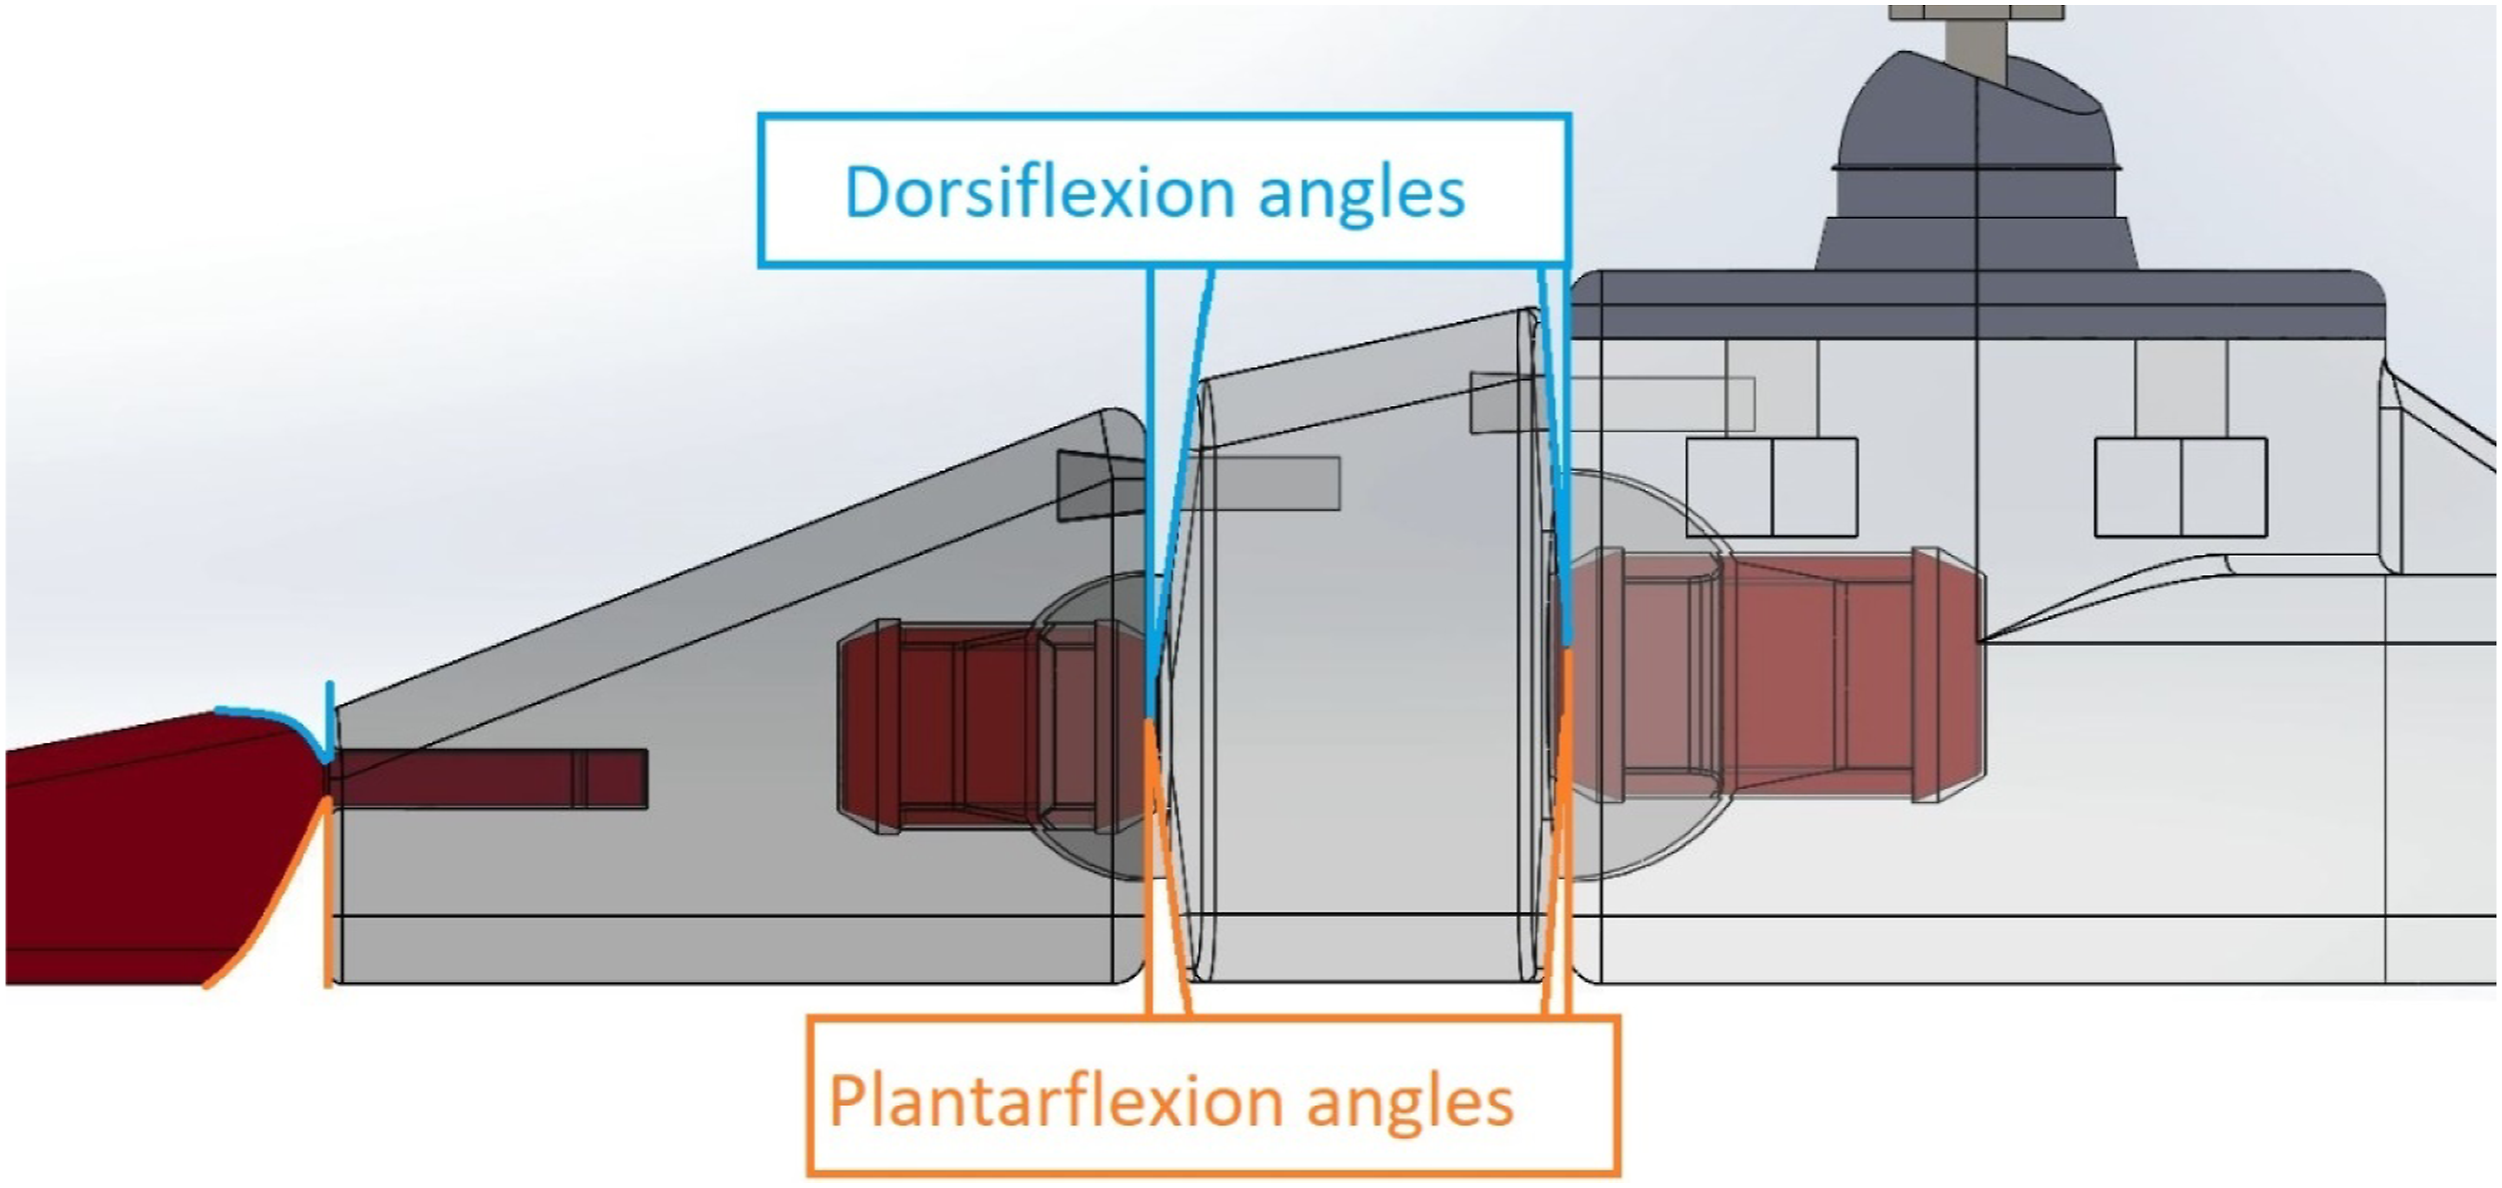

Guide pins
The HM and MF angled surfaces were designed to define maximum sagittal and transverse rotations, but another feature was required to limit frontal motion. The maximum planar rotation was constrained by guide pins above the ball and socket joints. On the proximal surfaces, pins protruded above the ball and socket joints. On the distal surfaces, grooves were created above the socket at a matching height. The grooves were curved around the joint, with the curvature centered on the joint. The curvature extended on each side by the desired maximum eversion and inversion rotation angles (Table 2).
Given the pin’s protruding length, the guiding grooves were flared out internally so that when the joint rotated in sagittal or transverse planes, the pin’s tilt would be accommodated.
Anthropometric scaling
Given that human RoM varies between individuals, all motion constraining features were designed to be modifiable before fabrication. Given that this pilot study focused on validating the basic principles of the design, scaling was limited to one average male foot size. Future research could evaluate the SLL with the full range of sizes and both male and female foot dimensions. Therefore, clinical technicians and researchers could change angled surfaces or guiding grooves to better match the intended user’s pathologic conditions.
Furthermore, since the SLL should accommodate a large variety of limb sizes, SLL inner foot components and the shank cover dimensions were set to scale proportionally to
The mold used for the silicone rubber is based on a prosthetic foot cover CAD file provided by Össur™ and was also set to scale anthropometrically. However, while the main SLL components scale directly with
Fabrication
The shank consisted of a metal shaft providing strength and a plastic cover surrounding the shaft, providing the appropriate anatomical shape. The shank section was created using an open-sourced prosthetic shank model that emulated anatomical geometry. The model’s internal aspects were changed to fit the SLL shaft, but the external geometry was retained. The shank was kept as a rigid body to provide a viable surface for the AFO shank section. Users could add a softer layer on the outside of the shank section if they desire to provide more soft tissue-relevant performance; however, this may not change the AFO mechanical test results. The cover, as well as the foot components, were made using fused deposition modeling (FDM). This process was selected for its low-cost, low barriers to entry, and wide availability. The main material used for the foot components was nylon 230, made by taulman3D. 13 This material is stronger and less brittle than the more widely used polylactic acid (PLA). Nylons are also easier to use than other strong thermoplastics, such as acrylonitrile butadiene styrene, because toxic fumes are not emitted during printing. Furthermore, nylon offers higher fatigue resistance than PLA or acrylonitrile butadiene styrene.14,15
The two annular connectors and the toe segment were printed using thermoplastic polyurethane (TPU) filaments. For this design, Cheetah filament from NinjaTek was chosen after experimentally testing the filament. This filament was 95 on the shore hardness A scale, which printed easily but also allowed adequate bending within the SLL design’s dimensional constraints.
Elastomers such as silicone rubber and polyurethane are durable materials with adequate density, hardness, and malleability to emulate soft tissue. Silicone rubber can be obtained in a form that has a closer stiffness to soft tissue than polyurethanes. 16 As such, silicone rubber was chosen to surround the foot segment and provide the final anatomical shape. Silicone rubber durability was a vital factor for the SLL; therefore, 30A shore hardness was selected to represent tissue while being robust enough to survive cyclic loading. To preserve motion constraint features, the nylon components were covered in a thin water-proof wrap before casting to prevent silicone rubber from filling the gaps.
A PLA mold was 3D printed to cast the silicone rubber around the foot, based on an Össur prosthetic foot cover model (FSTM26R). The mold included metal pins to elevate the foot above the mold’s inner surface, creating a cavity that could be filled by the silicone rubber and encapsulate the foot (Figure 9). These pins were created by machining the length of flat headed nails. Mold model.
Pilot testing
The purpose of this pilot test is to verify if the SLL design is worth investigating further with regards to achieving the original design criteria. The initial test should evaluate kinematics and test loads, while retaining the material and fabrication equipment objectives, but do not need to verify ultimate load capabilities of the SLL itself. Kinetics and stiffness, essential components of ankle-foot complex movement, will be tested in a future study.
A proof-of-concept SLL was made with anthropometric properties representing an average and healthy adult male (FL of 270 mm) without pathological problems. Multiple surrogate limbs will need to be tested in the future to ensure the design meets requirements across the full range of dimensions and pathological traits of interest. Each joint’s motion is tested to ensure proper RoM, then the SLL is loaded in an AFO to confirm that the SLL can sustain expected test loads. While ISO 10328 provides a good reference for implementing test loads of an AFO, prosthetic devices bear full gait loads reliably by themselves, whereas the SLL would never be tested alone. Rather, the SLL would always be supported by an AFO. The SLL – AFO combination should be subjected to static and cyclic tests to ensure that the AFO can withstand typical lower limb loads. However, for this pilot test, the SLL – AFO combination will not be verified against static proof test loading, as per the ISO 10328 standard.
For this pilot test, the SLL will be evaluated based on loads that the anatomical lower limb typically experiences during normal walking. In this case, a 1500 N maximum static load was selected to represent peak loading during walking (1.5 body weight for a 100 kg person). 9 A 30 s duration was selected, based on the ISO 10238 standard. 10 For cyclic conditions, a sinusoidal load ranging between 50 N and 1300 N was selected, representing average loads during walking that frequently reach 1.3 times body weight. 9 The load frequency is chosen to be 1 step/s, representing one half a healthy adult cadence, 11 since only one leg is tested. Therefore, as a pilot test for the design, an initial cyclic duration of 500,000 cycles was selected to test fatigue. To ensure the SLL withstands gait loads, testing will load the device in the heel position (load angled at 15°) and forefoot position (load angled at −20°), as per ISO 10328. 17
Human joint kinematic variations are affected by several factors, including sex, body proportions, and structure. Moromizato et al. reported that joint rotation angles had standard deviations greater than 5° for most joints, and ankle rotations had a standard deviation of 6.5° across both females and males. 18 As a result, motion testing during this pilot study will be deemed a success if joint rotations are within 5° of the RoM values found in the literature for healthy adult males (Table 1). The design of joints rotating more than this range will require further investigation to bring them within a successful RoM.
Load testing will be deemed successful if the device can survive both static and cyclic tests without major impact to the SLL’s structure or its ability to rotate based on passive kinematics. To ensure that cyclic testing has minimal impact on the SLL, motion testing will be repeated after conducting the cyclic tests to measure the effects of fatigue. Cyclic loading will be deemed successful if the SLL can stay within 5° of the RoM highlighted in Table 1 after completing 500,000 cycles in both heel and forefoot positions. If not, the design’s fatigue resistance will need to be investigated further.
Motion testing
To test SLL joint motion, time-stepped component angular motion was tracked using AprilTag2 fiducial markers, an Android Samsung Galaxy S9 + phone, and the “Biomechanics Augmented Reality – Marker” (BAR-M) application developed by Basiratzadeh et al.19,20 The BAR-M application has an angular accuracy of 0.29° and linear accuracy of 0.27 cm in static conditions. Surrogate lower limb joint rotation angles were calculated by securing markers on the SLL segment surfaces and aligning the smartphone parallel to the plane of motion being measured. Due to COVID-19 restrictions, motion capture and measurements were limited to what was accessible. As such, this proven and accessible method was selected. Manual loading ensured that each joint rotated to the end of the natural passive RoM. Future SLL evaluations will include a purpose-built measurement apparatus for motion and force measurements.
The BAR-M app provides marker corner locations in Cartesian coordinates for every recorded frame. Each tag had a vector, based on the bottom corners, forming the bottom edge. Every vector had the same orientation for consistency. The relative angle (
The SLL foot components were assembled and tested before being cast in silicone rubber to confirm that the design worked as intended. Motion was then tested again after casting to confirm that motion remained adequate. After static and cyclic testing, the SLL foot motions were tested a third time to evaluate the effect of fatigue on motion.
A test was performed for each joint planar direction. The foot was firmly placed in a vice with the desired joint free to move within the plane. For each test, one marker was placed on the proximal component, which was fixed. Another marker was placed on the distal component, which was free to move (Figure 10). Pre-cast SLL SH sagittal testing configuration.
The smartphone was set on a tripod, in portrait orientation, back camera facing the block, phone level to the ground. The tripod was placed close to the vice to maximize marker size within the camera’s viewing area (Figure 10). To mitigate camera motion errors, interactions with the camera were minimal.
Three trials of the following protocol were completed consecutively for each joint’s relevant motion planes: (1) Started with the joint in the neutral position for 5 s (2) Rotated the joint manually clockwise for 5 s (3) Released for 5 s to enable the joint to return to neutral (4) Rotated the joint manually counterclockwise for 5 s (5) Released for 5 s to enable the joint to return to neutral
For SH rotation, the ball stud did not have a neutral rest position without load. As such, HM motion tests were performed from the maximum clockwise rotation angle to the maximum counterclockwise rotation angle in both frontal and sagittal planes, skipping the return to neutral position steps.
The post-cast motion testing methodology was identical to pre-cast testing. The markers were placed at the same locations, based on the pinholes left by the mold pins. To prevent the vice from damaging the silicone rubber, protective cardboard was inserted between the cast foot and the vice.
The angles for each neutral or rotated position were averaged over a minimum of 50 frames to get one data point for each trial. Maximum rotation angles for each joint were calculated as the difference between neutral and rotated positions. Results from all three trials were further averaged together to provide one main datapoint for each direction. For SH motion, measurements showed full rotation within a plane (i.e. maximum dorsiflexion to maximum plantarflexion and maximum eversion to maximum inversion).
Motion results
An example of pre-cast and post-cast angles during a trial is shown in Figure 11. Pre-cast and post cast maximum angle results for all joints are given in Table 2. Pre-cast versus post-cast example for manually induced rotation (MF joint frontal motion: eversion-inversion).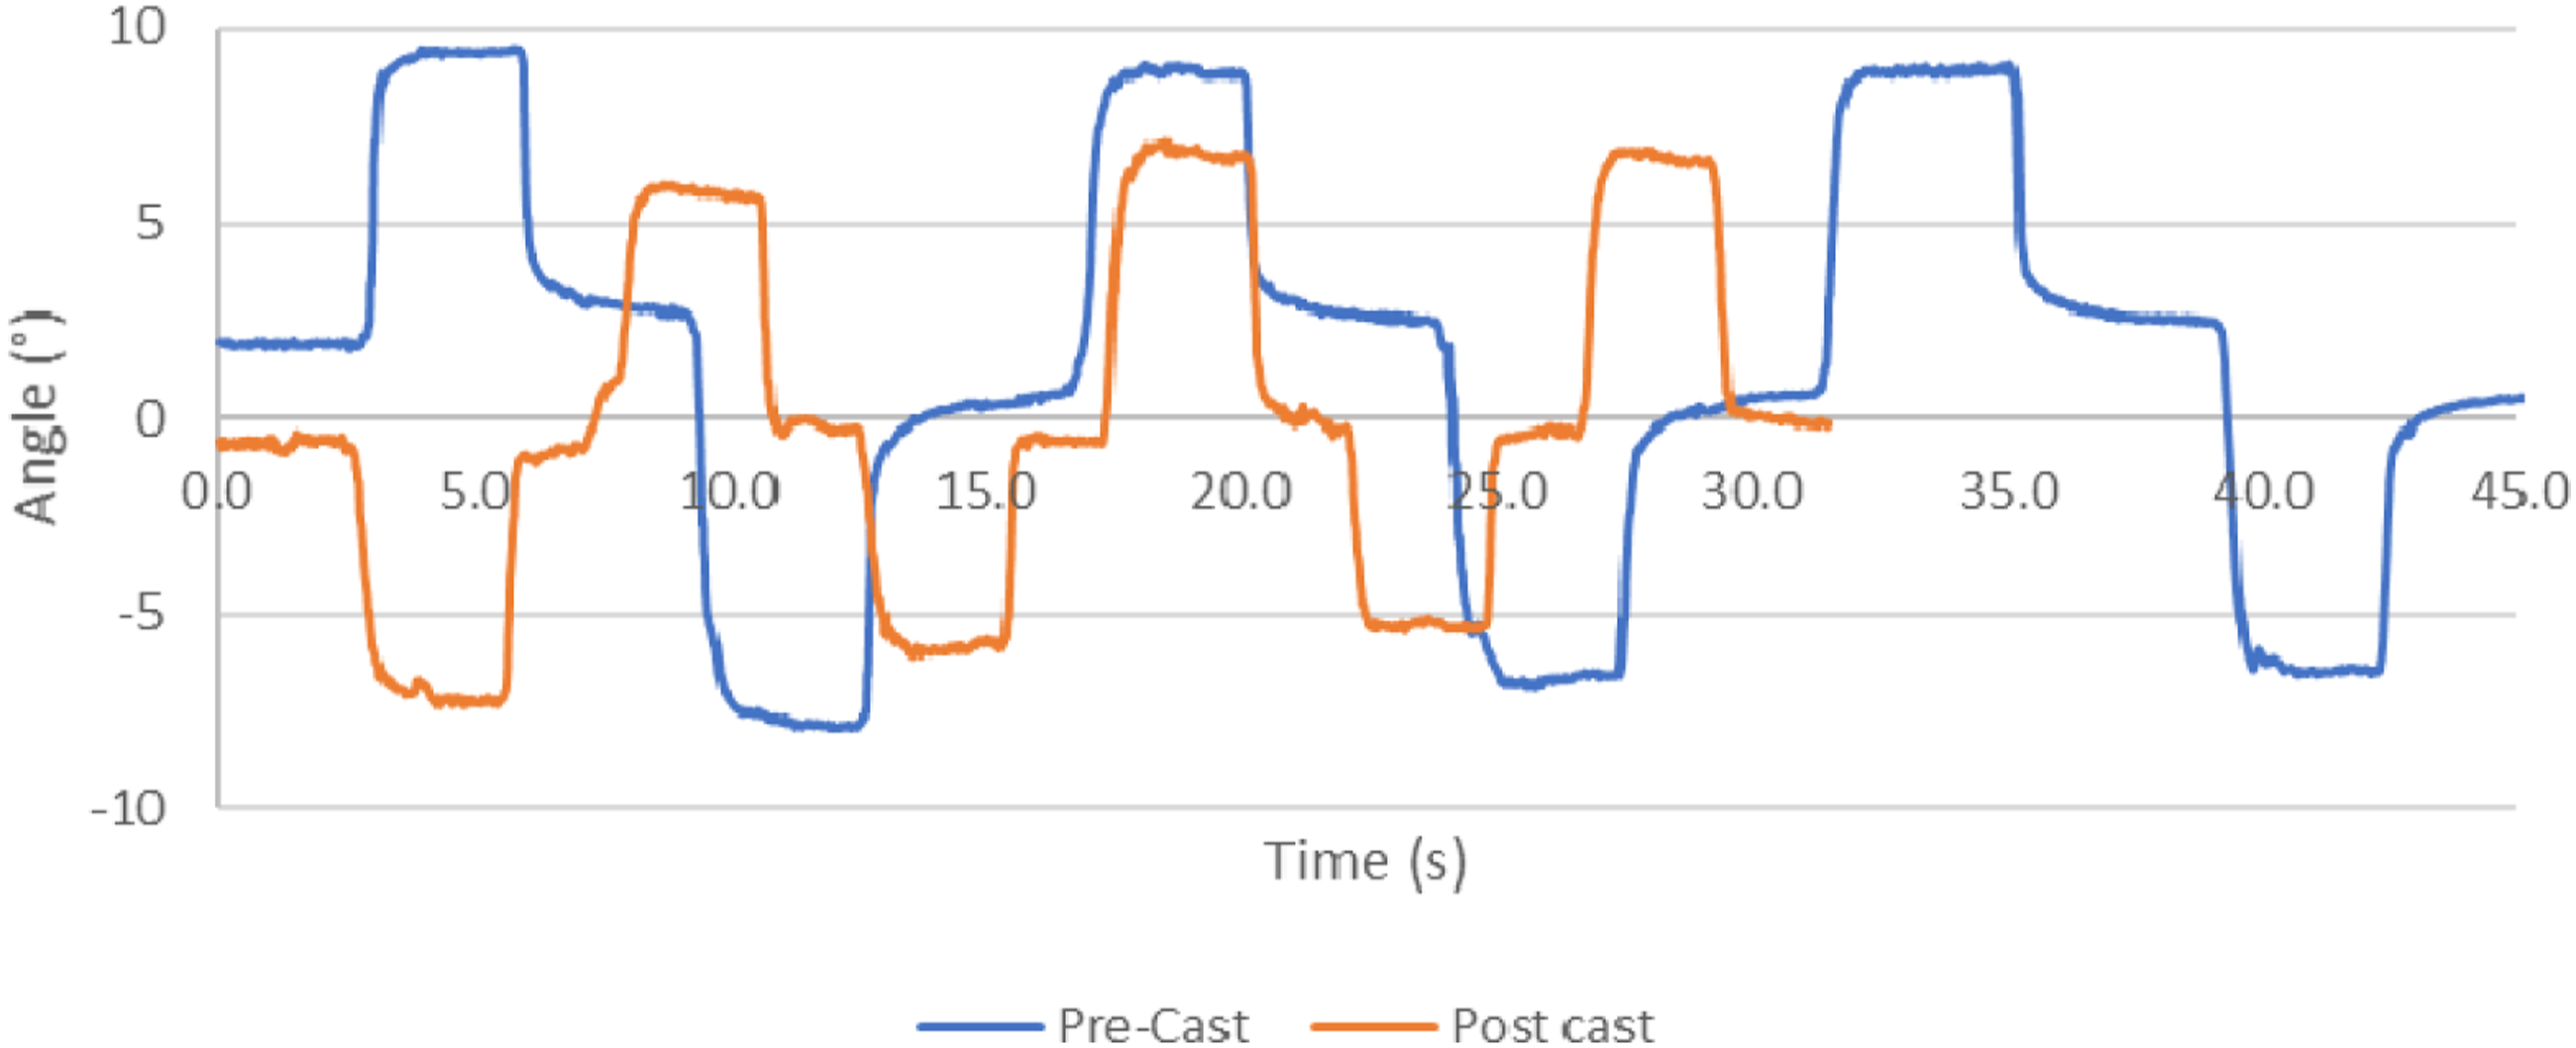
Pre-cast SLL foot angles were close to the target values. While a few pre-cast joint RoMs were lower than post-cast RoMs, the difference was small, likely caused by variability in the loading process that was induced by hand. Small differences were found between experimental and target RoM values, both before and after casting. All joint motions except SH sagittal and FT dorsiflexion were within 5° of the target RoM values after casting, staying within the range specified by the success criteria. Furthermore, eleven out of sixteen motions were even closer, within 2° of the designed RoM values.
The difference between pre-cast and post-cast motion was also important since that ratio showed the effect of silicone rubber on joint motion. Fourteen joint motions out of sixteen stayed within the 5° success window, showing that the silicone rubber had a small effect on most joint RoM. Only FT dorsiflexion had a considerable drop in RoM, with an average decrease of 30.4° after casting.
Most changes in joint ROM were within human variability. Furthermore, given that SH motion results involve both planar directions, whereas other joints have a separate RoM for each direction, the variability could be justified at 10°. Therefore, since all motions except FT dorsiflexion were within 5° or less of the target, they were deemed acceptable and within natural human variation.
Post-cast joint motion showed motion closer to designed constraints when compared to target results. Given that the pre-cast foot had some over-extension, the silicone rubber’s added resistance brought the joints closer to target maximum rotations angles. Nine planar motions were improved and four others remained within human variability of the target RoM (5°). One clear example was FT plantarflexion, decreasing by 15.3° after casting. However, given over-rotation in pre-cast testing, this decrease still brought the peak rotation closer to the target RoM, improving overall results. Joint RoMs were found to be acceptable for the AFO testing application.
Load testing
Load testing involved the application of a load to the SLL mounted within an AFO to ensure adequate durability and strength.
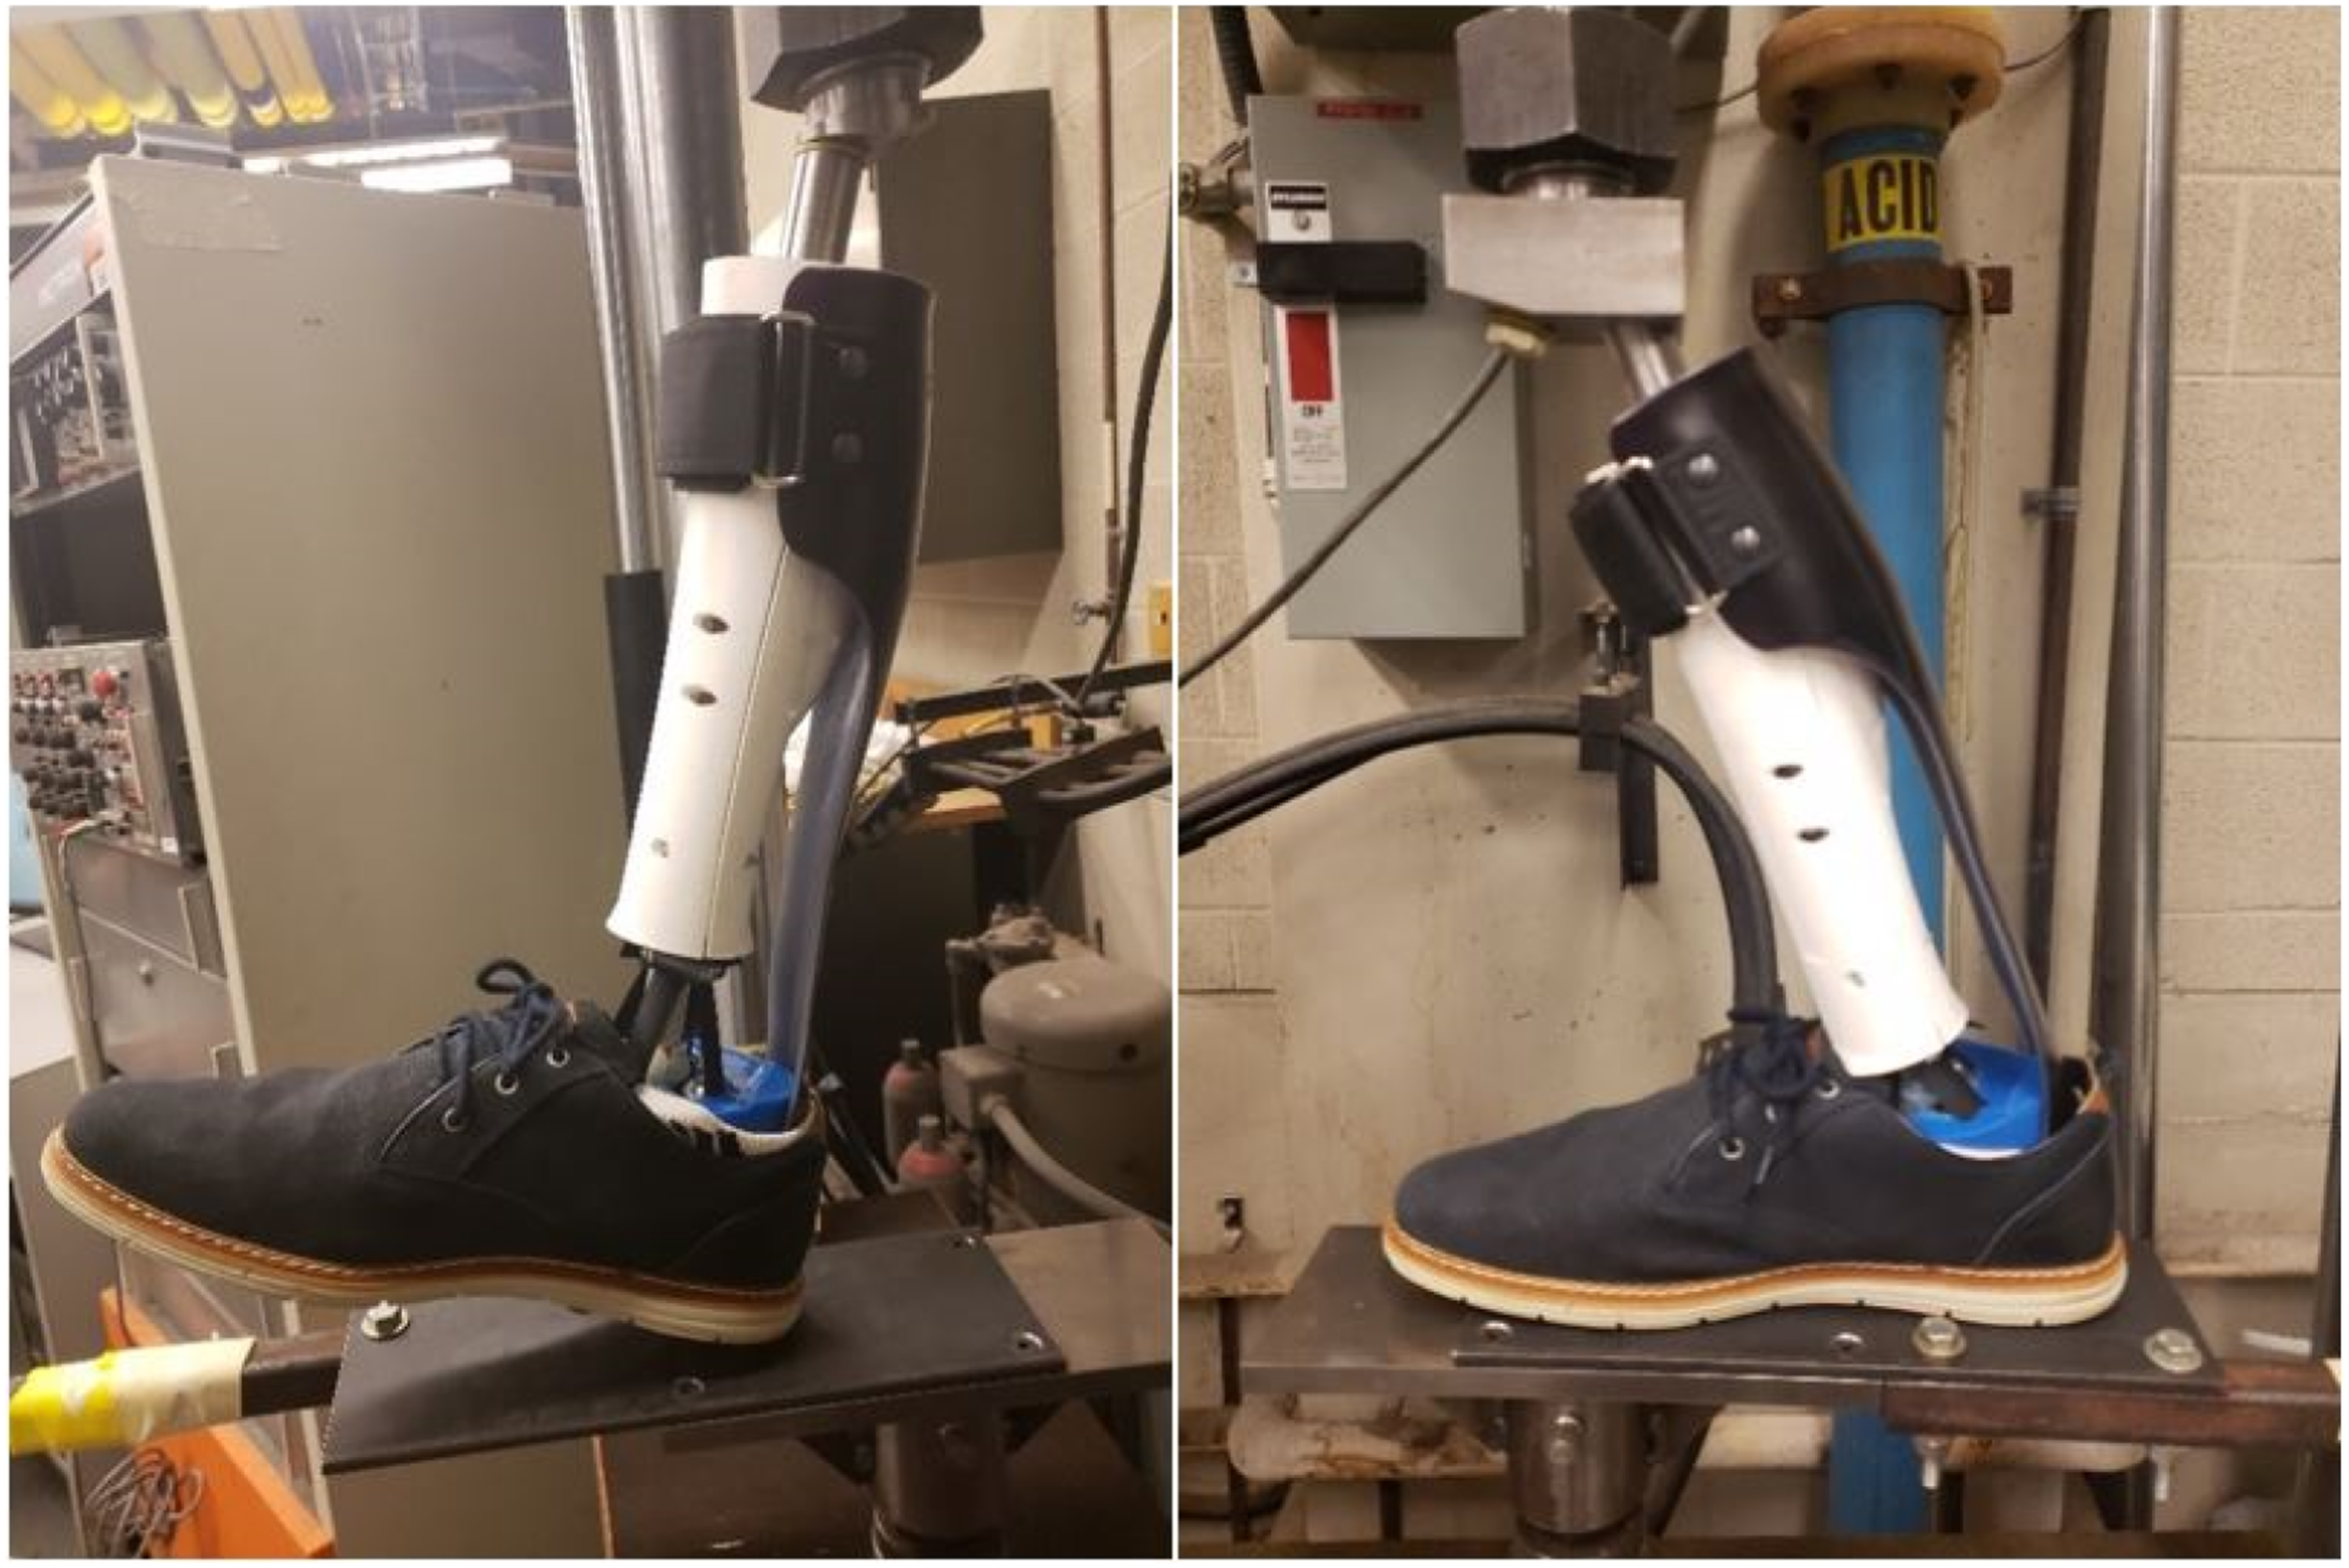
A static load test reproduced standing conditions, with the SLL in either heel or forefoot positions for a fixed duration. Before securing the SLL to the loading apparatus, the device was secured to a polypropylene non-articulated leaf spring AFO and footwear to recreate realistic loading conditions (Figure 12). The SLL was then secured to a Servo Hydraulic Frame Instron Model 1332 through an adapter that positioned the SLL at the desired angles (Figure 13). Force data were collected at 1 Hz. SLL-AFO with sock only (left), then sock and shoe (right). SLL-AFO attached to Instron in heel position (left) and forefoot position (right).
The load was applied to the SLL in the heel position first. Since the Instron Model 1332 could not increase load automatically at a steady rate, as suggested by ISO 10328:2016, the load was increased manually by controlling the vertical stroke, with bottom plate slowly raised until the measured load reached the desired maximum static load of 1500 N. This load was held for 30 s, then the load was removed by lowering the plate adapter. The SLL was visually inspected for any defects and then placed in the forefoot position. The load was applied again using identical settings. The load was then removed, and the SLL inspected visually for signs of defects.
Static loading results
The vertical displacement (Figure 14) and load (Figure 15) were graphed separately. Given the larger angle, the forefoot required more vertical displacement to reach the desired load. Also, the heel had the SH joint almost directly beside the arm and only a small displacement was required to apply adequate pressure. The forefoot had the SH further away from the Instron arm, and therefore, more vertical motion was required to apply appropriate load. Static test vertical displacement. Static test load.

Once the Instron arm stopped at the target load, the recorded load slowly decreased as the Instron arm’s vertical position was held. This decrease was likely caused by material relaxation, especially the silicone rubber and shoe sole given their compliant and rubbery nature. While the load did decrease slightly during the held period, the load remained close to the desired load and was considered adequate for the test.
Fatigue testing methodology
For fatigue testing, the SLL was tested with an AFO and footwear. Cyclic tests were set up similarly to the static load tests, with the SLL loaded in the heel position first, then rotated to the forefoot position. Cyclic loads between 50 N and 1300 N were applied at 0.8 Hz, replicating half a 1.6 step/second gait, 21 using a sinusoidal pattern. Both displacement and load controls were set to stop if the measurements reached loads above 1600 N and vertical displacement above 45 mm. 500,000 cycles were performed in each position. Once heel position testing was completed, the device was removed and inspected for creep or damage. The SLL was then re-attached to the Instron in the forefoot position and the cyclic load was repeated using identical settings. Maximum vertical displacement and load were saved every minute (i.e. maximum values over the 1 min period).
Pre-fatigue versus post-fatigue motion testing.

Fatigue testing results
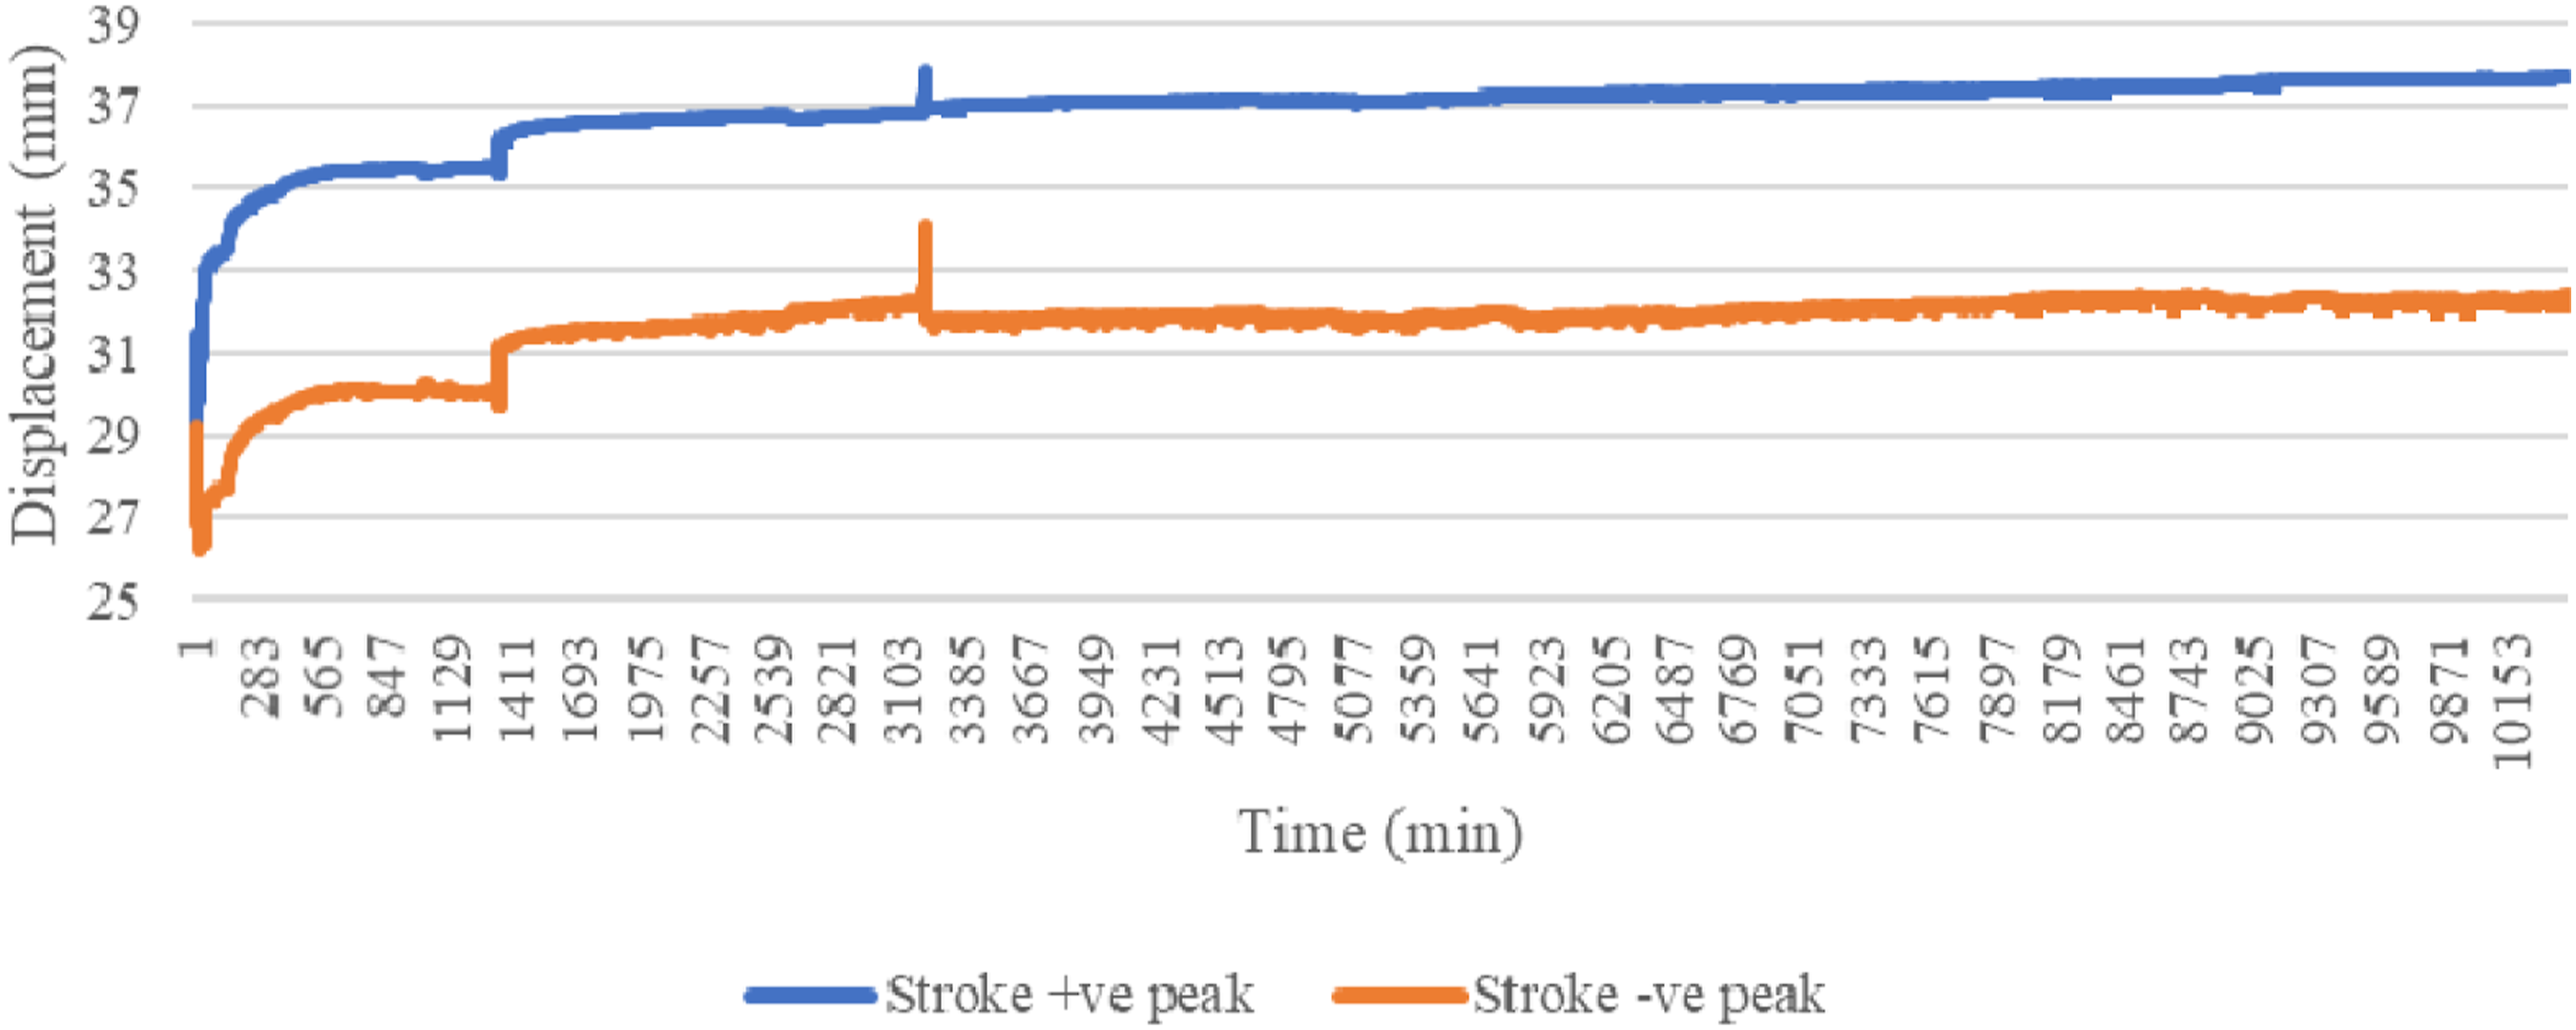
Figures 16 and 17 show the load over time and Figures 18 and 19 show vertical displacement. Cyclic heel loads. Cyclic forefoot loads. Cyclic vertical motion for the heel position. Cyclic vertical motion for the forefoot position.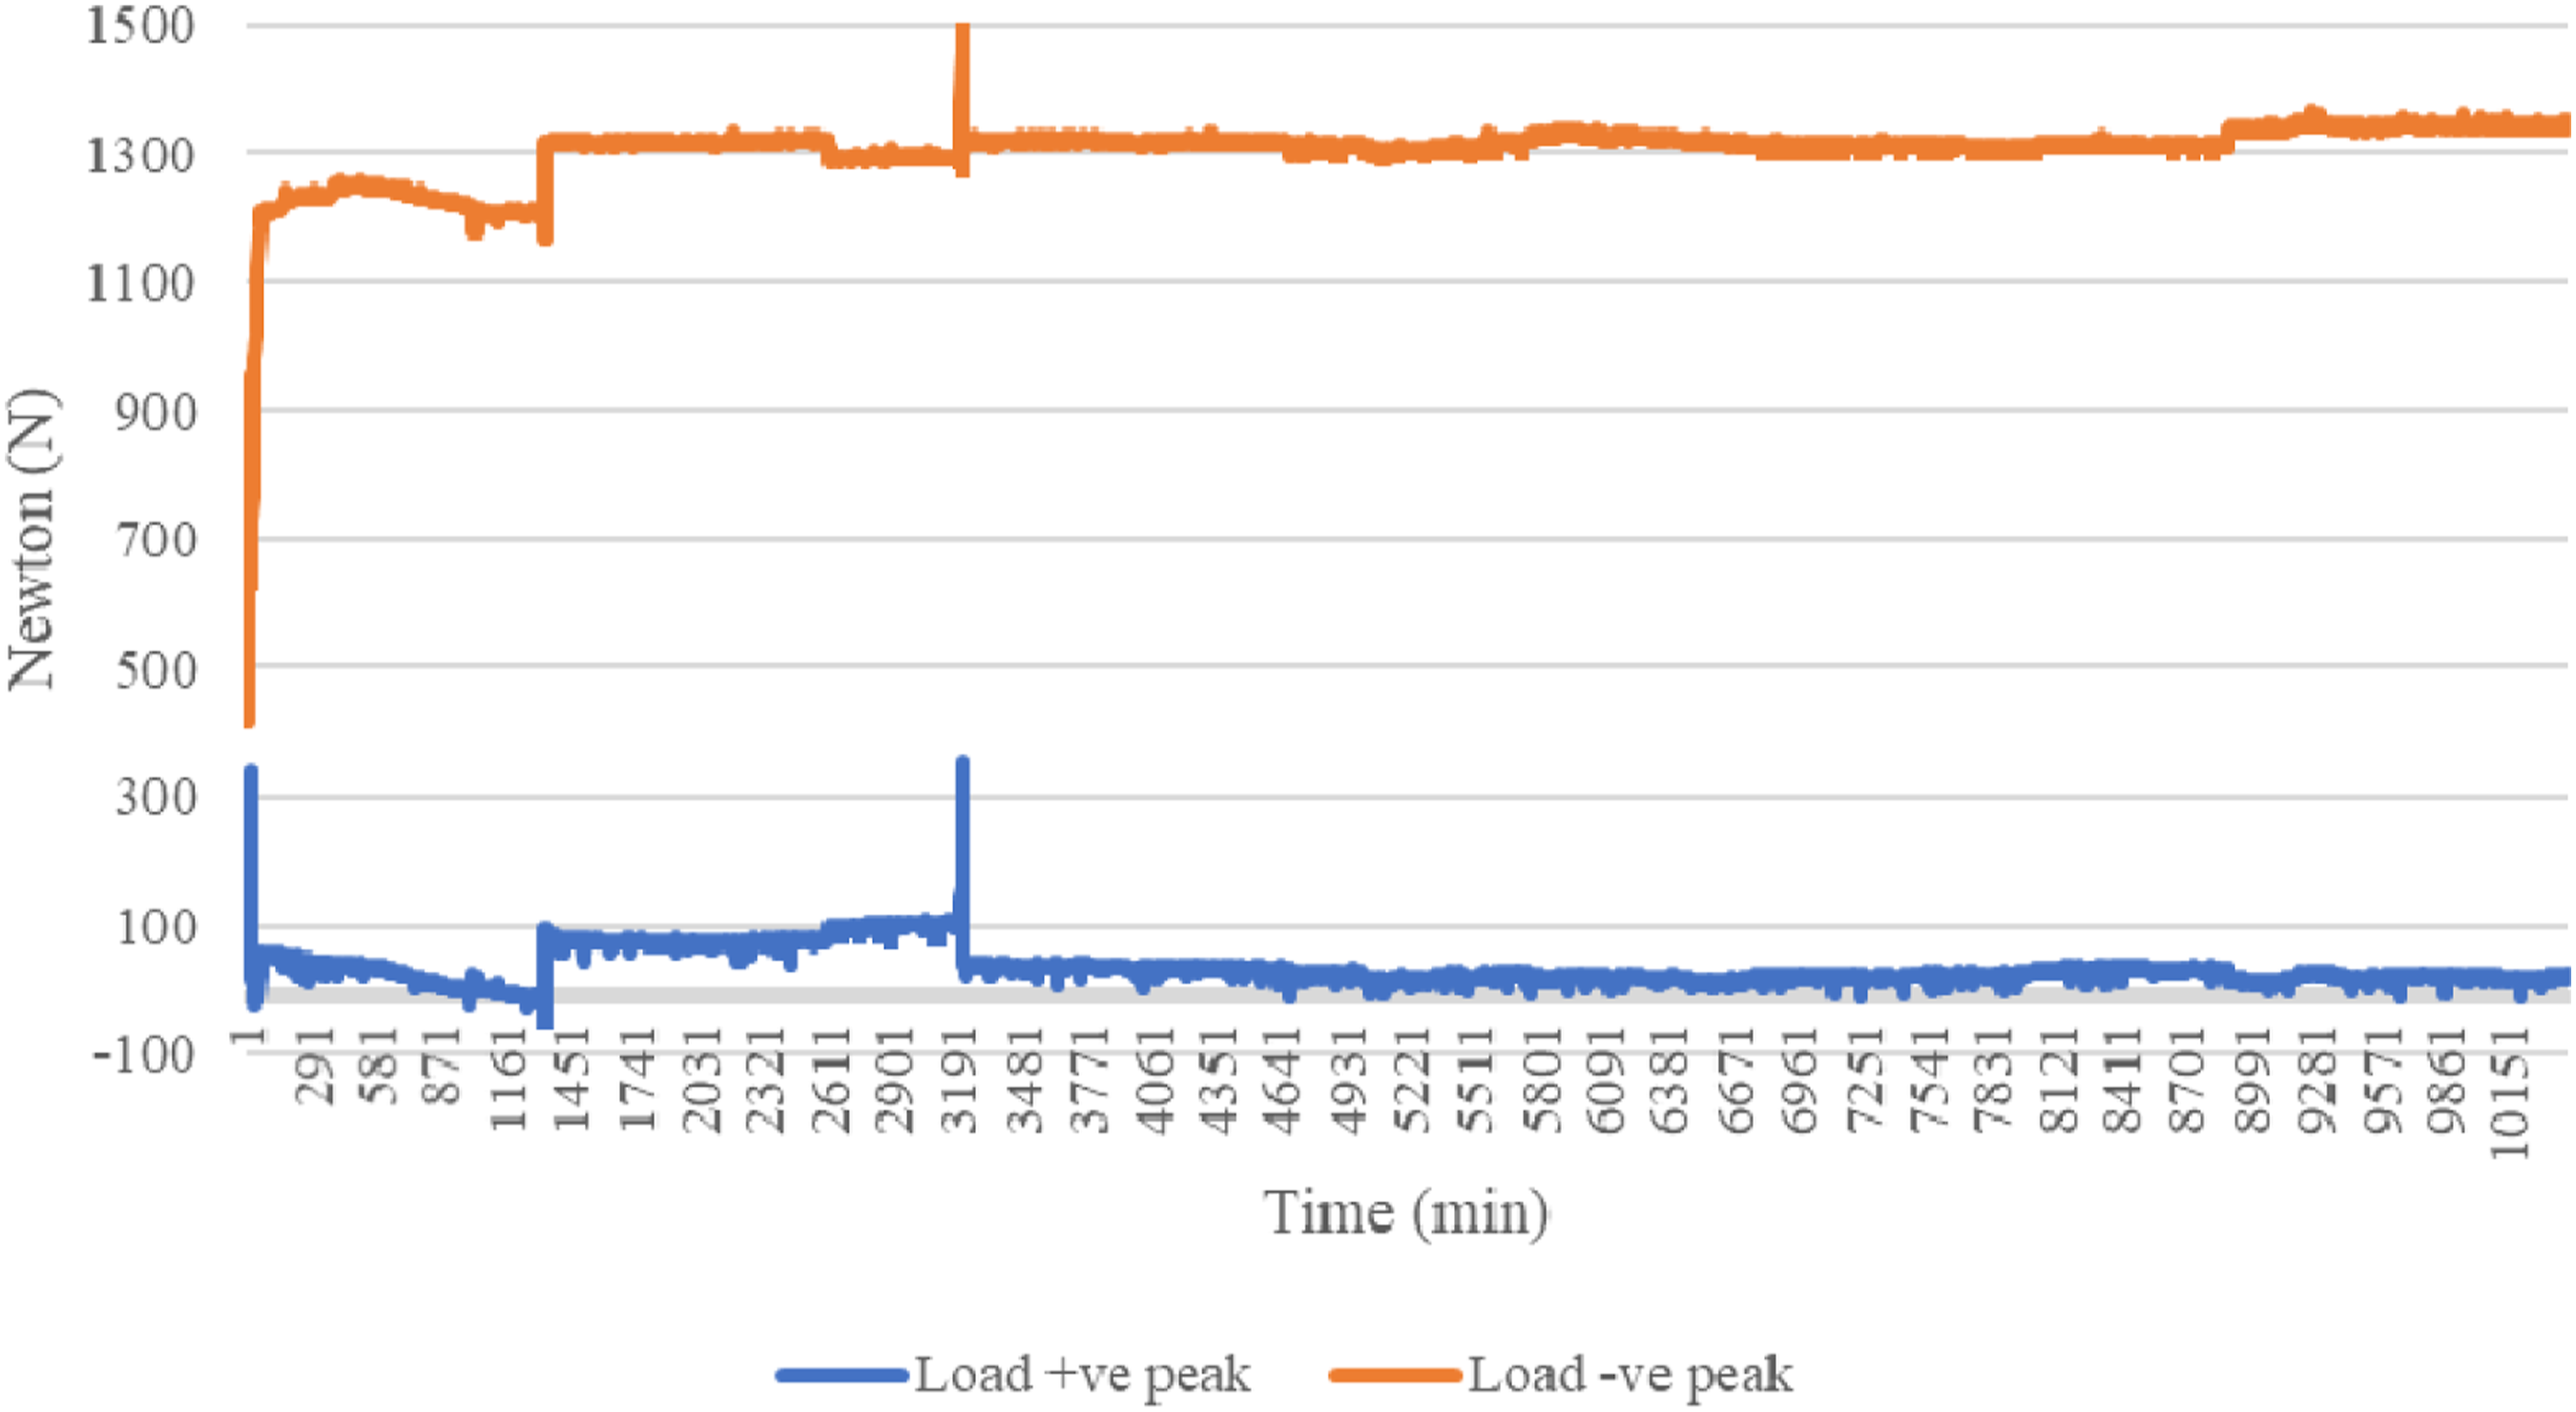
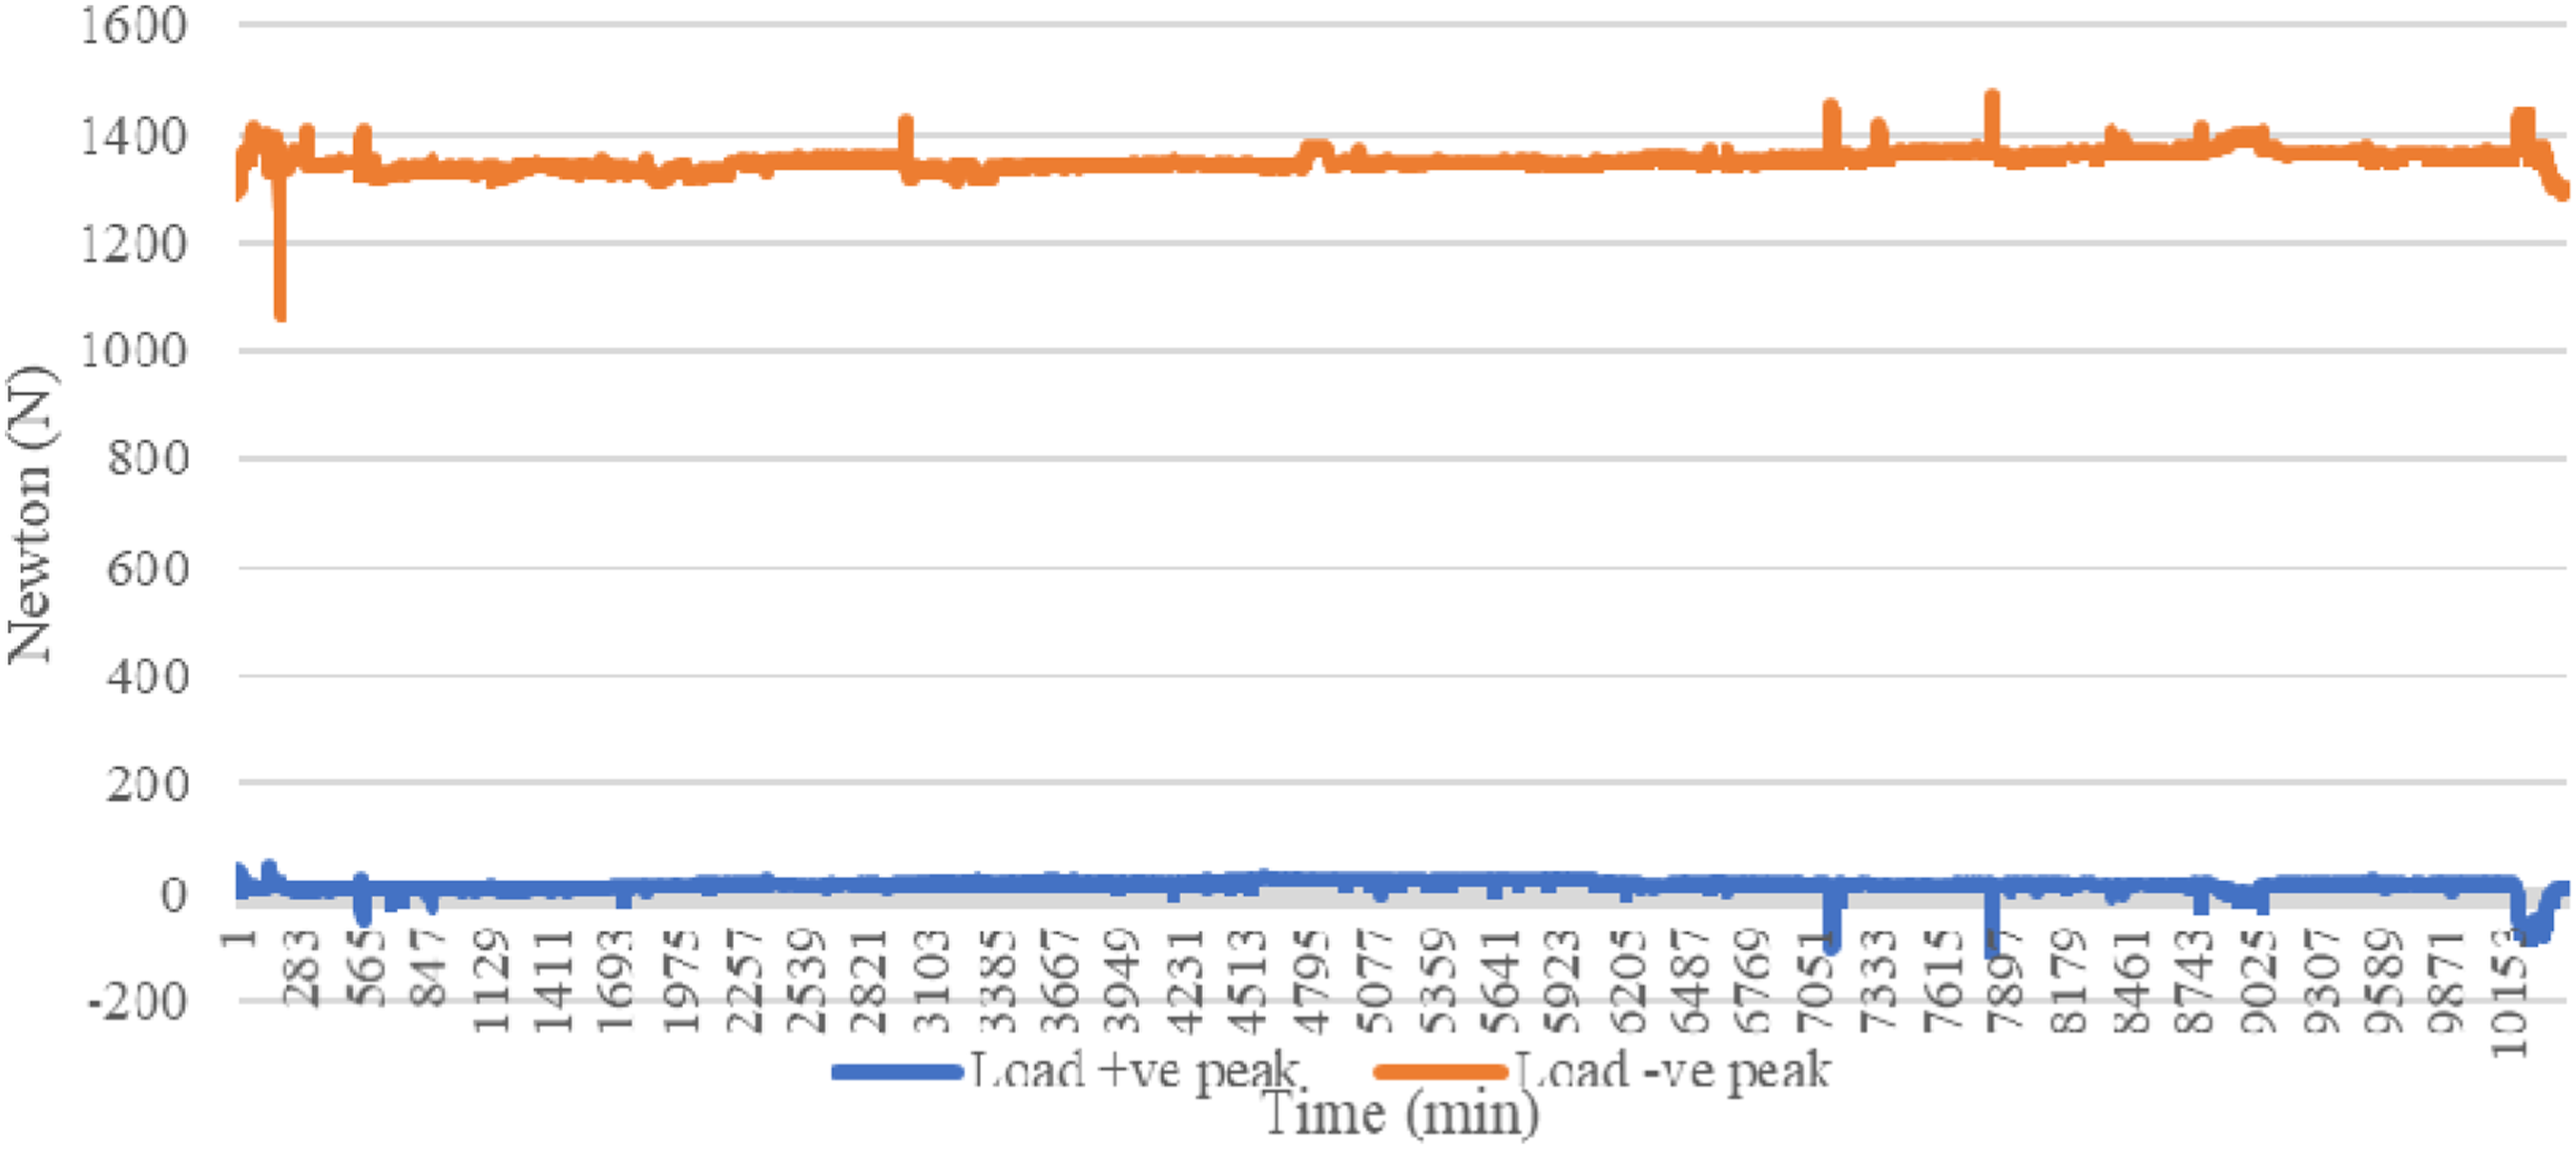

Given that the load was the control setting, the Instron machine created required loads by pushing on the SLL. Therefore, the load was steady, with little variation. However, small variations at the beginning were created as adjustments to the load control panel were made to get the load amplitude within its target range. The spikes occurred when the SLL was repositioned over the week-long test, to keep the foot appropriately aligned with the loading plate. However, given the low frequency of adjustments, the testing continued unhindered.
The vertical displacement peaks were 31.2 mm–37.0 mm after initial adjustments and increased to 32.2 mm–37.7 mm, approximately 0.7 mm over the 500,000 cycles. These small changes in vertical displacement demonstrated that the SLL could accommodate the cyclic loading for the entire test period. The increased displacement was likely microscopic deformation caused by creep, which was expected given that most materials are not immune to long-term fatigue. Further testing would be required to quantify the actual SLL fatigue limit.
Components that were affected by fatigue wear included the silicone rubber at the heel, the SH stiffness elastics, and the SH joint. A small tear occurred in the silicone rubber on the heel base medial side (Figure 20-left) during the heel test. This is likely due to foot supination, which applied more load on this side compared to the lateral side. The silicone rubber shell was found to be thin in this region, with trapped air bubbles adding stress concentrations. Increasing the silicone rubber shell thickness would likely prevent tearing. This thickness could be created by modifying the mold to include a larger void in this region or reducing the heel base volume at that location via a larger fillet or curved sole, providing more space for the silicone rubber. However, even with a tear in the silicone rubber, the shell held its shape and still functioned as intended. Tearing after cyclic loading of the silicone rubber at the heel (left), and the SH elastics (right).
The SH stiffness elastics did show partial tearing due to the hose clamp’s edge and the distal washer edges after the first test (Figure 20-left). This could be problematic during longer testing. Smoothing the SH elastic to hose clamp and washer connections would reduce the possibility of creating a tear initiation point and was indeed observed in subsequent testing after replacing the hardware.
Cosmetic tearing aside, the SLL design was shown to have structurally survived the specified loading conditions for at least 500,000 cycles in both heel and forefoot positions at a frequency of 0.8 Hz, mimicking average cadence. However, when comparing post-fatigue motion results to the pre-fatigue RoM highlighted in Table 3, all SLL joint maximum rotations (except SH rotation) were higher by 10°, on average, after cyclic loading, due to joint loosening. The exact reason for this loosening in the joints is not yet known and further investigation will be required if mitigation strategies are to be designed. However, it is known that the decreased SH joint rotation was caused by ball stud loosening within the joint (i.e. less rotation was required to dislocate the ball from its socket). If the 3D printed plastic used for the foot components and/or joints are not able to handle fatigue testing under the number of cycles specified herein, a closer consideration of whether the design should achieve the cyclic loading standard suggested by ISO 10328:2016, or whether material and fabrication process accessibility should remain the most important criteria, is required.
Discussion
This study demonstrated that the novel SLL design could be fabricated using accessible 3D printers and materials and assembled and used with an AFO. The SLL could perform 3D movements representative of the ankle-foot’s passive kinematics and survived loads representing AFO walking gait, for both static and cyclic conditions. This initial SLL design provides a strong first step to build upon and worthy of further investigation for quantitative evaluation of the more than 60 unique AFO designs available on the market. 1 This quantitative information is not currently available to guide assistive device prescription.
While the SLL can achieve the desired RoM, a main contributor to differences between actual motion and target motion was FDM dimensional inaccuracy. Since maximum rotation angles depend on the printing features, over or under extrusion changes the gap dimensions between materials, changing the maximum permissible rotation angle at that joint. Some motions were also affected by residual material from FDM scaffolding. Even after polishing the features with sandpaper, some residue affected rotation. Higher precision FDM printing or other additive manufacturing processes could mitigate dimensional accuracy and RoM variations. However, these higher quality printers could also reduce accessibility to fabrication equipment and increase SLL fabrication cost. Therefore, an appropriate compromise must be considered in each case.
Midfoot-forefoot joint over-rotation was created by a larger gap than desired between the midfoot and forefoot. This gap was likely due to imperfections in the forefoot MF connector hole. The only viable printing orientation for the FT leaf-locks caused unsupported overhang within the MF connector hole that could not be easily polished. The internal surfaces could be cleaned and polished using specialized hooked tools. Polishing the internal surfaces would reduce the unwanted joint gap and bring maximum rotation closer to target values.
The SLL foot continued to rotate as desired even after being cast in silicone rubber. The surrounding material held the shape well during joint rotation, stretching and then returning to its original shape without tearing or deformation. Rotation was still easily performed, showing that wrapping the foot before casting maintained the intended gap between components. The wrap kept the motion-defining features clear, easing joint rotation.
Silicone rubber added substantial material to dorsiflexion motion, increasing resistance even though the joint was wrapped before casting. Dorsiflexion required more silicone rubber deformation than other joints due to the large RoM. The joint’s geometry resulted in more material added in dorsiflexion than in plantarflexion or other joints. However, while normal MTP dorsiflexion is 80°–90°, normal dorsiflexion varies based on a person’s condition. Nawoczenski et al. 22 measured different passive dorsiflexion between weight-bearing (37 ± 2.8°) and non-weight bearing patients (57 ± 3.1°), providing values closer to post-cast results. Furthermore, since the load was manually applied to the SLL, pushing became more difficult past 40°. Machine loading would likely create more rotation.
Load testing
Overall, static load testing completed without SLL damage (i.e. the silicone rubber did not tear, metal components remained structurally sound). The SLL withstood 1500 N in both heel and forefoot positions for 30 s. Nonetheless, when loaded, the foot supinated, slightly rotating medially. This could be due to several factors. Ankle-foot orthoses asymmetry (Figure 21) could have guided bending with a medial tendency. The load could also have been applied medially and created supination. Furthermore, the SLL foot could have had more space to supinate than pronate during loading, leading to the rotation. Testing the SLL with different AFOs and footwear could confirm the rotation’s cause. This motion will require further investigation. AFO back profile.
While the rotation could lead to rolling ankles in real life situations, the loading apparatus prevents this potential issue for the SLL. Furthermore, the constant compressive load prevents full ankle roll. Given the external factors affecting supination, the rotation was deemed acceptable for continued load testing.
The SLL structurally survived fatigue for both heel and forefoot positions. While a section of silicone rubber tore near the longitudinal arch at the heel, the silicone rubber serves to provide better fit to footwear and does not provide mechanical support. Since the tear was far from any joint, there should be no impact on joint rotation. The silicone rubber was thinnest at the arch, and with modifications to the mold, material tearing should be mitigated.
After analyzing post-fatigue SLL foot motion, loosening was found across all joints. Plastic degradation is expected over 500,000 cycles. Material strength and durability was a known potential issue, especially for 3D printed components. However, the design criterion of using readily available material and fabrication techniques remained a focus throughout the study. Moreover, it is expected that for most use cases in an orthotics lab, the SLL will not perform cyclical testing. Therefore, the lower value of 500,000 cycles was used. Nonetheless, it was important to verify the performance of the SLL over time. Testing demonstrated that the design was worthy of further investigation and improvement.
The AFO and footwear helped bear the load since the AFO distributed the load from the sole of the foot to the shank. The footwear also protected the SLL foot from friction.
Positive design attributes and improvements
Most SLL design aspects worked as intended. Joints offered large surfaces for load transfer while constraining the rotation to adequate RoM angles. The connectors provided resistance without completely impeding rotation. The silicone rubber offered compliance while demonstrating good fatigue strength, with only minor aesthetic tearing occurring at a thin section. This tearing could easily be mitigated by increasing the thickness of the silicone rubber at the tear location.
The overall SLL fabrication process was simple, and the SLL was easy to assemble. Casting the foot structure was also found to be simple, given the easy mixing and setting requirements for the silicone rubber. However, some bubbles were found under the foot due to its position during casting. Nonetheless, these bubbles did not have a critical effect on the design. Furthermore, these bubbles could be mitigated with adequate vibration of the mold before curing, dislodging the trapped air under the foot. Shank-hindfoot elastic connections were difficult to install due to the testing apparatus and top adapter threads. The SH elastics needed to be altered so that the shaft could be rotated in the proper direction, then secured to the shaft. However, this process was simplified by loosening the hose clamp and rotating the shaft before re-tightening the clamp again. Future testing could use an adapter design that would not require rotation of the shaft during installation.
The total fabrication cost was a positive attribute of the design, assuming that a 3D printer is already accessible to the user. The silicone rubber cost was reasonable at $36 USD per pint, which would enable one full silicone rubber shell. Nylon 230 and Cheetah TPU filament spools were both $48 USD, while PLA was $32 USD. However, these prices were for 1 kg (nylon 230 and PLA and 0.5 kg (TPU) spools. Given that the estimated filament used per SLL was 450 g for nylon 230, 81 g for TPU, and 1466 g for PLA, the real filament cost would be approximately $22 USD for nylon, $8 USD for TPU, and $47 USD for PLA (requiring 2 spools). Shaft material and machining cost were approximately $120 USD. Given the price of other components, such as bolts, nuts, elastic, etc. (see Appendix A), the total cost for one SLL was approximately $295 USD.
Time considerations are also important for cost calculations. Given that assembly time takes roughly 30 min, the main times to consider are for 3D printing and silicone rubber curing. Most 3D prints took a few hours. The shank cover, mold segments, and heel base took longer to print due to their larger sizes. Assuming that only one printer is available, the total printing time would be 4 days and 20 h. Subsequent prints are faster, at 3 days and 5 h, given that the mold is reusable. Silicone rubber curing would take another 6 h.
Another fabrication alternative would be to send the 3D prints to an external printing facility, such as a FDM web service. However, costs can be much higher, with estimated printing costs of $1120. As such, using FDM printers locally remains an interesting option, if available. Since FDM is affected by the print environment, moving FDM production to an environment with better controls over temperature, humidity, and air flow would likely result in more consistent prints.
Modifications for different pathologies
The SLL CAD elements were designed to enable modifications to better represent various pathologies. These modifications were mostly focused on size and dimensions, by having the foot components increase or decrease to fit a large range of adult male shoe sizes. Each segment was dimensioned with anthropometric scaling linear to
The HM, MF, and FT joint stiffnesses were defined by fixed component geometries and material properties. Changing these stiffnesses could be done by restructuring the connectors and respective holes to replicate specific stiffnesses instead of averaged values. Further engineering could enable simpler non-linear anthropometric scaling. This change could also reflect female anatomical properties. However, the SH stiffness could be changed more easily, given that the elastics are external features. Different elastics could replace the current ones to change the stiffness in each direction. Additionally, elastics could be added, or the dimensions modified to increase joint stiffness. Given that there were four elastics in the design, each elastic represents a different stiffness in each rotational direction. For example, the SH joint could be made stiffer in plantarflexion by adding stiffer elastics anteriorly. Having four elastics enables a modular approach to SH stiffness, and therefore greater flexibility for representing different pathologies. Overall, SLL scalability was confirmed using a CAD model, but was not physically tested. As such, further testing is required to confirm that the SLL performs appropriately for different foot sizes and different RoMs.
Further testing
This study focused on the design and validation of an SLL that could be used for AFO testing. However, the physical limitations of the SLL were not measured. The adapter used in this study was not designed for destructive loading of the SLL, given that the moment would be greatest at the top adapter. Initial compressive tests were done to find some limit to the design, but only on the weakest components. The fully assembled SLL should be tested to understand the maximum compressive and cyclical loads that can be supported.
Future studies should evaluate the performance of the SLL-AFO combination according to the ISO 10328:2016 prosthetic standard loads. 9 This could provide developers and clinicians with a comparative analysis based on typical test loads in the overall industry, even though AFO test standards are not available.
Conclusion
This study used an anatomical understanding of the ankle-foot complex to design a SLL that moves similarly to a real lower limb. The SLL design used motion constraining features and accessible fabrication processes. The SLL achieved the following criteria: • Maximum rotation angles for most SLL foot joints were within 5° of the normal human range for maximum anatomical passive RoMs. While more precise additive manufacturing processes could be used to reduce RoM variations, RoM for AFO testing was within typical human variability. • Static load testing demonstrated that the SLL can withstand 1500 N, representative of a 1.5 body weight load for a 100 kg individual. • Cyclic loading with a simple leaf-spring AFO showed that the SLL could structurally survive at least 500,000 load cycles from 50 N to 1300 N in both heel and forefoot positions. • The SLL was designed to be easily fabricated using readily available equipment, materials, and components, enhancing access to a broad range of people working with AFOs. Using FDM to create the foot components enabled cost effective fabrication using strong and widely available materials. Most metal components were commonly available in hardware stores or online. Only the shank shaft and mold pins required machining. • The SLL model was successfully designed to be parametric, accommodating a large range of common foot and AFO sizes by adding anthropometric scaling ratios to vital dimensions across all CAD model components. As such, the digital components could be changed easily based on the desired
Even though joint rotations varied across tests, this design still functions more realistically than other lower limb surrogates, given the novel 3D four-jointed design. Therefore, clinicians will be better informed regarding orthosis performance and failure patterns when making prescription decisions.
Future testing will include multiple SLL sizes, especially at maximum FL, to ensure proper strength across the entire anthropometric scale. The ability to modify the SLL to account for specific pathological behaviors will be explored, as well as the passive stiffness of the design. Furthermore, future testing will use the SLL to test different AFO designs. To ensure appropriate methodology, a rigorous test protocol using the SLL, similar to ISO 10328:2016, should be developed, including static, cyclic, and destructive tests. This will lead to better clinical decision-making regarding AFO prescription and, thereby, better mobility for people with lower limb deficits.
Footnotes
Acknowledgements
The authors thank Össur for providing a prosthetic foot shell model. The authors also thank the University of Ottawa Mechanical Engineering machine shop team who assisted in the preparation of metal components and in the experimental setup. This project was funded by the National Science and Engineering Research Council of Canada.
Declaration of conflicting interests
The author(s) declared no potential conflicts of interest with respect to the research, authorship, and/or publication of this article. The authors report no conflicts of interest.
Funding
The author(s) disclosed receipt of the following financial support for the research, authorship, and/or publication of this article: This research received financial support from Natural Science and Engineering Research Council of Canada; RGPIN/05101-2014