
Abstract
Objectives
Three-dimensional gait analysis has been recommended as part of standardized gait assessment in people with spinal cord injury. The aim was to investigate inter- and intra-session reliabilities of gait kinematics in people with spinal cord injury.
Methods
Fifteen adults with spinal cord injury performed two test sessions on separate days. Six infrared cameras, 16 reflective markers and the Plug-in gait model were used. For each subject, five gait trials from both sessions were included. The Gait Profile Score and the Gait Variable Score were used as kinematic outcome measures. Reliability was assessed with intraclass correlation coefficient, standard error of measurement, minimal detectable change, and Bland–Altman plots.
Results
Inter-session intraclass correlation coefficient for all variables was >0.82 and standard error of measurement <1.8°, except for hip rotation. Intra-session reliability was found to be high (≥0.78) and slightly better than that for inter-session. Minimal detectable change for all variables was <4.7°, except for hip rotation.
Conclusions
The high inter- and intra-session reliabilities indicate small intrinsic variation of gait. Thus, three-dimensional gait analysis seems to be a reliable tool to evaluate kinematic gait in adults with spinal cord injury, but caution is warranted especially for hip rotation evaluation.
Introduction
A spinal cord injury (SCI) affects conduction of motor and sensory signals between the brain and spinal cord segments distal to the injury site. The neurological level of injury is broadly classified as paraplegic, i.e. impairment or loss of function in the thoracic, lumbar or sacral segments or tetraplegic which include also the cervical segments. 1 SCI is also classified as either a complete or incomplete injury based on a classification system introduced by the American Spinal Injury Association (ASIA). The ASIA Impairment Scale (AIS) ranges from AIS A to E, where AIS A is a complete injury, AIS B, C and D are incomplete injuries with variable degrees of preserved sensory and/or motor function, and AIS E refers to normal sensory and motor function. 1 Depending on the cause of injury, an SCI is described as either traumatic or non-traumatic. Traumatic injuries are caused by a mechanical impact, i.e. fall or traffic accident. A non-traumatic injury can be caused by an infection or disease.
The proportion of people with incomplete SCI (ISCI) is increasing due to improved medical interventions, better paramedical retrieval, changes in vehicle design and usage as well as greater public awareness and knowledge of the danger of moving an injured person. 2 According to Waters et al., 3 more than 75% of those with initially ISCI will regain some form of ambulatory function and these individuals will strive to preserve this function throughout their lives. This imposes new demands on the management of this population with regard to better understanding and evaluation of gait impairments. Three-dimensional (3D) gait analysis is commonly used to document pathological gait for treatment planning, evaluation and research. It has been suggested that gait analysis laboratories should be utilized as part of the standard assessment of gait to supplement routine examination, also for people with SCI. 4 Assessment of gait variability and measurement error is important as mismatch can result in biased inferences. 5 Most reliability studies of 3D gait analysis have evaluated healthy people.6–9 However, studies have also been conducted in populations with different gait pathologies.8,10–15 While reliability of spatio-temporal variables in the SCI population has been established, 16 reliability of kinematic gait variables has previously, to our knowledge, not been investigated in this population. Reliability is population-dependent as each clinical population has its own characteristics. Thus, estimates from one population cannot be transferred to another population.17,18 Therefore, the objective of our study was twofold: (1) to investigate inter- and intra-session reliability of kinematic gait variables in 3D analysis of adults with acquired ISCI and (2) to estimate the change required to exceed measurement errors in 3D kinematic gait variables.
Methods
Study group
Subjects were recruited consecutively during July through September 2012 at the SCI unit at Sunnaas Rehabilitation Hospital, Norway. Initially, medical records of subjects with SCI, planned for inpatient program at the hospital during the inclusion period were scanned for eligibility, using the following inclusion criteria: diagnosed with acquired traumatic or non-traumatic SCI (AIS-D), a minimum of one year post injury, able to walk 10 m without assistance from another person, age 18–65 years and able to give informed consent and cooperate during the testing procedures. Exclusion criteria were severe respiratory or cardiac disease that prevented safe walking, symptomatic musculoskeletal problems affecting gait, Botulinum Toxin A injections in the lower limbs within the last three months, any orthopaedic or neurosurgery in the lower limbs within the last six months, diagnosed with syringomyelia or diagnosed with a neurologic conditions in addition to SCI. The first 15 subjects, according to admission dates for an inpatient program, who were found eligible, received information about the study by post prior to their planned stay at the hospital. All 15 subjects, who were asked to take part in the study, accepted the invitation.
The study protocol was approved by the Regional Committee for Medical and Health Research Ethics and the Commissionaire for the Protection of Privacy in Research. All participants gave written, informed consent.
Clinical assessment
Data collection of the study group’s characteristics followed recommendations by the Executive Committee for the International SCI Data Sets Committees. 19 Before the first test session, the subjects were examined by a physician, specialist in physical medicine and rehabilitation, and by a physiotherapist, both with more than five years of experience in SCI rehabilitation.
Muscle tone in the lower limbs was assessed with the Modified Ashworth Scale (MAS).20,21 In our study, muscle tone was examined for hip and knee flexors and extensors, as well as for hip adductors and ankle plantar flexors. Muscle strength of the lower limbs was assessed with the AIS motor examination, 1 and walking ability was assessed with Walking Index for Spinal Cord Injury II (WISCI II) 22 and Timed Up & Go (TUG).23,24 For TUG, the fastest time out of three trials for each subject was noted.
3D gait analysis experimental protocol
Subjects were assessed twice in a test–retest design with the two test sessions one or two days apart. For each of the subjects, the sessions were performed at the same time of the day. Three physiotherapists and one movement scientist, working in pairs, participated in the test sessions. They were all employed at the Motion Analysis Laboratory at the hospital. All physiotherapists had seven years of experience in gait analysis, and the human movement scientist had six months of experience. Each subject was assessed by the same pair of assessors in both sessions. The subjects wore shorts and, if possible, were bare-footed and instructed to walk in their own, comfortable speed. If needed, walking devices, braces or shoes were permitted and used in both test sessions. All subjects were allowed practice trials.
The 3D gait analysis recordings were performed at the Motion Analysis Laboratory at Sunnaas Rehabilitation Hospital, on an 8 × 1 m walkway. The laboratory equipment consisted of six infrared MX 13 cameras working at 100 Hz (Vicon Motion Systems, Oxford, UK), two AMTI OR6-7 force plates embedded in the walkway (Advanced Mechanical Technology Inc., Watertown, USA) and two digital video cameras (JVC Kenwood Corp., Kanagawa, Japan). Each test day, all six MX 13 cameras were calibrated by the assessors with a five marker wand L-frame, according to the manufacturer’s recommendations.
Gait assessments followed a standardised test procedure, based on recommendations by the marker set-up for the lower body Plug-in gait (PiG) model (www.vicon.com/faqs/software/where-can-i-find-reference-papers-for-plug-in-gait) and specified by the Nordic Vicon User Group (personal communication).
Sixteen reflective markers (14 mm diameter; Vicon Motion Systems, Oxford, UK) were attached to the anatomical landmarks according to the PiG model (Figure 1). To ensure consistent marker placements between sessions, the skin was marked with a water resistant pen, but the wand markers at the thigh and shank had to be repositioned before each session.
Picture of posterior and anterior view of subject with markers.
For each subject and each test session, at least five trials with one complete gait cycle on each side with clean force plate strikes were captured and used in the analyses. Ten trials or more are recommended to decrease variability of kinematic parameters. 26 However, this is difficult to ensure in a clinical setting when assessing subjects with an SCI who might have limited physical capacity. Hence, only five trials were included in this study. If more than five trials qualified for inclusion, five were randomly chosen by drawing lots.
Data processing
All data were processed with the integrated software programs Nexus 1.7.1 and Polygon 3.5.1 (Vicon Motion Systems, Oxford, UK). Data from Nexus 1.7.1 were transferred to a report template in Polygon 3.5.1, where the spatiotemporal variables (gait speed and step length) and kinematic variables were calculated and exported to an Excel spread sheet (Excel 2007, Microsoft Corp., USA).
Outcome measures
Gait Profile Score (GPS) is a single index measure which summarises the overall quality of a subject’s kinematic gait by quantifying its deviation relative to a reference population without gait pathology. 26 The GPS can be broken down into nine key kinematic variables to provide the Gait Variable Scores (GVSs). The root mean square average of all individual GVSs for a particular side equals the GPS, which is presented as Left, Right and Total. 27 To calculate GPSs and GVSs, the kinematic data were transferred to an Excel template available at https://wwrichard.net/resources/gps-map-and-gdi-calculators/.
Statistical analysis
Data were analysed with mean and standard deviation (SD), controlled for normality with Shapiro-Wilk test, and for outliers with box-plots. In cases of non-normal distribution or when outliers were found, the data were presented with median and interquartile range (IQR), as was also used for ordinal data. For intra-session calculations, five random trials from each subject were included in the analyses. For inter-session calculations, the mean of these five trials from each subject was calculated and included. Analysis of variance (ANOVA; F-statistics) was used to assess differences in outcome variables between trials within each session. Paired sample t test was used to assess differences between the two sessions. In intra-session reliability, sphericity was controlled with Mauchley’s test, and if significant, Greenhouse-Geisser adjustment was employed. 28 The statistical analysis was done in PASW Statistics 18 and in Excel (2007, Microsoft Corp., USA). A p value of <0.05 was considered statistically significant.
Relative reliability with 95% confidence interval (CI) for intra-session was measured with intraclass correlation coefficient (ICC) (2,1) and for inter-session with ICC (2,k). If a non-normal distribution was found, ICC was calculated using log transformed data. ICCs were interpreted according to Domholdt 29 ; 0.90–1.00 = very high correlation, 0.70–0.89 = high correlation, 0.50–0.69 = moderate correlation, 0.26–0.49 = low correlation and 0.00–0.25 = little, if any correlation.
Absolute reliability for both inter- and intra-session was estimated with standard error of measurement (SEM), where SEM was estimated as the root of the mean square error term from the ANOVA. 30 Minimal detectable change (MDC) provides an indication of the smallest change that can be considered greater than the measurement error. 31 MDC was reported for inter-session reliability and was calculated from the formula MDC = SEM × 1.96 × √2. 32
Bland–Altman plots with 95% limits of agreement (LOA) 33 were used to illustrate agreement between test sessions and estimate measurement error.
Sample size calculation
According to Weir, 30 there is no consensus as to the number of subjects required to obtain adequate stability for the ICC and SEM calculations. From a reliability study of a group with similar gait pathology, 14 ICC for the kinematic variables in our study were expected to be about 0.8–0.9. Thus the calculated sample size should be between 15 and 52. 34 A sample size of 15 subjects was chosen, based on a previous report, 18 stating that the number of subjects multiplied by the number of measurements should be ≥25. Based on the interest of inter-session reliability, a minimum for this study would therefore be 13 subjects as each subject was measured twice.
Results
Overview of study group characteristics.
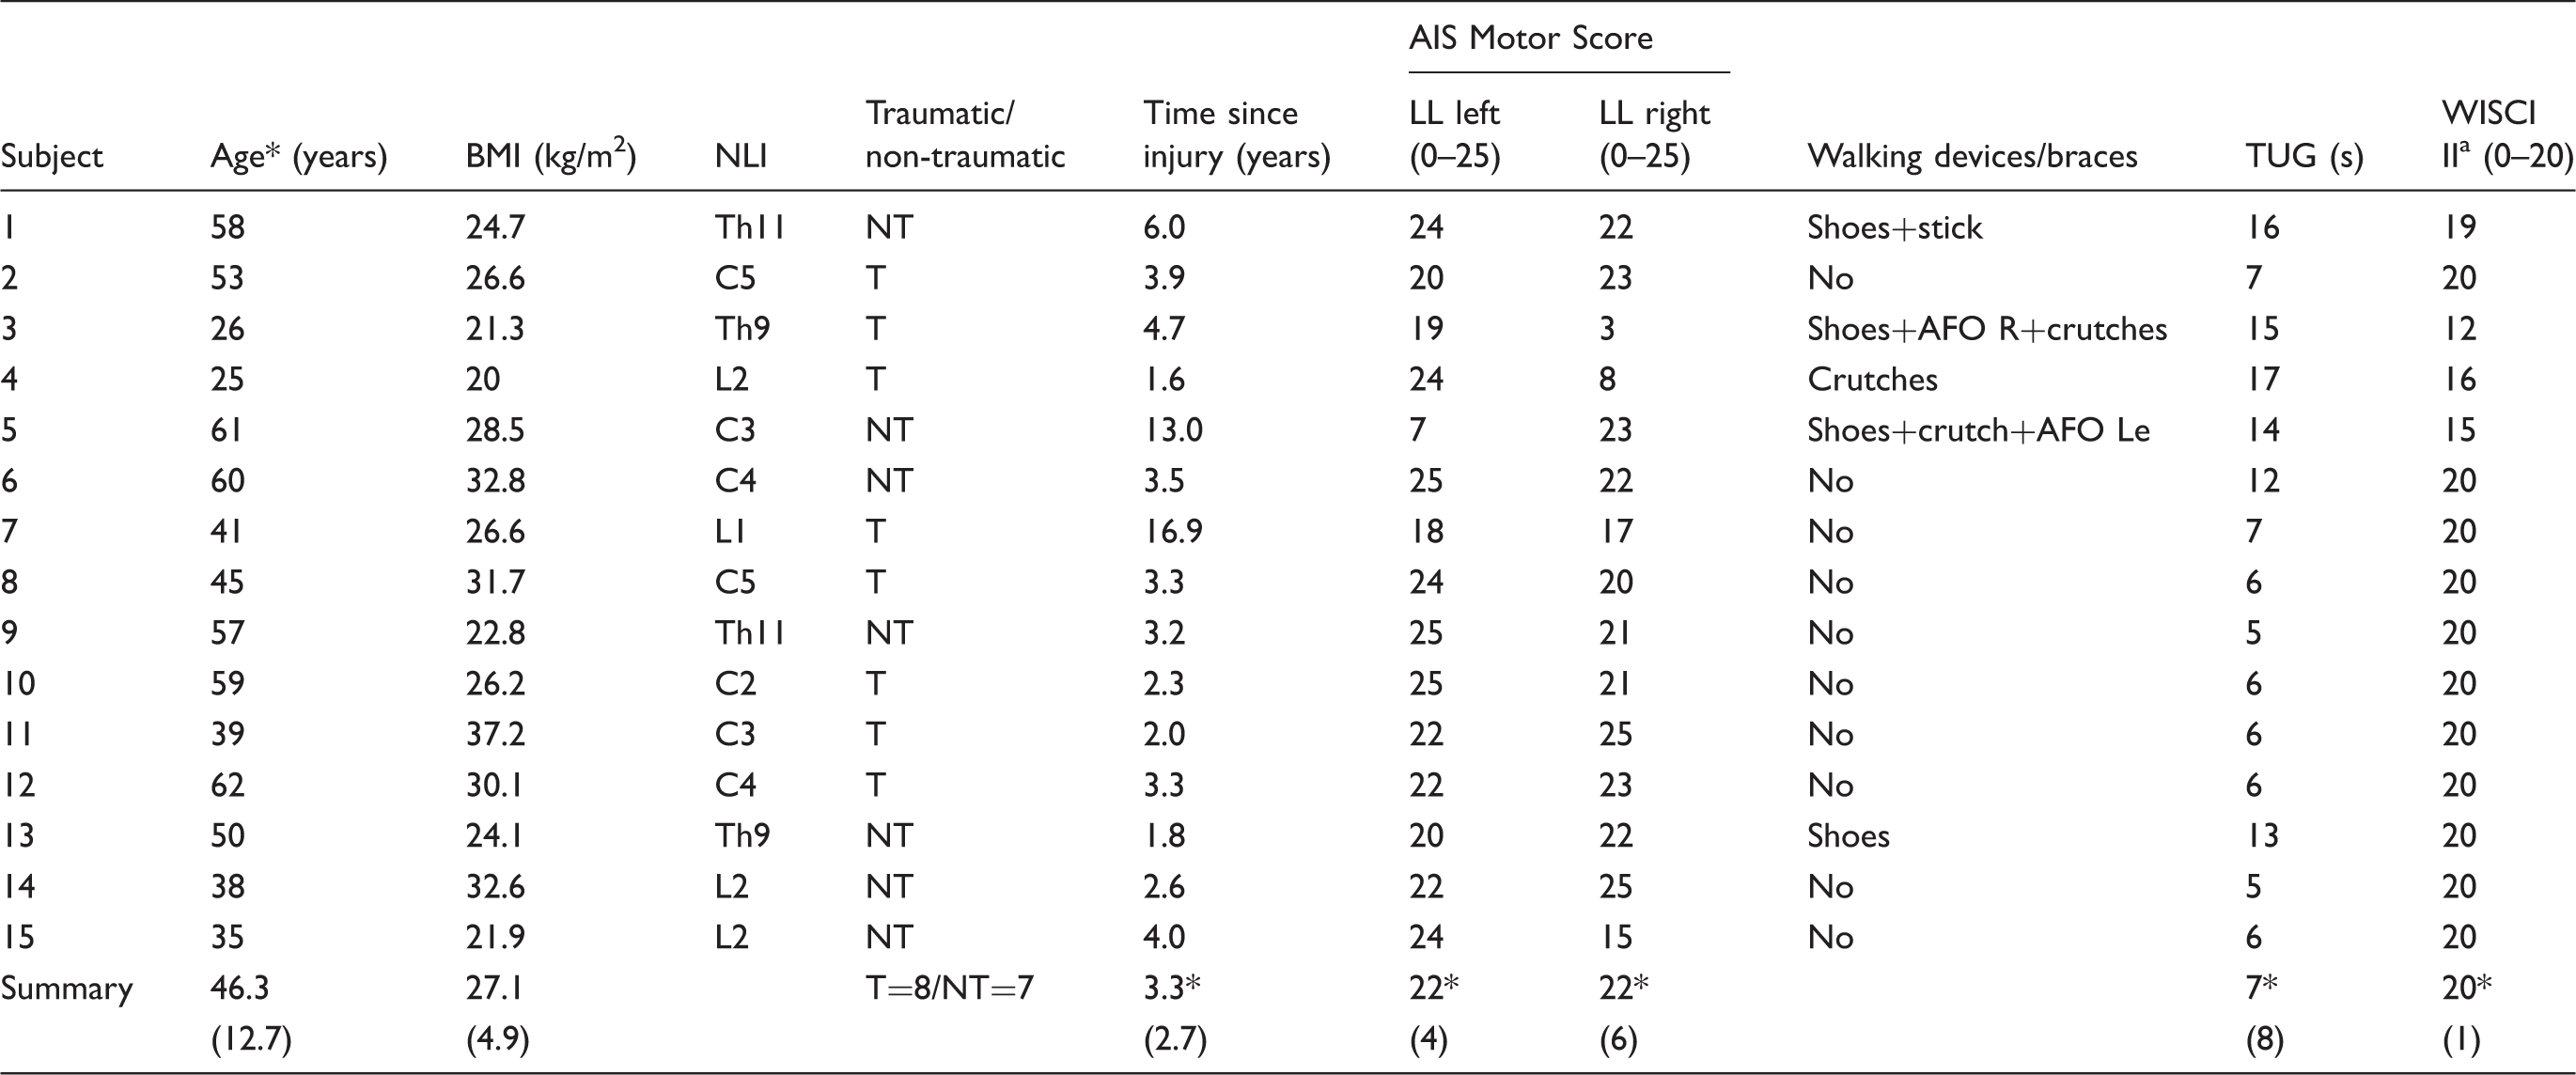
Summary values given as: mean (SD) or *median (IQR).
SD: standard deviation; IQR: interquartile range; BMI: body mass index; NLI: neurological level of injury; Th: thoracic; C: cervical; L: lumbar; T: traumatic injury; NT: non-traumatic injury; AIS: ASIA Impairment Scale; LL: lower limb; AFO: ankle-foot-orthosis; R: right; Le: left; TUG: Timed Up & Go; s: seconds; WISCI II: Walking Index for Spinal Cord Injury II.
Minimum score of WISCI II is ‘0’ which indicates unable to walk. Maximum score is ‘20’ which indicates ability to walk 10 m without assistance or devices/braces.
Seven subjects were diagnosed with tetraplegia and eight with paraplegia. Seven subjects were found to have some degree of increased muscle tone, with muscles around the ankle being most affected.
Mean gait speed was 1.03 (SD = 0.31) m/s and 1.03 (SD = 0.30) at sessions 1 and 2, respectively. No significant difference between the two sessions was found for gait speed or step length. A significant difference within each session was observed for gait speed (ANOVA; F = 2.92, p = 0.029 and F = 5.24, p = 0.001 for sessions 1 and 2, respectively).
Inter-session reliability
No significant difference between the two sessions was found for any of the GPSs (Total, Left and Right). For GVSs, a significant difference between the two sessions was observed for pelvic rotation (95% CI: 0.003–0.139, p = 0.04) only.
Inter-session reliability results for Gait Profile Score and Gait Variable Score based on five trials from each of the two sessions in 15 subjects with incomplete spinal cord injury.

ICC (2,k): intraclass correlation coefficient (2,k); 95% CI: 95% confidence intervals for ICCs; SEM: standard error of measurement; MDC: minimal detectable change.
ICC calculated from log transformed data due to non-normal distribution.
All SEM values were ≤0.8° and the MDCs were ≤2.2°. Bland–Altman plots with 95% LOA showed that the difference between the two sessions was <0.3° with SD of the differences <1.2° for all GPSs (Figure 2(a) to (c)).
Bland-Altman plots with 95% limits of agreement (dotted lines), based on 15 subjects with incomplete spinal cord injury. Solid lines = mean difference between Session 1 and 2. GPS = Gait Profile Score.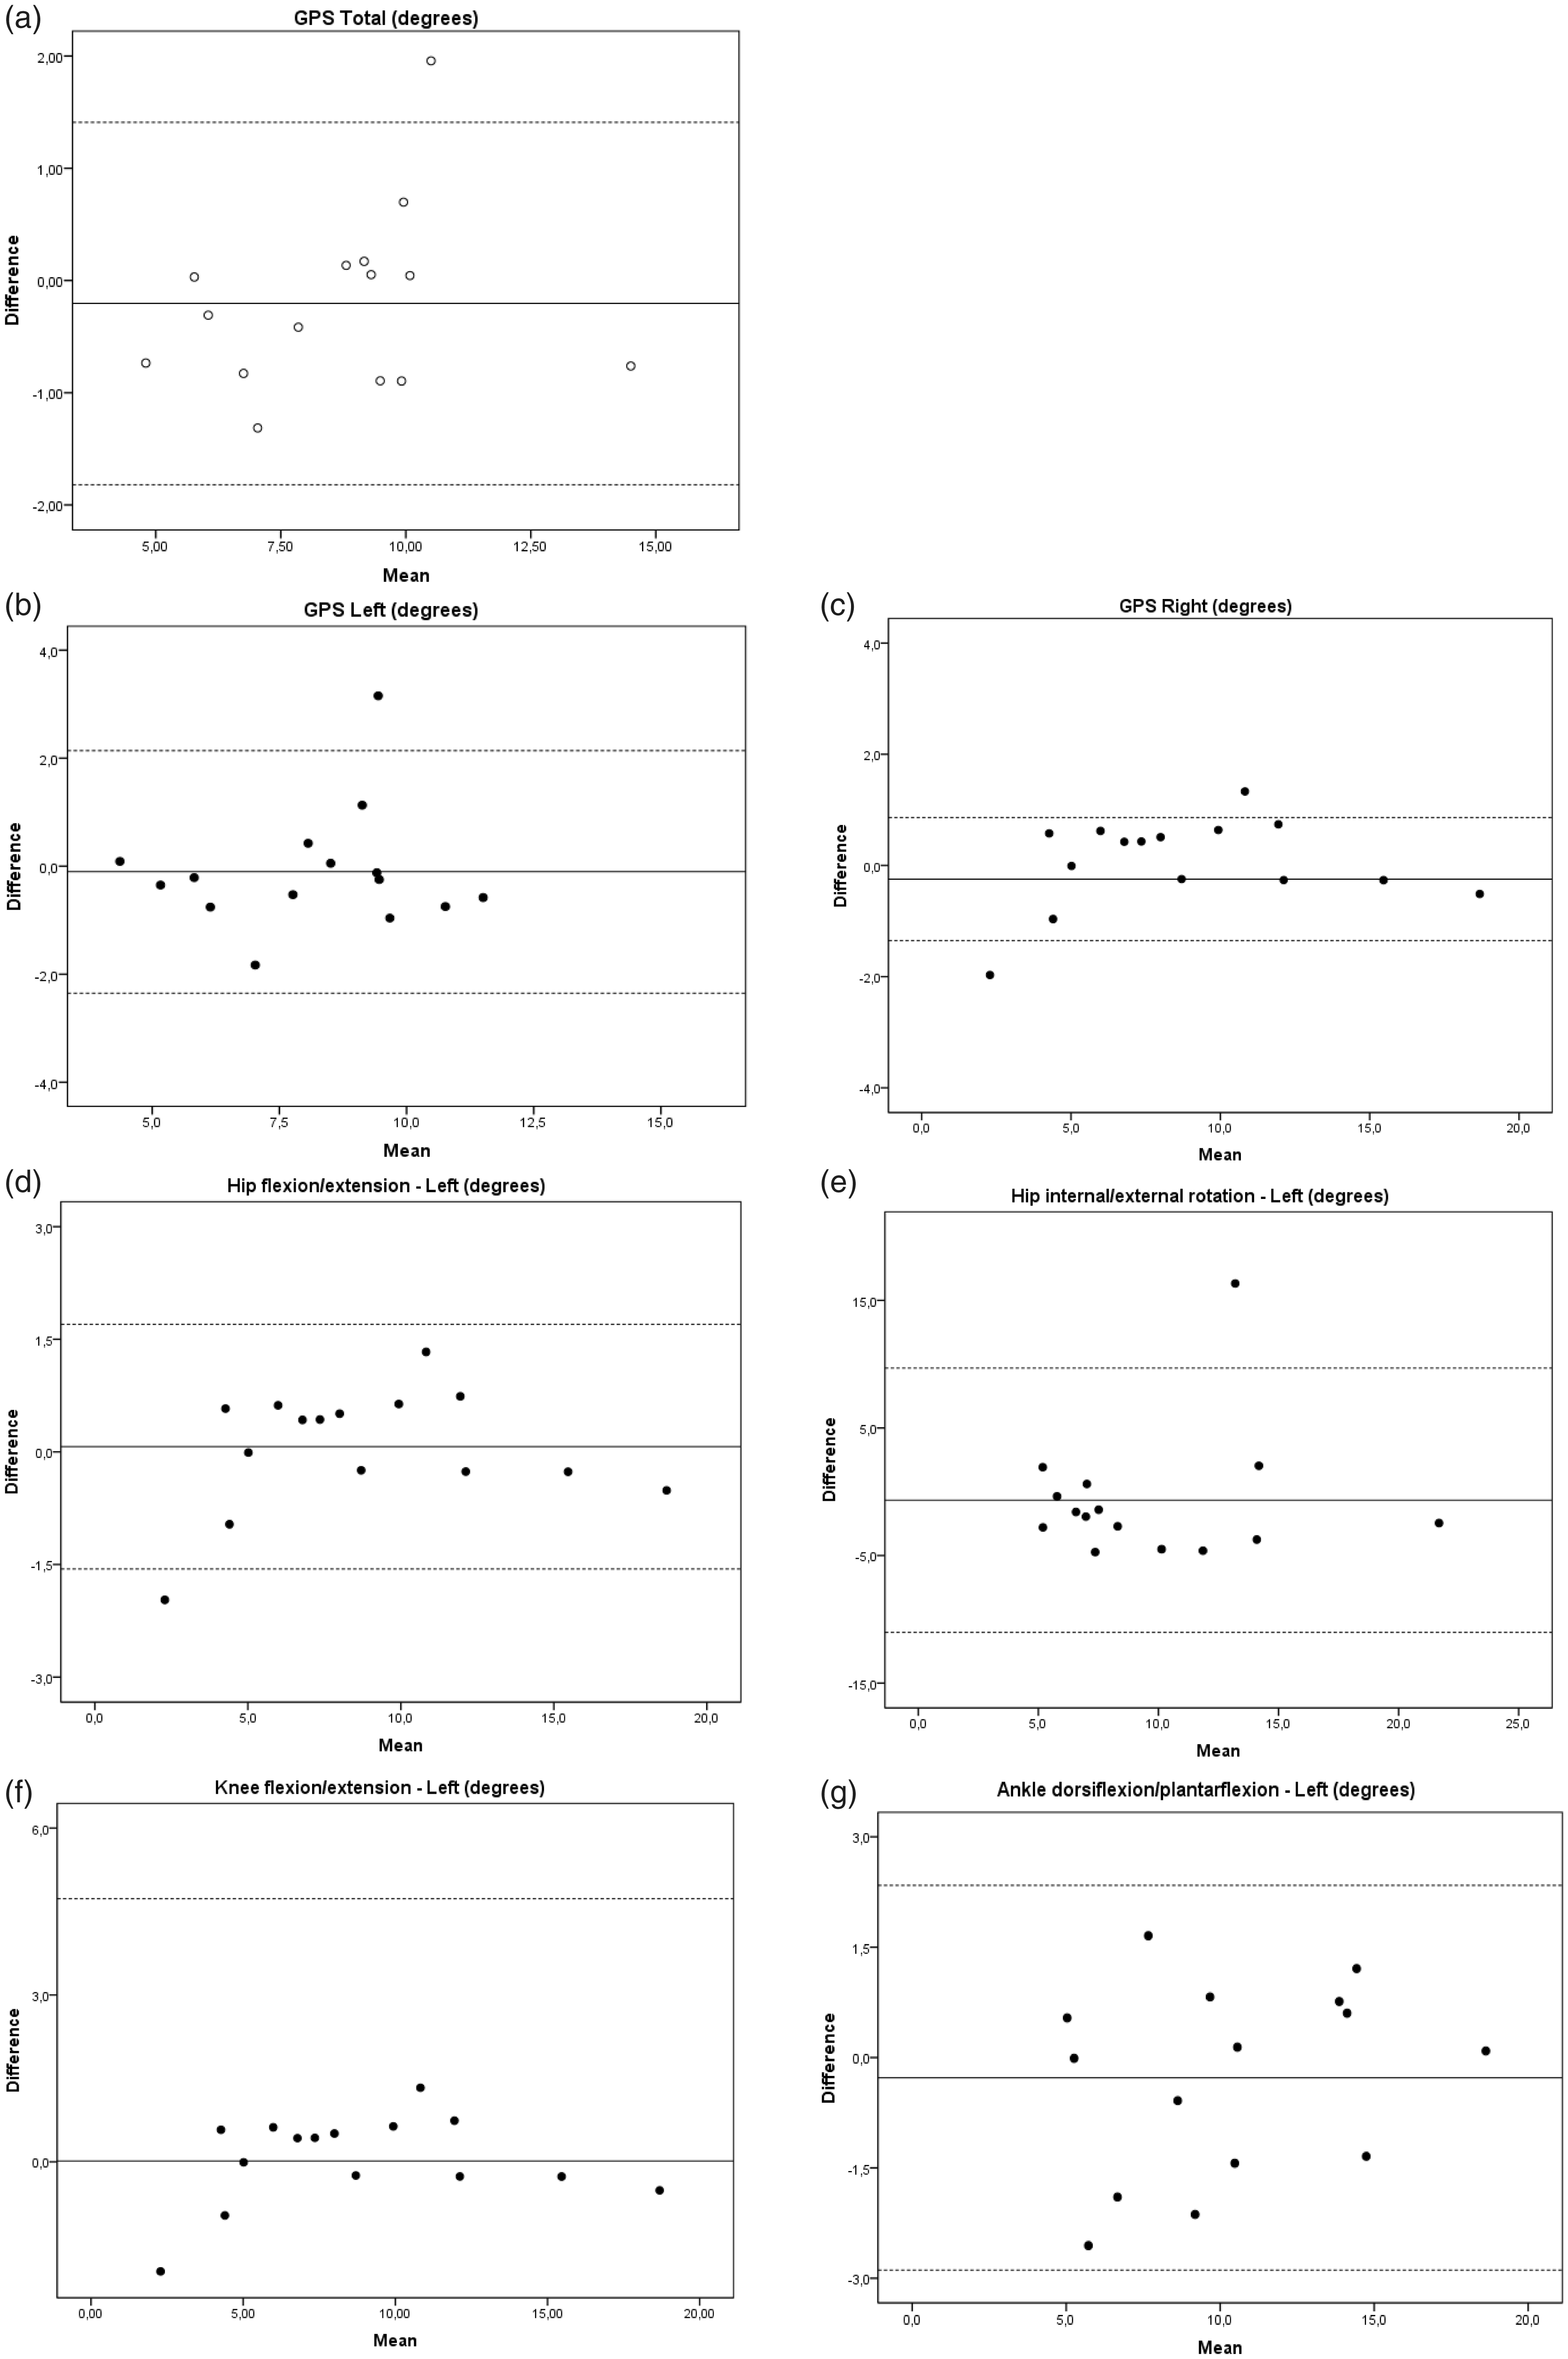
The 95% LOA ranges were all <4.2°. The highest LOA was observed for GPS Left (−2.3° to 2.1°, Figure 2(b)) and the lowest for GPS Right (−1.4° to 0.9°, Figure 2(c)).
Inter-session ICCs for GVSs were high (≥0.83), except for hip rotation which showed moderate ICCs (Table 2). All SEM values were <3.8° with the majority being <1°. MDCs were <4.7° except for hip rotations (Table 2). Bland–Altman 95% LOA demonstrated that the mean differences between the two sessions were ≤0.7°, and SD of the differences were <5.3° for all GVSs (Figure 2(d) to (g)). Not all plots are shown in the figure.
Intra-session reliability
Intra-session reliability results for Gait Profile Score and Gait Variable Score in Session 1 based on five trials in 15 subjects with incomplete spinal cord injury.
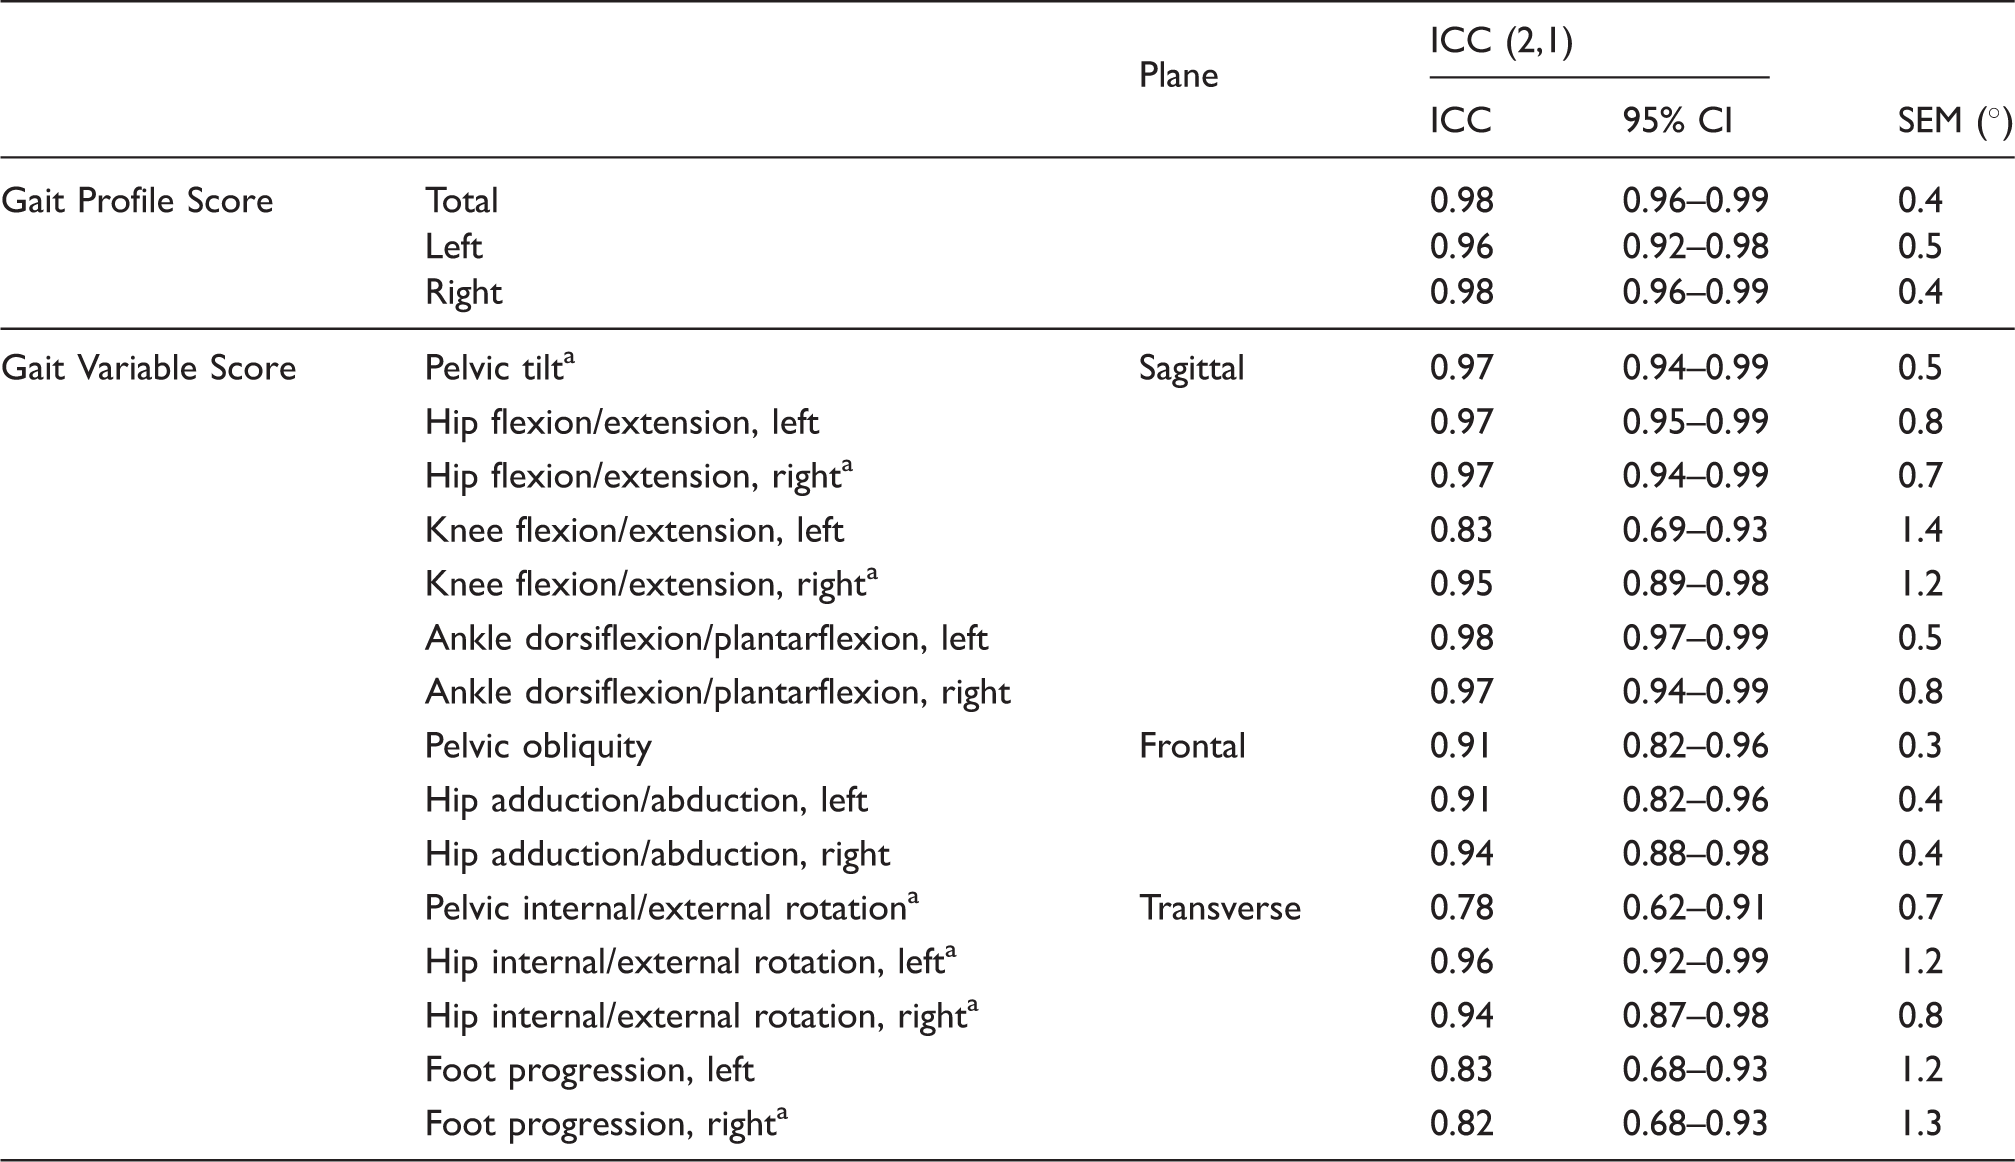
ICC (2,1): intraclass correlation coefficient (2,1); 95% CI: 95% confidence intervals for ICCs; SEM: standard error of measurement.
ICC calculated from log transform data due to non-normal distribution.
All intra-session reliability results for GVS showed high ICCs (≥0.78) (Table 3). SEM for all GVSs was <1.5°. Similar results for both GPS and GVS were found for Session 2 (data not shown in the tables).
Discussion
The main results of the present study were the high inter- and intra-session reliability of kinematic gait variables, found for both GPSs and GVSs scores with ICCs > 0.77 and SEM values <1.4° (Tables 2 and 3). The exceptions were left and right hip rotation showing moderate ICCs and SEM values ≤3.7°. In line with these results, the MDCs were <4.7° for GPSs and GVSs, except for left and right hip rotation.
ICCs and SEM values for hip rotation were similar to those in a population with cervical spondylotic myelopathy. 14 Our findings are also supported by other studies investigating the reliability of 3D gait analysis in populations with and without gait pathology.8,10,11 Although Klejman et al., 10 examining reliability of discrete parameters in children with cerebral palsy, observed a higher mean ICC (0.88) for hip rotation than in the present study, their SEM values were high (≤7°) for hip rotation in the transverse plane. The same moderate ICC (0.62) for hip rotation was also observed by Caty et al. 11 in adults with stroke and in the review by McGinley et al. 8
Two of the recognised errors in 3D gait analyses are marker placement and relative skin/marker movement errors. 25 In the PiG-model, subjective palpation of anatomical landmarks and estimation of knee joint axis are necessary to position the thigh wand markers. The moderate reliability for hip rotation in our study was probably due to variation in the placement of the thigh wand markers. Baker and Rodda, 35 investigating the consequences of misplacing markers, observed that a 5 mm misplacing of the thigh marker affected the hip rotation with 2.8°.
The mean body mass index (BMI) among our subjects was >25 (Table 1), implying that the group was overweight (www.who.int/mediacentre/factsheets/fs311/en/). Adipose tissue may also present difficulties in palpating the anatomical landmarks for the markers. In addition, excessive motions of the skin-mounted markers relative to the underlying bone may cause errors in determination of the segment coordinate system axes. 36
Increased muscle tone may also possibly explain the moderate inter-session reliability for hip rotation, as changes in muscle tone may induce changes in hip rotation. 37 Seven subjects showed increased muscle tone when assessed with MAS. However, muscle tone may appear different when walking than when tested passively in a supine position.
Gait speed is known to influence kinematic variables.38,39 No significant differences were found between the two test sessions, neither for gait speed or step length. Hence, the observed inter-session variations in gait kinematics cannot be attributed to changes in speed or step length. Within each test session, significant differences were obtained for both gait speed and left step length. However, the difference between the trials was no more than 0.05 m/s for gait speed and 0.03 m for step length. It may therefore be questioned whether these changes, although statistically significant, were of clinical relevance and affected the kinematic gait variables in the intra-session analysis.
GPS and GVS have some limitations as outcome measures. They do not indicate timing or direction of the gait deviation as individual gait scores and the scores are not directly comparable, although on the same scale. For instance, a 10° deviation in the hip may not have the same clinical significance as a 10° deviation in the knee or the ankle. 26
In our study, the sample size was relatively small and the results should therefore be regarded as trends rather than strictly conclusive. The small sample size did not allow accurate calculations of Bland–Altman 95% LOA, as the recommended sample size is at least 50 subjects to avoid very wide limits. 40
Inter-assessor reliability may impact the results of a reliability study. The three experienced assessors in our study had previously participated in a 3D gait analysis study of inter-assessor reliability in adults with no gait pathology, which showed good reliability. 41 When the less experienced human scientist was part of the assessment pair, the more experienced physiotherapist was in charge of marker placements and anthropometrical measurements. The assessors did not take part in the data processing; hence, the possible influence of the assessors on the results was minimized. To reduce the effect of assessors’ errors in this study, we used skin marking to ensure consistent marker placement between the two sessions. However, in a clinical setting, this is usually not possible as subjects often are assessed weeks or months apart. Hence, inter-session variability might increase in a clinical practice.
As noted, five subjects (33%) used walking devices, shoes or braces, which may have affected the gait. A closer examination of the Bland–Altman plots (Figure 2) revealed that the two subjects wearing a combination of shoes, brace and crutch(es) often showed up as outliers indicating increased gait variability.
According to Scholtes et al., 42 the test–retest reliability evaluates reliability across different times, and the timing of the second test is therefore essential. The time interval should be small enough so that the subject has had no real change in-between, but should also be so far apart to minimize bias effects such as recollection and fatigue. The time interval in 3D gait analysis reliability studies, similar to the present study, varies from two hours to several months.43–45 The test–retest in our study was performed one or two days apart. Ideally, the same time interval should be used for all subjects, but this was not possible due to the subjects’ planned schedule at the hospital. The test sessions for each subject, however, were performed at the same time of the day.
In their systematic review, McGinley et al. 8 noted that a measurement error of ≤2° is acceptable in most common clinical situations, that errors between 2° and 5° are reasonable, but may require consideration in interpretation, and that errors >5° may be large enough to mislead clinical interpretation and thus be of concern. Our error estimates for inter-session reliability GPS and GVS were well <2°, except for left and right hip rotation, which were <3.8° (Table 2). This was also reflected in the MDC values, which were <5°, except for rotation of left and right hip, which were high (≤10.2°). Thus, our results suggest that measurements of hip rotation should be evaluated with caution.
Going forward, improving consistency of marker placements, both between sessions and between patients, should reduce hip rotation variation. Staff at the Motion Analysis Laboratory at Sunnaas Rehabilitation Hospital is therefore practicing to better ascertain the direction of the knee flexion/extension axis and thus the rotational plane of the femur.
Conclusion
The results showed very high and/or high inter- and intra-session reliabilities, except for inter-session reliability of hip rotation. The small trial-to-trial and day-to-day variability of gait suggest that the intrinsic variation of gait in adults with ISCI is small. However, caution is recommended with regards to the evaluation of hip rotation. Except for this variable, only small changes were required to exceed measurement errors for the kinematic variables. 3D gait analysis seems to be a reliable outcome measure for the evaluation of gait impairments in adults with acquired ISCI, both for clinical and research purposes.
Footnotes
Declaration of conflicting interests
The author(s) declared no potential conflicts of interest with respect to the research, authorship, and/or publication of this article.
Funding
The author(s) received no financial support for the research, authorship, and/or publication of this article.
Guarantor
Pia Wedege is the guarantor of this paper.
Contributorship
PW, KS, VS and AIO contributed to the design of the study; PW and AIO were involved in data collection; PW, VS, AIO performed the data analysis; KS provided consultation on all phases of the project; PW wrote the first draft; all authors contributed to and approved the final version.