
Abstract
Hospitals are facing severe increases in the cost of clinical supplies, and a common strategy is to drive economies of scale achieved by hospital consolidation. The supply strategy of “volume leveraging” involves sourcing through contracts with Group Purchasing Organizations (GPOs) for commercial distributors and manufacturers of medical products. This study seeks to document the empirical benefits associated with volume leveraging, through analysis of purchasing data from three large hospitals. The dependent variables include a number of factors that are used to justify volume leveraging approaches, yet the study finds no significant explanatory factors that determine price variation related to the volume purchased. Interviews with physicians and clinicians suggest that poor data quality leads to lack of transparency, and an inability to aggregate volumes across inventory SKUs may be preventing volume-based cost savings from materializing. The results also suggest that lack of transparency results in low levels of utilization, which increases costs.
Keywords
Introduction
Healthcare in the USA is a US$3.2 trillion industry (Speaks, 2016), yet it is often described by experts as a “cottage industry” due to the lack of maturity surrounding its contract management and supply chain practices (Abdulsalam et al., 2015a; Handfield, 2012). Research suggests that up to 40% of funds spent are non-value-added in nature (Schneller and Smeltzer, 2006). The dynamics of the sector are complicated by the number of different supply chain participants involved and the fragmented nature of different systems used in various locations for data capture which operate independently (Abdulsalam et al., 2015b; Handfield, 2012; Jee and Kim, 2013).
A number of potential solutions have been suggested, including provider and supplier consolidation, public websites documenting healthcare costs, reimbursement levels, and integration with electronic medical records as part of its elements (Abdulsalam et al., 2015b; Limbacher, 2016; McKone-Sweet et al., 2005; Schneller and Smeltzer, 2006). In this study we focus on a singular issue that is an important aspect of medical care which contributes to escalating costs, the need for improved price, and cost transparency as a vehicle for greater market competition (Lee et al., 2011; Limbacher, 2016; The Henry Kaiser Family Foundation, 2007). This issue is made all the more critical given the recent research by Zygourakis et al. (2017) who found that providing cost transparency to surgeons was an important solution to the problem of OR waste, which is a source of significantly increased healthcare costs. While not unique to healthcare, improved control over hospital spending is a significant challenge that is particularly troublesome given the escalating costs of healthcare in the USA.
Recent studies of population health management programs recognize that supply chain management is a critical link that ties together various parties in the continuum of care: clinicians, suppliers, distributors, and payers (AHRMM, 2017). Research suggests that at the root of the increasing cost of healthcare is the lack of cost transparency in the supply chain, due to the multiple exchanges that occur between providers of healthcare services and consumers (Handfield, 2013; Smith et al., 2013; Volpp, 2016; Welch and Handfield, 2015). Provision of price transparency, improved supply chain coordination, and market power are important issues to resolve if hospitals are able to “break even” given increasing reimbursement pricing pressure from insurance companies and public healthcare (Handfield et al., 2010; Shaw, 2003; Speaks, 2016). This problem ultimately manifests itself in the words of a healthcare supply chain executive we interviewed, who noted that: We have no idea if we made money or lost money on a given DRG
1
because we are unable to understand the true costs of the materials required to perform it. We know we bought materials, but we are unable to trace it to a patient, and often cannot map it to a single unit cost that can be billed to a patient.
Despite the lack of price transparency within procurement systems, healthcare providers continue to consolidate their networks under the guise of pursuing efficiency. For instance, the latest wave of consolidation includes the merger of two major hospital systems, Ascension and Providence St. Joseph Health, both non-profits, which would create an entity of 191 hospitals in 27 states and annual revenue of US$45 billion (Evans and Mathews, 2017). This would dethrone the nation’s largest pure hospital operator, HCA Healthcare Inc., which owns 177 hospitals and had US$41.5 billion in revenue in 2016 (Evans and Mathews, 2017). The assumption behind many of these mergers is that by amalgamating their pool of dollars spent on third-party resources, economies of scale will drive down the cost of operating medical procedures, and the larger hospital networks will be more profitable.
But does size translate into more market power and lower prices in the marketplace, in the face of the opaque levels of price transparency that exist? The premise of this article is that indeed the lack of price transparency driven by poor data governance is a primary barrier toward a properly functioning market in healthcare. In perfect markets, product costs are a function of demand and raw material costs. However, in the case of hospitals, many other forces may be at play. We begin with a review of existing literature that summarizes the basis for the premise that “bigger systems are better for consumers.” This leads to an exploration of why the issue of data transparency and data quality render this proposition implausible for the US healthcare population. This is illustrated through an analysis of three hospitals’ data for six different clinical supply categories, which illustrates that volume leveraging through existing Group Purchasing Organization (GPO) contracts does not result in lower prices. (The mission of GPOs is to buy from manufacturers in larger quantities, obtain quantity discounts, and pass the savings on to hospitals after taking a small rebate for their own profit.) We posit this may be primarily due to the lack of price transparency in such channels, based on discussions with healthcare executives at several different hospitals. We conclude with recommendations for contract management and data governance mechanisms that may produce greater price and cost transparency in the future, leading to a more cost-effective healthcare system in the USA.
Literature review and research proposition
An extensive review of past studies found that although the adoption of supply chain principles holds a lot of promise for healthcare, numerous barriers exist that prevent such benefits from being realized, including lack of systems, and inadequate investment in improving processes and establishing effective protocols (Abdulsalam et al., 2015a; Kim and Kwon, 2015; Volpp, 2016). Case studies by Selva (2016) and Welch and Handfield (2015) suggest that the lack of integration of purchasing, inventory, and warehouse management systems will fail to produce the right outcomes.
One of the important issues that arises in understanding how healthcare acquires goods is that many of them buy through GPOs. However, there is a lot of debate and controversy regarding whether GPOs are truly the most effective means of buying products for hospitals. GPOs are prone to kickbacks/sharebacks, significant profit-taking from both manufacturers and hospitals, and are a major cause of the lack of transparency in the supply chain. 2 Despite the strong claims made by the GPO industry relative to the savings derived from consolidation (Jayaraman et al., 2014), several extensive reviews of the healthcare contracting literature fails to find a single study documenting the existence of a relationship between a higher volume of purchases and cost savings (Dobryzkowski et al., 2014; Graf, 2014; Hu, Schwarz, and Uhan, 2012; Kim and Kwon, 2015; Volpp, 2016). These studies are the catalyst for our exploration of the issue of healthcare supply chain transparency.
Healthcare consolidation leading to increased purchase volume consolidation is at the heart of shifts in the healthcare sector. The problem (as noted by economists), is that consolidation in one sector of an industry can lead to consolidation in other sectors, such as the planned merger of CVS Pharmacy and Aetna Inc. and United Health Group with acquisition of physician groups. If the Cigna-Express Scripts merger also goes through, then nearly three in four senior citizens will have drug benefits covered by just four companies (Japsen, 2018). A goal of insurance companies is to try to get people to the lowest appropriate cost-of-care site, but it is not always clear how this consolidation will amount to lower costs of care if the market continues to be consolidated and fewer companies control the market.
Organizational changes have also accompanied the consolidation wave. The manner in which medical technologies are rationed, delivered, and in the market have changed exponentially in the last two decades (Selva, 2016). One of the biggest shifts in the structure of healthcare supply chains has been the emergence of GPOs (Johnston and Rooney, 2012). GPOs were created as a method of promoting quality healthcare by enabling hospitals and healthcare providers to manage expenses by negotiating for better offers based on increasing standardization of goods and volumes purchased (Applied Policy Report, 2014). The idea behind GPOs as a solution to healthcare woes was that they would provide “master contract agreements” that spanned multiple areas of spend, and could then leverage their volume from multiple hospitals to derive lower costs through leveraging with suppliers (manufacturers). This was certainly an appealing business case to hospitals, many of which signed on for contract agreements with GPOs, such as Premier, Medassets, Vizient, and Novation. Theoretical models using game theory suggest that providers with smaller purchasing requirements will experience lower total purchasing costs in the presence of a GPO but may experience higher per unit prices (Hu et al., 2012). In this exercise, manufacturers’ profits did not change, and GPO profits tended to vary with their contracting efficiency. Many hospitals rely on GPOs to combine their purchase spending across different clinical categories to secure quantity discounts (Smith et al., 2013). Whether such contracts result in lower costs is questionable, as prior empirical analyses have suggested (Handfield, 2013; Hu et al., 2012).
The issue of whether consolidation leads to lower healthcare costs, whether through the use of GPO buying on behalf of hospitals, or through hospitals themselves consolidating and becoming larger, is the issue that we question. The fundamental issue addressed in our study is illustrated in Figure 1: Does volume-based purchasing proposed impact on reducing product prices mitigated by the lack of data visibility and complexity in hospital purchasing information systems? Given the trend observed in industry toward greater hospital consolidation and the increasing use of GPO contracts to deliver volume-based purchases, it is worth questioning the assumption whether greater volume consolidation produces volume discounts and lower hospital costs. Lower cost and improved hospital efficiency are often cited as the management rationales for consolidation activities (Smith et al., 2013; Speaks, 2016; Reinhardt, 2014).
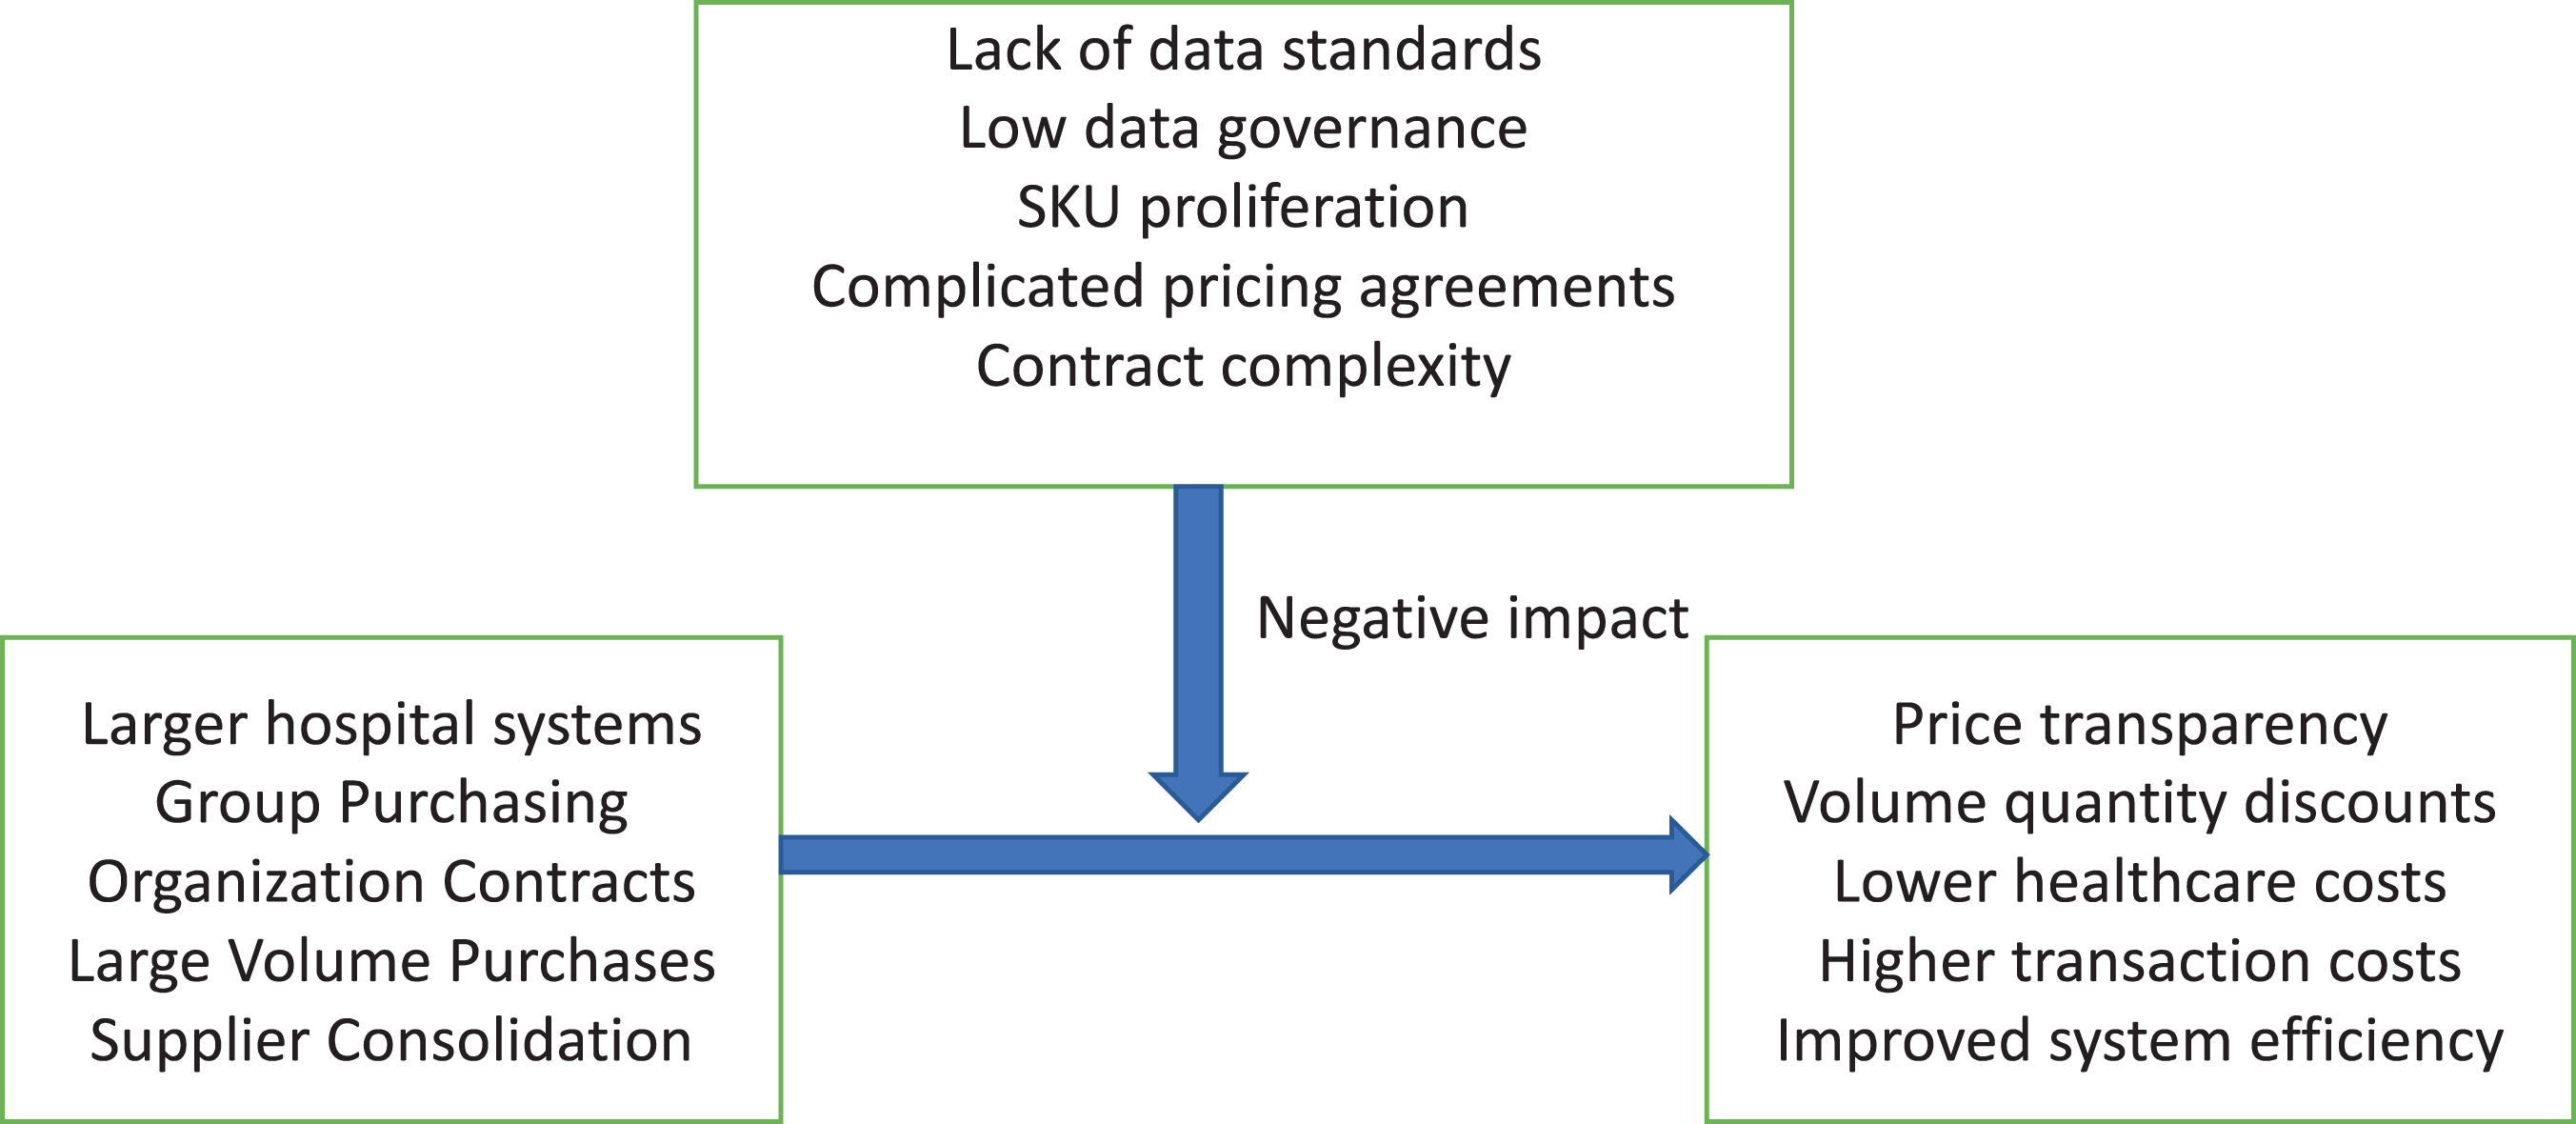
Framework for the study.
However, our research leads us to suggest that another factor is at play in industry that influences this proposed outcome: a lack of transparency and system complexity (Handfield, 2012; Handfield et al., 2010; Johnston and Rooney, 2012). Because many hospitals lack the required levels of data integrity required for true pricing transparency, higher volumes of purchasing do not allow the application of price leveraging, and the associated lower costs never materialize. Indeed, GPOs themselves may be a determinant for setting the base price of many products that would otherwise have been driven by traditional market factors (GHX, 2013). As a result, some hospitals have chosen not to go along the GPO route but have begun to develop “self-distribution” capabilities as they have acquired more hospitals in their network (Kaakeh et al., 2011). In both cases of volume consolidation (whether through GPO contracts or through hospital network expansion), prior research has not sufficiently addressed whether rebates, cost savings, or improved utilization has resulted in lower costs (Abdulsalam et al., 2015a, 2015b). This relationship, as shown in Figure 1, is believed to be impacted by the lack of true visibility into actual costs paid per unit of product. That is, higher volume purchases, achieved through consolidation of hospitals, usage of GPO contracts, supply base consolidation, and organizational joint buying, are theoretically positioned to drive discounted purchasing rates. This proposition forms the basis for our study.
Pricing and quality are indicators in healthcare that have suffered from a lack of transparency to end customers. Prices are rarely disclosed to patients before the treatment/procedure is administered, as such costs are typically paid for by third parties (i.e., insurance companies) (Shaw, 2003). (Note that there are well-documented instances of disclosure of prices pre-procedure—a phenomenon becoming more common.) With the move to value-based healthcare, providers are recognizing the need to understand the actual costs associated with delivering care and the associated levels of quality of care, especially for supply intensive procedures. High-quality supply chain data is essential for successfully implementing electronic health records (EHR) (Safdari et al., 2015). Similarly, data quality is critical for effective purchasing economics to occur. But due to both the lack of structured contracts and the inability to construct a structured spend analysis as a result of the large volumes of unstructured and unorganized data in item masters embedded within procurement systems, hospitals are unable to fully leverage their spending with suppliers. This is due to the lack of data clarity on the actual volumes purchased to drive discounted pricing (Adamson, 2015). And procurement personnel are often viewed as transactional buyers who have little ability to drive structured contracts and achieve savings through strategic sourcing activities (Pettigrew et al., 2013). New business models may improve the ability of procurement executives in hospitals to control spending, negotiate effective contracts, and conduct supply base optimization which can rationalize suppliers, buyers, and negotiators associated with the healthcare supply chain (PricewaterhouseCoopers, 2012). But before this can occur, the issue of data governance and visibility should be addressed.
In this study, we first develop the methodology and sampling frame used to explore the impact of volume on price in healthcare. Next, we describe the analyses used to test the relationship in more detail, and discuss these results. We then conclude with insights for future research in this area.
Methodology
Research sample
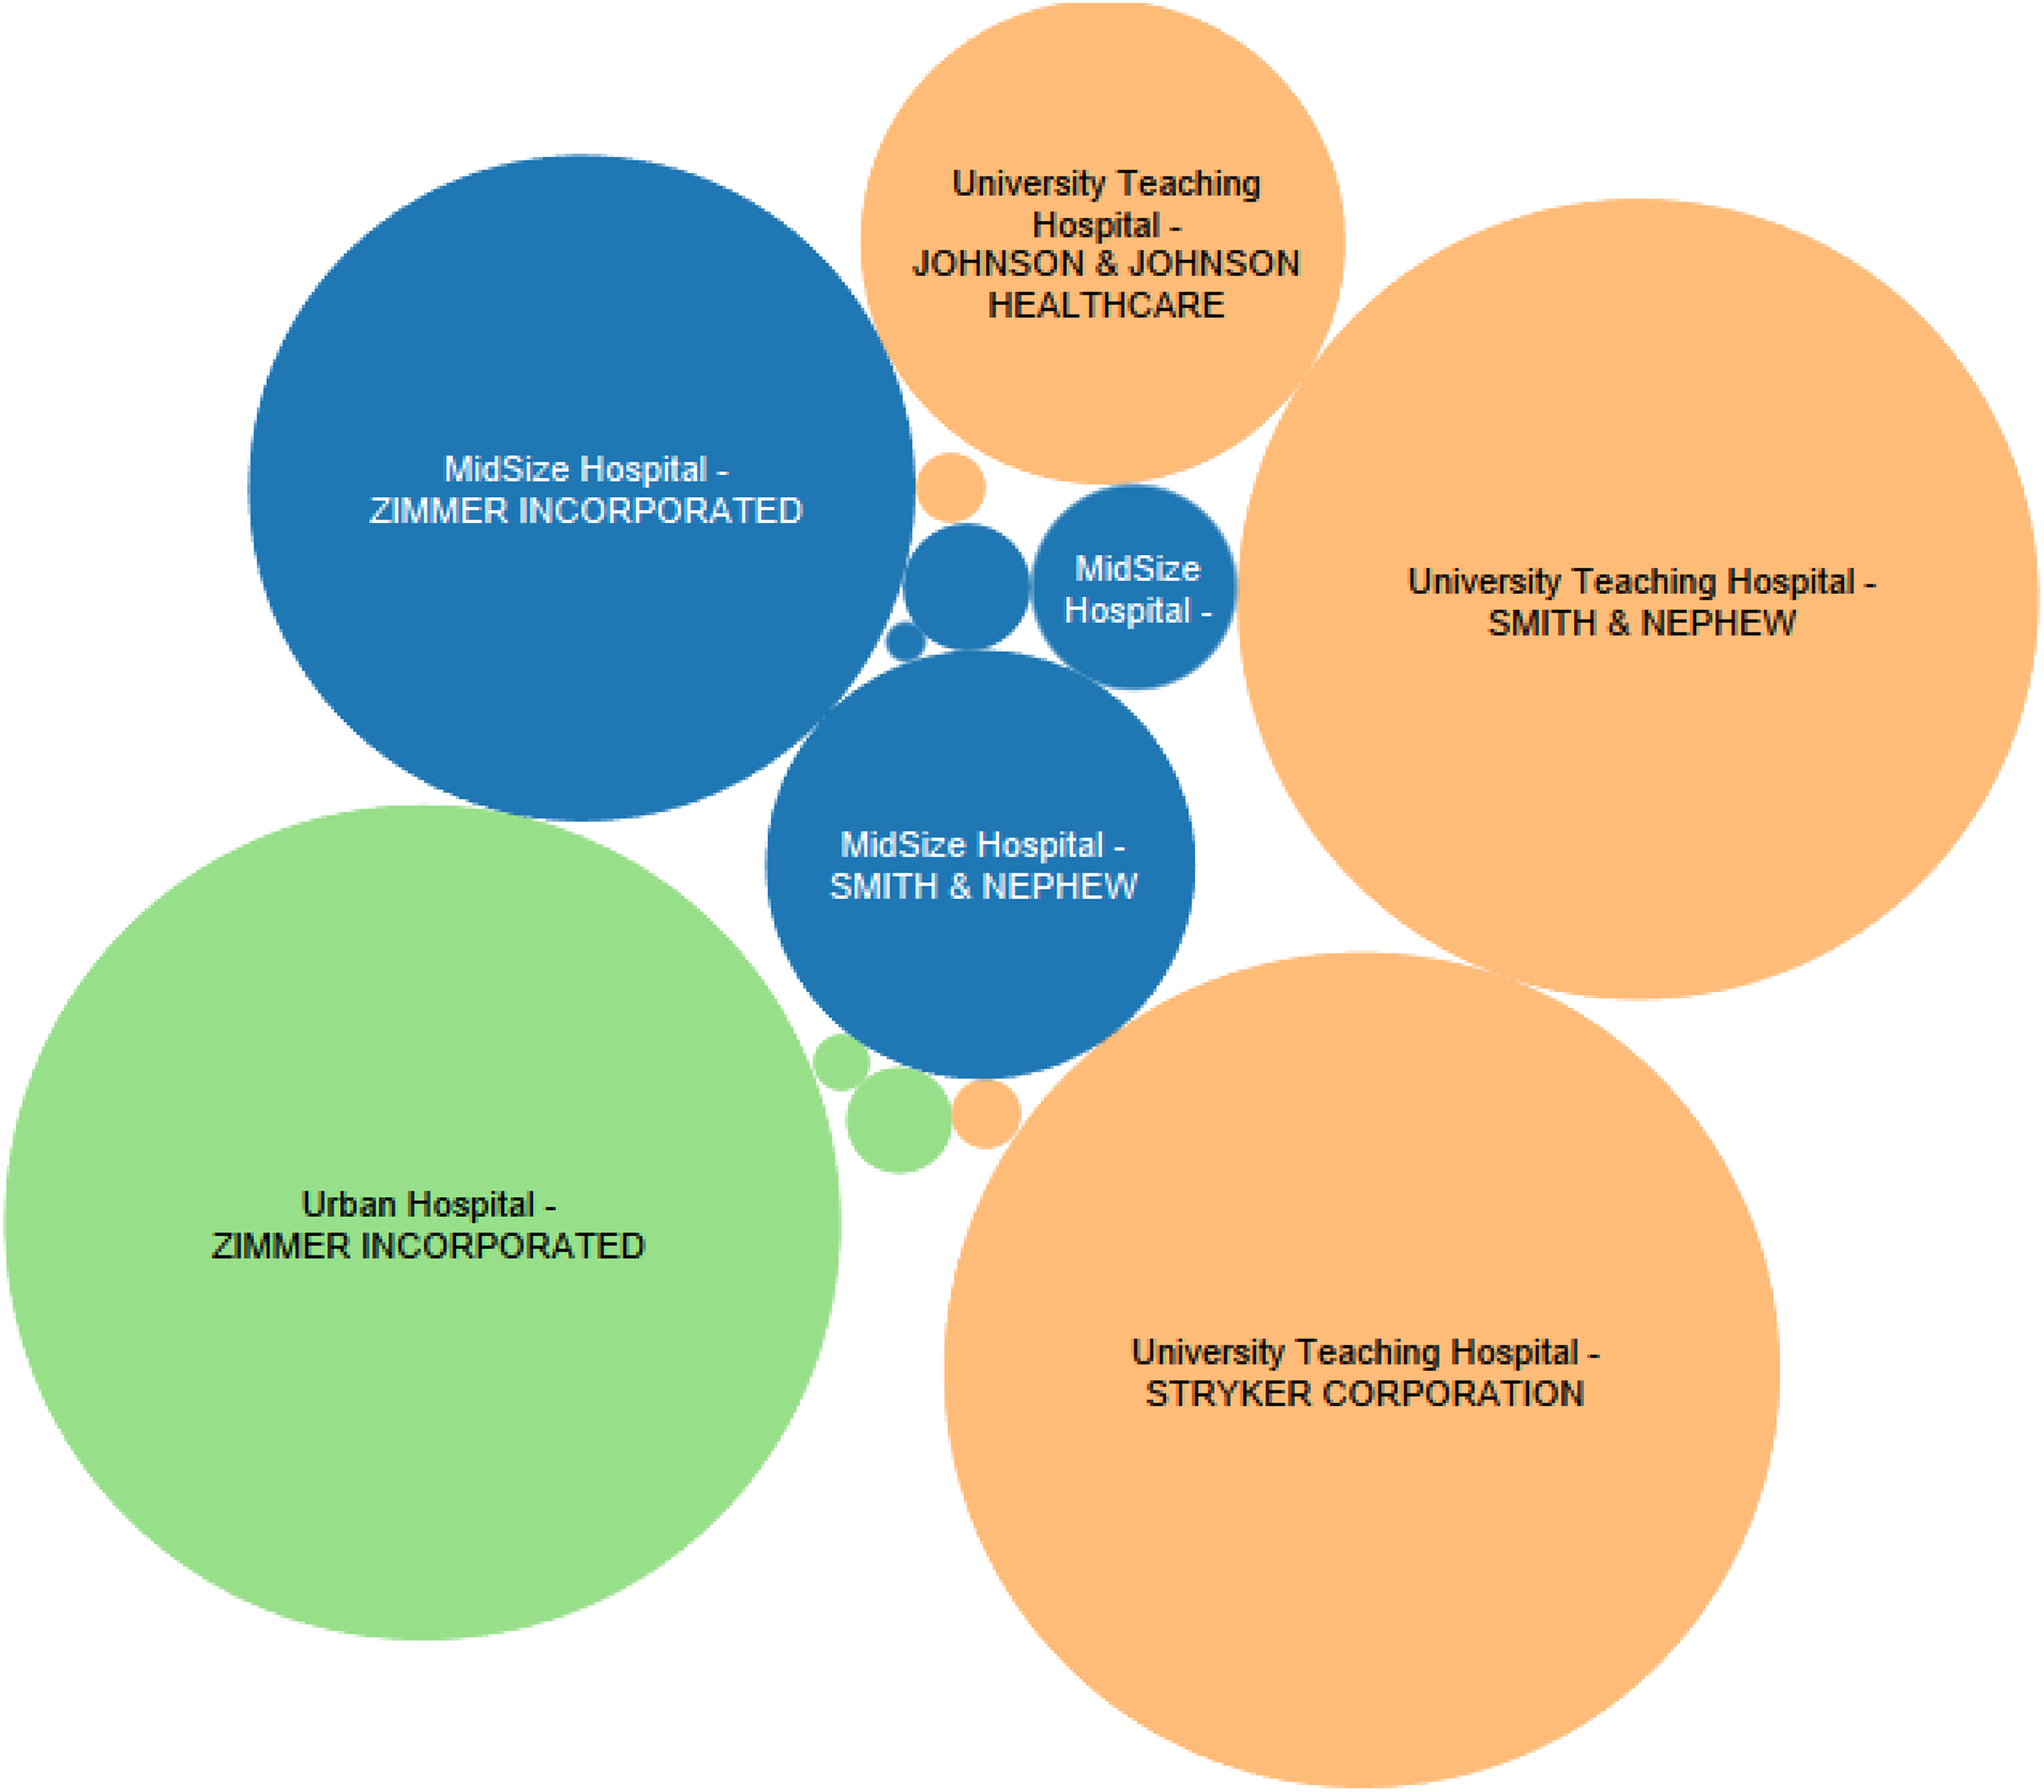
In comparing prices across different volumes of purchases for a standard set of items, we selected three hospitals that each had specific unique characteristics, but which were nevertheless representative of the general “target demographics” in each case. The three major types of hospitals found in the US system are non-profit (62%), for-profit (19%), and government (19%) (Market Realist, 2014), and we used this distribution as the basis for selecting our sample. As shown in Figure 2, across all three hospitals, the top supplier was a distributor (Medline, Cardinal Health, or Henry Schein). The hospitals are shown as follows: University Teaching Hospital is a mid-size government hospital, with 440 beds in Chicago, Illinois. The top supplier in this case is MedLine, Cardinal Health (both distributors), and Johnson and Johnson, a large supplier of clinical supplies. Many of the physicians in university hospitals may experiment with different types of clinical supplies, so driving a standardization program for consistent use of the same products is challenging (Handfield, 2014). Large Urban Hospital represents a large, New York-based non-profit hospital, with Henry Schein a distributor with a strong presence in the New York market. Urban hospitals such as this one typically have a very high cost to serve, but may also have some centralized purchasing and a strong regional GPO (e.g., CNYHA) that may allow greater standardization across the board. Midsize Hospital is a for-profit hospital located in a non-urban area in New Jersey, which is much smaller but caters for patients with a higher level of private insurance (246 beds). Such hospitals often are targets for acquisition by larger hospital networks, who can use their volume to purportedly drive their purchase volume leveraging (Welch and Handfield, 2015).
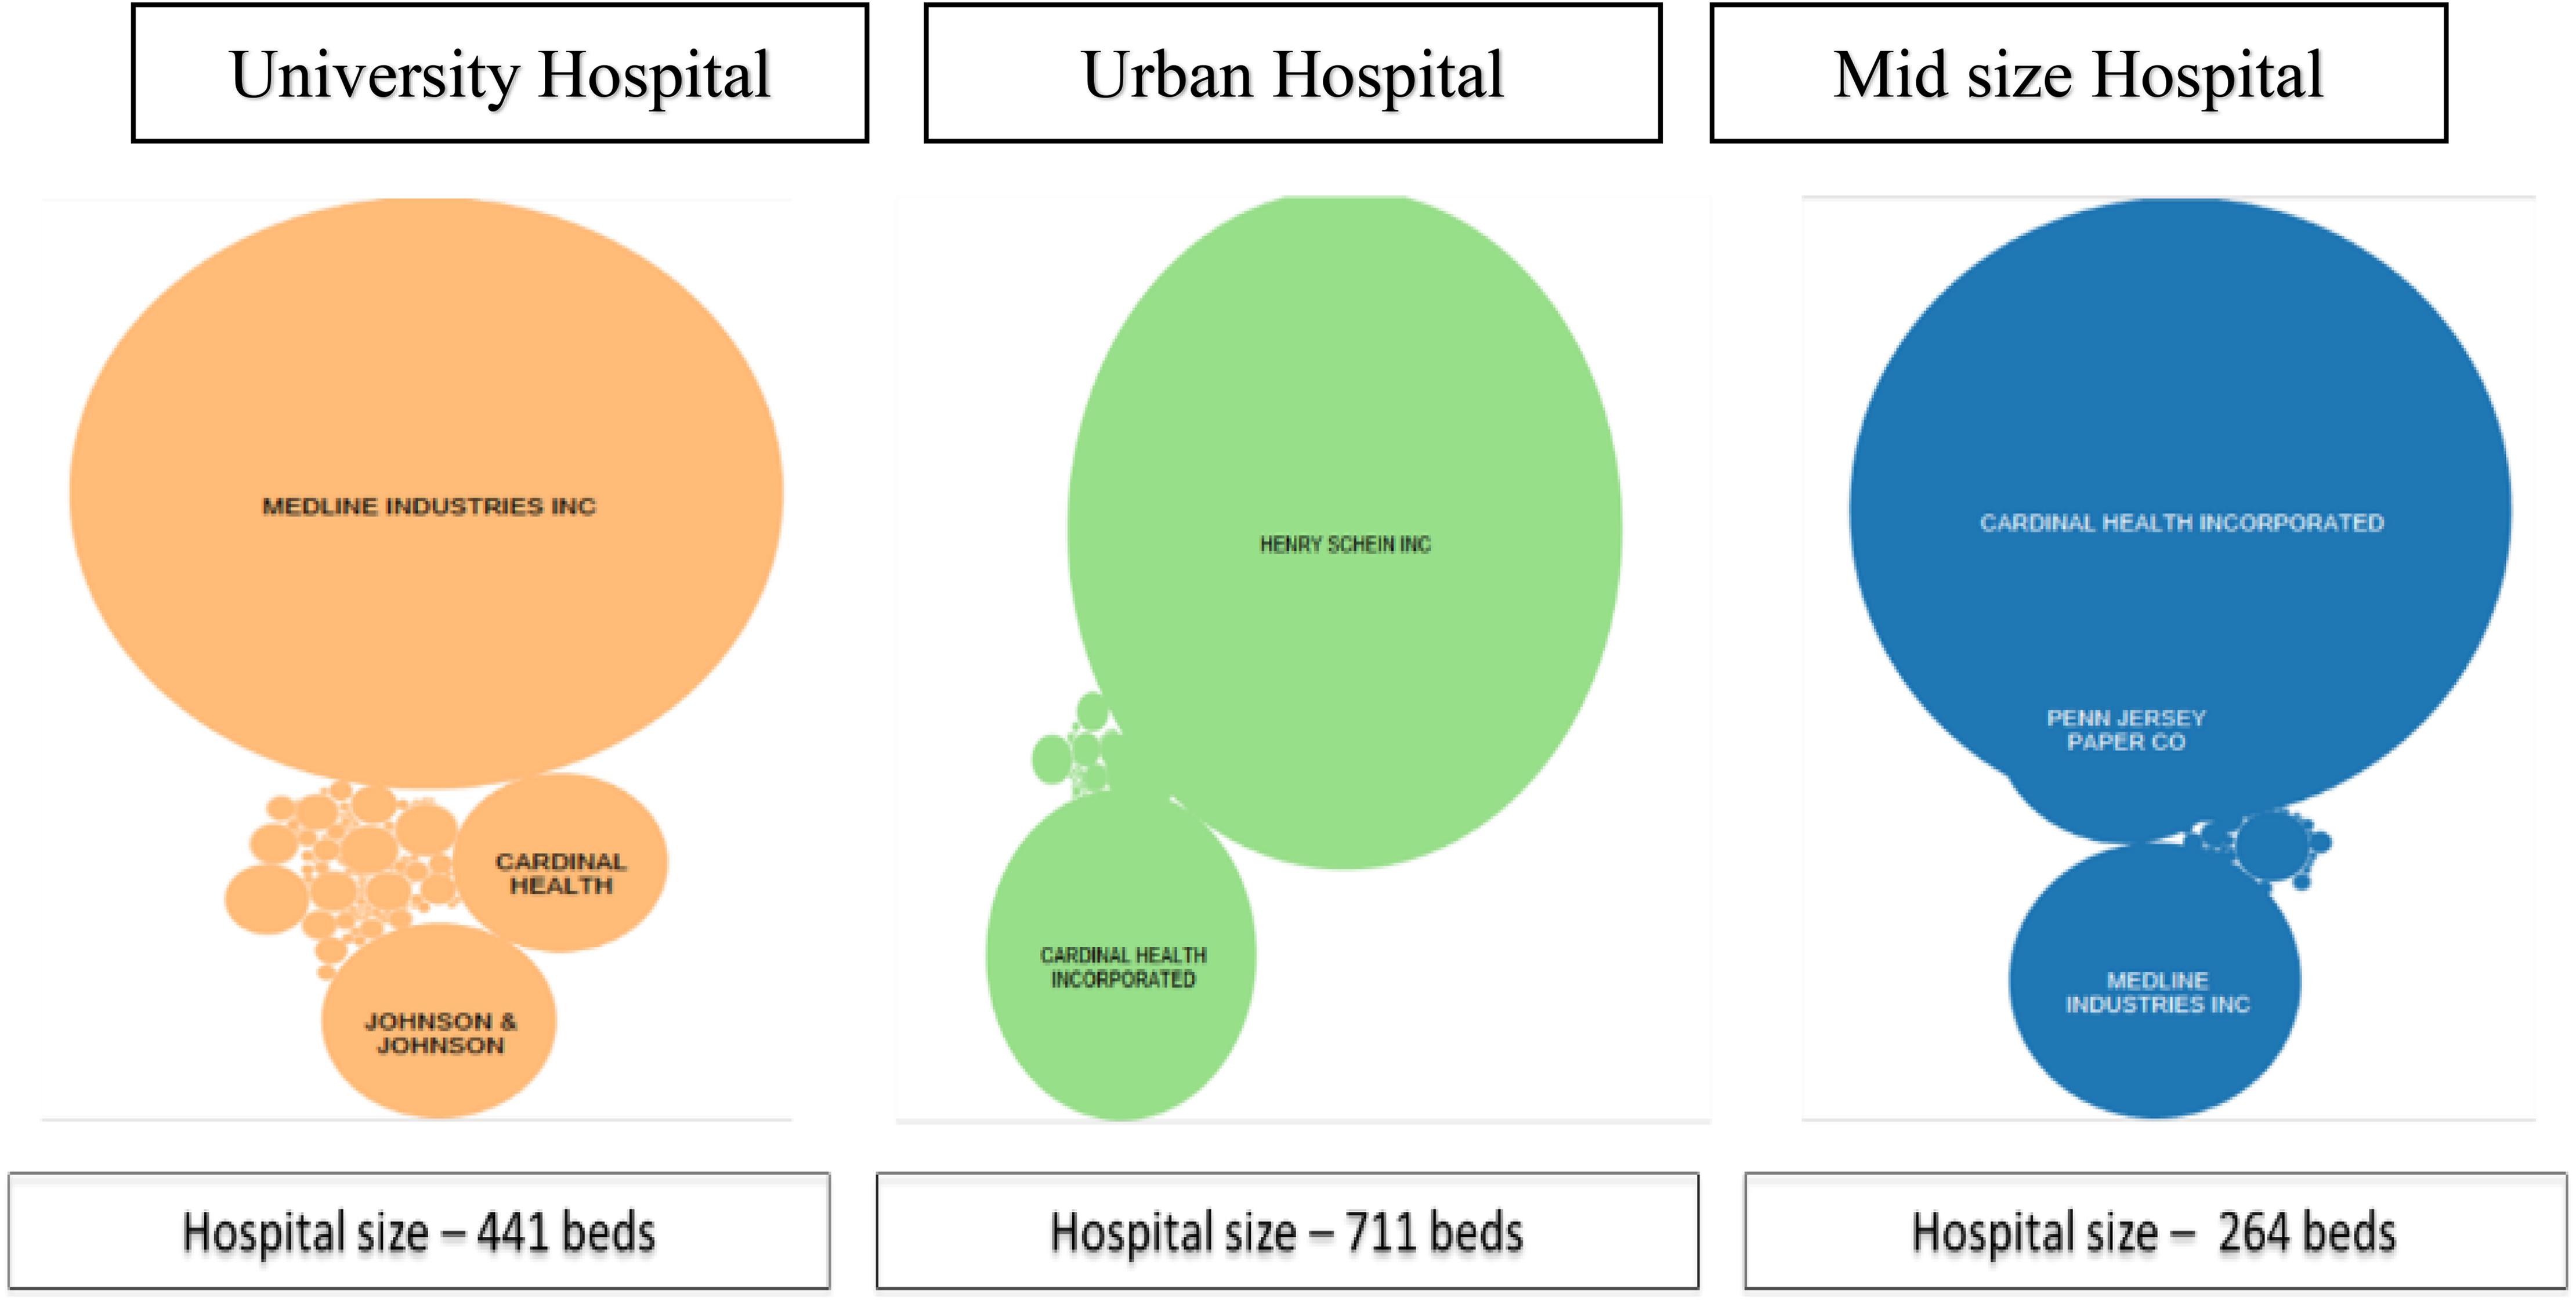
Top suppliers by spend across hospitals (n = 3000 SKUs).
These hospitals were selected out of a larger pool that was part of a national initiative to drive improved data integrity in hospital acquisition systems, called SCWorx. This organization is working with a number of major hospitals across the country, including Maimonides, Mayo Clinic, Baptist Health, University of Chicago, University of Vermont, and others. SCWorx is a system that has been designed to address the gaping hole in data integrity. The system has three essential elements that provide a solution for healthcare providers to deal with the lack of integration between their systems (which they have already invested in), and to enable access to data to drive up utilization rates. These include the following: Item master creation. SCWorx provides free toolsets to providers to help them create the attributes for the item master. Providers will maintain their own dictionaries of everything they use, using the tool. The toolset allows them to connect into SCWorx’s database and standardize across 200 data elements, enabling each hospital system to join a consortium of other hospitals. This consortium allows hospitals using different systems and different codes to translate and compare standard prices across different units and collaborate to find new ways to work together. Despite differences in systems and numerical codes, the system creates a standard taxonomy that creates a common system for comparison of prices. Automation. This feature increases productivity by assigning a general ledger number, a UNSPSC code, and other critical codes that take “people out of the loop” and ensure standardization of data on an ongoing basis using machine-based learning algorithms. Item master standardization. By creating standardization, the database can be used to analyze trends, business intelligence, and key performance indicators, thereby launching the journey into effective data analytics. Hospitals cannot be successful in their quest to drive down costs unless they have data that allows them to address challenges in spend analysis.
Figure 3 shows the total amount of spending at each hospital. Note in Figure 3 how the total spend in each case remains relatively fragmented across all three types of hospitals, and there appears to be no unique capability among any of them to drive improved consolidation, despite the fact that the data has been standardized using the SCWorx algorithms and methodology. An important underlying reason for the inability of hospitals to consolidate their purchase volumes effectively is described next, based on discussions with executives at these hospitals.
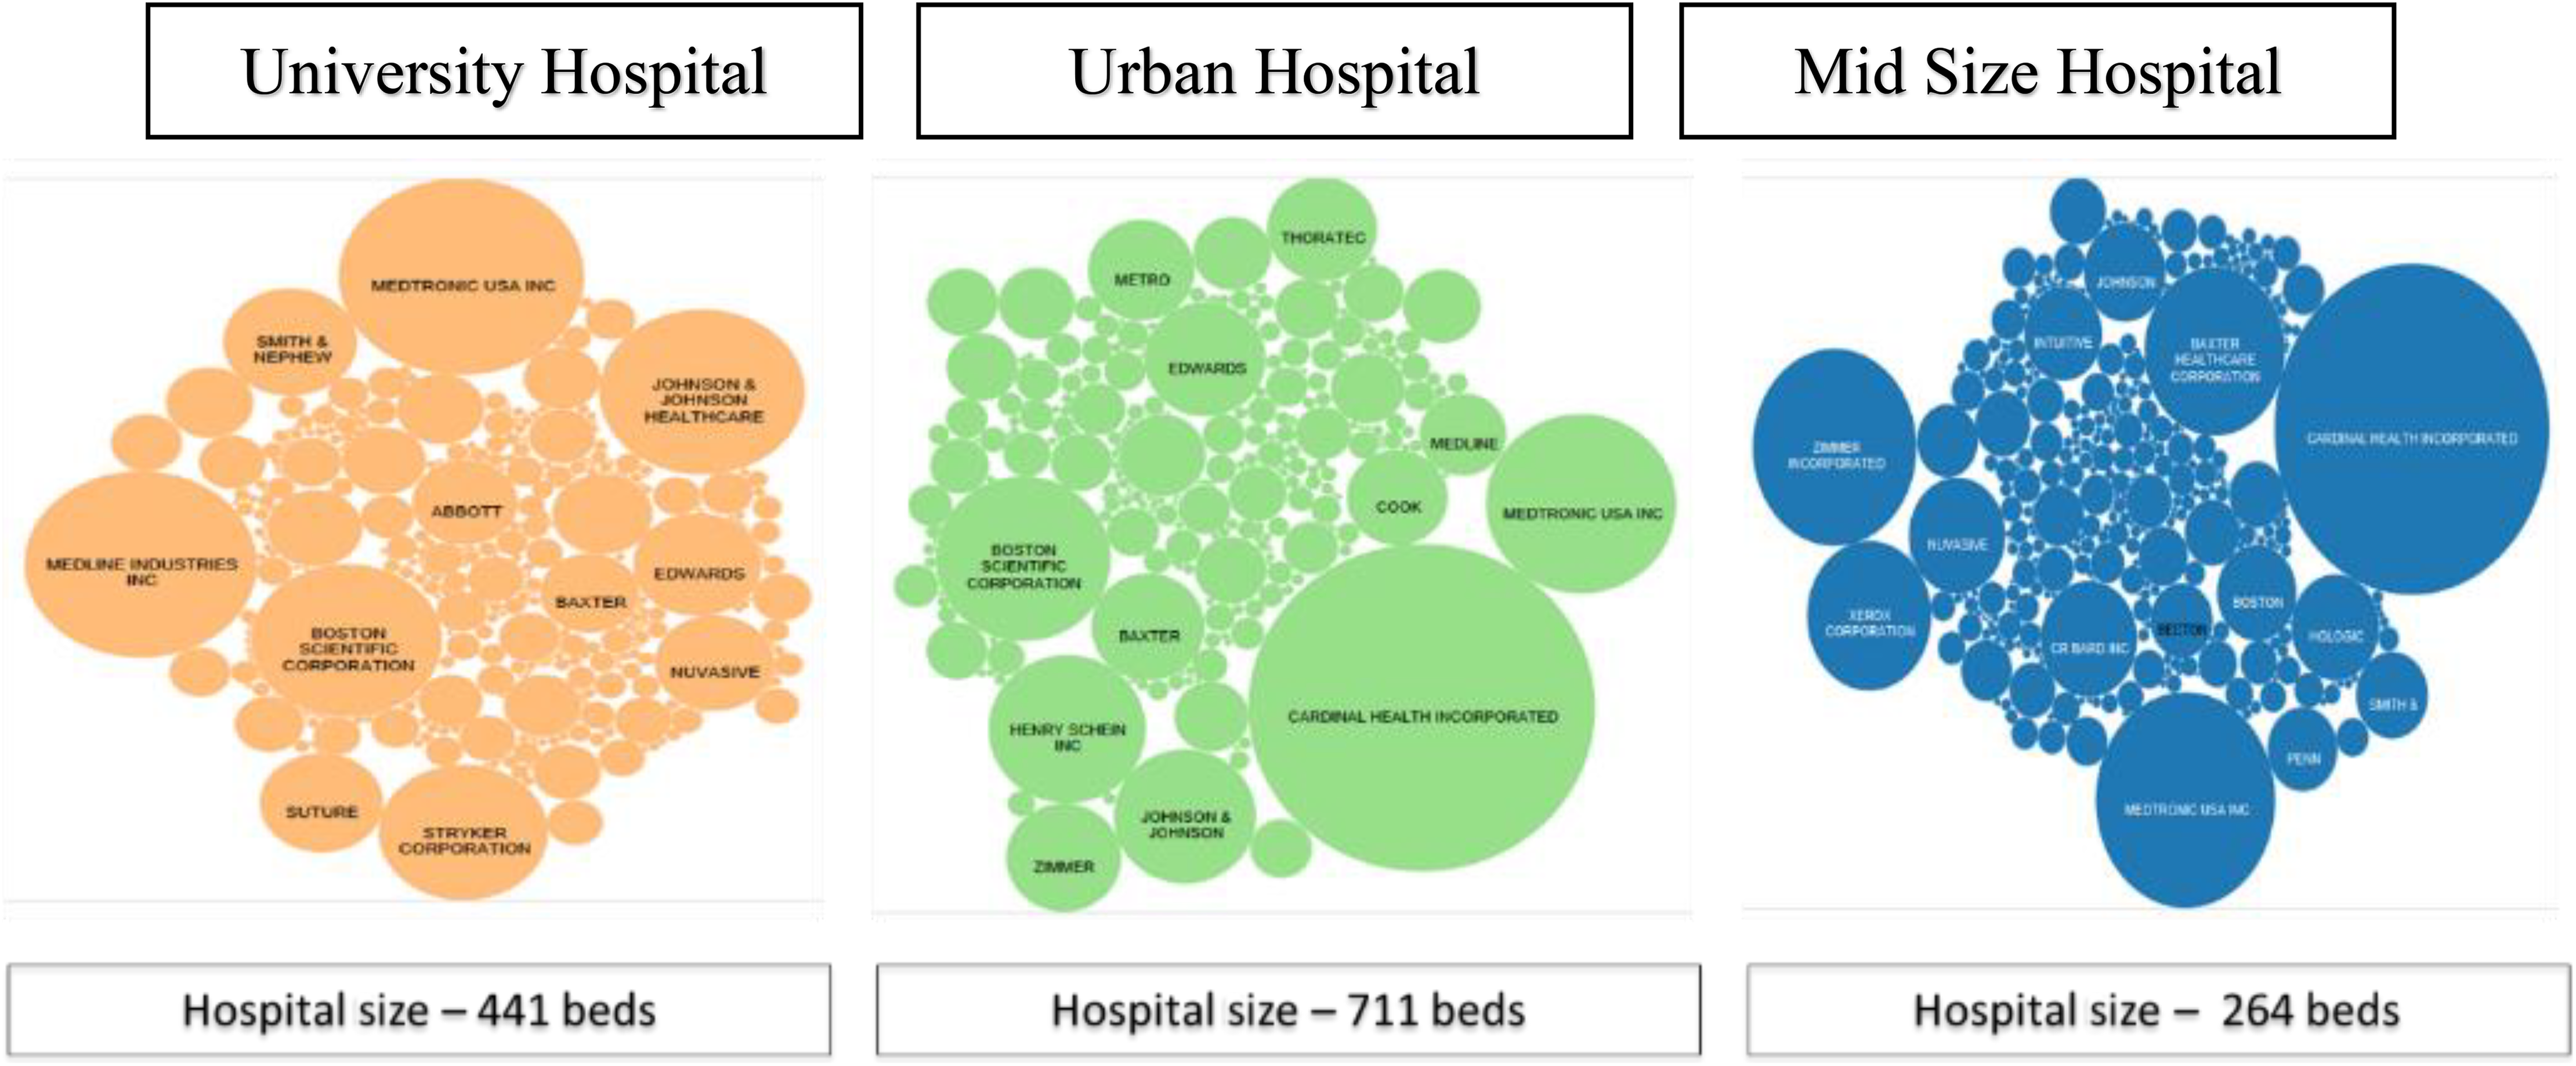
Top suppliers by volume across hospitals.
Data collection
The researchers conducted interviews in each hospital, identifying the means through which data was captured and utilized within each hospital. At each hospital, we interviewed at least two supply chain executives, one physician, and two nurses at each site, totaling 15 interviews. Here we found that the complexity of the data capture and analysis systems across the hospitals was dizzying, and almost impossible to trace. A typical information flow used in the procurement function in all three of the hospitals (with some minor variation in the names of the systems) is shown in Figure 4, which shows a patchwork, ad hoc network of information systems used to manage the purchases of clinical products in the healthcare supply chain. In each case, there are multiple handoffs that occurred as material travelled through GPOs (such as Premier, MedLine, Vizient, and HealthTrust), manufacturers, wholesale distributors (Cardinal, McKesson), and other parties that utilize myriad distribution channels. Item master codes, contracts, and data similarly travelled through a dizzying array of ERP systems, Contract Centers, GPO databases, and eventually wound up in a data repository. Due to the circuitous route and multiple handoffs between different parties, by the time the data reached a data repository at each hospital provider, the level of data quality (accuracy, consistency, integrity) was abysmal. Data analytics are often interpreted through an ad hoc system of “cross-walks” that map the items using common codes, to a stage where aggregated analytics can be produced. The potential for error in each case led to missing data, multiple SKU numbers for the same materials, different supplier master codes, and many other errors that prevented any level of volume consolidation to occur. While these systems are often advertised as being a complete solution, Figure 4 shows the mapping of data exchanges between systems highlights the multiple opportunities for data errors and non-standard master codes to occur.
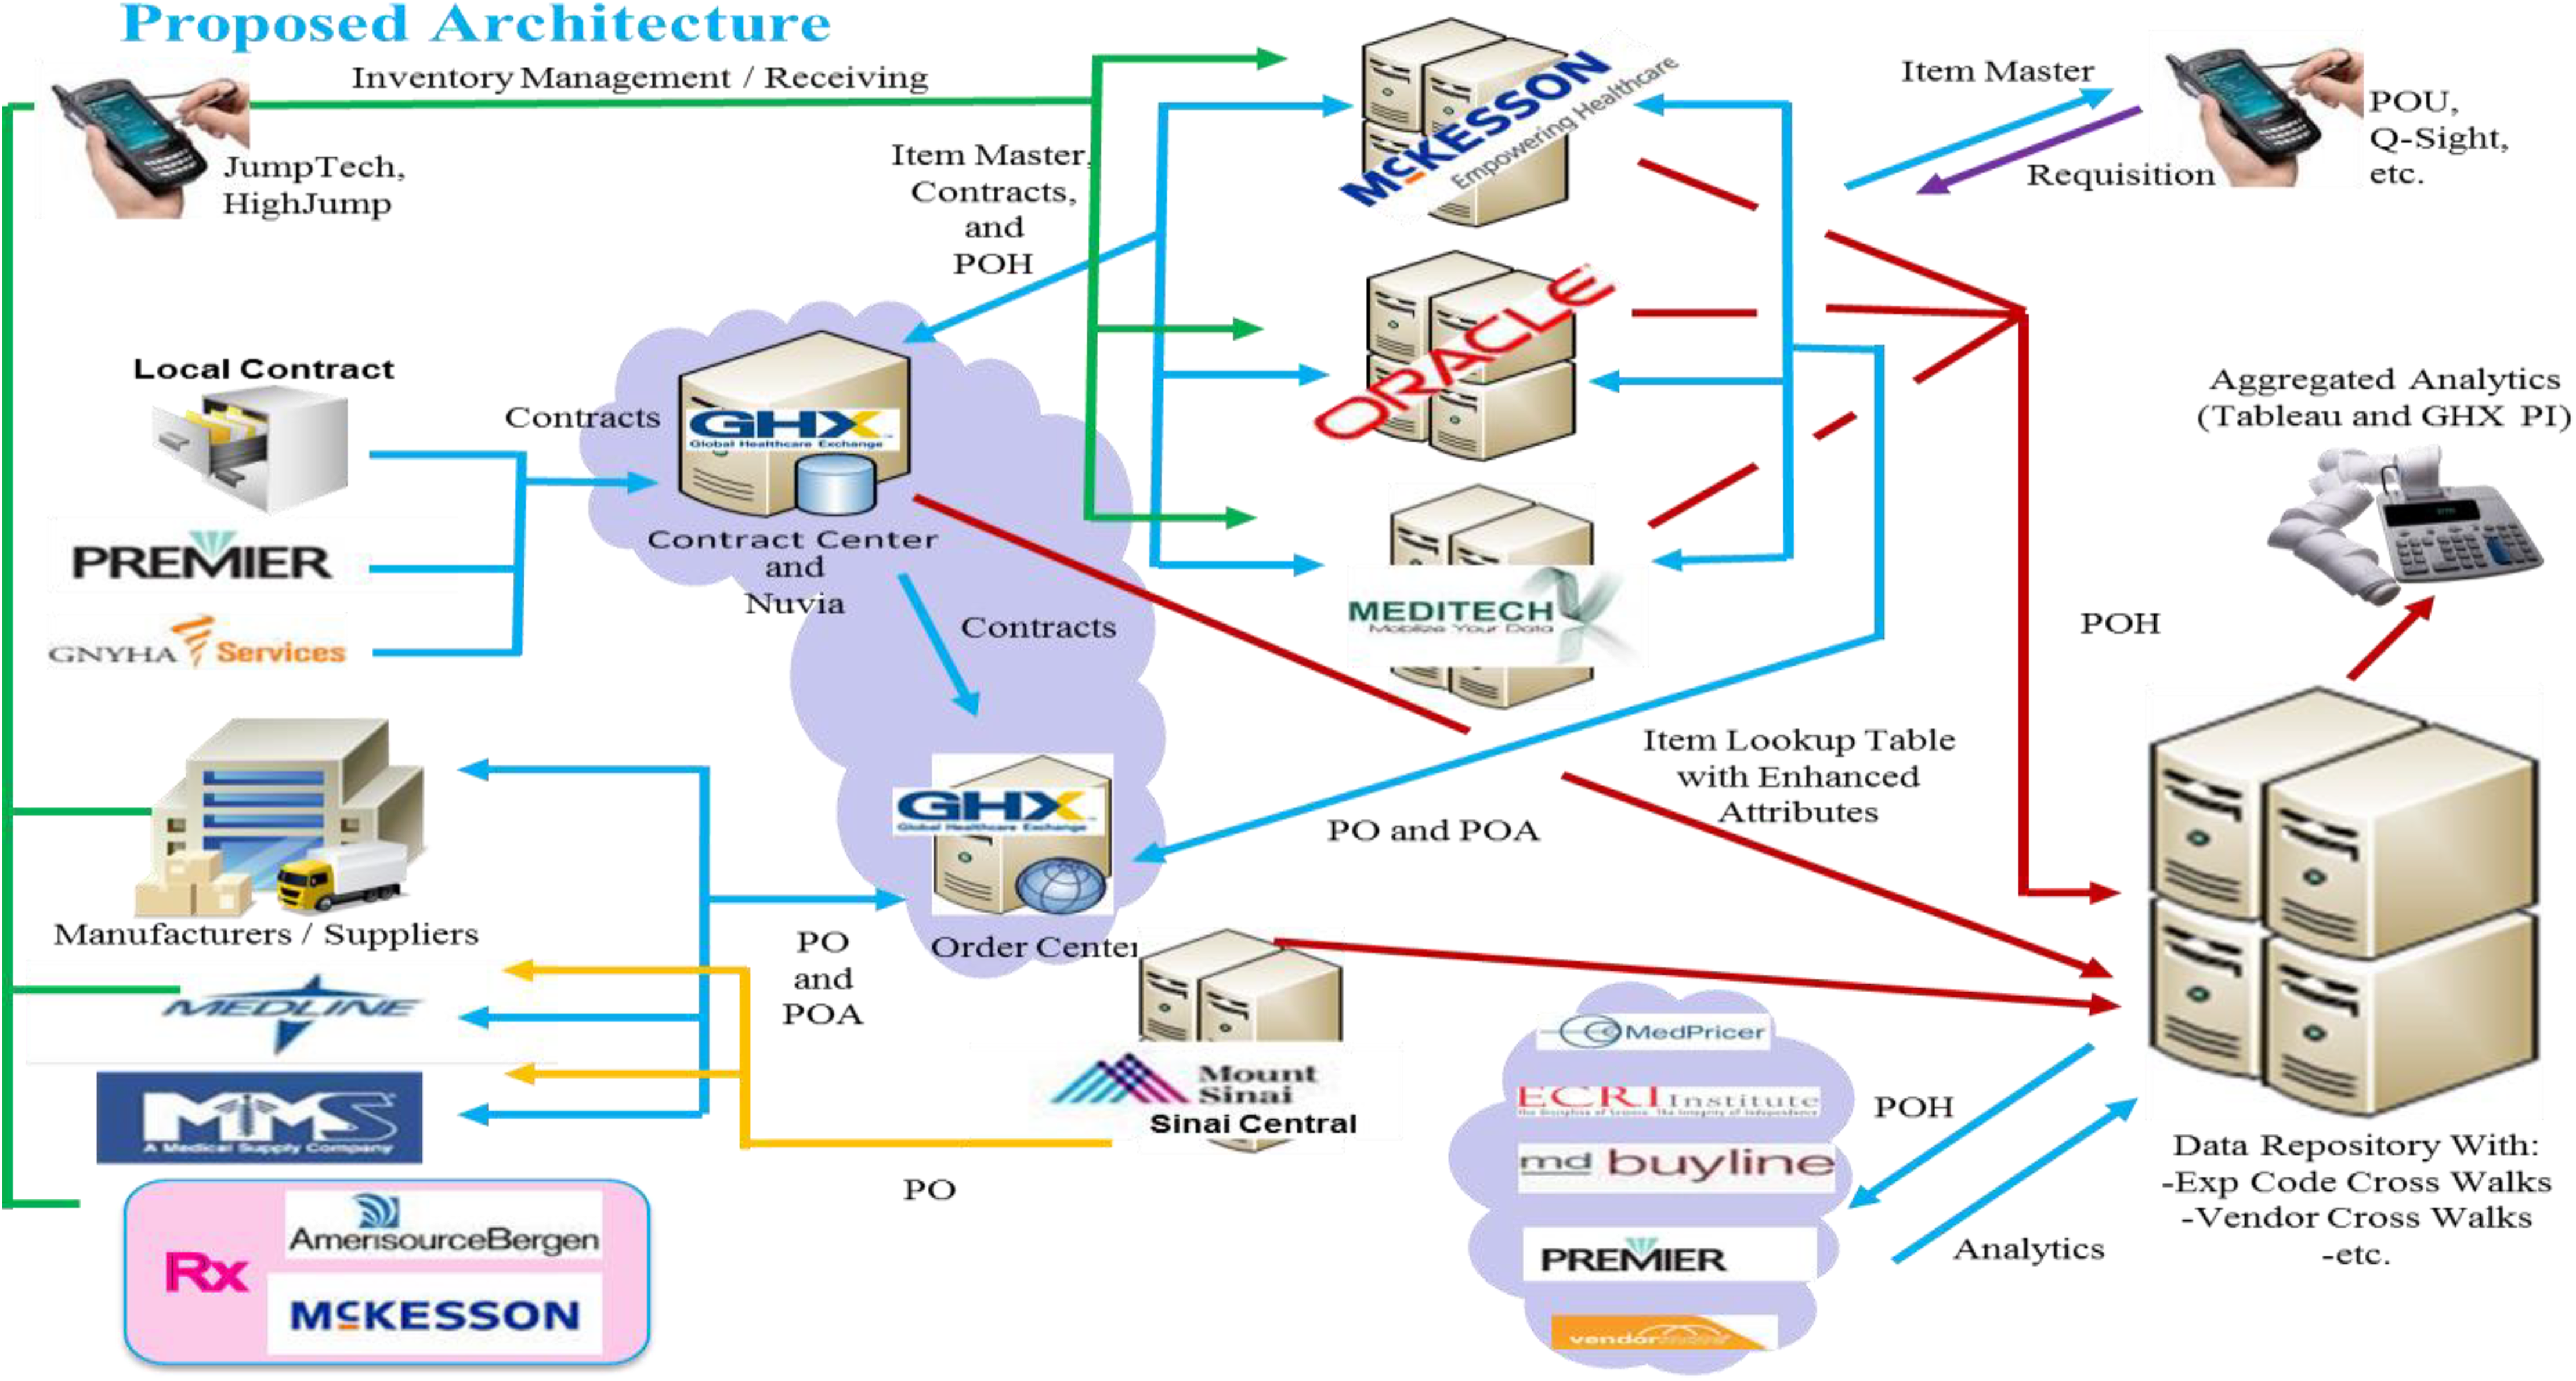
Information system components in healthcare. POA: Purchase Order Authorization, POH: PO History.
In collecting price data for comparison across similar items in each of the different hospitals, we utilized SCWorx, a data cleansing software provider that collects data from each hospital’s central data repository (the item master), cleanses it, and stores the data in a centralized database. The item master is a large database that resides in every hospital’s materials management system (MMS) and contains the prices, item numbers, purchased volumes in inventory, etc. for major products acquired by the healthcare provider. It contains procurement and related core information for standardization and value analysis effort (Handfield et al., 2010). In most hospitals, unfortunately, item masters are at least 30% inaccurate. This is due to the fact that item masters, in general, were constructed to support product replenishment, rather than to act as the primary source of data integrity for product costs and pricing (GHX, 2016). However, by working with a third party we ensured the data allowed comparison of prices on an “apples to apples” basis. The provider was able to normalize and standardize data in the item master data using a proprietary set of algorithms for comparing like items with different SKU names or codes. This approach yielded a common, enriched, standardized set of data on prices that could be effectively used as a basis for comparison across our sample. The units of analysis in each case were similar items in similar clinical purchase categories, nested within each hospital.
Analysis
Within these three hospitals, our research analysis examined several issues pertaining to the market forces posited to exist between buyers and suppliers in several different markets. Our analysis examined, first, the variation in pricing of standard “commodity-like” products, which are most often recognized as being suitable for price leveraging. We examine the variation in price for standard items, nested across the three different hospitals, as well as the differences in pricing patterns derived from similar suppliers across the sample for healthcare products. Multiple discussions with the physicians, nurses, and supply chain executives at each site resulted in an improved understanding of why such variation in pricing was occurring. 3 In addition, we compared price variations across the following attributes: product type (commodity or physician preference), product attributes (commodity or physician preference), hospital demographics, and type of hospital. This analysis ties back to our initial proposition, exploring whether product prices result in lower prices for hospitals with greater volumes. Using specific categories of “commodity items” and “physician preference items,” price patterns were analyzed based on the product type and attribute, hospital type, size, and geographic location.
Product type
Healthcare products can be categorized on a spectrum, but the two end points can be characterized as commodity products on one end and physician preference items (PPIs) on the other. Commodity products represent those products which are primarily bulk-ordered and low-priced by hospitals, examples of which include drapes, surgical gauze, syringes, and needles (of different dimensions). PPIs include products that are ordered by hospitals at the recommendation of physicians. These refer to items such as prosthetic implants, knee/hip replacements, and other items that are higher priced and unique to patients based on size. Doctors typically order such items based on their affinity toward them (Welch and Handfield, 2015).
Since the usage of PPIs is driven by physicians who choose the product specific to each patient’s needs, prices are typically determined through negotiation between the hospital administrator and the representative of the product’s manufacturer, based on a forecasted order quantity. Since there is no catalog of manufacturers, and the purchase of the product can be bought only from the manufacturer directly, the physician chooses to do this on a case by case basis. In addition, since PPIs are often accompanied by service representatives, the cost to serve may be higher for smaller hospitals, and the market forces of volume may not be as great.
Depending on the hospital’s buying power, the manufacturer may hold the inventory of the item at the hospital, and when the purchase is made the physician takes the medical product from the shelf and implants it into the patient, resulting in a “consignment” arrangement.
When a GPO is buying a PPI item, they may be able to provide greater volume discounts when they purchase on behalf of multiple hospitals. As noted here, however, the issue is whether members can conform to contracts stipulating the minimum quantity of orders needed to qualify for a discount. This issue, called “contract compliance,” has been a problem for many years within hospitals. The issue arises because physicians are more likely to select the items they want, based on their own preferences. These preferences may also be influenced by manufacturers, who provide free trips and vacations to physicians, or speaker fees as “thought leaders” (Hu et al., 2012; Johnston and Rooney, 2012; Pettigrew et al., 2013).
Product attributes
Every product (whether a commodity or a PPI) can be further segregated into other categories based on a multitude of factors. We classified products first by item attributes (drapes, gloves, sterile gauze, etc.) and second by additional attributes such as reusable/one-time use only, material used, dimensions, packaging unit, etc. All of these factors can further impact the price of the product. Carrying many types of a given item will increase the degree of choice from the patients’ perspective. Based on interviews with healthcare subject matter experts at these hospitals, we recognized the importance of input from physicians who can evaluate the pros and cons of each product and select the type and attributes required, which leaves procurement team members to negotiate potential cost savings and risks for the item. Physician input is deemed to be a critical part of the buying decision process, yet buyers who buy off GPO contracts often fail to elicit their input on these decisions (Handfield, 2013; Schneller and Smeltzer, 2006).
Hospital type
Based on the size of hospitals, the demand (volume) for healthcare products varies. Larger hospitals (bed size 500+), hospital chains, and integrated distribution networks 4 (IDNs) can leverage their volume of purchases to negotiate better prices with manufacturers/suppliers, whereas smaller hospitals do not possess these advantages. Additionally, teaching hospitals often utilize a greater variety of items purchased in smaller volumes. This is likely due to the teaching faculty that are encouraged to vary their clinical preferences to try new products as they emerge (Handfield, 2014; Welch and Handfield, 2015). As a result, teaching hospitals in many cases do not enjoy a high-volume quantity leverage in negotiating prices.
Logistical information
Though not always a factor, the distance between the supplier and the hospitals may in part determine the price of products, as transportation costs may impact contract negotiations when bundled with pricing.
GPO contract information
GPOs use volume and compliance metrics to negotiate prices with hospitals. (Compliance refers to the degree to which physicians use products that are “on-contract” with GPOs, which allow them to buy in larger quantities and obtain discounts.) In our analysis, we therefore quantified the compliance level required for volume discounts, to assess the impact of these parameters on prices negotiated by hospitals.
Demographics
Additional demographics that can play a part in determining the price of the product are the location of the hospital (rural/urban), socio-economic factors which can provide information regarding the patients who visit the hospital, and the impact they have on the hospital negotiating contracts.
The analysis was conducted by collecting transactional level data over the course of 15 months from 3 hospitals (referred to generically as University Teaching Hospital, large Urban Hospital, and Midsize Hospital). The transactional data captured the following relevant information used in the subsequent ordinary least squares (OLS) regression analysis that followed: date of purchase; quantity (EA and packaging unit); price (of EA, packaging unit) and cost of order; product information (product name, type, attributes, etc.); and manufacturer and distributor/supplier.
Transactional data from actual invoices was captured from the procurement departments of the various hospitals. The primary identification parameters for each entry are the invoice numbers and catalog ID which was unique for each product. The backend database collector then performed data cleansing to ensure that the right product was matched with the right catalog ID using a consolidated item master. This step was needed because of the many erroneous or duplicate product IDs found in hospital databases. Due to the nature and size of the data, the large data files for the three hospitals analyzed were combined into a single data file, which was then fed into both SAS and Tableau for performing statistical analysis and creating various visualizations of the data.
Data was consolidated based on the above information. The lack of uniformity in the hospital data required standardization and normalization of the data. We normalized the price data to a mean of zero and a standard deviation of 1 by category, and performed analysis of variance (ANOVA) to determine whether price variations were explained by any of the different attributes identified by our study. This kind of scaling is useful when the dataset contains outliers (anomalies).
Results
High-volume products are classified as “commodity items,” and the high-spend products are those we have classified as “physician preference items.” The latter category includes those clinical items that are often selected by physicians, including stents, knee replacements, OR supplies, etc. In each case, we sought to explore whether the independent variables most often discussed in healthcare economics varied with the price of products in a stable functioning market. We assumed in each case that this relationship was occurring due to the volume discounts of hospitals and the associated GPO agreements illustrating market forces at work.
In exploring this question, we analyzed the products in the commodity and physician preference product categories separately. Overall, the analysis was performed controlling for the size of the hospital measured in beds, and the type of the hospital whether urban or semi-urban.
Analysis of commodity items
OLS regression model
Our hypothesis was explored using an OLS regression model that sought to control for predictors of pricing variation in healthcare markets (see Table 2). The predictor variables included quantity orders, UNSPSC code of item, vendor/supplier, and manufacturer impact on price. The price-quantity hypothesis would predict that with larger order quantities, fewer suppliers and commodity items would explain the price variation. The residual plot indicates that the predictor variables are highly skewed, and the model is not a good fit to the data. This would again suggest that there is no relationship among these variables.
To further analyze the variation of prices in commodity items, we first identified three representative products that are pure commodities and ordered in large bulk quantities (n = 3000 SKUs): gloves; drapes; and cotton gauze.
In a functioning market, prices for commodity items are always driven by market factors related to raw material prices, demand, supply, market events, etc. Analysis of the commodities shows that prices do not follow any of the standard market drivers. The only market dynamics that these products exhibit is the trend of having one or two top suppliers per hospital for these products.
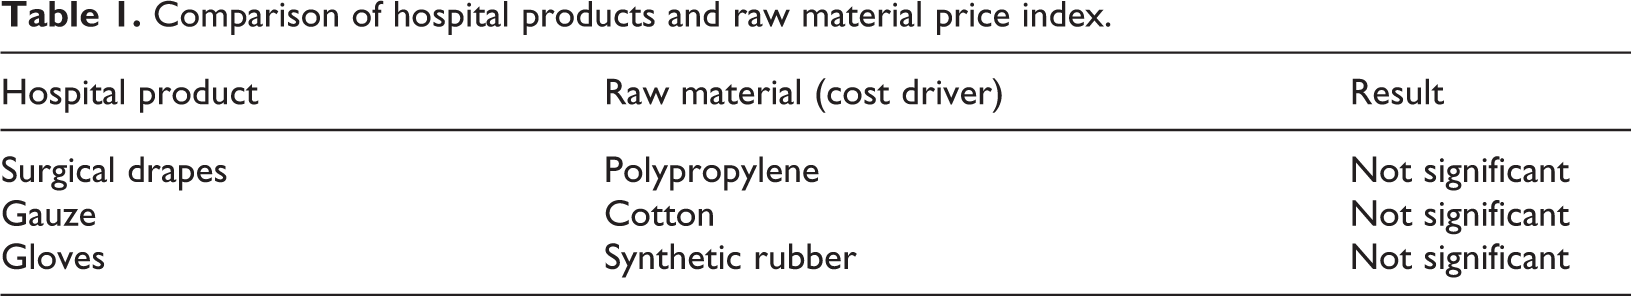
We then compared the historical prices for each of these commodity items to the price of the primary raw materials during the same period. As shown in Table 1, we found no significant relationships between the drapes and polypropylene index, the gauze and cotton index, and the gloves and rubber index. In these analyses, we used the price indices for synthetic rubber, polypropylene, and cotton from the US Bureau of Labor Statistics (BLS.gov) and Federal Reserve Economic Data (fred.stlouisfred.org) during the same period. Theoretically, there should be equivalent lags between the BLS indicators and prices, since they are both subject to lags. The BLS indicator is a function of prices paid by buyers. However, we also used a six-month lag between the BLS indicator and prices to be sure, and also found no relationship. Evidence of the lack of relationship can also be clearly seen in the time series analysis showing the price of these products (aggregated across all three hospitals), and the producer price index of the primary raw material cost during the same period. Further visual analysis of the pricing trends indeed produced no additional insights into possible relationships. For example, the prices of drapes (for the exact same product category) vary significantly across all three locations and do not co-vary with respect to the price of polypropylene (Figure 5). Similarly, the price of gauze spiked for no apparent reason at the University Teaching Hospital in May 2016, and did not co-vary with the price index for cotton (Figure 6). Finally, although the price of synthetic rubber shown in Figure 7 increased significantly during the period of analysis (December 2015 to September 2016), no apparent relationship was found between the price of gloves. The top suppliers by hospital are shown in Figure 8. In addition, OLS regression coefficients showing the relationship between volume and price were all non-significant (Table 2). Although these analyses alone cannot be considered as conclusive evidence of the lack of apparent covariation trends between healthcare commodity items, volume, and raw material price indices, the lack of any type of relationship is typical of what we find in most hospitals.
Comparison of hospital products and raw material price index.
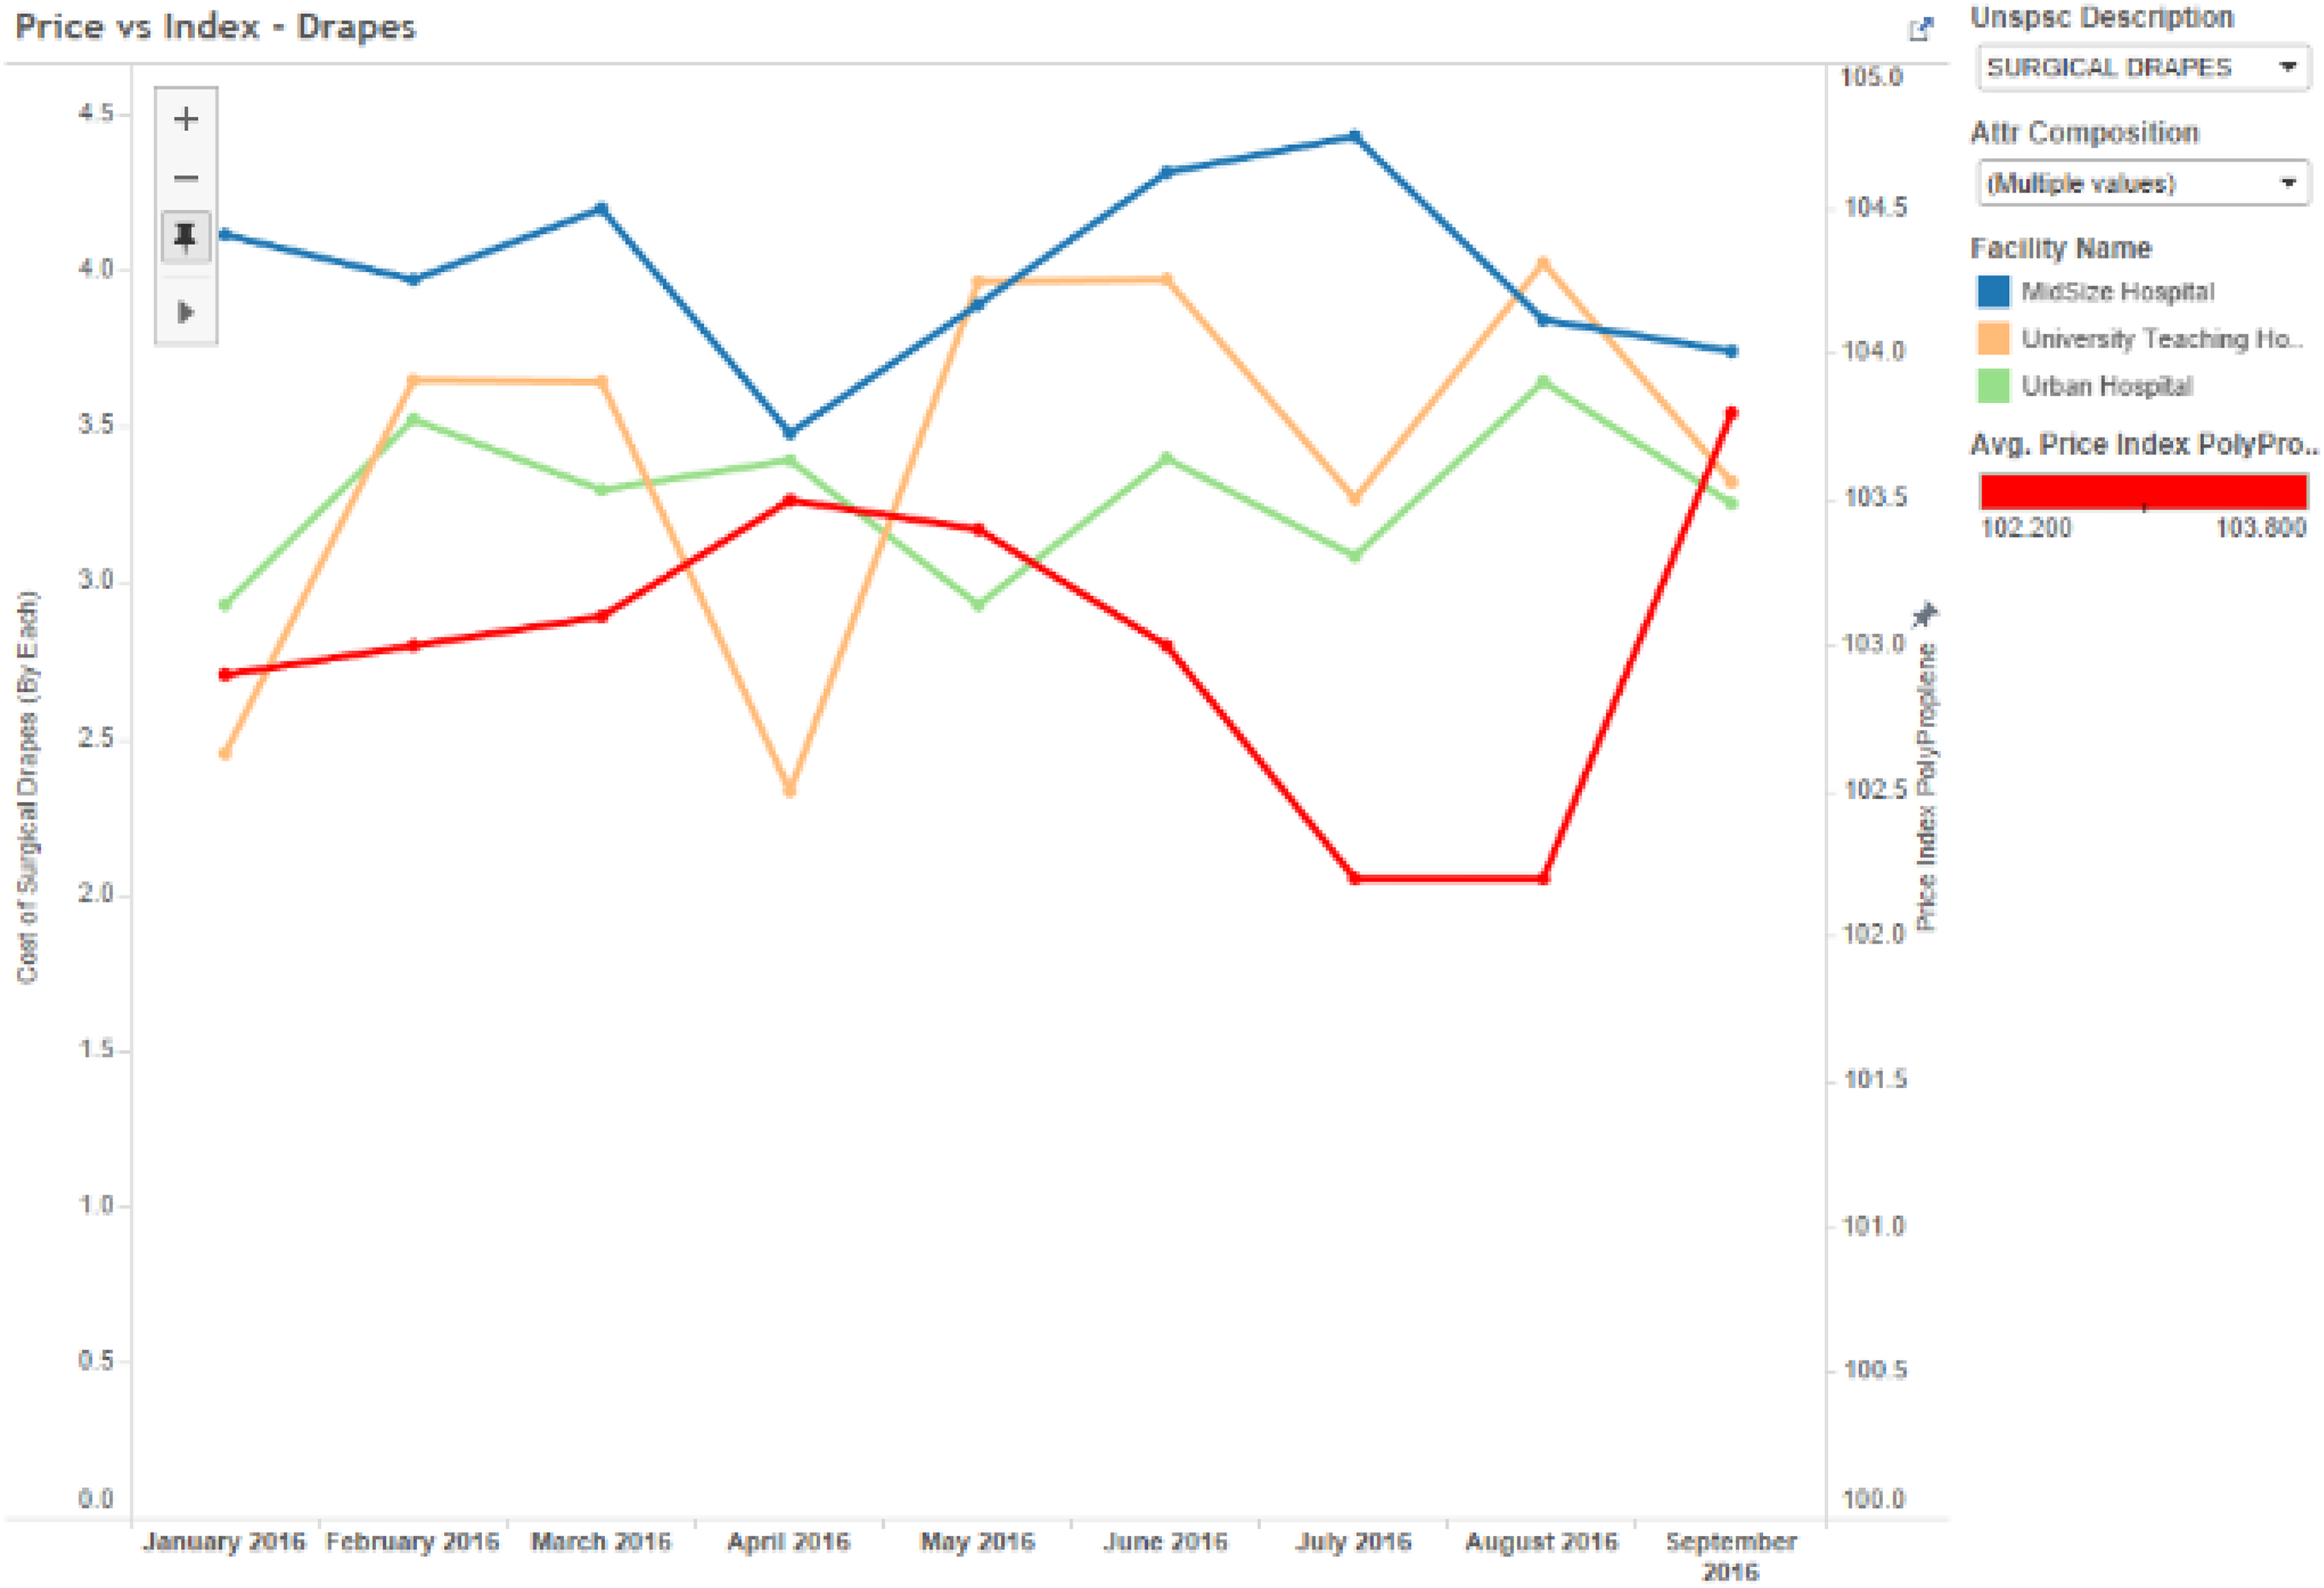
Drapes price vs polypropylene price index (n = 3000).
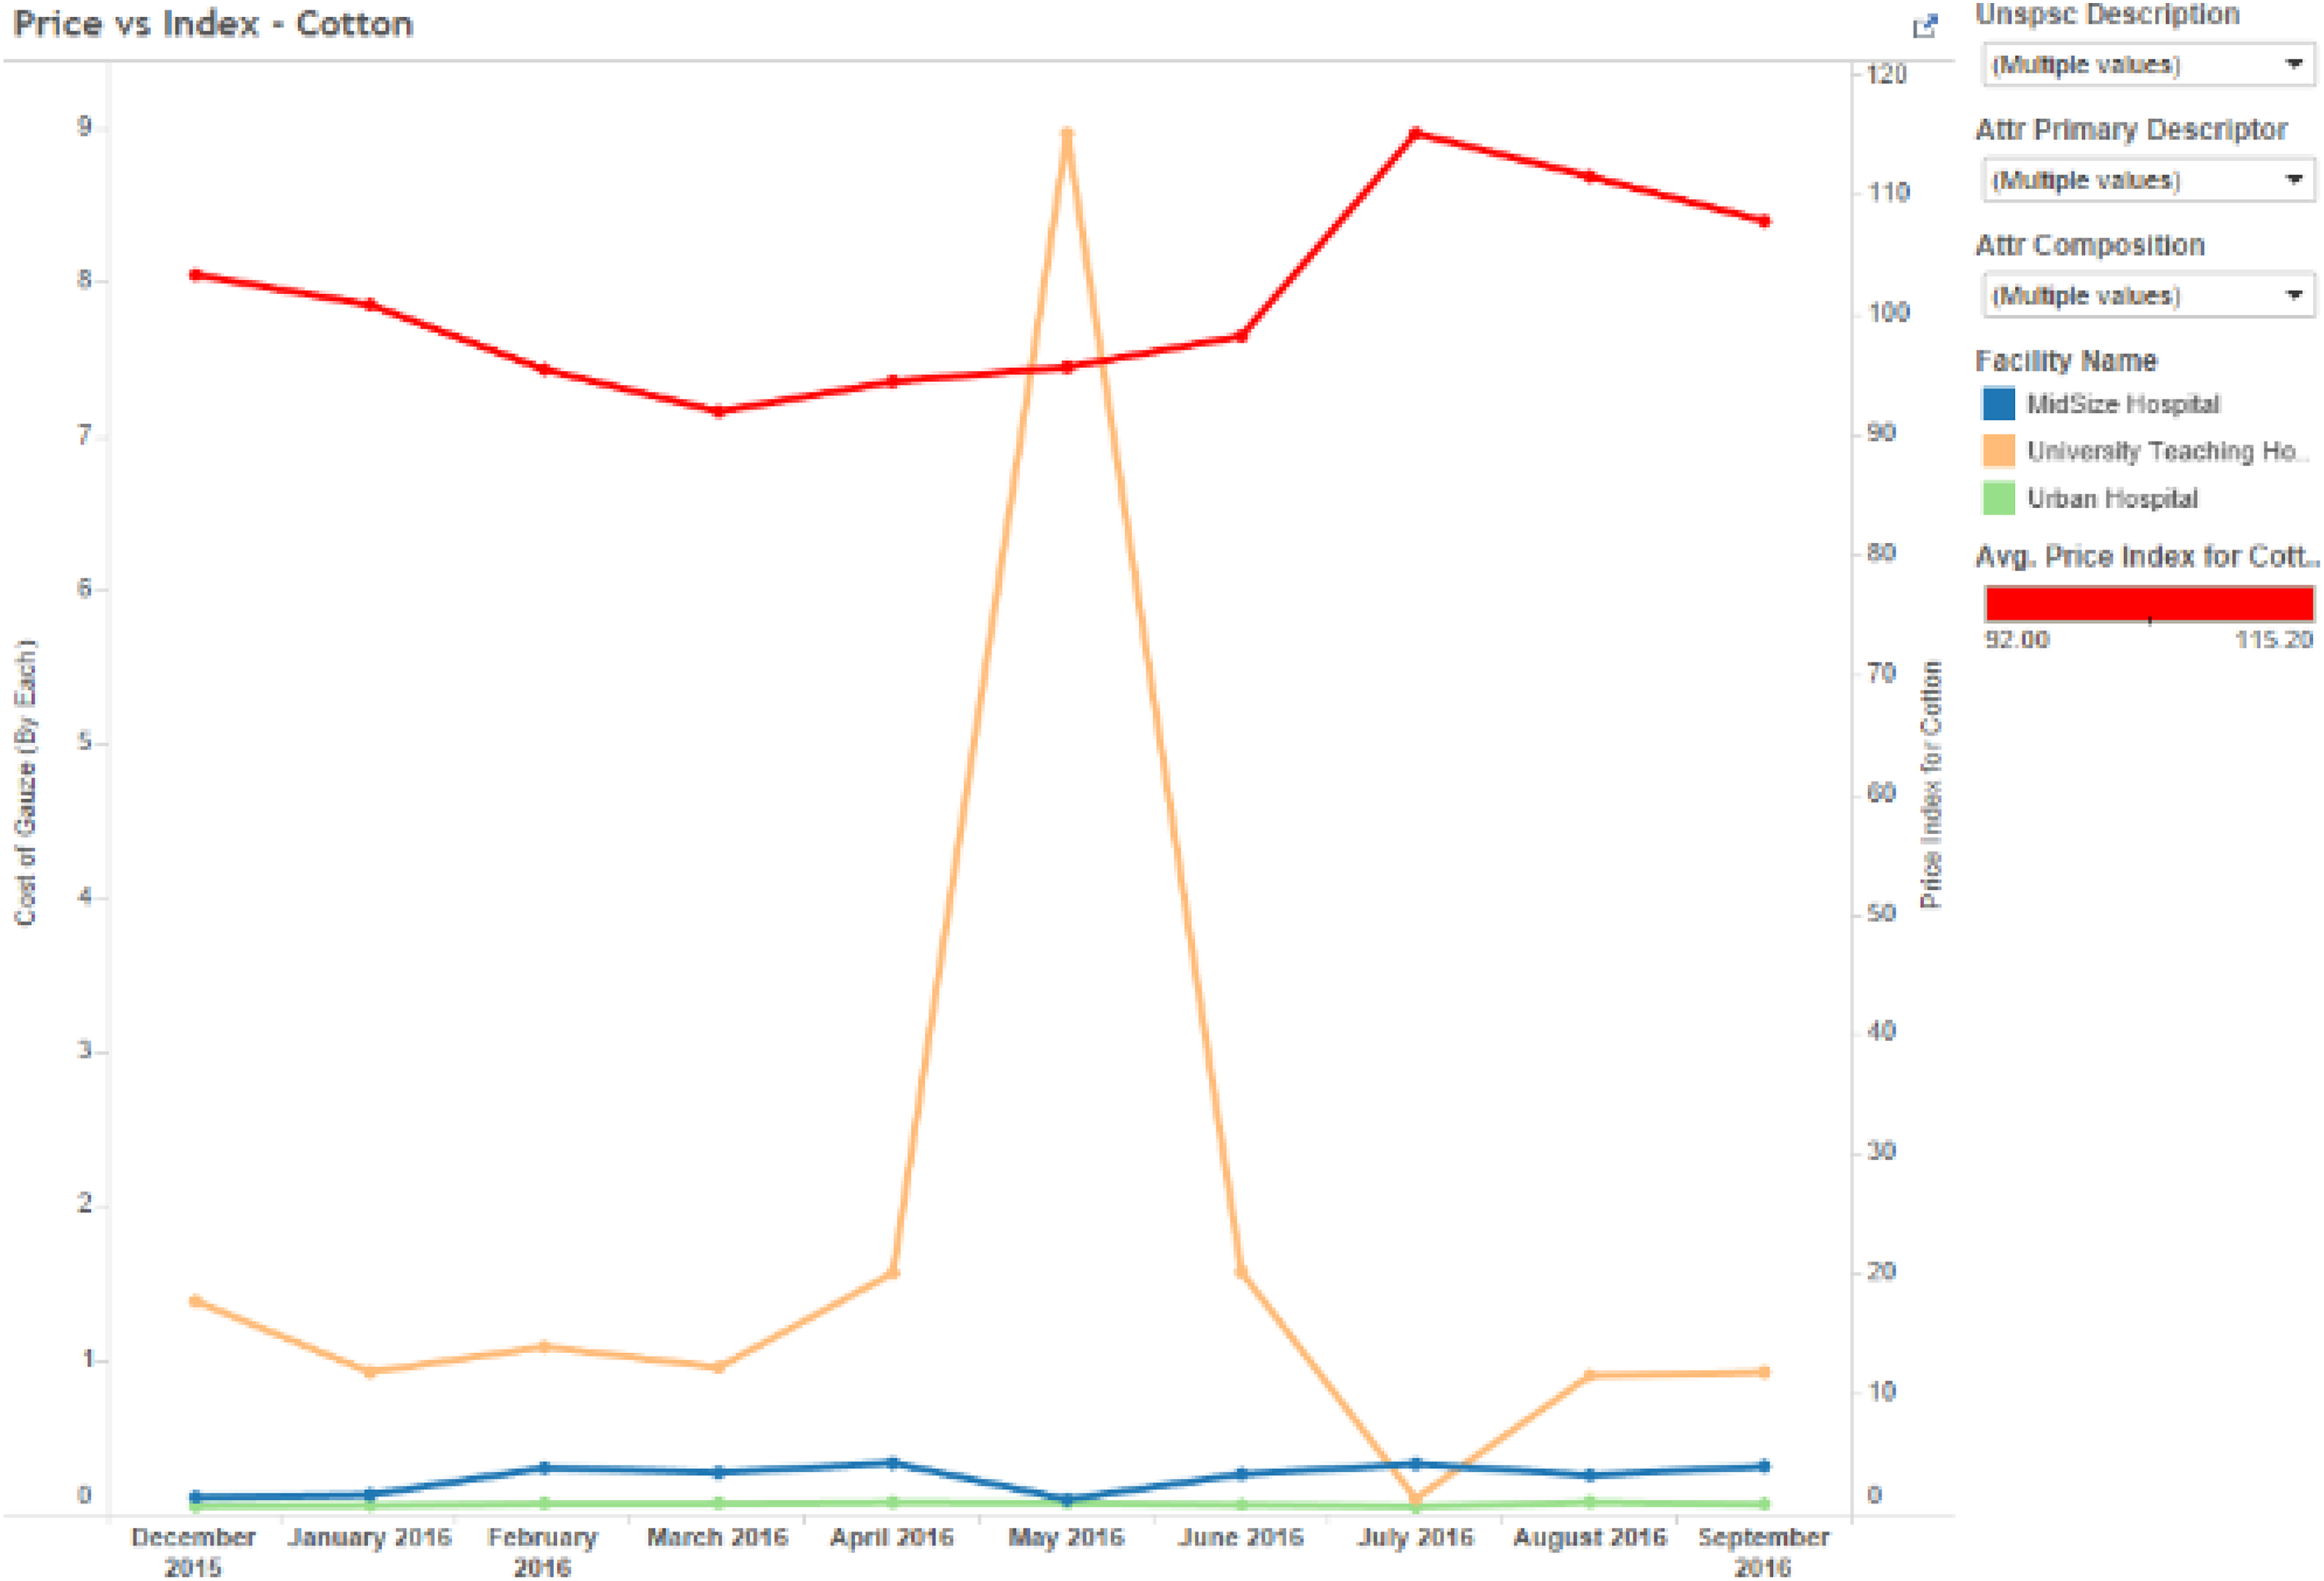
Gauze price vs cotton price index (n = 3000).
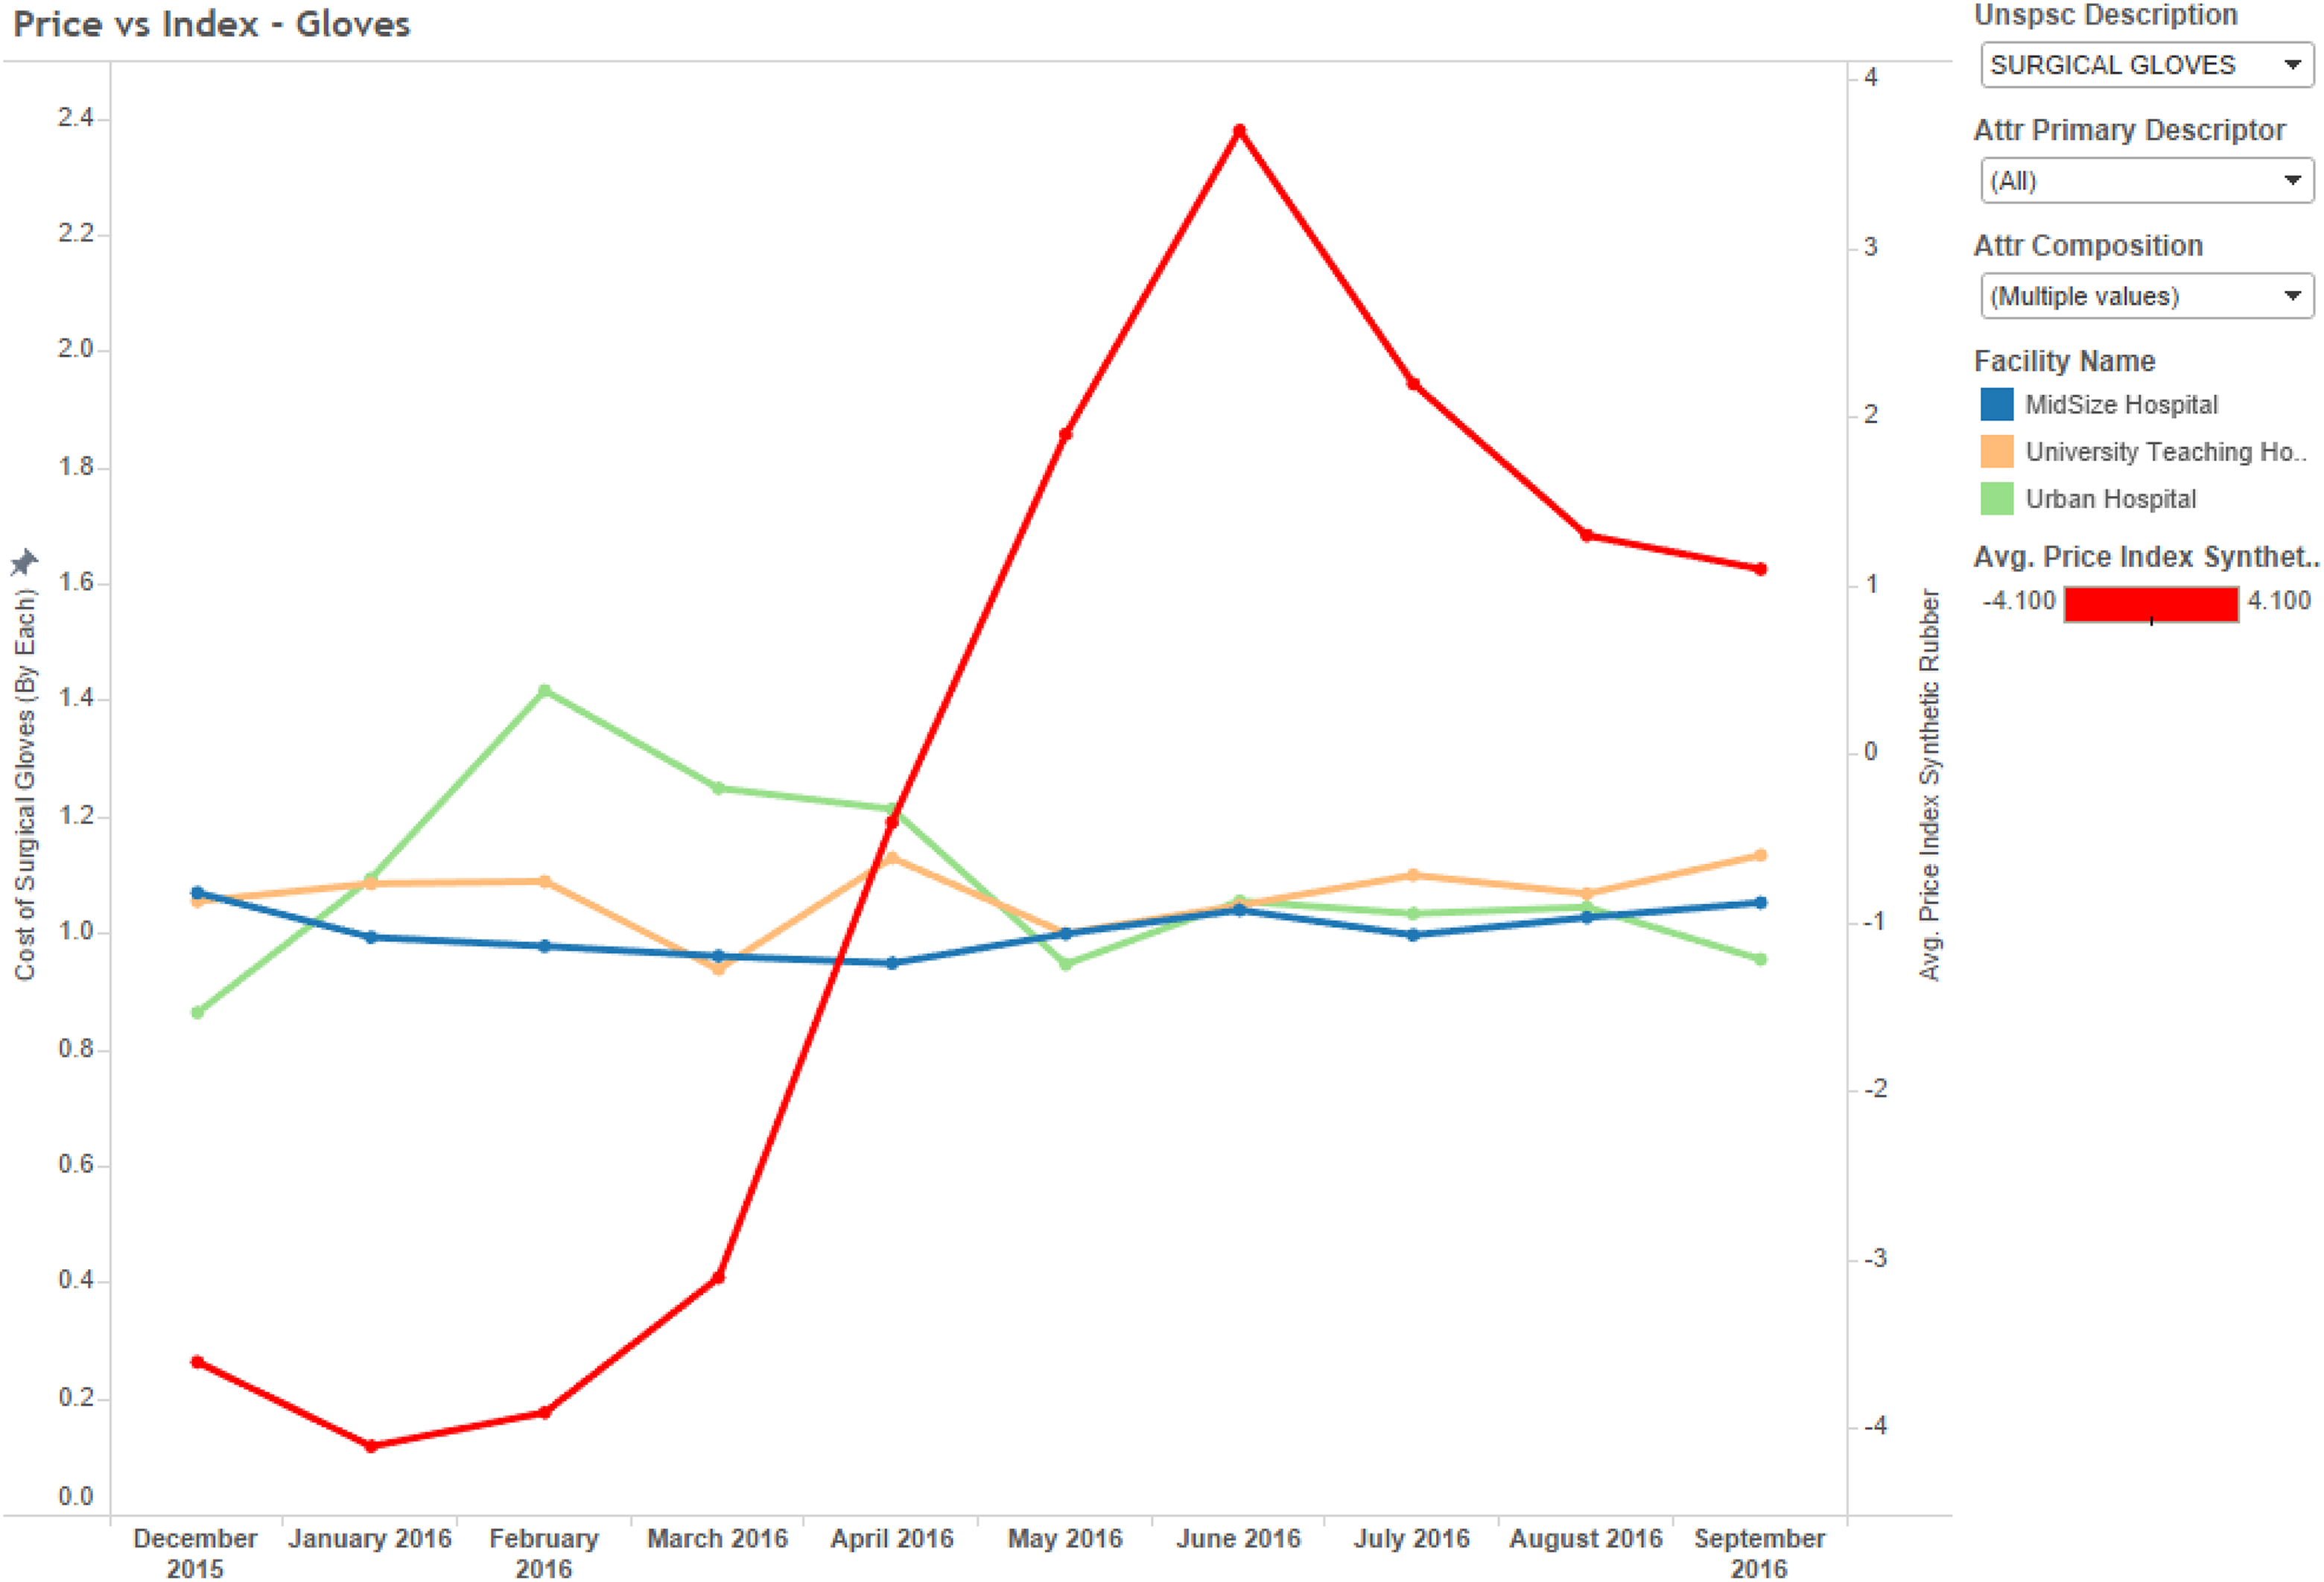
Glove price vs synthetic rubber price index (n = 3000).
Top suppliers by spend in hospitals for selected commodity items.
OLS regression model results of factors impacting price (n = 3000).
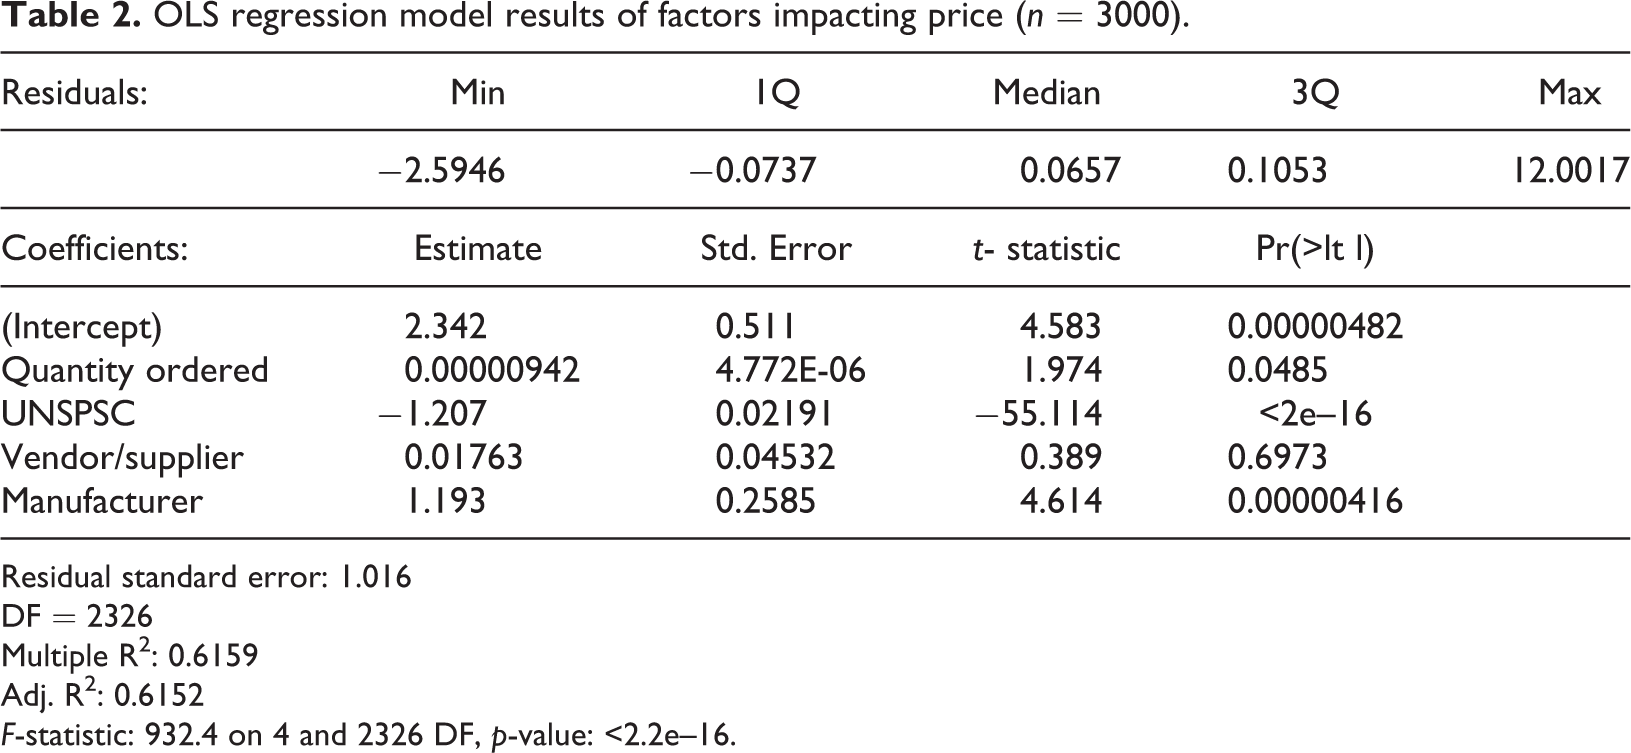
Residual standard error: 1.016
DF = 2326
Multiple R2: 0.6159
Adj. R2: 0.6152
F-statistic: 932.4 on 4 and 2326 DF, p-value: <2.2e–16.
Further analysis also explored price variation across suppliers and hospitals, but there appeared to be no significant trend in the data (Figures 9 through 11). Indeed, it seems like hospital pricing varies across suppliers, across hospitals, and across items. In analyzing the data, it was found that the hospital size and type had some relationship with positive and negative increases in price. Specifically, it was observed that in the University Teaching Hospital of about 400–500 beds, the volume of demand for all categories of clinical supplies was lower than for the Large Urban Hospital and could explain some price variation from suppliers. This occurs through negotiation of discounts and rebates by hospitals to the suppliers. Figure 10 shows a single comparison for examination gloves provided by Medline Industries for the three hospitals. In this chart, it is clear that the Large Urban Hospital negotiated the best prices for the commodity item, although these prices varied significantly across a one-year period and were never stable. The analysis sought to identify any correlation between the price and volume among prominent suppliers. Even within a single hospital, price variation is observed from different vendors for the same commodity. It was also found that price for a commodity was not related to the volume being ordered.
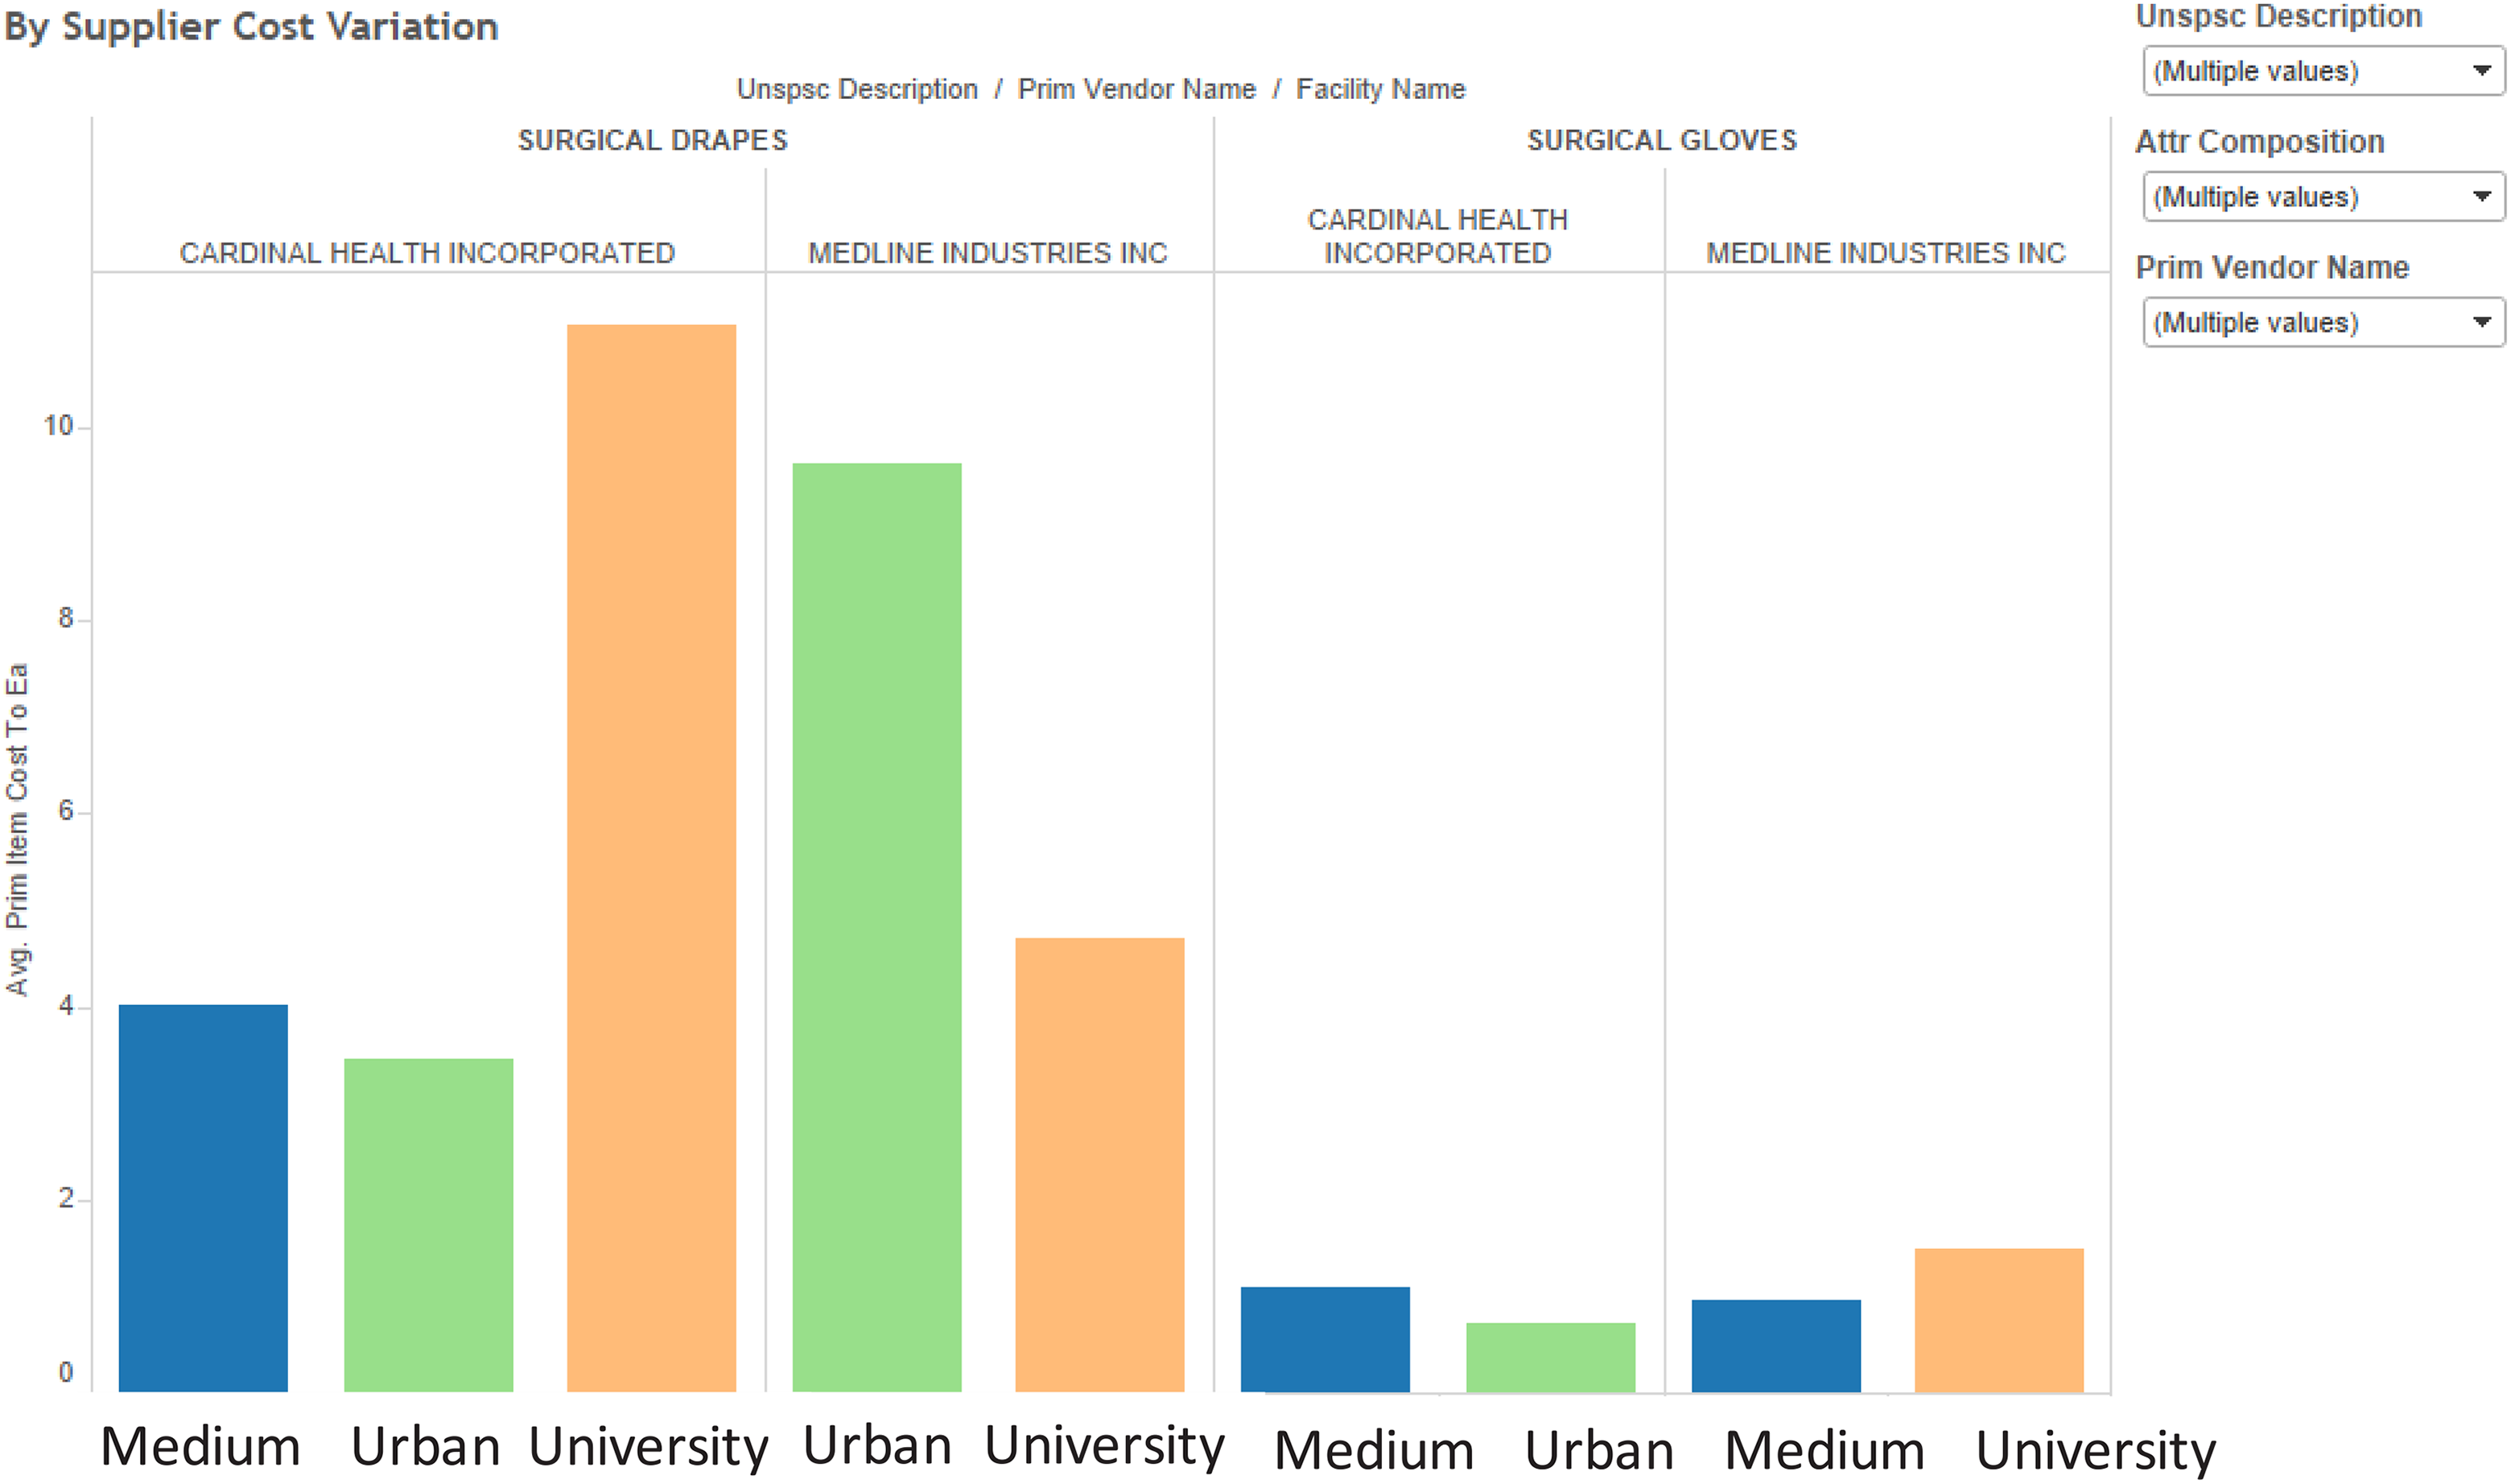
Comparison of average prices for drapes and gloves (n = 3000).
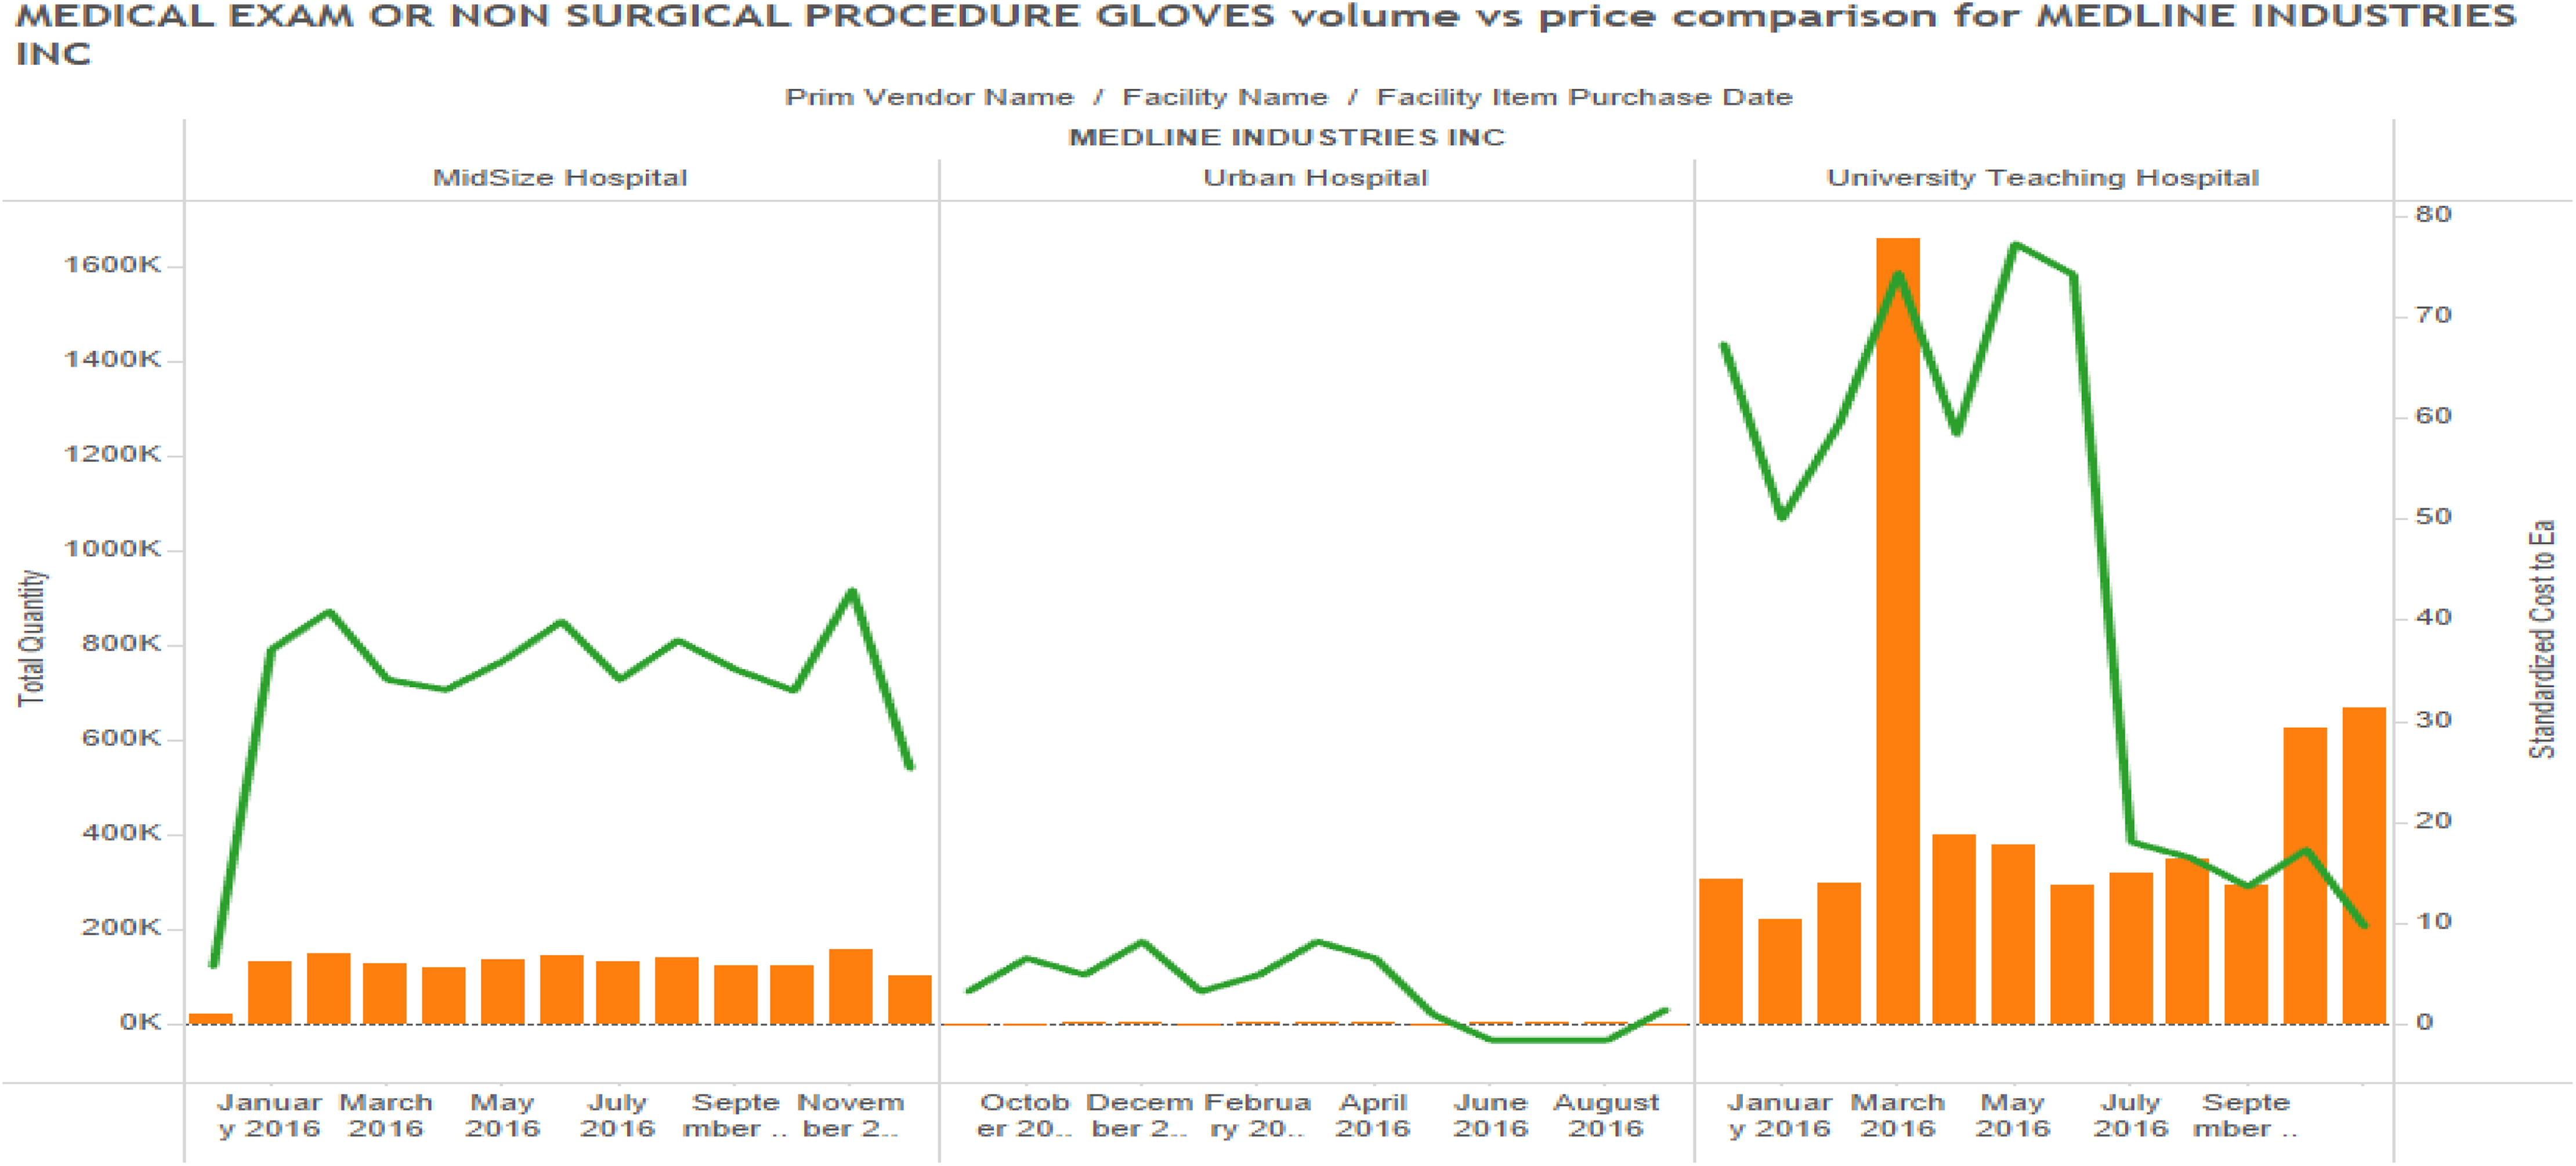
Examination gloves price comparison across facilities (single supplier).
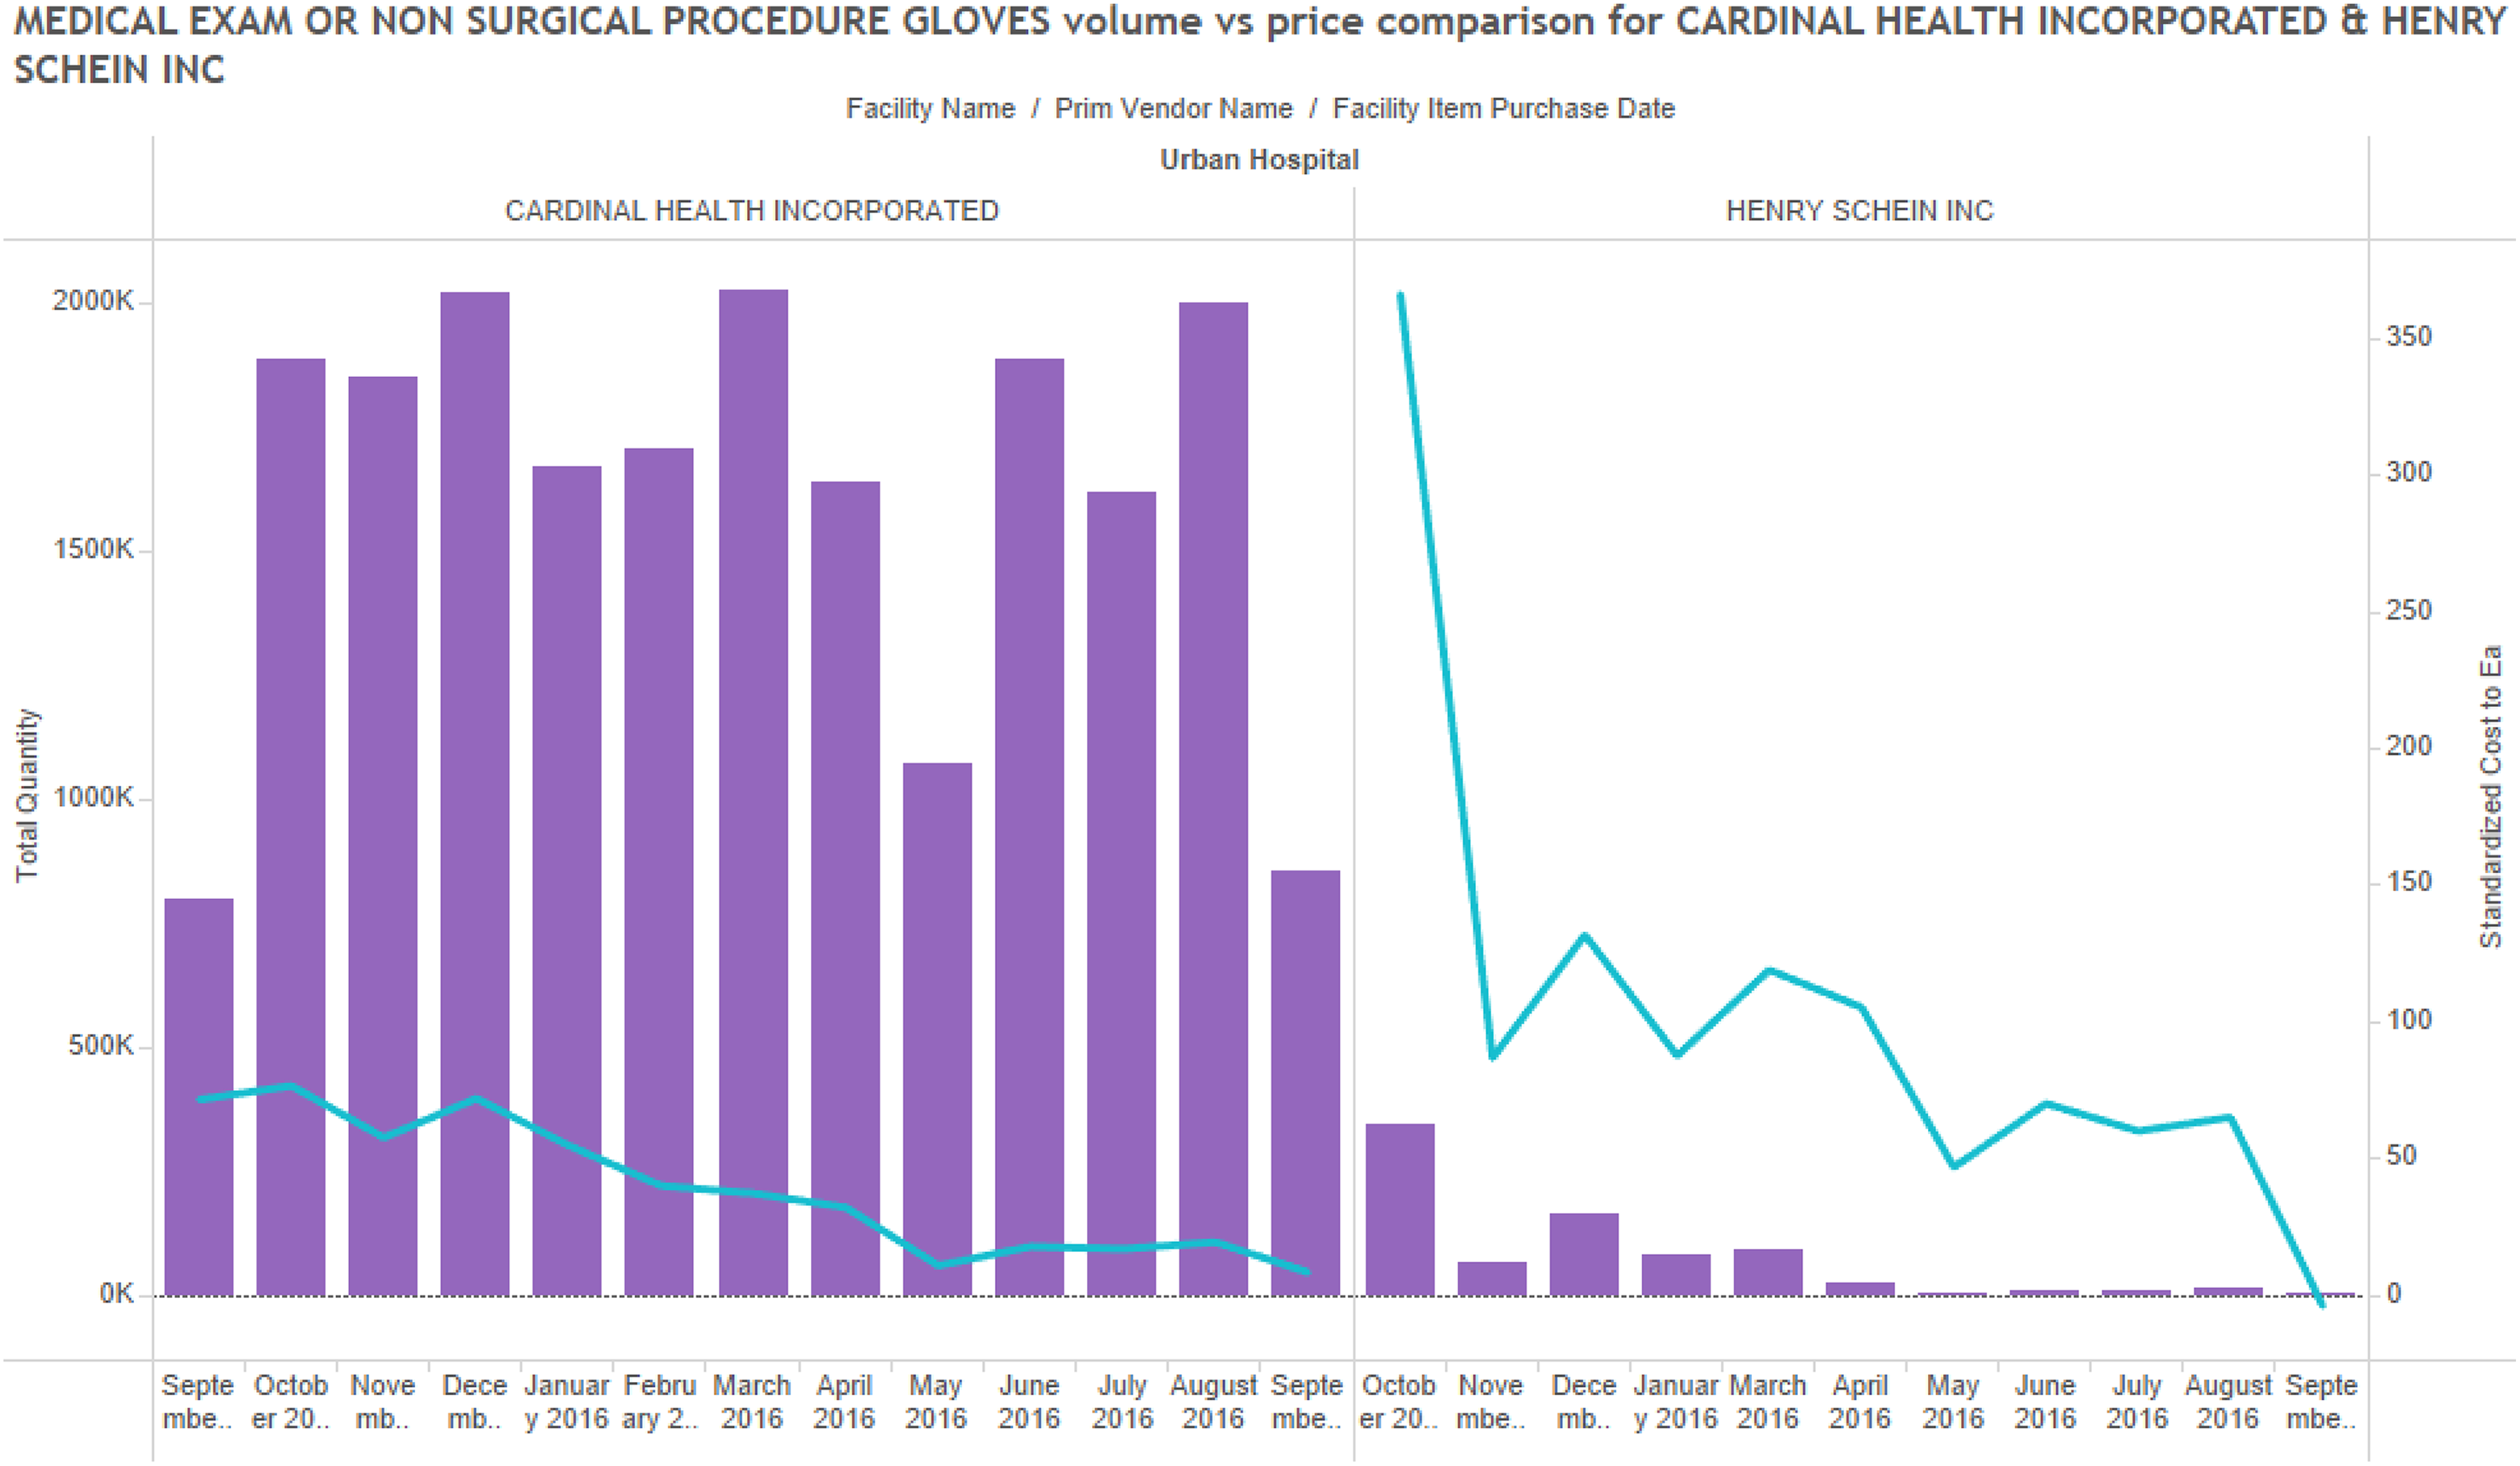
Examination gloves comparison within a single facility.
Discussions with executives and clinicians revealed a similar pattern of confusion arising in working with procurement systems, as suggested by the following comments: Data governance is at the heart of this issue. Healthcare providers need to re-focus their efforts to focus on data as the defining component for building an analytics strategy that leads to better care, cost management, and revenue capture. (SC Analyst, University Teaching Hospital) Without an ability to track clinical materials using a common coding system, there are serious problems that arise. Two of the primary symptoms of a bigger problem include lack of productivity and lack of data, as well as massive waste of materials used in clinical practices. (Physician, Midsize Hospital) I feel very frustrated, because I went into nursing because I wanted to help physicians and patients. However, I am spending more time on the computer searching for items than I am working with patients. Many of our nurses are becoming equally frustrated, and we are seeing many of them quitting because they say they can’t stand working at this job any more, as there is too much computer time spent searching for items in the catalogue. (Nurse, Large Urban Hospital)
Analysis of physician preference items
To analyze the variation of prices in PPIs, three commonly purchased products based on price and volume were considered: hip implants; coronary stents; and patellar implants.
Unlike commodity items, these items are custom produced based on the patient’s needs and the preferences stated by the physician (who may or may not be comfortable with the features of certain of these products). Therefore, we were unable to explain the price variations observed for these items under conventional market norms.
Studies showed that there were definite trends that could be observed among these items as well. Price discrepancies were observed with femoral hip stems, but again this seemed to be unrelated to purchase volumes (Figure 12) across the three hospitals. However, it is possible that minor/specialty suppliers are causing this price variation on a broader level. Delving deeper into University Teaching Hospital, we observed that within the facility, there was no standardizing of prices based on volumes purchased from suppliers (Figure 13). From the observed data, it is evident that there are other factors than prices of PPIs which cannot be easily explained by purchase volumes alone.
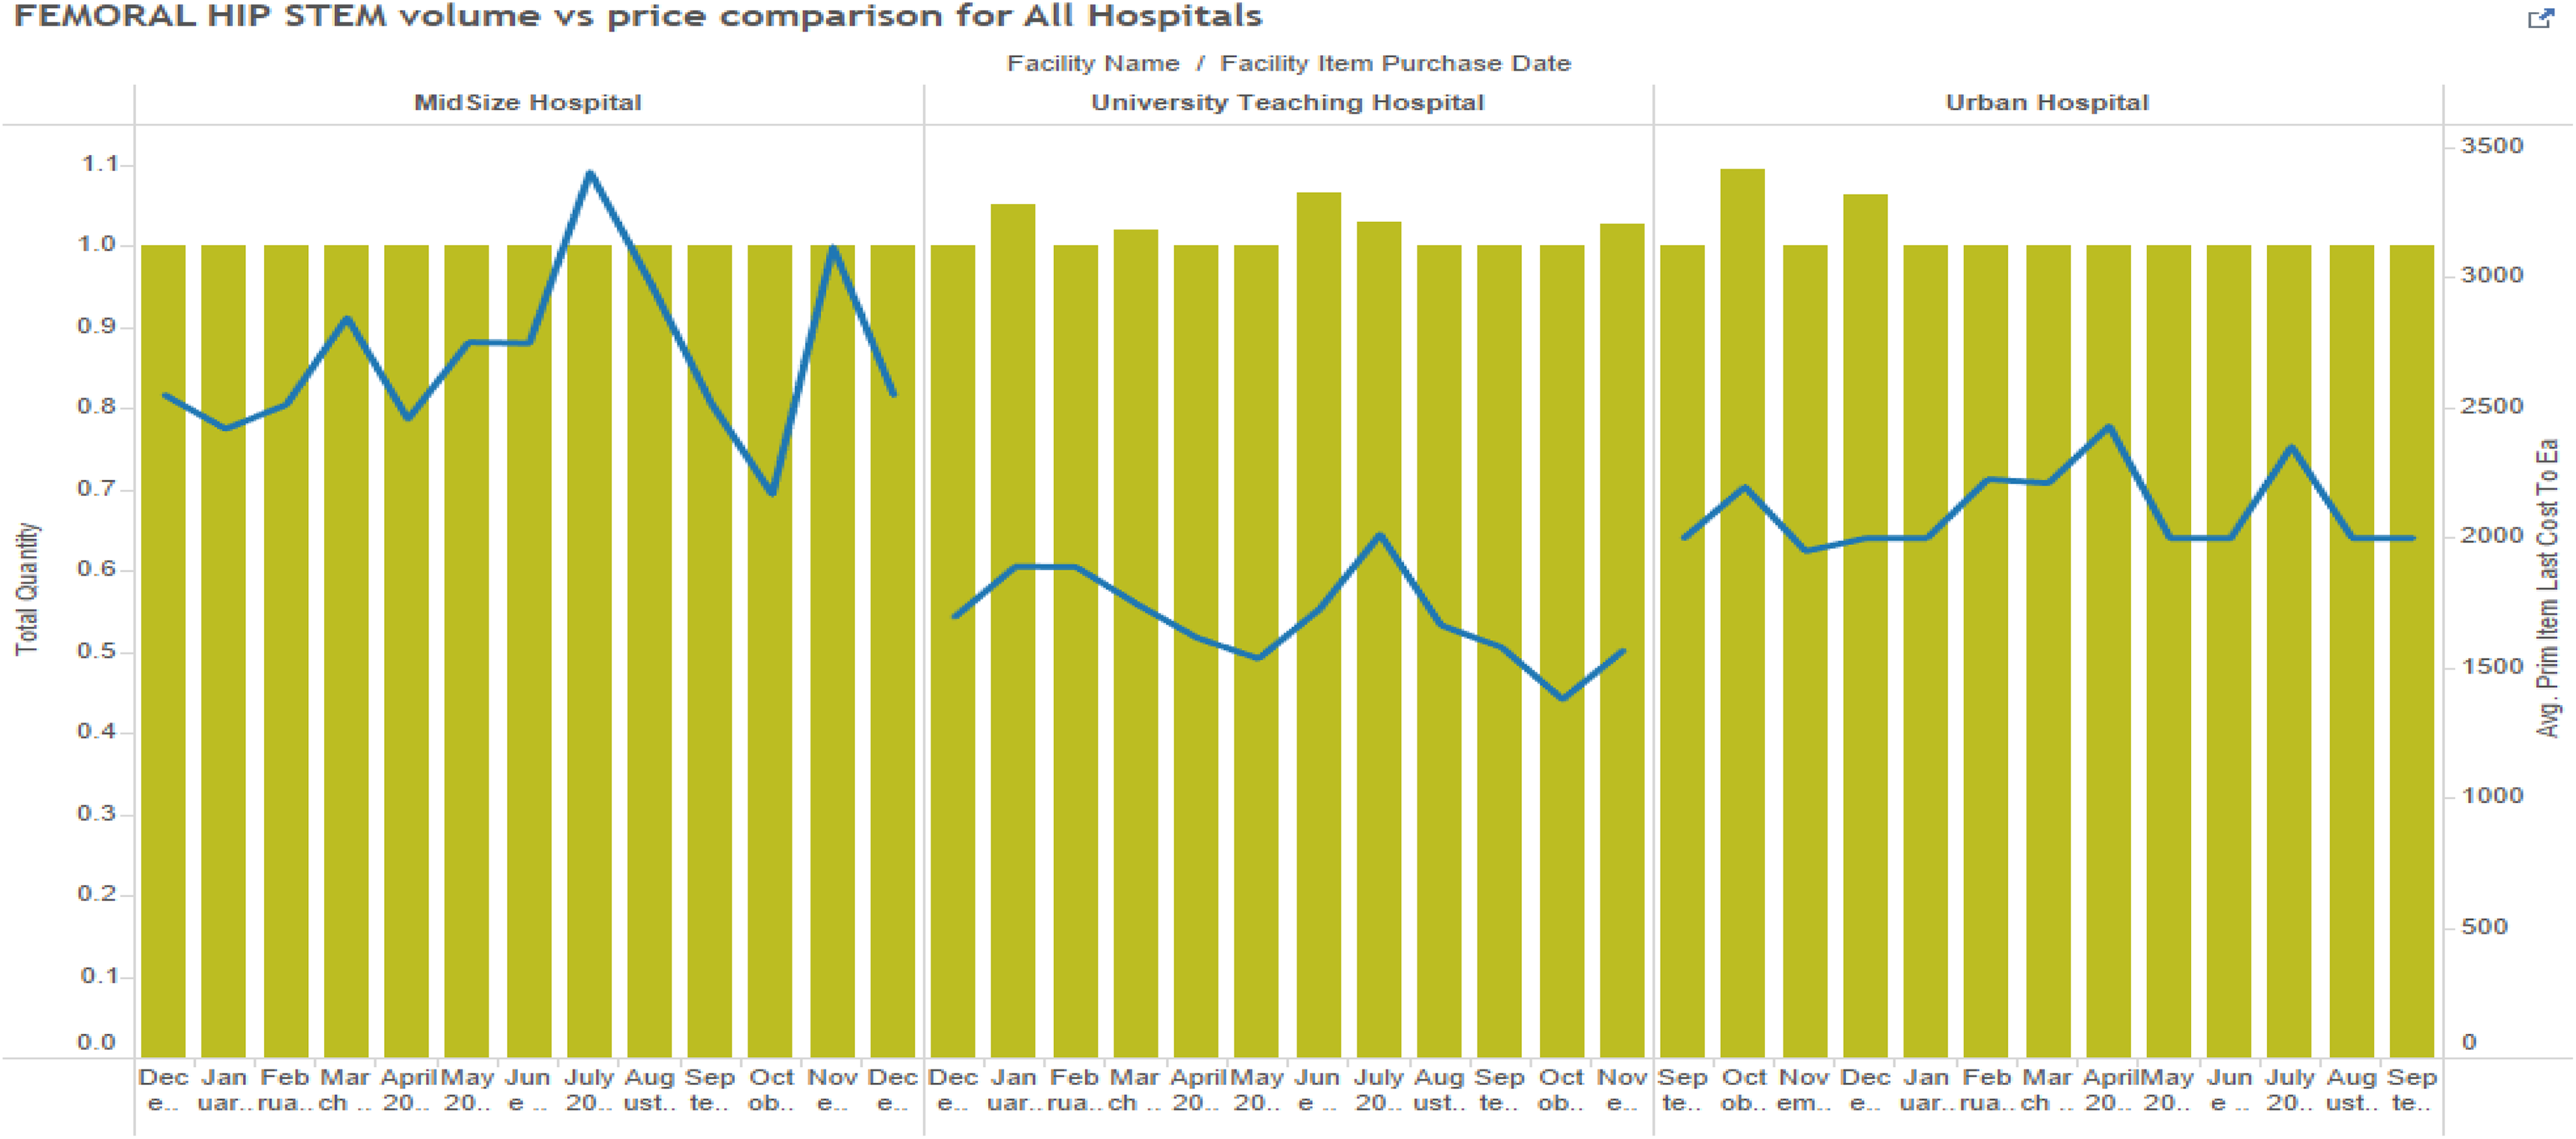
Patellar implant cost variation across facilities.
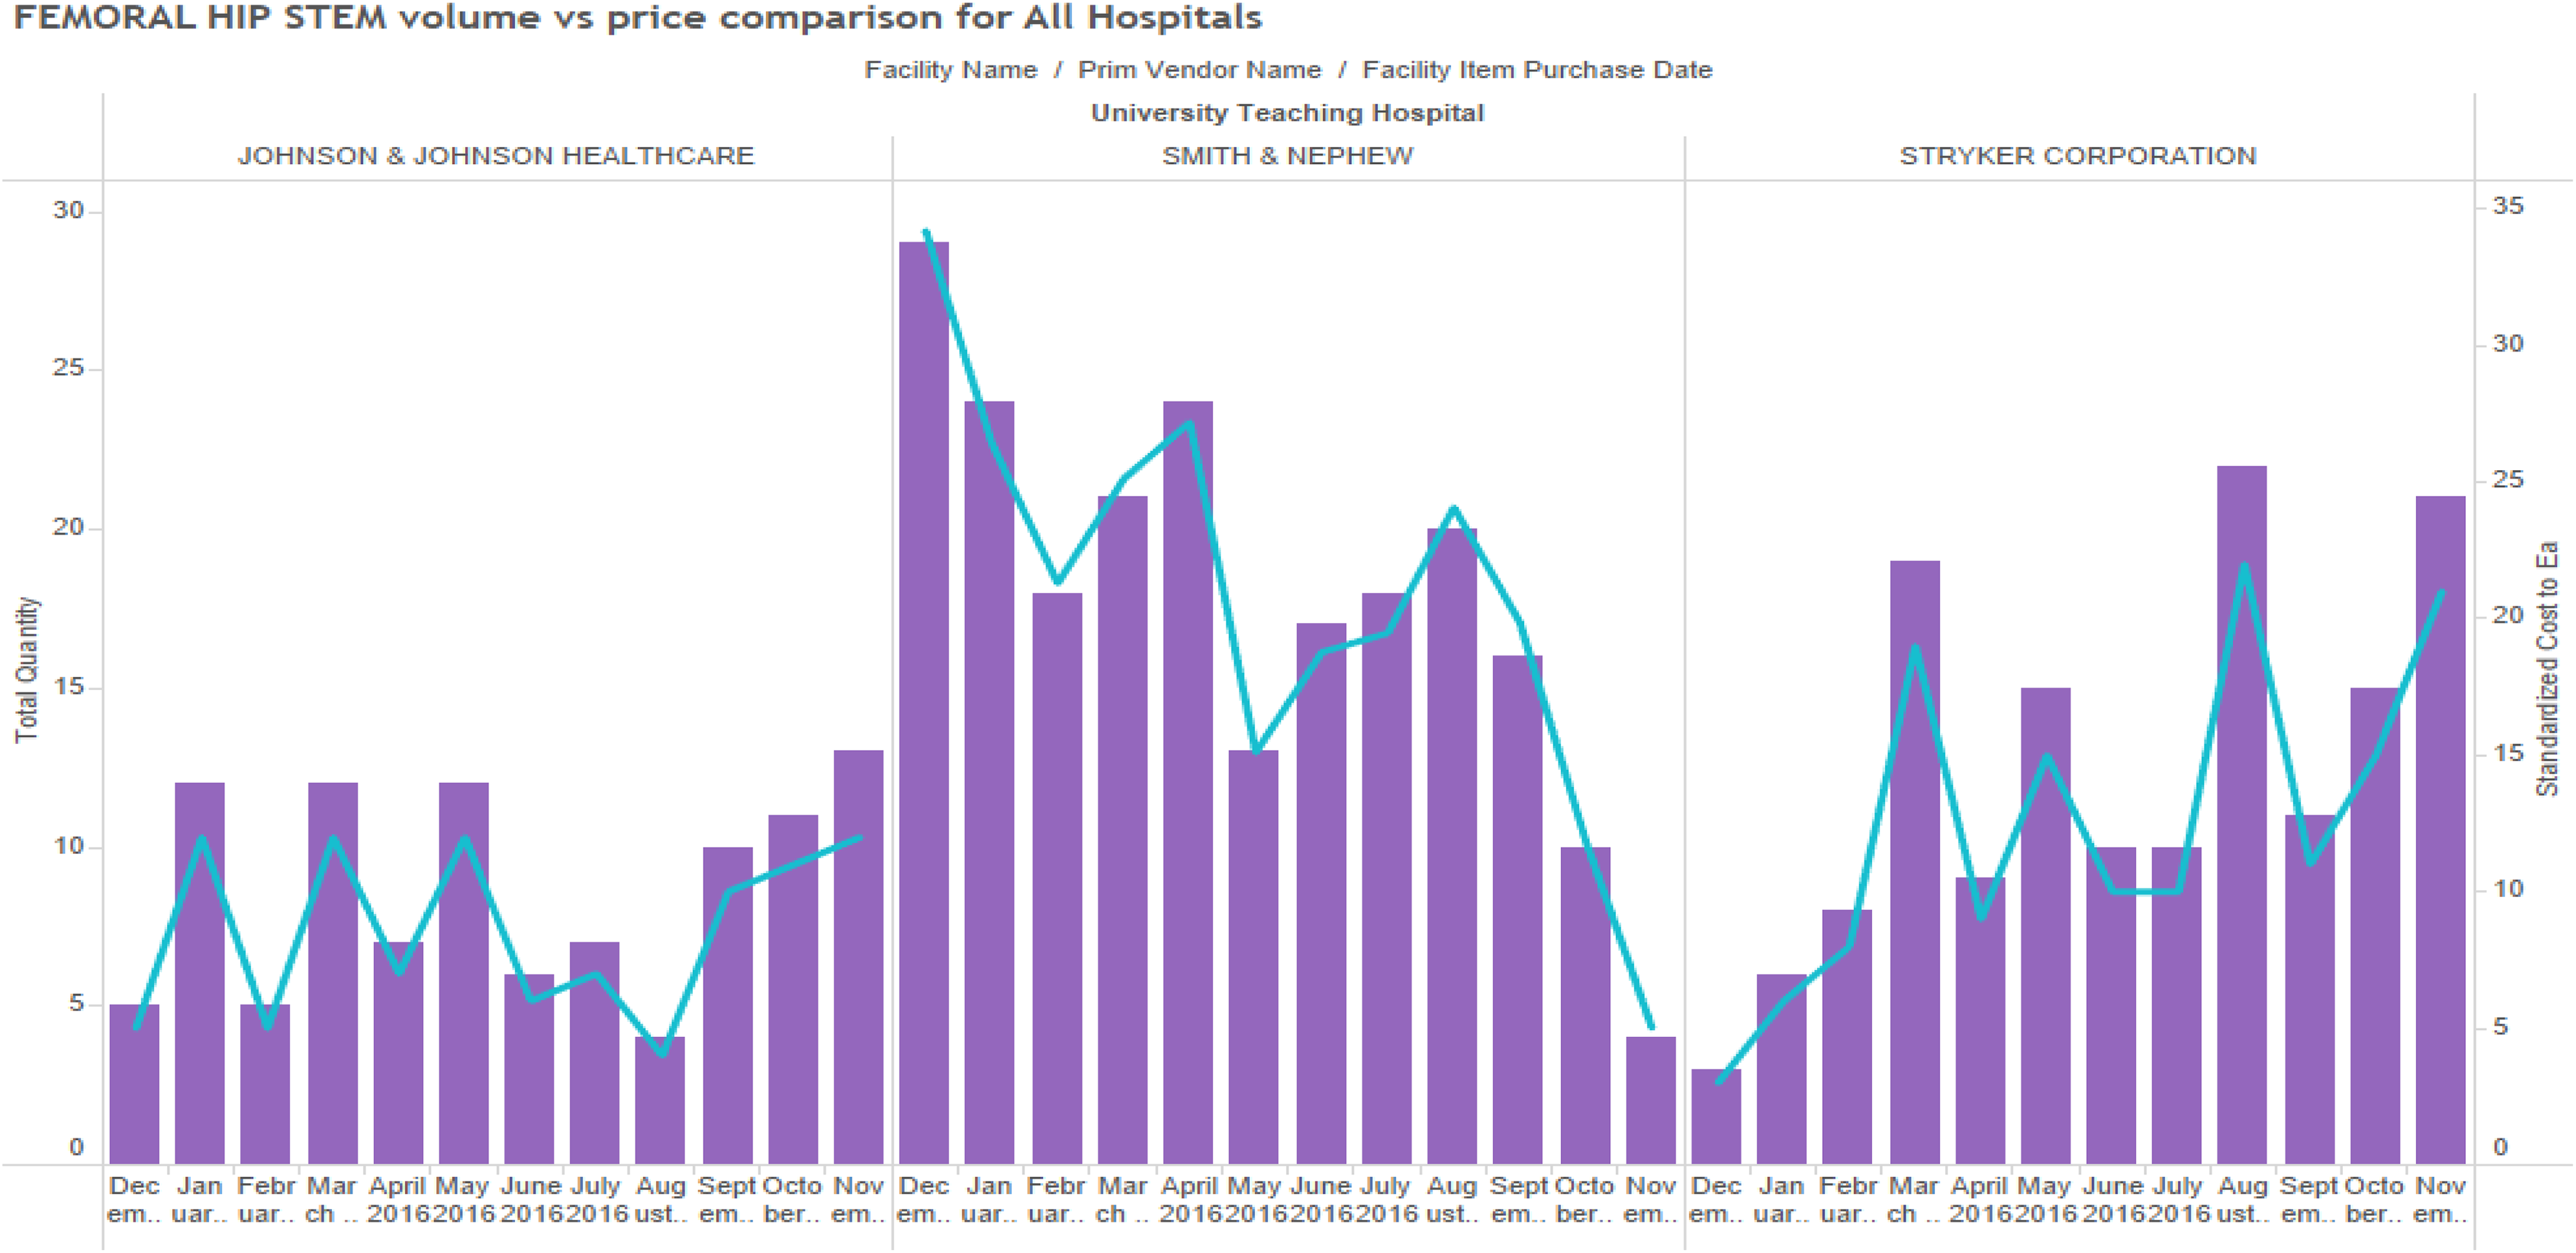
Price variation by supplier for physician preference item (single facility).
Discussion of results
This issue of whether higher volumes afforded by the practice of GPOs buying in large volumes for hospitals has been a research question issue in prior research (Johnston and Rooney, 2012). On the one hand, proponents argue that GPOs are providing an important role by combining the volume of their hospital clients, while others have claimed that any savings gleaned from the market are ostensibly consumed by GPOs through their transaction fees (Litan et al., 2012). In the case of PPIs, the argument is further diluted when researchers note that [t]he widespread use of confidentiality clauses—which limit price transparency and hospitals’ ability to shop for devices based on price—and longstanding relationships between physicians and device companies are the two major factors driving costs higher on implantable devices such as artificial knees and hips or cardiovascular stents, which are among the most expensive items hospitals buy. (Lee, 2013)
Commodity items by volume make up about 50–60% of hospital purchases. They contribute to about 3–10% of total hospital supply prices (Lee, 2013). Hospitals regard medical devices such as hip, knee implants, cardiac stents, pacemakers, valves, and spinal implants as PPIs (Smith et al., 2013). PPIs contribute to at least 40% of total hospital supply cost (Ranawat et al., 2009). It is important for hospitals to address this issue, or small-sized hospitals may even find it difficult to provide services that require PPIs. Irrespective of the size (number of beds), hospitals have large purchasing departments that specialize in negotiating better prices through GPOs or manufacturers based on volume consolidation. And yet, our results fail to explain any common patterns between purchase volumes and pricing. It is possible that these differences may occur due to different incentives, an inability to meet contracted minimums, or GPO agreements that create different physician incentives. This results in pricing inconsistencies across the broad ranges of hospitals across the nation. From our study, we noted that in assessing benchmark information, hospitals vary in their ability to derive access to information on prices other hospitals are paying for, such as items through GPOs, hospital system membership, or informal networks. Value-based purchasing is an important capability required to improve procurement of PPIs, in seeking to link prices more clearly with total cost of ownership and bundled payment patient outcomes.
Utilization
An important mediating factor that is not measured in these cases is the issue of utilization. If hospitals measure “savings,” based on prices paid to GPOs alone, then there is still no accounting for the issue of utilization. Utilization refers to the actual volume of product that is “used” versus “purchased” in a hospital supply chain. Due to the inability to gain good data transparency into workflow of how products are used, many of the products simply “disappear” into the system. A study published in a recent medical journal found that across 58 procedures (36 cranial, 22 spinal), the average cost of unused supplies was US$653 (range US$89–US$3640, median US$448, interquartile range US$230–US$810), or 13.1% of total surgical supply cost. Univariate analyses revealed that case type (cranial versus spinal), case category (vascular, tumor, functional, instrumented, and non-instrumented spine), and surgeon were important predictors of the percentage of unused surgical supply cost (Zygourakis et al., 2017). The results of this study showed conclusively that a large variation and significant magnitude of OR waste in neurosurgical procedures occur. The physicians who conducted this study noted that price transparency to surgeons (showing them how their spending fits against norms) was one component of the solutions addressed by the authors’ institution. They recommended improved education about OR waste to surgeons and nurses, preference card reviews, and clarification of supplies that should be opened versus being available as needed to reduce waste. But these strategies, in turn, would require first good data governance and the ability to track products through the flow of receiving through use through billing.
The lack of interoperability of hospital data is an important contributing factor to many of these problems. The business platform deployed by providers relies on three foundational data systems: (a) a system that tracks product costs, manages inventory levels, and provides a product ordering mechanism (the materials management information system, or MMIS); (b) a system that tracks utilization that includes direct and indirect costs associated with the provisioning of care (the clinical information system (CIS), generally EPIC); and (c) a system that bills and collects revenue from patients and payers. These systems form the basis for operating a business and can be taken down to their most basic form in that they provide the basis for “Bought-Used-Sold” reporting, a critical element for success required in any business and any industry.
The essential elements of this problem are shown in Figure 14. Healthcare business technology is a “gapped infrastructure,” lacking the integration of the three following disparate systems: Clinical data master (CDM)—the master data used in the payer and billing systems that lists the items required for reimbursement by insurance companies or Medicaid (“Did I get paid for it?”). This is related to the charge management and revenue cycle for payment from providers, against what was actually used. A clinical data management system or CDMS is a tool used in clinical research to manage the data of a clinical system. Clinical information system (CIS)—documents how the item was used during the patient interaction, operation, or procedure (“Did I use it?”). Materials management information system (MMIS)—a system of record for tracking the price paid of clinical items that go into a hospital’s inventory system (“What did I buy?”).
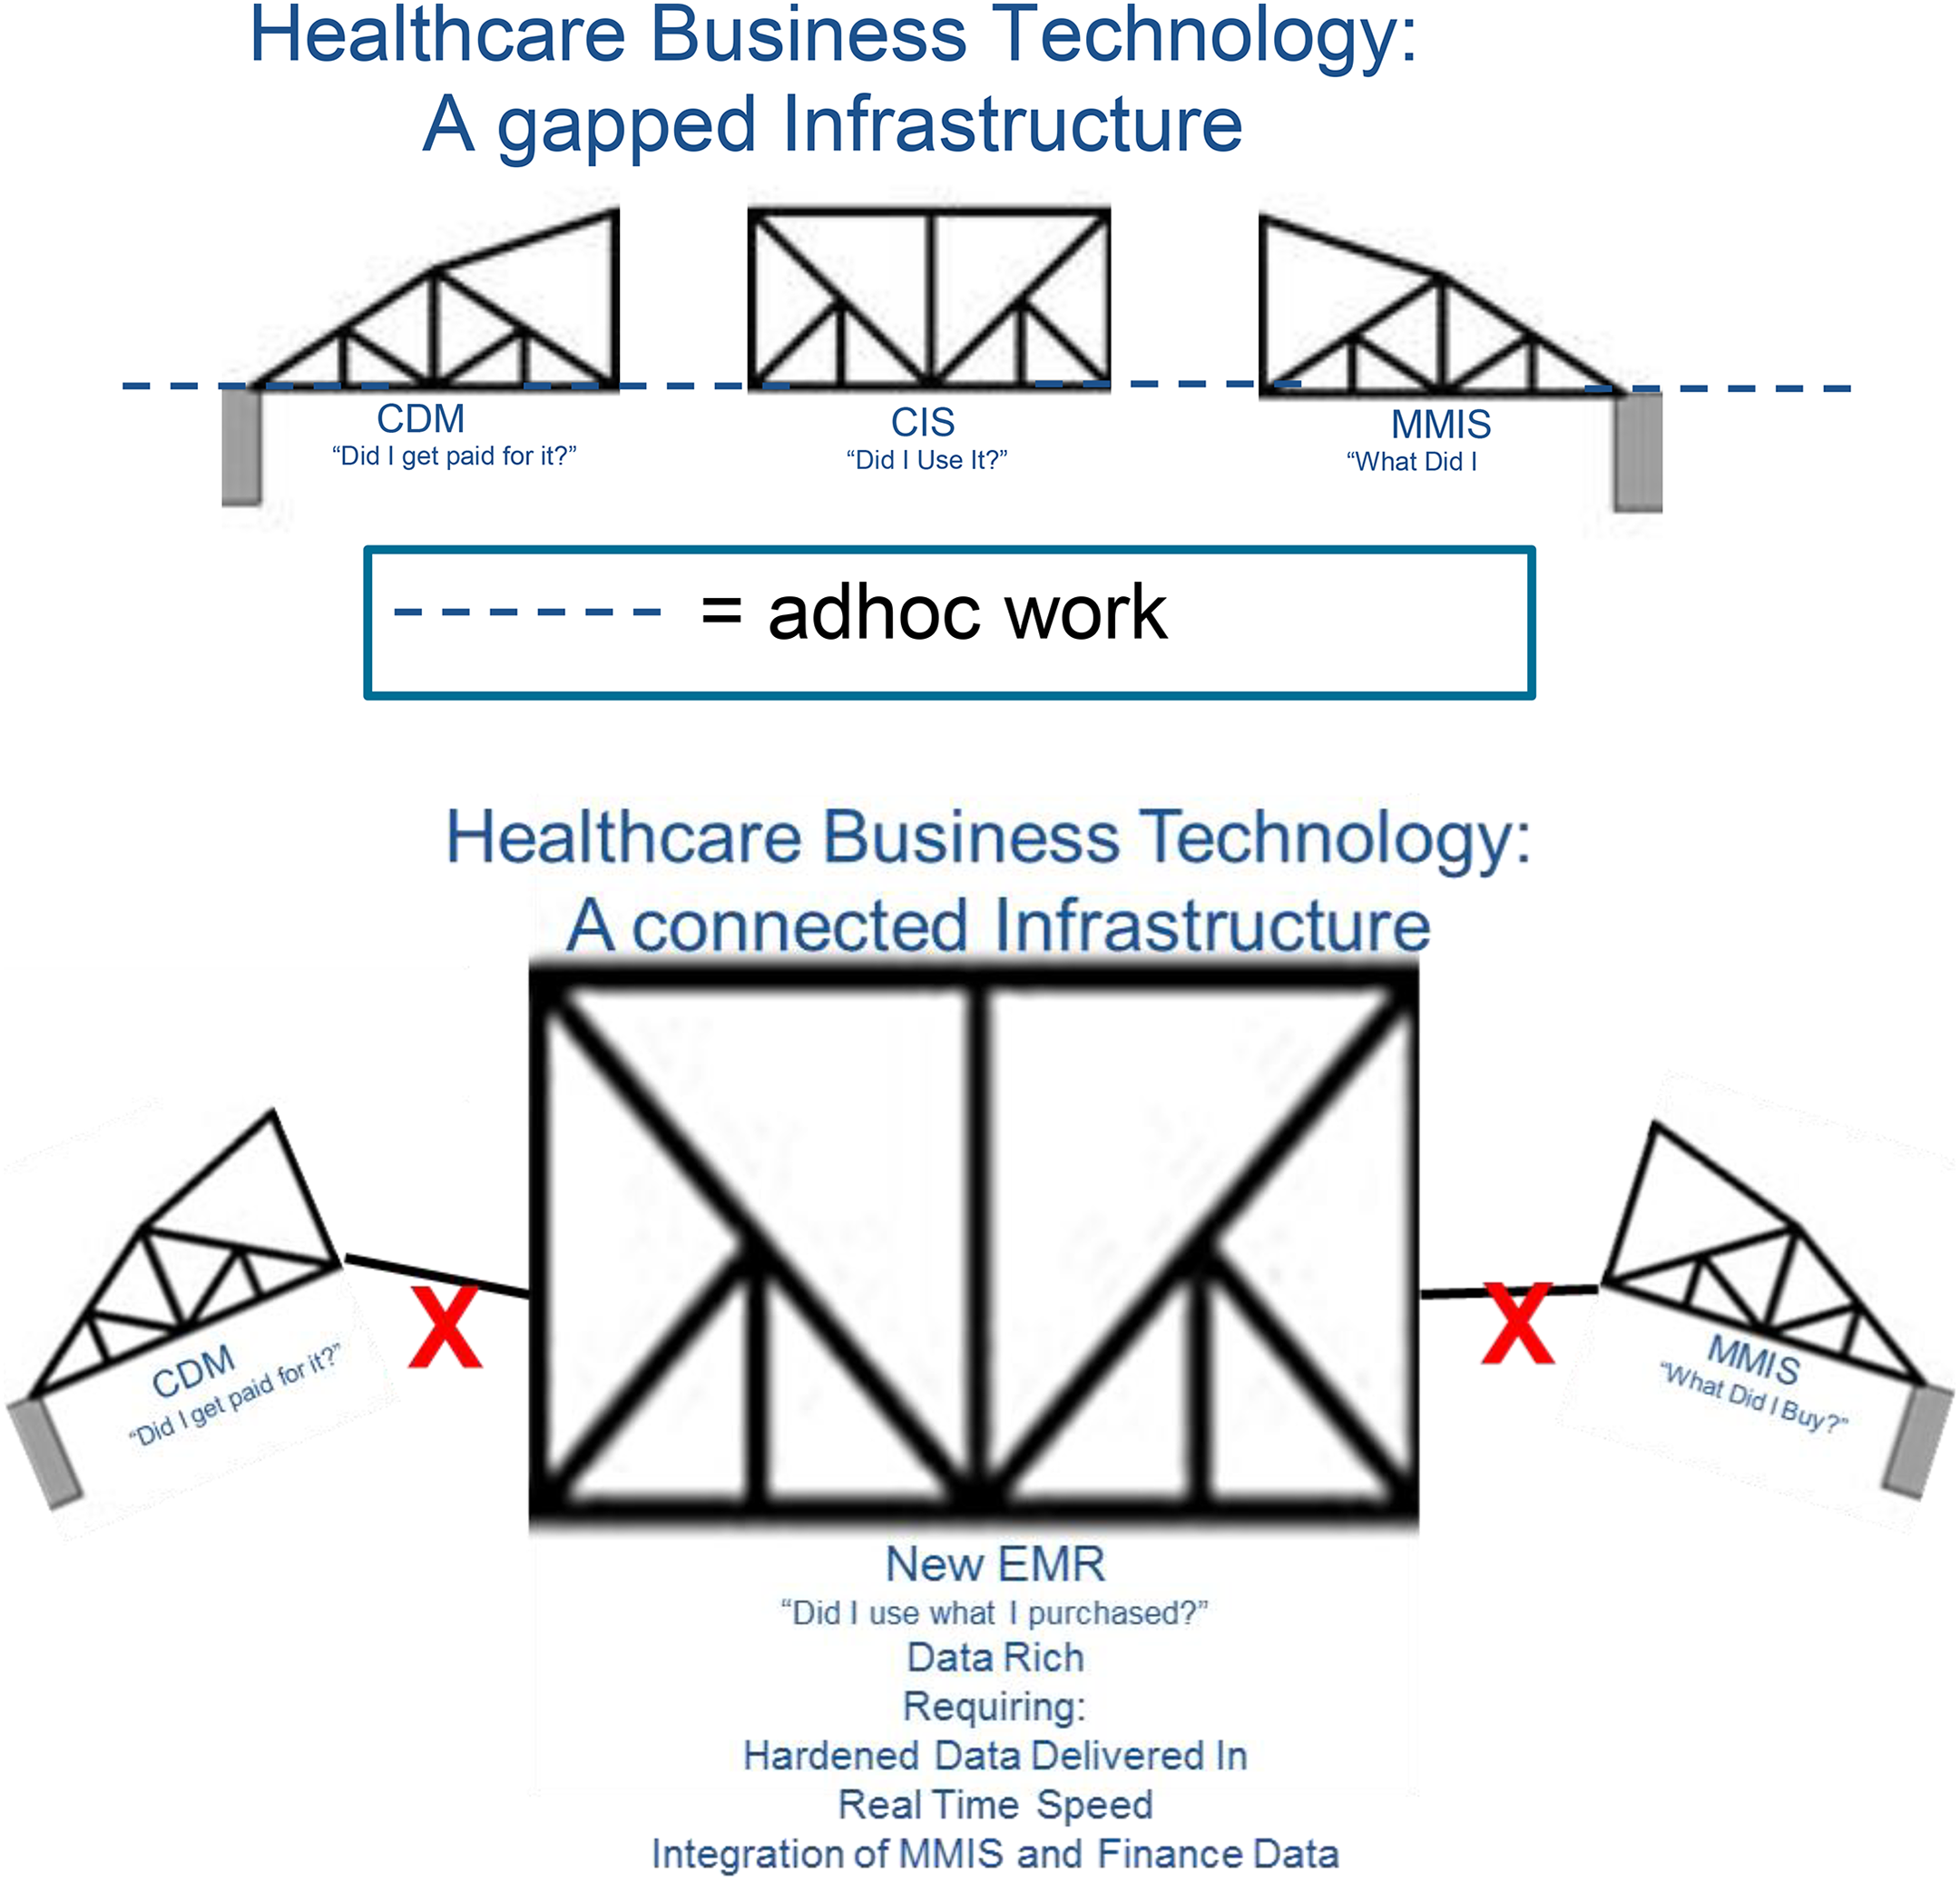
The broken infrastructure.
The lack of interoperability among these three elements is related to the fact that each database uses a different coding system for referring to the same item. One system, the CDM, is keyed according to the patient. The second element, the CIS, uses a rate-based revenue code. And the MMIS uses a product-SKU level code. The end result is that when an item is purchased, entered into inventory, used in a clinical operation, and then billed against a patient, there is no “bridge” between the systems to track the flow of the item through the system.
Interviews with hospital executives supported the notion that data spend analysis was challenging at best, and was often being done with massive Excel spreadsheets that were often out of date and contained many data errors. These same hospital executives confessed that in many cases they relied on GPOs to determine their spending patterns for them.
The result is that the new vision of creating EMR will occur very slowly, and the associated promise of lower costs through volume consolidation in the industry may not materialize until data integrity is addressed. The question for hospitals around “did I use what I purchased?” (utilization) requires solid, reliable data delivered in real time, which integrates the materials management system with the financial billing system. But like the drawbridge which has different parts to it shown in Figure 14, the elements of the bridge are not connected, and the flow of data is fundamentally disrupted. The promise of improved price visibility using the current set of data governance practices will remain encumbered until these links are addressed through data governance.
But why isn’t there a uniform coding structure to link data among these three critical hospital systems? In effect, each system has a different coding structure, including a current procedural terminology (CPT) 5 code, a GT code (a billing modifier code), or a UNSPSC 6 code. The federal government has not implemented a formal coding structure that bridges the three systems (CDM, CIS, and MMIS). As such, each of them operates independently, even though the product codes must travel through all three systems as they are entered in the clinical system (CDM), tracked at the point of use with the patient (CIS), and recorded in the materials management system (MMIS). This disconnect between these three systems may be one of the reasons behind healthcare’s inability to control costs. Government initiatives are pushing for greater pricing and information visibility, and are creating electronic health record systems that need to be able to access all three systems (CDM, CIS, and MMIS). By doing so, governments hope to be able to create analytics to address improved healthcare such as determining appropriate treatment paths for patients, supporting clinical improvement, and monitoring the safety of healthcare systems (Jarousse, 2011; Jee and Kim, 2013). There have been billions of dollars spent to standardize data sharing among providers, but more than 3500 hospitals are struggling to interpret how to do it under these conditions (Speaks, 2016; Welch and Handfield, 2015).
We observe that a vehicle for data sharing and transparency among providers, payers, and patients is dependent on creating a standardized approach for coding clinical materials, which can be adopted by all parties in the healthcare ecosystem. The good news is that when hospitals begin to adopt a standardized approach to coding data, there are increased opportunities for cost savings that may arise. These savings have nothing to do with improved prices (although this may be part of the outcome), but more to do with the two challenges we described earlier: clinical productivity and increased material utilization.
Limitations
There are several limitations to this study. First, the use of only three hospitals provides a limited sample. However, since the unit of analysis in this case is the product SKU, not the hospital, we have a significantly large number of observations to use for our OLS regression analysis. (We used prices for approximately 3000 SKUs in our analysis.) We are interested to see if samples of products, nested within three large hospitals, displayed any relationship in terms of volume and price. Our findings fail to show this and did not support the proposition that price and volume were related. Future studies should explore this relationship within a broader range of hospitals.
Conclusions
Product costs represent a significant component of hospital costs following labor expense. Some 30 to 60% of a hospital’s operating expense is attributed to medical and surgical supplies (Patrick, 2014). Hospital supplies are a major contributor to healthcare expenditures. An important issue for a hospital is not being aware of the supplies’ pricing as well as not knowing fair market prices. For many years, hospitals have struggled with an ability to access market price transparency (Reinhardt, 2014). Hospital supply chain analysts spend a significant amount of time gathering information to negotiate prices for a single product. Many other industries employ mature sourcing strategies to render their business more cost competitive (Volpp, 2016). There has also been much research and many forecasts on the supply costs exceeding the labor costs, and managing supplies and their cost is becoming a critical focus of hospitals (Fixler and Jaditz, 1997). Similarly, PPIs account for 60% of hospital spend. Orthopedic procedures and cardiac procedures that use implantable devices cost exorbitantly more than the cost of total inpatient or even surgical procedures (Montgomery and Schneller, 2007). PPIs have always been a major challenge among hospital giants (Jarousse, 2011). More often than not there has been a conundrum about physicians being involved in purchasing decisions and linking that process with quality metrics.
Using a sample of category item prices for 3000 SKUs from three major hospitals, we conclude that volume aggregation does exist over some of the most expensive supply items, yet there is a strong lack of control and visibility of such items. From our analysis, there are indications that PPI prices are a function of supplier location. However, this does not result in any standardization initiatives. The three hospitals considered do not reach their cost savings potential due to a bias that exists in choosing the supplier that provides the greatest value add. PPIs have also resulted in contract compliance and impaired negotiation capability (Olson et al., 2013).
Our findings also support the idea that items are purchased multiple times without the hospital being able to assess their spending patterns. Our interviews supported these findings and suggested that most hospitals validate manually that their prices are accurate, and this results in increasing errors such as overpayment, including payments for supplies not consumed.
This analysis provides insights regarding how such discrepancies can be addressed. By developing improved data governance mechanisms and approaches for establishing cloud-based procurement systems, hospitals can take more control over their spending patterns. Many new procure-to-pay technologies are available with easy graphical user interfaces that both facilitate improved user experiences in nursing stations, and enable a higher level of procurement data governance. Our results suggest that procurement efforts that rely on the premise that higher volumes pursued through such means as hospital consolidation, GPO contracts, supplier consolidation, and larger volume purchases, are unlikely to produce any meaningful reductions in unit prices for purchased goods and materials. However, improved data governance can potentially create better monitoring of utilization of such products, and produce more efficient usage, thus providing improved savings through more direct means. Data governance and data quality will become important considerations for hospitals investing in new material purchasing systems, and the ability to derive standard taxonomies and data classification systems are important in evaluating the ROI of investments in such systems.
Footnotes
Declaration of Conflicting Interests
The author(s) declared no potential conflicts of interest with respect to the research, authorship, and/or publication of this article.
Funding
The author(s) received no financial support for the research, authorship, and/or publication of this article.