
Abstract
Many firms vie to attain a strategic bottleneck position in their industry, as it promises superior value appropriation over an extended period. Using a mixed-methods approach, we investigated the power dynamics between bottleneck and challenger segments in the airline ticket distribution sector. Our study of the bottleneck formed by the global distribution system (GDS) firms reveals the mechanisms that these firms employed to maintain power, as well as the mechanisms that airlines in the challenger segment used to attain power. These mechanisms strongly influenced the momentum of power shifts as the industry evolved towards greater modularization; we show how they worked recursively in a process of power distribution dynamics during that evolution. In addition, these mechanisms explain the dynamics at work between the incumbent and challenger segments, with airlines increasing the pressure to modularize and the GDS firms resisting that pressure. Our findings contribute to the literature on industry architectural change and industry evolution by providing a comprehensive understanding of the power dynamics that affect when and how strategic bottlenecks dissolve.
Keywords
Introduction
Bottlenecks are critical parts of a technical system that have virtually no alternatives, and controlling them allows firms to disproportionally capture value in an industry structure (Baldwin, 2015). Such bottleneck firms typically own and provide co-specialized (complementary) assets that other firms use to create their products or services. Co-specialization means that fewer alternative assets or asset combinations are available, and those alternative assets that are available are less attractive, which gives bottleneck firms high bargaining power and little risk of having their assets substituted by adjacent segments (Jacobides & Tae, 2015). For example, the bottleneck positions of Microsoft, Intel, Google and Apple are often cited as reasons for their continued dominance in the technology sector (Baldwin, 2015; Jacobides & Tae, 2015; Pisano & Teece, 2007).
Strategy scholars have shown great interest in understanding how bottlenecks form, and the options available to firms that influence the industry structure to their advantage. For example, Jacobides, Knudsen, and Augier (2006) developed a conceptual logic around the two co-specialization components of factor complementarity (i.e. two mutually adapted factors that yield superior value when combined) and mobility (i.e. the number of available alternatives for these factors), suggesting that firms that are aware of these components and how they interact can leverage the situation to their advantage.
However, bottlenecks are not necessarily permanent. Modularity research suggests that over time, industry structures transition from more integrated to more modular (Fixson & Park, 2008; Schilling, 2000). Modularity refers to ‘the degree to which a system’s components can be separated and recombined’ (Schilling, 2000, p. 315), implying that increased modularization erodes bottlenecks. The transition to modularity, however, is neither certain nor smooth nor linear (Cattani & Malerba, 2021), as firms seeking to dissolve the bottleneck or replace it with a structure more favourable to them face opposition from bottleneck firms prepared to make every effort to maintain and guard their valuable and profitable positions. We know very little about the dynamics between these incumbent firms and their challengers or the ongoing dynamics that support and erode an extant bottleneck (Jacobides & Tae, 2015). This is surprising given the important role bottlenecks play in systematically determining the value appropriation potential of a segment and, consequentially, the firms in the segment (Hannah & Eisenhardt, 2018; Jacobides, MacDuffie, & Tae, 2016; Jacobides et al., 2006). Hence, our research question is as follows: How do incumbents and challengers interact to shape the evolution of bottlenecks in an industry?
To answer this question, we studied the airline ticket distribution industry where a bottleneck formed around a set of firms, the global distribution system firms (GDSs), in the late 1990s which airlines have been challenging since the early 2000s. To understand the dynamics involved, we used a mixed-methods approach to analyse airlines’ efforts to shape the interface between their segment and their distribution partners, evaluating 8,253 news articles published between 2009 and 2020 and interviewing 13 senior professionals from the airline industry. We identified power-maintaining and power-attaining mechanisms that influence the power-shifting momentum in this modularization process. We conceptualize the power distribution dynamics between the incumbent and challenger segments as a recursive process in which the power-maintaining and power-attaining mechanisms lead to airlines increasing the pressure to modularize, while the GDS firms resist that pressure.
This study makes three contributions to the literature on industry architectural change and industry evolution. First, it broadens our understanding of the power concept in both the modularization and industry architecture (IA) literatures and introduces the concepts involved in dissolving bottlenecks: momentum, momentum building and impeding forces. Our results show that building momentum often takes time; however, stopping it completely once it begins is difficult. Our second contribution is identifying the power distribution dynamics in which mobility and complementarity are embedded, and further showing how these dynamics contribute to the development and evolution of co-specialized and individualized assets in an industry structure. We highlight how increased opportunity and pressure for modularization influence the asset structures required to strengthen an evolutionary appropriability regime (Teece, 1986, 2006) in an industry vertical, undergoing change. Our third contribution highlights the relevance of resource selection maturity by the challenger segment before a bottleneck can be eroded. This involves this segment’s collective demonstration of maturity in resource selection surrounding the primary technology used, and how to flexibly respond to the diverse set of actions from the incumbents to maintain power and impede power-building momentum attempts. Firms that can sustain and continue to develop this maturity over time likely possess and exemplify an emerging architectural capability that Baldwin (2015) called for.
In the next section, we develop the theoretical background on changes in bottlenecks and the role modularization plays in industry architecture; we then explain our methods. We present our findings narratively in four phases of development in the airline distribution industry over 26 years, beginning with the first phase in which the bottleneck was established and continuing through to the final phase in which it was dissolved. To conclude, we discuss the recursive power distribution dynamics model that we developed and highlight the major implications of our study.
Theoretical Background
A bottleneck is ‘a component in a complex system whose performance significantly limits the performance of the system as whole’ and that ‘has no – or very poor – alternatives at the present time’ (Baldwin, 2015, p. 9). Relatedly, technological bottlenecks are the physical constraints or limitations of an underlying system that form the backbone of strategic bottlenecks, in which firms provide a unique solution to an underlying problem while maintaining control over that solution (Baldwin, 2015). This combination of solution and control allows the firm or group of firms that exercise that control to appropriate superior value (Jacobides & Tae, 2015). From a resource-based perspective (Barney, 1991), firms need to be aware of who controls the strategic resource of a bottleneck (Baldwin, 2015) so that they can either manoeuvre into a position to control this resource themselves or challenge the firms that control the bottleneck. Either choice requires a firm to understand the technological and industry architectures in which it is embedded to capture value to its advantage (Baldwin, 2015; Jacobides & Tae, 2015; Jacobides et al., 2016).
Two closely related strands of literature in strategic management have examined the role of bottlenecks in industry evolution. One stream has developed within the innovation and product architecture literatures and tends to emphasize technical product design (technology and modularization) (Fixson & Park, 2008; Helfat, 2015). The other stream focuses on industry architectures and the patterns, rules and roles in the interorganizational division of labour to explain what possibilities firms in an industry have for capturing value (Jacobides et al., 2006, 2016). In its explanation of how bottlenecks establish and change, this industry architecture stream tends to foreground socio-contractual components (Jacobides et al., 2006).
In the literature on innovation and product architecture, researchers investigating how bottlenecks are established and how they evolve have been primarily interested in how technology and product design choices impact industry structure (Burton & Galvin, 2022). While most industries described in this literature migrate from integrated to modular structures, not all of them do (Burton & Galvin, 2022; Helfat, 2015). A prominent example of this trajectory reversal is the bicycle drivetrain manufacturer Shimano, and its migration to a dominant position. As Fixson and Park’s (2008) analysis shows, Shimano began by offering an integrated and incompatible drivetrain in an industry that was then highly modularized. Ultimately, Shimano pushed out other component manufacturers and became a role model for creating and controlling a technological bottleneck that attracted and captured value by combining technological ingenuity and effective strategic choices (Baldwin, 2015). Therefore, Shimano is an example of a firm whose initial technology and product design choices changed an industry structure (from modular to integrated) to its advantage.
More commonly, industries tend to migrate from integrated (less modular) to more modular forms. To help us understand these migrations and what tends to push industries towards greater or lesser modularity, Schilling (2000) developed a general modularity theory that provides a causal model for the migration of systems along more vs less modular forms. In this theory, migrations in either modularity direction depend on three components: (1) demand and input heterogeneity parameters, in which increasing heterogeneity leads to greater modularity; (2) synergistic specificity, in which greater benefits of specific (co-specialized) components lead to lower need for more-modular designs, and therefore to less modularity; and (3) urgency, in which moving in either direction along the modularity continuum requires contextual triggers (such as competitive intensity) to break the default of system inertia (i.e. a firm’s current position along the modularity continuum). Although Schilling does not use the term bottleneck, her descriptions closely align with the term; she argues that firms that possess or control a unique technological asset or position can block modularization ‘even when other variables indicate that a firm should experience strong pressure to offer increasingly modular products’ (Schilling, 2000, p. 329). Because of their bottleneck position, these firms also ‘experience less urgency’ (Schilling, 2000, p. 325, emphasis in original), have architectural control and can restrict market access, all of which allow them to resist strong pressures to modularize (Schilling, 2000). Technological bottlenecks are instrumental in shaping nascent and emerging industry settings and ecosystems because they affect innovation, ecosystem emergence, stability and industry growth (Ethiraj, 2007; Shipilov & Gawer, 2020). A novel and promising option for firms to successfully compete in such a dynamic setting is to follow a distinct bottleneck strategy in which they identify and sequentially occupy new technological bottlenecks as others fade (Hannah & Eisenhardt, 2018).
The literature on industry architectures acknowledges the role that technology, innovation and product architecture play in the establishment and evolution of bottlenecks yet explains value distribution among industry players as being determined more by the socio-contractual parameters of an industry. Industry architectures are seen as ‘templates that circumscribe the division of labour among a set of co-specialised firms’ (Jacobides et al., 2006, p. 1201) and as rigid and stable structures of co-specialized firms and assets across vertically adjunct segments. These segments exist within an industry that defines roles and shapes interactions among individual firms in terms of how value gets created (‘who does what’) and how value gets divided (‘who gets what’; Tee & Gawer, 2009).
Jacobides et al. (2006) developed a conceptual logic to help understand such architectures and how value is created and divided within them. Building around two co-specialization components, factor complementarity and mobility, these authors argue that enhancing both components in adjacent segments puts firms in an advantageous position because doing so migrates them towards a bottleneck. Empirical accounts of how bottlenecks are created, how they evolve and how they dissolve are scarce. Ferraro and Gurses (2009) describe MCA’s tactics to shape the architecture of the United States motion picture industry in its favour, and Gurses and Ozcan (2015) study the dynamics new entrants used to successfully infiltrate and change the established US TV broadcasting industry. In a quantitative study, Jacobides and Tae (2015) found that it was the particularly large and leading firms, i.e. kingpins, that establish bottleneck positions in their segments. In another study on car manufacturers (OEMs) as the bottleneck segment, Jacobides et al. (2016) analysed the mixed efforts of the OEMs to change their sector’s architecture: despite the OEMs’ shared cognitive frame for establishing a different industry architecture, they had to abandon these changes because they were too risky and costly. In summary, these studies in the IA literature have identified certain aspects of how bottlenecks form and evolve, yet we still lack a clear, specific and overarching explanation of how these bottlenecks emerge and change over time.
What both streams have in common is their evolutionary understanding of bottlenecks, in which technological (product) design choices made early in an industry’s life cycle become the basis for vertically structuring the industry; that is, for determining how to divide and combine the tasks that lead to the final product (Cattani & Malerba, 2021). These early technological choices influence interaction patterns that constrain firms’ boundary location decisions and product design choices, and hence determine, or at least influence, where and how a firm can create and appropriate value. Over time, as rules and roles settle, knowledge spreads, technology advances, standards emerge, new entrants arrive, regulation becomes embedded and an industry structure evolves. Once an industry structure is in place, more specialized actors emerge and their greater portfolio of technologies typically leads to a more modular product architecture. While this architecture makes it easier for increasing numbers of exchanges to take place across more interfaces, it also makes it very difficult to change the structure that has emerged and become institutionalized (Burton & Galvin, 2022; Fixson & Park, 2008; Jacobides, 2005). Both literature streams acknowledge that product and industry architectures are closely related, yet the industry evolution that each describes is focused on different aspects of that evolution.
These studies have deepened our understanding of strategic bottlenecks in firm strategy and industry evolution. However, only a few have helped us understand the bottleneck dynamics and value migration that researchers have called for (Jacobides & Tae, 2015; Jacobides et al., 2016). To analyse how control changes and how value distribution migrates across a vertical industry structure, it seems beneficial to include non-traditional parameters, such as regulatory and power processes, as Burton and Galvin (2022) did in their recent study investigating how regulation and bottlenecks influenced the co-evolution of product and industry architecture. Surprisingly, researchers have paid little attention to untangling the arguably essential strategic advantage that a bottleneck provides to firms: the (bargaining) power it gives them to capture superior value. This lack of attention is even more surprising given the prominence of such concepts as ‘span of control’ (Baldwin, 2015) and ‘architectural control’ (Schilling, 2000), and frequent references in the literature to ‘the loose notion of “power”’ (Jacobides & Tae, 2015, p. 903). Untangling a bottleneck requires researchers to identify the dynamics involved, both the dynamics of surrounding firms in their continuous struggle to migrate this power to their advantage and the dynamics of the incumbent firms’ efforts to fend off these attempts and maintain their position of power in the industry vertical. 1 Understanding bottlenecks thus requires a better understanding of challenger firms’ actions and processes as they learn to explore and exploit situations and ultimately influence and challenge the power balance that the incumbent firms hold in the industry vertical (Romme, 1990; Roome & Wijen, 2006).
We explore these dynamics in the global airline industry, where a bottleneck formed around the global distribution system firms at the end of the 1990s; and we investigate the power dynamics that subsequently unfolded over the last 26 years and effectively dismantled this bottleneck.
Method and Data
We employed an analytic inductive lens in this research, using industry news items as data sources for firms’ stability- and change-oriented actions, and in-depth interviews with airline industry experts to examine how the architecture of airline ticket distribution evolved. We combined quantitative and qualitative data to gain the breadth and depth necessary to understand the magnitude, context, content, intent and consequences of firms’ actions and initiatives in this industry (Robinson, 1951) – a process referred to as intermediate theory development (Edmondson & McManus, 2007; Litrico & David, 2017).
The multiple sources of evidence (interviews, archival data and industry publications) used in our study span a 26-year period from 1996 to 2021. Our key objective was to develop an in-depth, holistic account of airlines’ actions and initiatives that led to the evolution of the industry vertical structure. Multiple data sources are critical for understanding how the industry developed and for ensuring that our constructs and conclusions are valid and reliable (Guba & Lincoln, 1982; Yin, 2003).
The setting
The ticketing distribution sector of the global airline industry between 1996 and 2021 is an appropriate setting to examine our research question for three reasons. First, it allows us to comprehensively analyse the industry segment (airlines) from which initiatives directed at dissolving an industry bottleneck emerged. The passenger airline segment is well covered by news outlets because it is highly regulated and attracts considerable public interest. Second, global distribution systems are a prime example of an industry bottleneck arising from a co-specialized technological interface between the bottleneck and an adjacent segment (airlines); with limited data transmission capacities in the 1970s, large US airlines transferred key flight selling activities to GDSs. 2 Instead of creating and maintaining a many-to-many network among airlines and travel agents worldwide, these airlines only had to send data to the GDSs, which then managed the global distribution of connected travel agents. As full-ticket sourcing solutions, GDSs have become the standard booking channel between airlines and travel agents (Figure 1). By 1999, 93% of domestic US airline tickets sold via travel agents were GDSs (Ravich, 2004). GDSs were the most important yet costly distribution instrument for airlines, which were reportedly paying around US$7 billion in GDS fees per year (Economist, 2012).
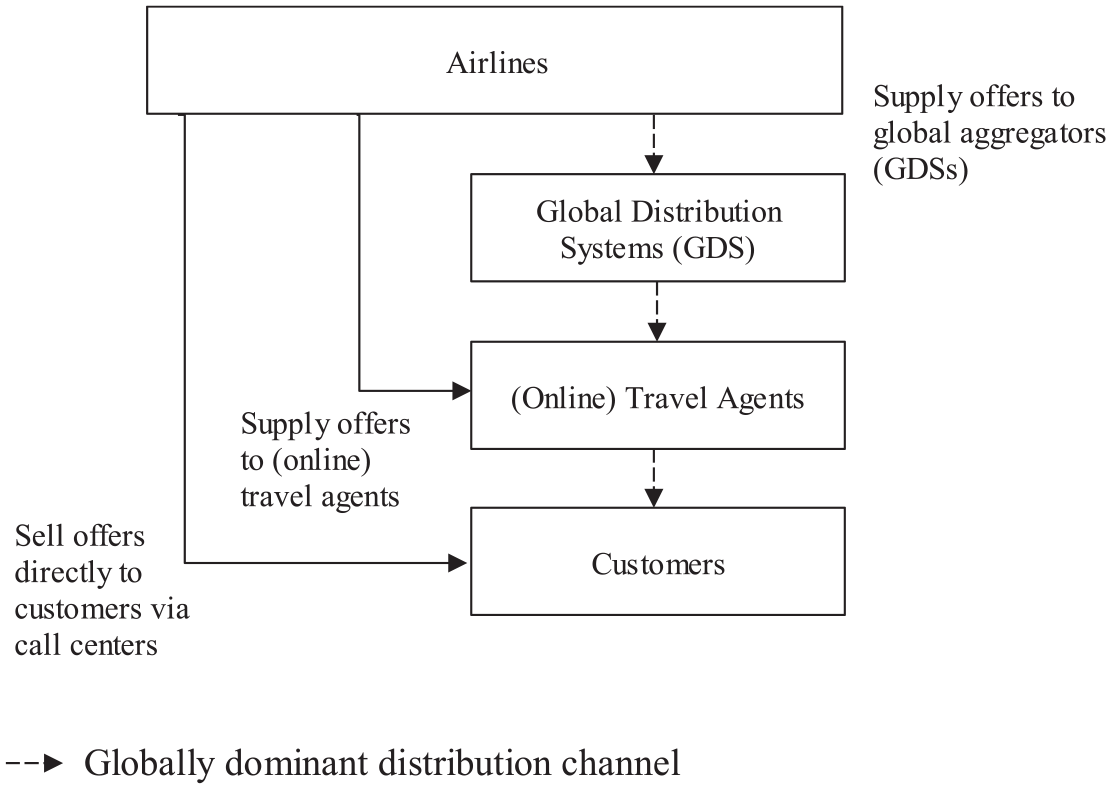
Flight-ticket distribution industry architecture.
Third, this sector and setting are appropriate because we can comprehensively and longitudinally analyse how the GDS bottleneck effectively eroded over a time span of 26 years.
Data sources and analyses
Our sources for data collection were (1) considerable archival data, including industry publications; (2) in-depth semi-structured interviews; and (3) internet sources and airline materials. The triangulation of data from multiple sources increases the reliability of our data (Eisenhardt, 1989).
This study was conducted in two stages. First, we accessed public news articles to identify airlines’ activities and developed activity profiles at the distribution interface. We manually reviewed 8,253 articles published between 2009 and 2020 and coded the airlines’ actions from these articles (Yu & Cannella, 2007). We manually reviewed and coded these articles to avoid pre-selection bias associated with keyword-based article screening and triangulated them with independent data sources written by knowledgeable industry authors to increase the likelihood of extensive data coverage (Yin, 2003). We use data from three leading airline industry publications: Aviation Daily (2008–2020), Phocuswire (2009–2020) and Skift (2012–2020). Aviation Daily is a well-acknowledged source of reporting on airline actions (Miller & Chen, 1994) and Skift, which primarily consolidates articles from Bloomberg and the Associated Press, extensively covers general industry developments. Phocuswire specializes in airline distribution, technology and marketing news. We excluded actions outside the scope of our research question (e.g. top management team changes) and duplicate announcements. The results of this first stage included 1,029 industry structure-shaping actions by 240 airlines, 3 providing a comprehensive picture of activity concentration (including date, geography, action type and individual airline engagement) along the airline distribution architecture between 2009 and 2020 (Tables 1 and 2). For this news item analysis, the first and third authors worked independently to identify eight distinct action types initially categorized as stability oriented (supporting the status quo) or change oriented (trying to change the status quo at the distribution interface). 4 The actions and action types we identified for airlines engaging at the GDS interface (Table 2) led us to realize that we needed to further investigate the strategic rationale underlying them.
Dataset descriptors: Airline actions at the GDS interface.
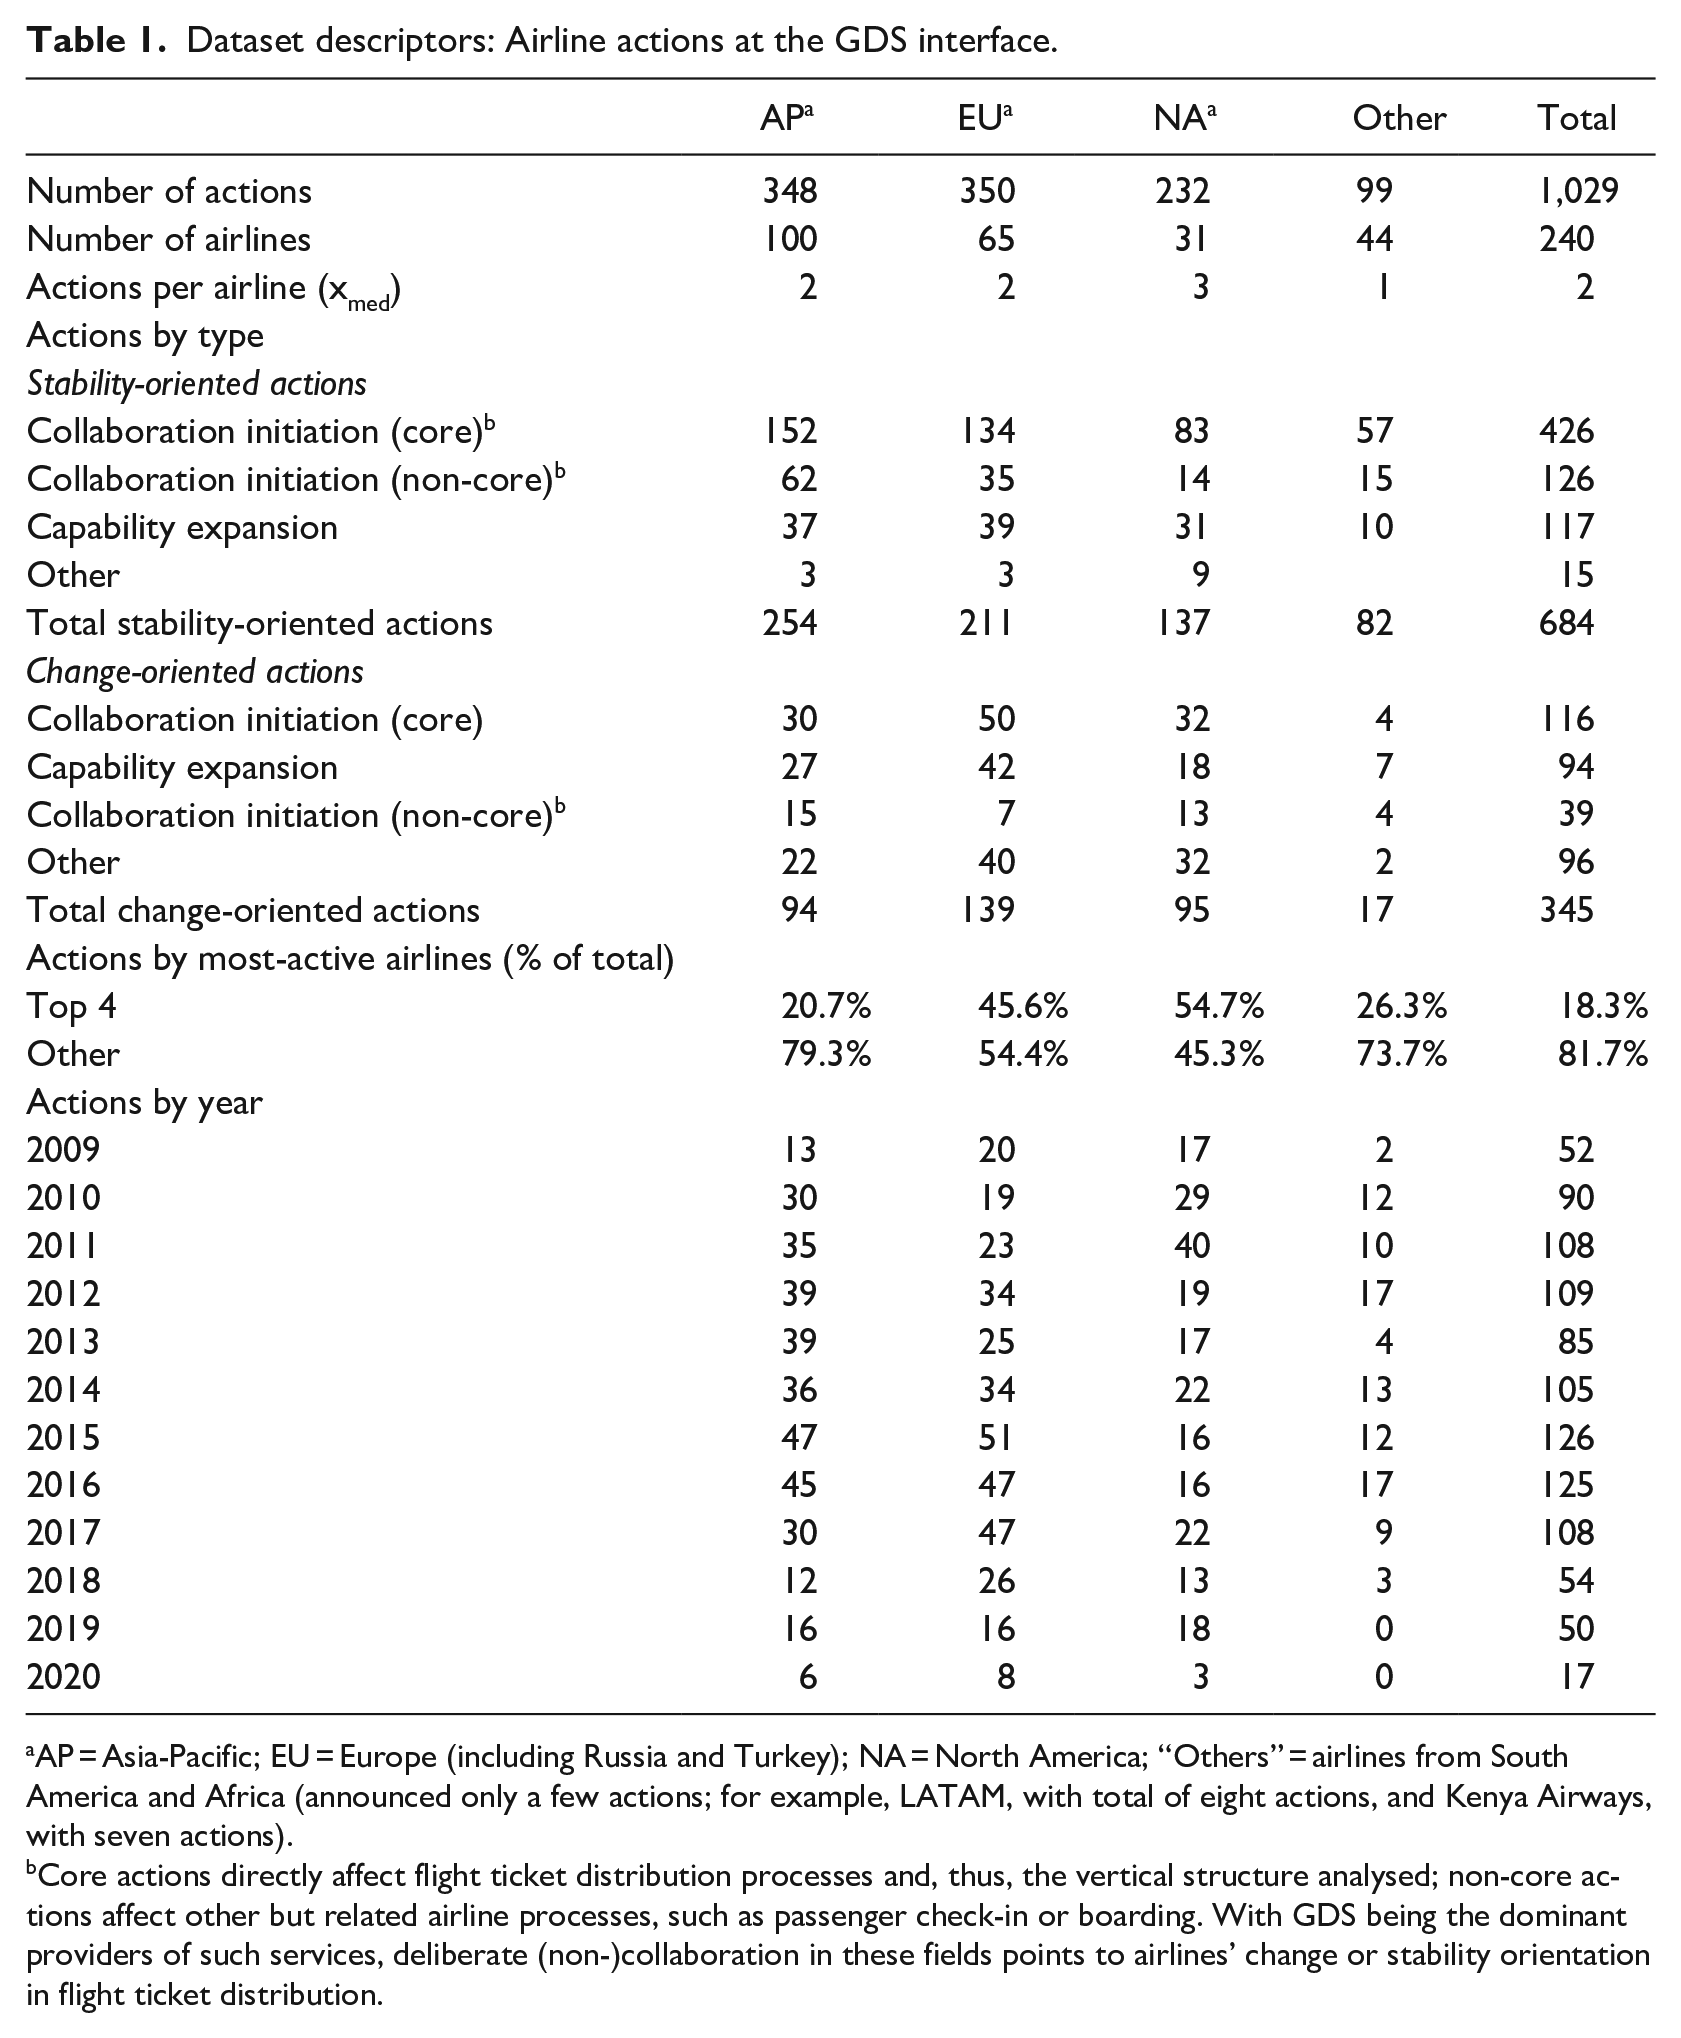
AP = Asia-Pacific; EU = Europe (including Russia and Turkey); NA = North America; “Others” = airlines from South America and Africa (announced only a few actions; for example, LATAM, with total of eight actions, and Kenya Airways, with seven actions).
Core actions directly affect flight ticket distribution processes and, thus, the vertical structure analysed; non-core actions affect other but related airline processes, such as passenger check-in or boarding. With GDS being the dominant providers of such services, deliberate (non-)collaboration in these fields points to airlines’ change or stability orientation in flight ticket distribution.
Action-coding scheme and action examples from news item analysis.
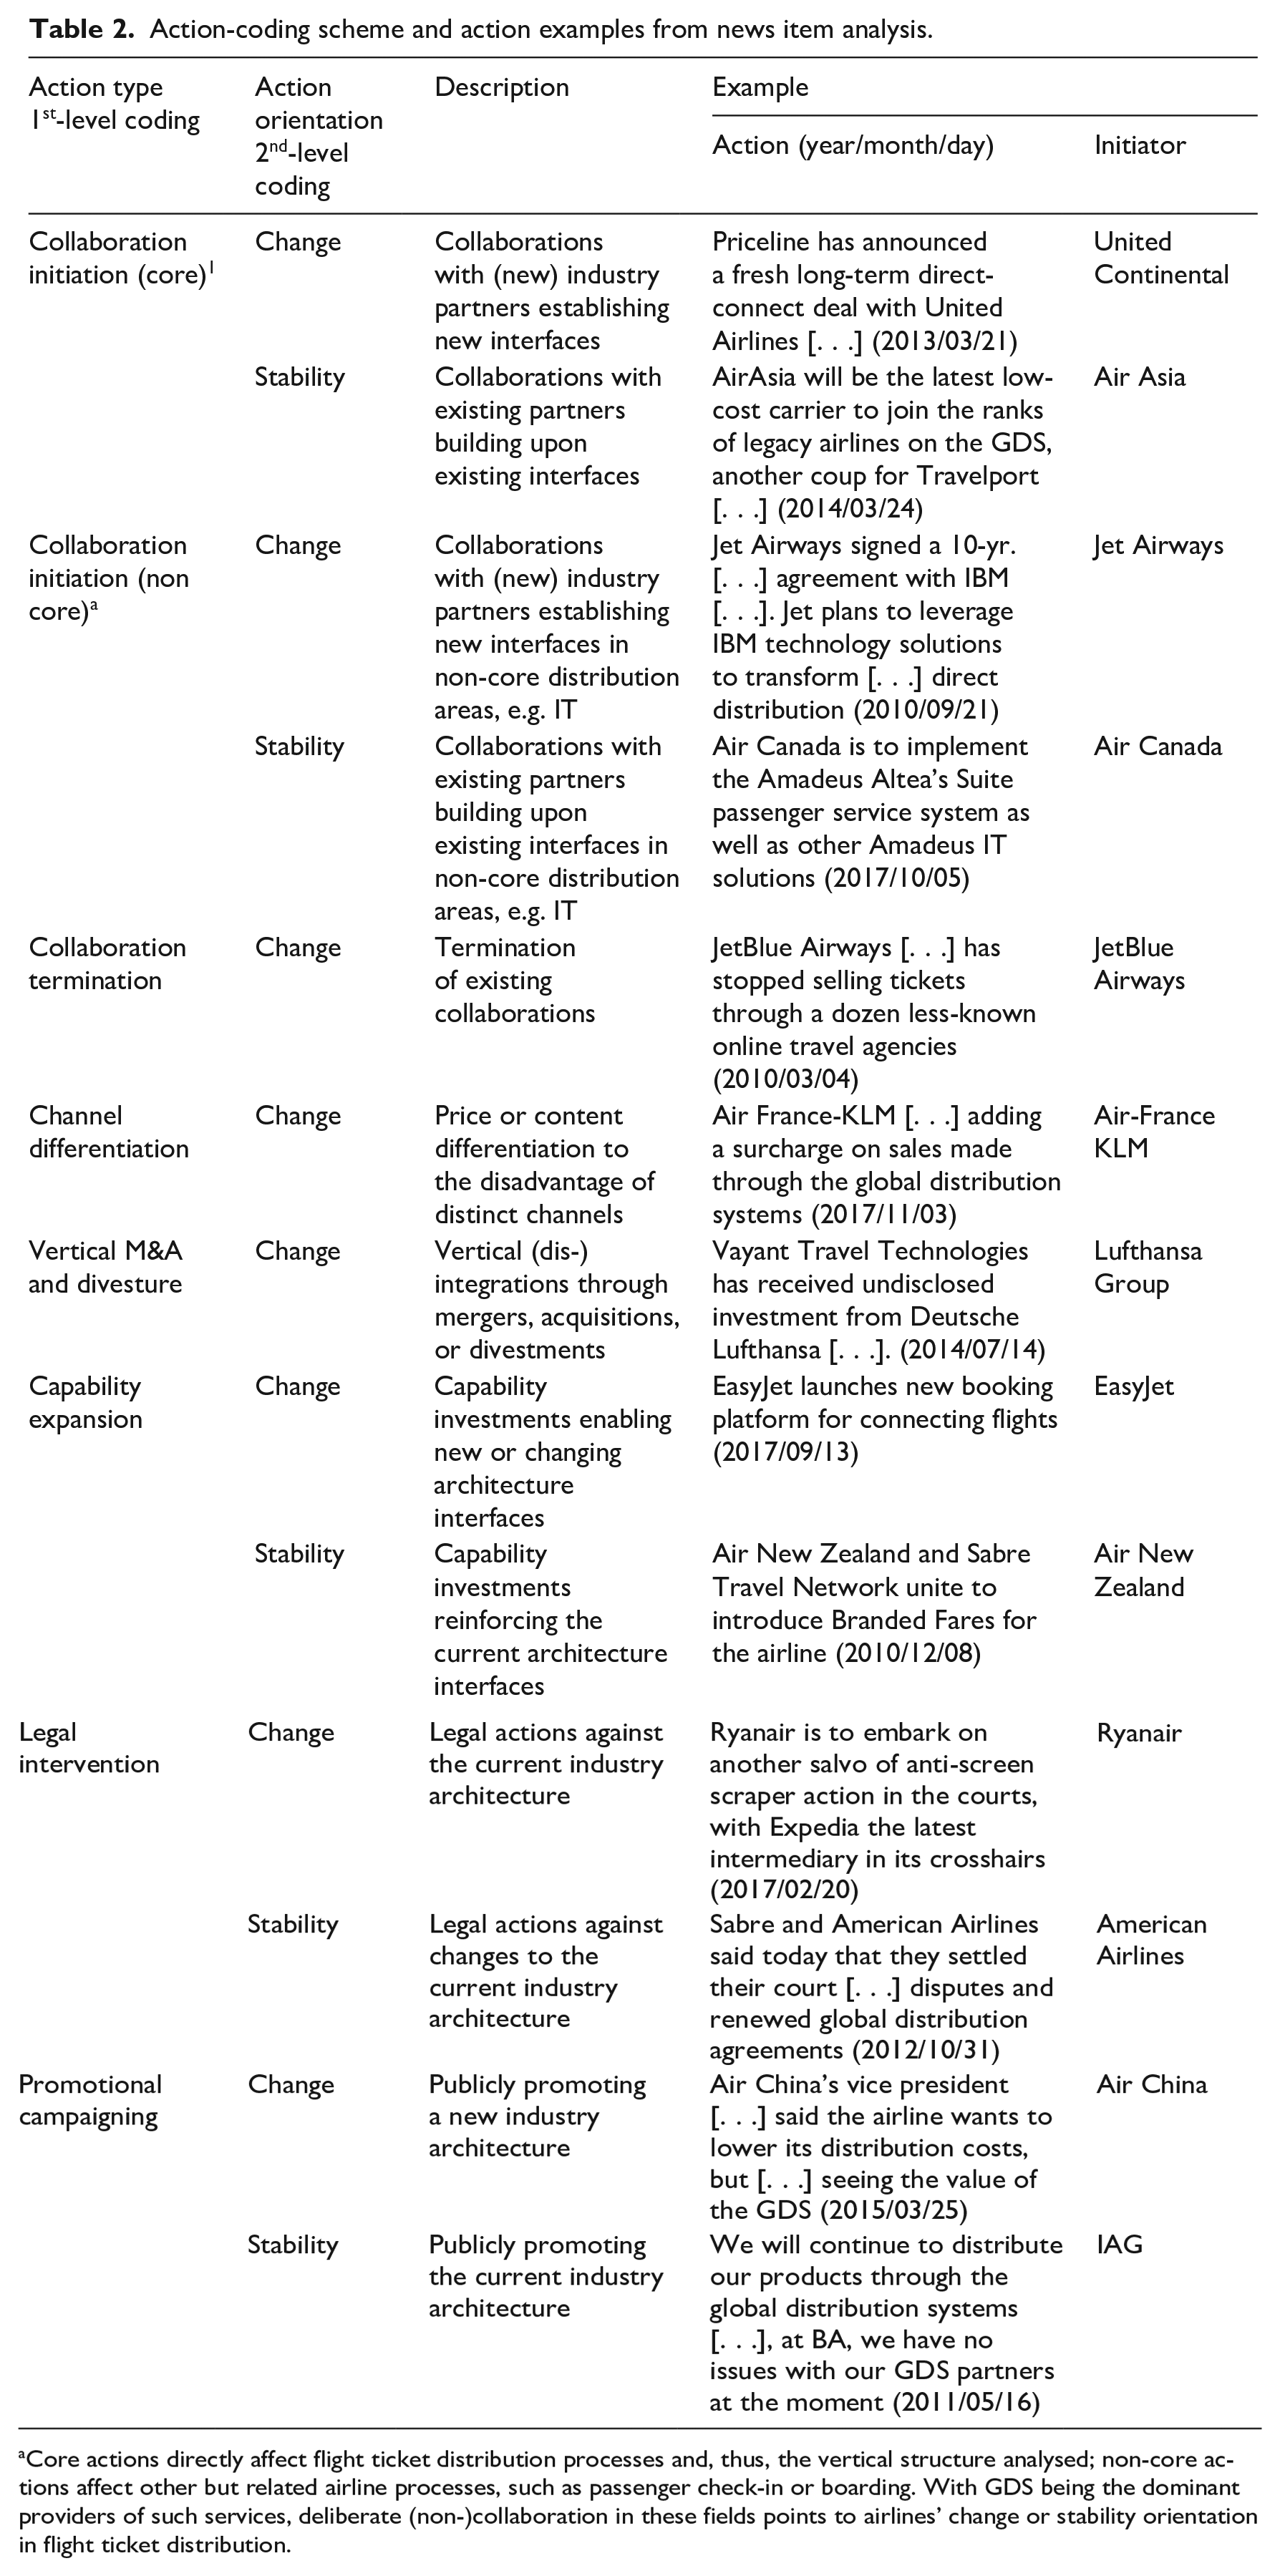
Core actions directly affect flight ticket distribution processes and, thus, the vertical structure analysed; non-core actions affect other but related airline processes, such as passenger check-in or boarding. With GDS being the dominant providers of such services, deliberate (non-)collaboration in these fields points to airlines’ change or stability orientation in flight ticket distribution.
To do so, in the second stage, we sought to comprehensively understand the nature and rationale of the actions that the GDS and airline segments engaged in. To understand these processes, we interviewed 13 senior industry experts from five continents regarding ticket distribution between 2021 and 2023. 5 All our interviewees had extensive industry experience; at the time of the interviews, 10 had been working in the airline industry for more than 20 years, and eight had more than 10 years of experience working in and around airline distribution (Table 3). The airlines that our interviewees were working for (or, in the case of consultants, that they had been working for before switching to specialized airline consulting firms) represented approximately US$150 billion in revenue in 2022, which corresponds to 20% of world airline revenue (IATA, 2022). We asked these experts about the current state of airline distribution, major actors, actors’ interactions, and how they described the industry changes over the last 20 years. To gain further clarification, we discussed with them the patterns we observed in airline activity.
Interviewee demographics.
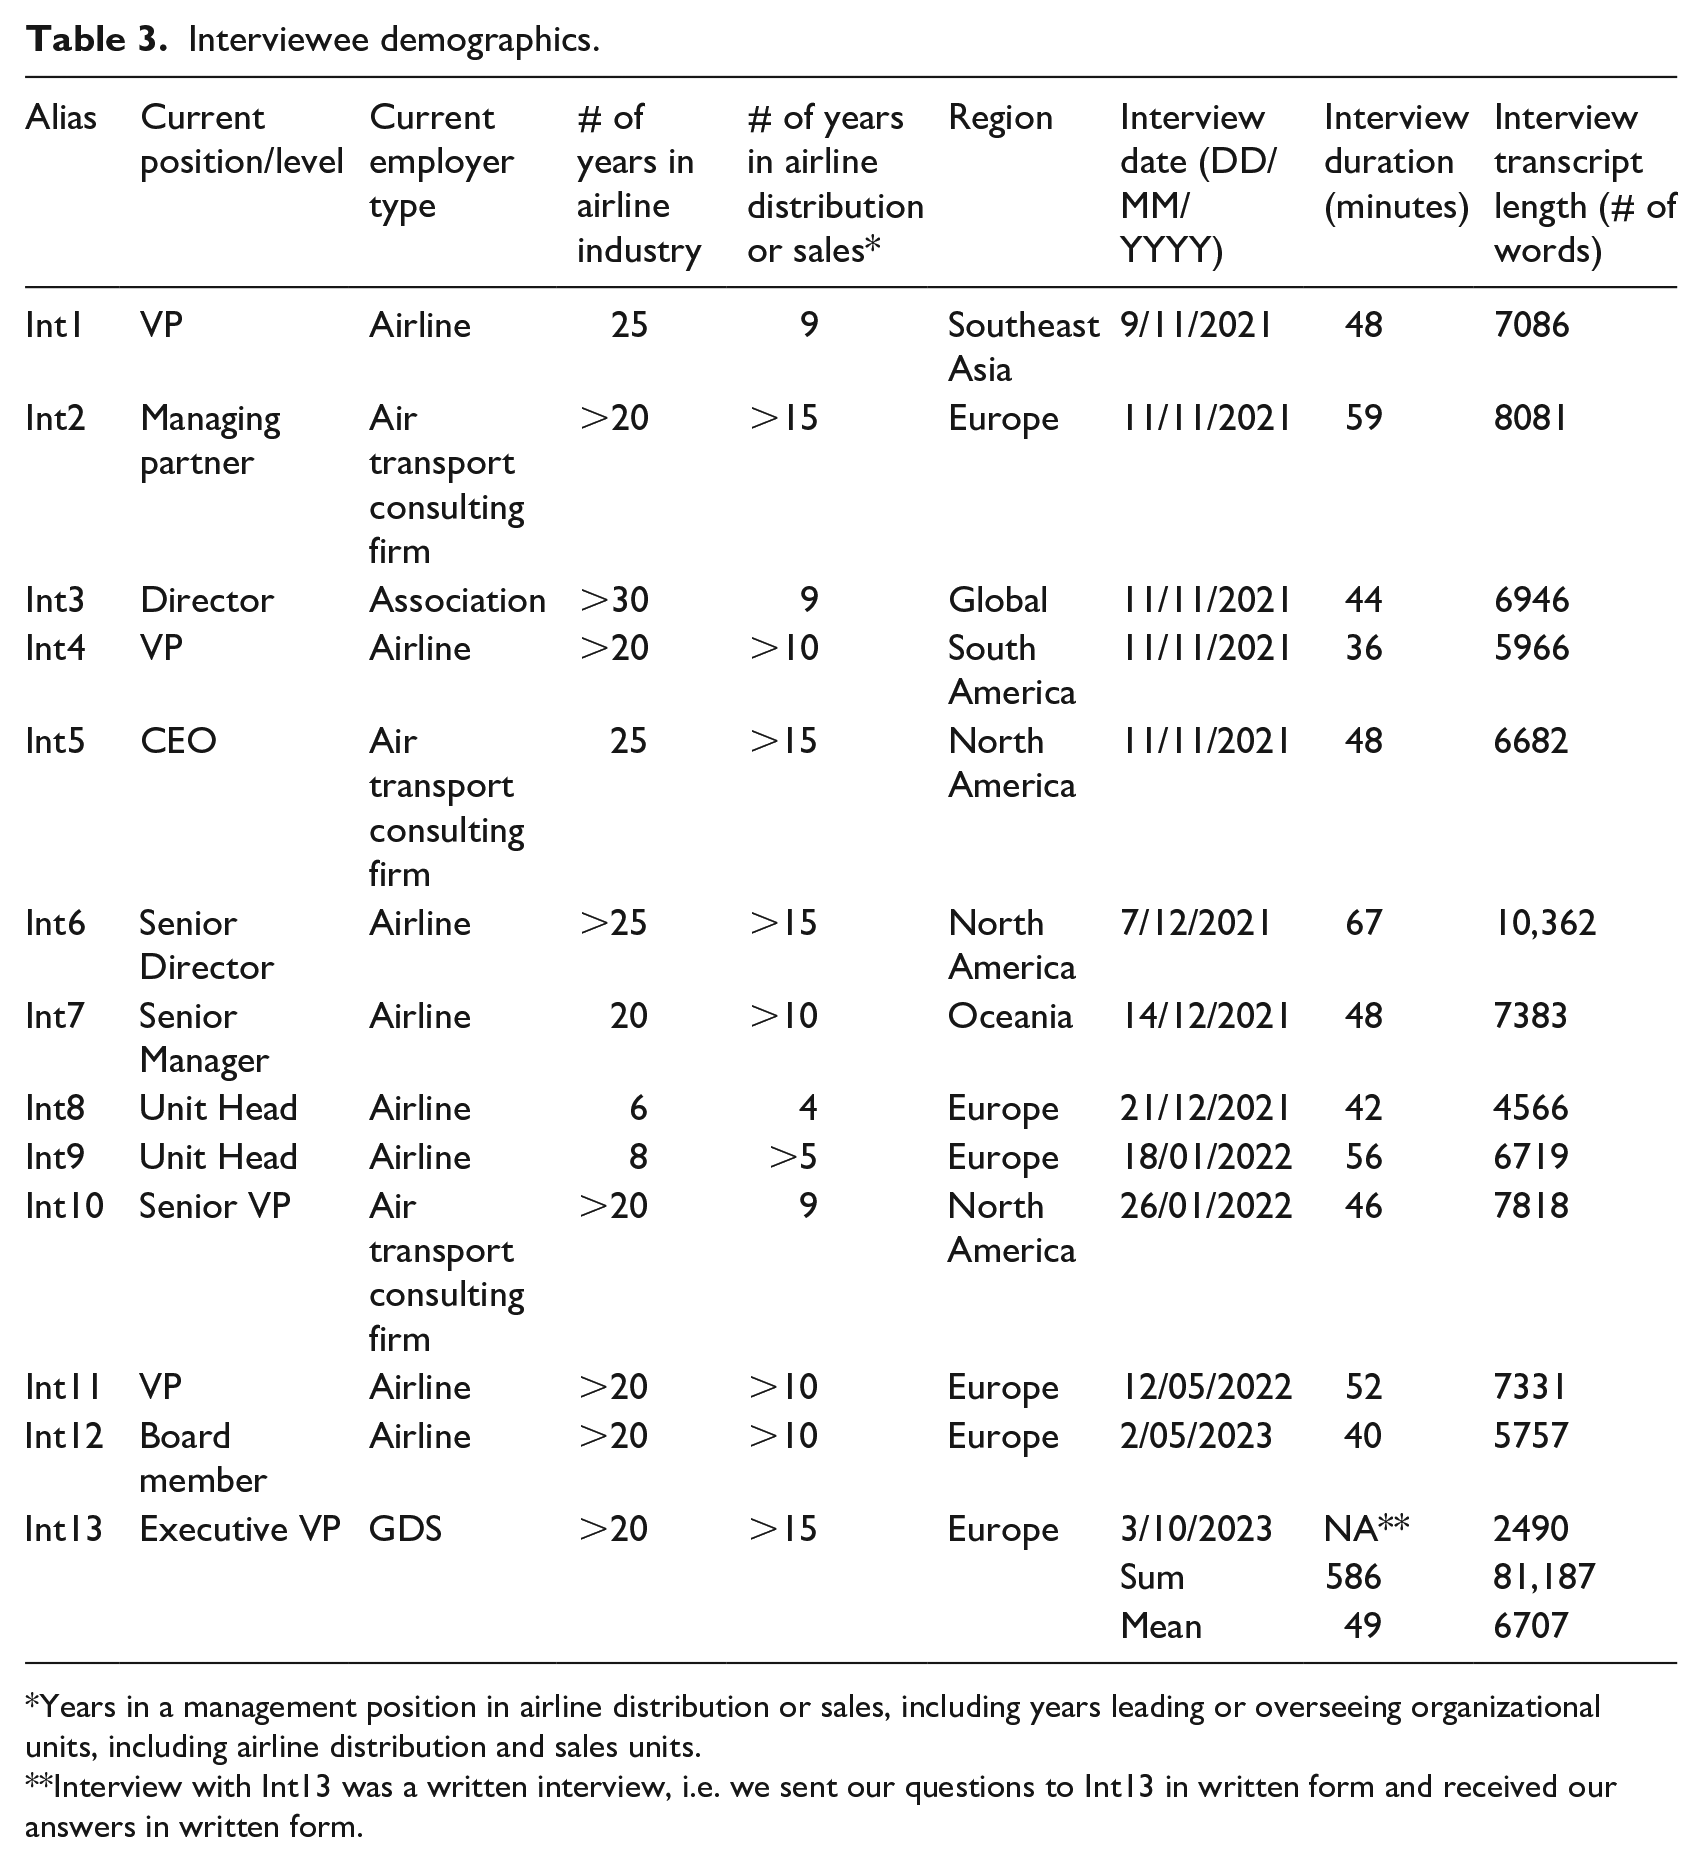
Years in a management position in airline distribution or sales, including years leading or overseeing organizational units, including airline distribution and sales units.
Interview with Int13 was a written interview, i.e. we sent our questions to Int13 in written form and received our answers in written form.
At this stage, the first two co-authors worked independently to identify emerging (primary) themes from the interview transcripts. We then met to discuss, amend and combine our analyses, and subsequently worked to order the key emerging themes from the interview data, which became our second-order themes. 6 These themes were grouped into overarching themes (Table 4, see Appendix) and definitions (Table 5, see Appendix). The primary theme, ‘You couldn’t [. . .] do much without essentially having to do something with all the GDSs simultaneously’, for example, became the secondary theme projecting internal cohesion under the overarching theme of maintaining power. Because the data were voluminous and complex, we divided these actions into four time-related phases and explained how they unfolded (see the Findings section).
Our coding of airline actions and interviews with senior experts provided a rich account of the stability and change efforts in this industry vertical. However, when analysing the interviews, we realized that we could better understand the changes at the airline–GDS interface if we extended the observation period to include the organizational and legal separation of the GDSs from their (former) airline parents at the end of the 1990s. Since the specialized newsletters Phocuswire and Skift began publication in 2009, we were unable to extend our fine-grained action analysis prior to this date. Instead, we relied on narrative accounts that we triangulated using articles from other publicly available travel industry publications, such as Airline Business and Travel Weekly.
Findings
The bottleneck at the airline–GDS interface dissolved in an inter-firm product-modularization process involving intense power dynamics and struggles between the major players. An initial tightly integrated situation of high complementarity and low mobility was replaced by a more modular, high-mobility situation that substantially reduced the bargaining power of GDS firms and their ability to appropriate value in a new industry architecture.
Our findings are organized narratively across four phases:
(1)
(2)
(3)
(4)
Each phase encapsulates a major shift in the power dynamics that emerged in airline ticket distribution between the bottleneck GDS and airline challenger segments.
Phase 1: Establishing the bottleneck (1996–2004)
The GDSs developed into a standalone segment when airlines divested from ‘their own’ GDSs in the late 1990s. The GDSs, as airlines’ internal technological and organizational interfaces, became external, independent interfaces (Int13). This phase started with the first GDS initial public offering (IPO): an initial 16% of Sabre was sold by American Airlines in 1996. The IPOs of Galileo and Amadeus followed suit in 1997 and 1999, respectively. By 2005, Sabre, Galileo and Worldspan 7 were free of airline control, and Amadeus’ founding airlines held less than 50% of the firm’s equity (N.N., 2005). A highly co-specialized interface was created between airlines and GDSs, which gave airlines virtually no alternative (low factor mobility).
Airlines divested stepwise from the GDSs for several reasons, the first being the strategic stance they took given the rise of the internet that made centralized reservation systems less relevant (C. Baker, 2005). Low-cost US carriers like Southwest penetrated the market based on internet-only sales, and the main US legacy carriers voiced their frustration about the GDSs blocking improvements in customer service and experience. As one interviewee put it, ‘From a distribution point of view, in the US, the biggest challenge they’ve got is the technical capability of the GDSs’ (Int3). Airlines also responded by creating their own online travel booking website, Orbitz, in 2001, a combined effort by American Airlines, United, Continental, Delta and Northwest to leverage the advantages of internet distribution.
The second reason airlines divested from the GDSs was economic. The GDS IPOs allowed airlines to cash in on the market’s GDS valuations and gain liquidity, an especially important need following 9/11, which pushed virtually all major US airlines into Chapter 11 bankruptcy. For European airlines, the continued success of their low-cost competitors that had ‘no relationship with GDSs. Nothing with travel agencies. Nothing’ (Int4) put pressure on them to reduce their costs.
Even though the airlines had spun off the GDSs, creating a stand-alone GDS segment, GDSs still accounted for nearly 100% of sales. Thus, the airlines remained largely dependent on them, which allowed the GDS bottleneck to establish and solidify. The GDS entities exploited their dependence. As Int10 recalls: The GDS [can] pick and choose, you know, how they want to treat certain airlines. And if you, as an airline, go to them and say, I want that deal, they’ll say, ‘Oh, no, you don’t, you know, they’re mostly a domestic airline and, you know, they’ve got some restrictions, blah blah blah. You don't want that deal.’ And you’re like, ‘Yes, I do. I’m pretty sure that’s what I want.’ And they won’t give it to you. [. . . And] if you said, ‘I’m going to pull out, I’m done, I’m not going to be in your GDS anymore,’ the GDS is just going to sit back and cross their arms or say ‘OK, good luck!’
To reduce their dependence on GDSs, some airlines began to actively explore internet-based distribution options; however, these efforts did not develop as quickly as analysts had projected (C. Baker, 2005).
Phase 2: Defending the bottleneck (2004–2010)
Airlines were becoming increasingly frustrated with the existing architecture because it did not allow them to reduce their distribution costs. GDSs were seen as ‘big players who connected [. . .] airlines via a more or less proprietary interface [. . .] sitting like the spider in the network’ (Int2). The airlines felt that they were ‘reliant and dependent on GDSs’ (Int2). Airlines responded in one of two ways: by disengaging from the GDSs or encouraging low-cost GDS competitors to enter the industry. During phase 2, the airlines experimented with building friction in the existing distribution structure. For example, in North America, JetBlue withdrew some of its fares from GDSs at the end of 2004, and Air Canada followed suit in 2006 (Compart, 2004, 2006). Others imposed a ‘GDS cost-sharing fee’ for flights booked through the GDSs, such as Northwest Airlines in 2004, American Airlines in 2006 and Lufthansa in 2008 (Jaccarino, 2006; Pilling, 2008; Schaal, 2006). Some airlines promoted low-cost global new entrants (GNEs), such as Farelogix and Travelfusion, to replace the GDSs. Airlines welcomed these entrants as restraints to the ‘oligopolistic tendencies that have seen booking fees (to GDSs) rise, year after year’ (Clarke & Tunnacliffe, 2005). United Airlines ‘publicly indicated it would be willing to share up to [US]$5 of [GNE-induced] savings per ticket with its travel agents’ (Clarke & Tunnacliffe, 2005). In addition to creating this friction within the legacy system, airlines worked together to eventually overcome the GDSs’ dominant positions by launching a variety of initiatives to build their confidence and integrate their learning (building integrative confidence). On the collective level, Star Alliance, one of the three leading global airline alliances, announced in 2005 that it was ‘seeking alternative channels to global distribution systems such as Amadeus, Cendant (Galileo), Sabre, and Worldspan through so-called GDS new entrants’ (N.N., 2005).
As the industry dynamics and airlines’ initiatives picked up speed, GDSs began to fortify their bottleneck positions (C. Baker, 2005) by leveraging their bargaining power and leveraging aligned incentives for adjacent segments. For example, they agreed to airlines’ demands to lower their booking fees but only if airlines agreed to provide the same offering to all GDSs (parity) and agreed not to offer different fares to GDS and non-GDS distribution channels (full content clauses), which effectively prevented any channel differentiation. GDSs also responded by catering to travel agents and offering them additional financial incentives for booking through GDSs at a time when airlines had begun cutting costs by reducing or eliminating commission payments to ticket-issuing travel agents.
However, the individual and collective airline efforts to build power momentum soon began to wane. JetBlue and Air Canada did not continue their initial withdrawal from the GDSs, and the Star Alliance initiative was unsuccessful. Not all efforts failed, though. In major renegotiations in 2006 and 2007, US carriers extracted major concessions from the GDSs. As Int2 said, ‘I don’t want to say it solved their [US carriers] cost problem, but it really reduced their pain.’ However, these negotiations only benefitted US carriers, while ‘the rest of the world was in a situation where their booking fees had become an even higher share of their costs of sales’ (Int2). In addition, XML became the online commerce standard for sales via airline websites (Int5). A GNE firm, Farelogix, provided their XML distribution schema free to airlines. This became the springboard for the New Distribution Capability (NDC), the new standard endorsed by the International Air Transport Association (IATA).
During this period, the XML standard and other developments placed more pressure on GDSs to introduce greater product and technological heterogeneity, even though airlines still used the established standard of the GDS legacy systems to distribute most of their tickets. The complementarity of their co-specialized assets remained high. The internet and new entrants, however, started to increase factor mobility and the push for greater modularity picked up speed as well. Technologies were introduced that connected airlines with travel agents and consumers and allowed them to book directly with airlines. These viable alternative factor combinations for ticket distribution decreased airlines’ dependence on GDSs and started to undermine the GDSs’ bottleneck. The GDSs responded with carrot-and-stick mechanisms to maintain power: they increased the number of restrictions in their contracts, tightened the rules for airlines and travel agents, and introduced financial rewards to encourage airlines and travel agents to conform. Thus, the balance and concentration of power at the GDSs kept the bottleneck intact, and negative feedback (Jacobides et al., 2006) was guaranteed for any firm trying to change the architecture. In this scenario, individual airlines had little chance of making a dent in the system architecture, as one of our interviewees articulated: ‘[There] are 250 airlines in the world, but only three GDSs. It is pretty clear that one airline, or two or three, will be able to move zero if you want to circumvent or penetrate this Chinese wall’ (Int11).
Phase 3: Breaking the bottleneck (2010–2017)
As the internet became increasingly sophisticated and online commerce grew, airlines realized the potential of a direct sales channel: lower distribution costs, greater freedom to create and differentiate, and better opportunities to display their offerings to customers. Airlines escalated their efforts to analyse and exploit these opportunities. The XML distribution schema step was followed by airline sales departments, individually and collectively, to leverage further opportunities.
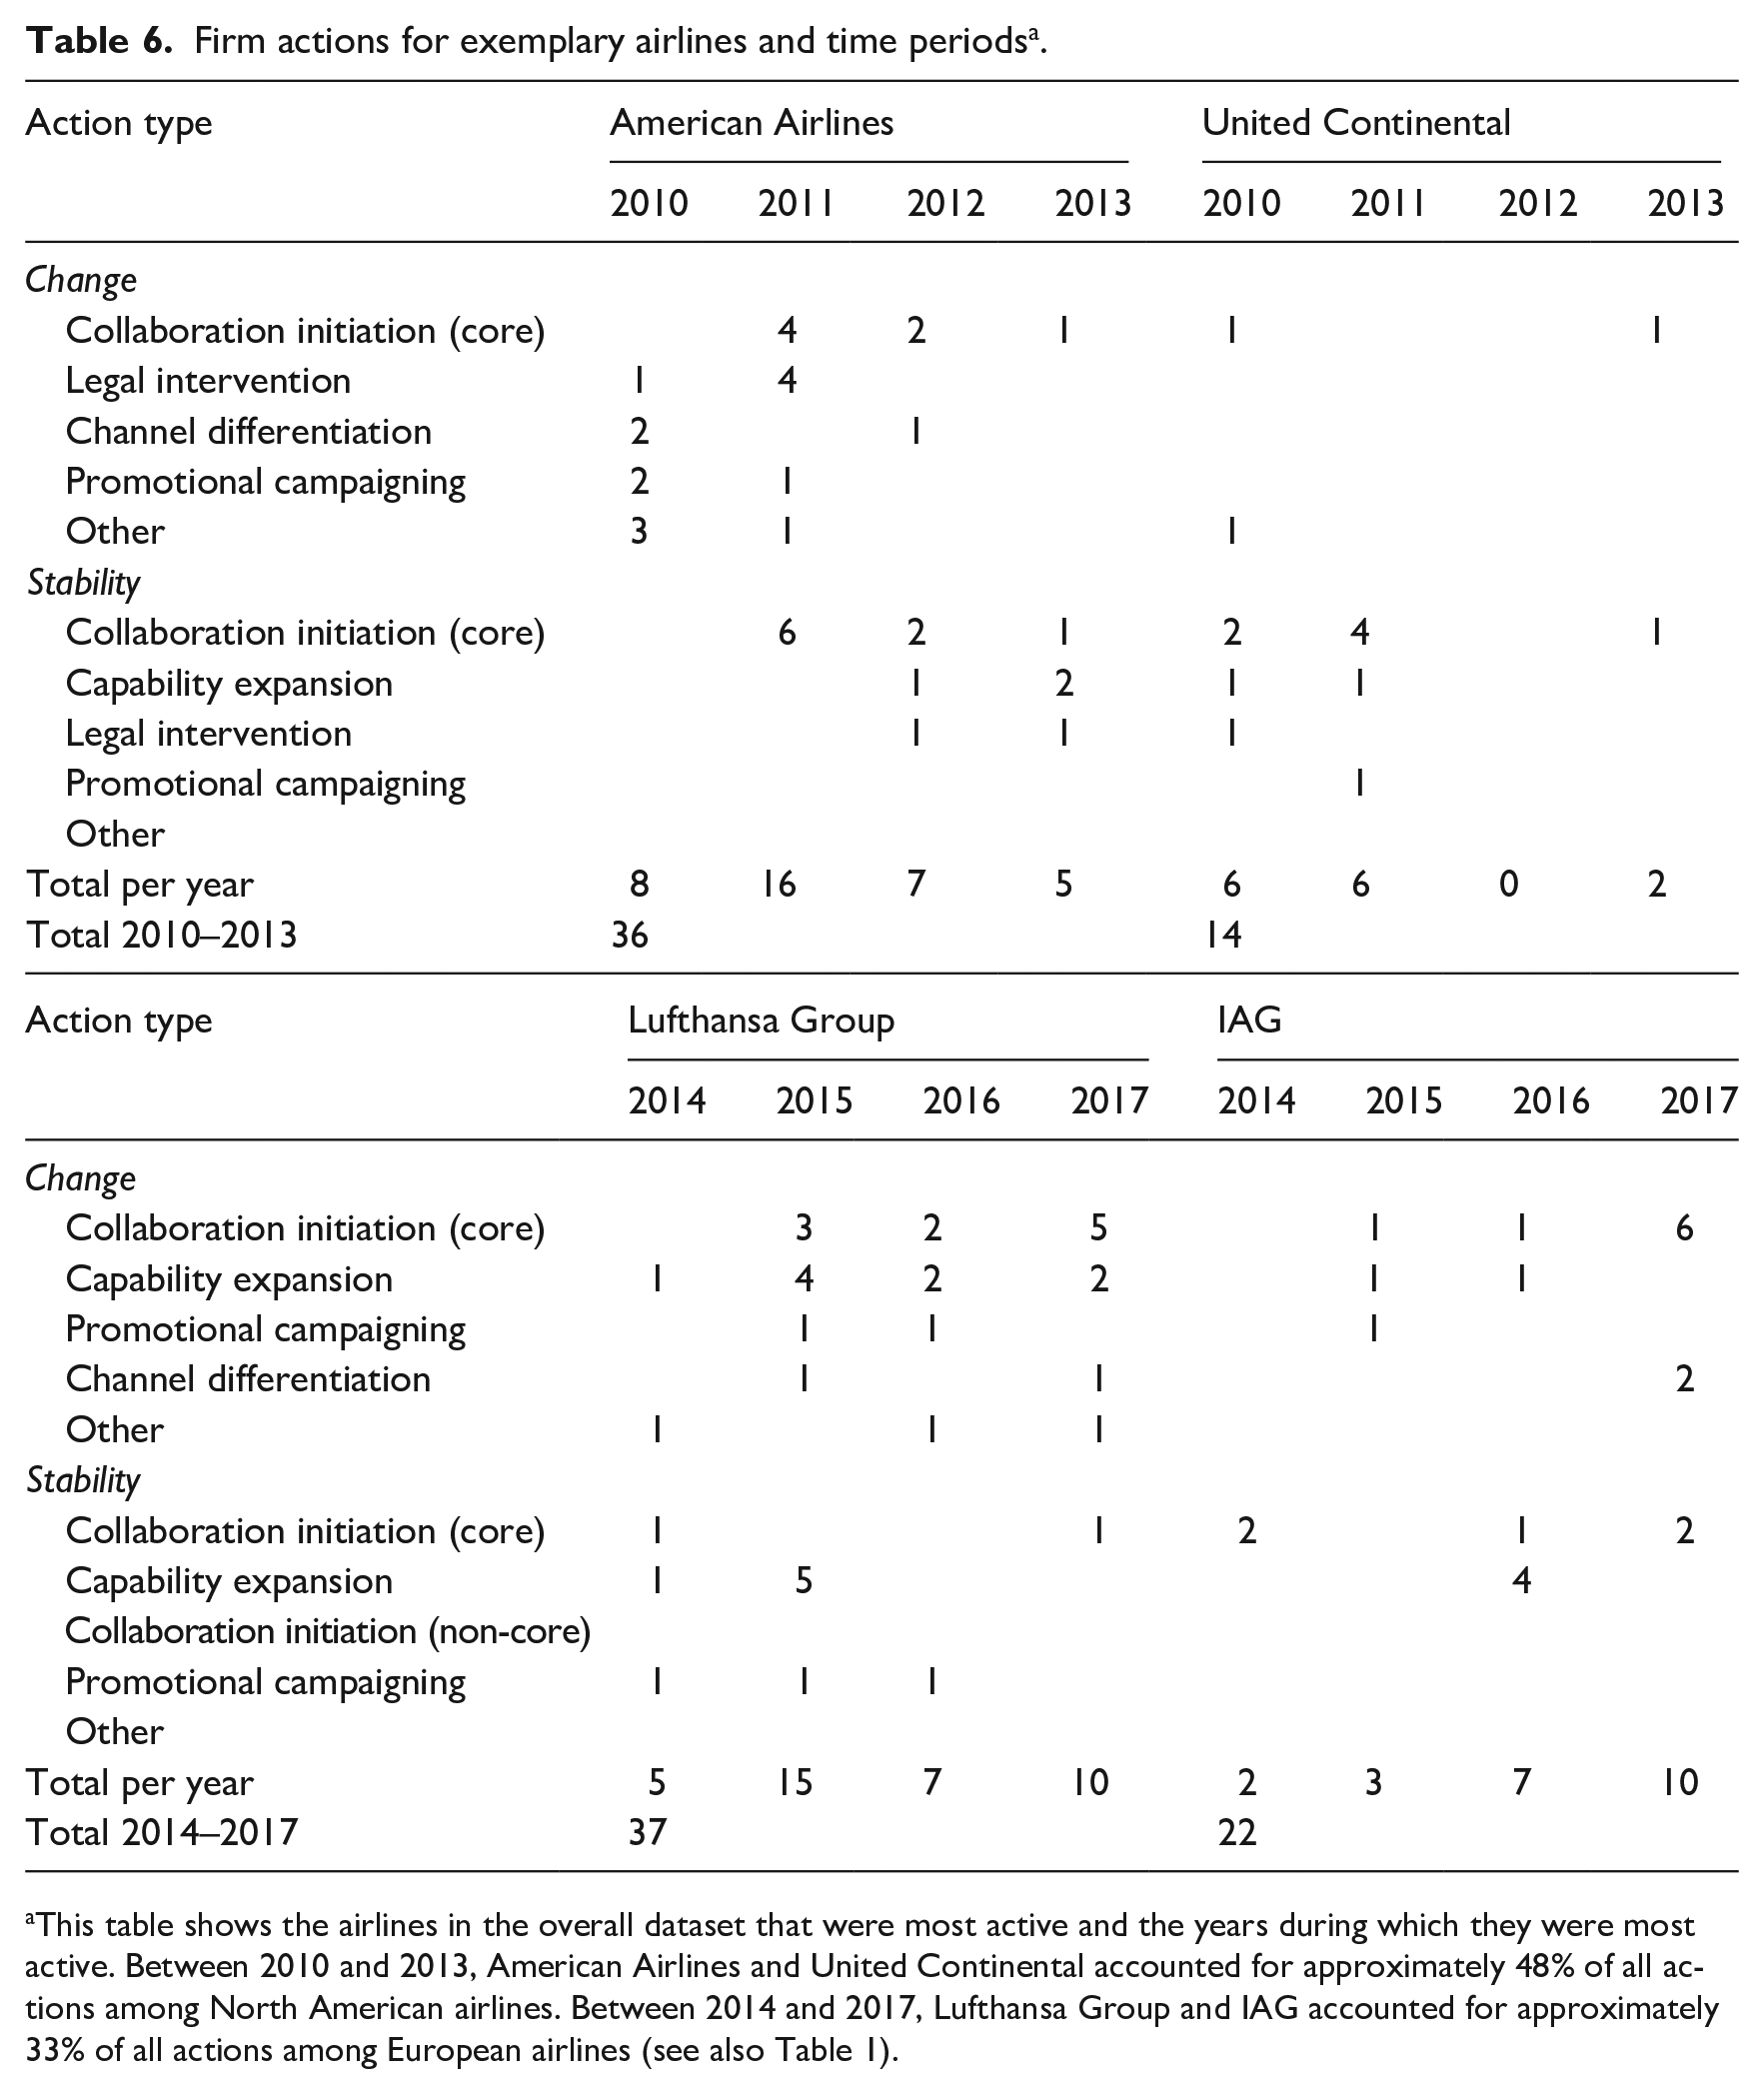
North American airlines were the most active in pushing back against the GDSs (GDS interface-related actions; Table 1), especially during 2010 and 2011, when nearly one-third of these actions (69 of 232) took place. However, the GDSs fought back and, ultimately, the airlines had to back down. American Airlines was the airline pushing the hardest for structural change, and its ‘fights with Sabre and Travelport’ (as Int5 stated) were efforts to bypass the GDSs and establish a direct sales channel to travel agents. Table 6 (see Appendix) shows that American Airlines made 22 change-oriented actions between 2010 and 2013, including its collaboration announcements to distribute optional flight services through direct connect channels (N.N., 2010a); news that it was hiding specific content from traditional (i.e. GDS) sales channels (Schaal, 2010); adding a surcharge to certain GDS bookings made through travel agents (N.N., 2010b); and suing Sabre and Travelport over display bias, booking fee increases and monopoly power abuse (Schaal, 2011a, 2011b). Sabre, among others, immediately retaliated (Bingemer, 2018; Kirby, 2011), and these responses were effective in muting the airline’s actions, since 2013 was a quieter year for American Airlines. The airline settled its lawsuits, renewed long-term distribution agreements with GDSs and made all its content available on the GDS channels (May, 2012, 2013; Schaal, 2012; Sorenson, 2013). This flexibility in airline responses was also true of other airlines: United Continental renewed its distribution agreements with GDSs to sell all – and in some cases, exclusive – content through their channel (N.N., 2011a, 2011b, 2011c; Schaal, 2011c), accommodating actions that were directed at maintaining stability at the interface.
At the airline industry association (IATA) level, airlines explored their opportunities and options for distributing tickets via internet- and XML-based solutions. The first working groups were formed in 2010 and focused on avoiding commoditizing airlines’ products by improving the technical standards for distributing tickets (Int3). Int6 recounts that around 2010, ‘approximately seven airlines and IATA started discussions [on] how to modernize distribution standards through internet-based technology [. . .]. What can we do with this? And then it got really solid, and we put a name on it: NDC. And it was launched under resolution 787 or something like that, and it became a real thing.’
The GDSs recognized the threat posed by the NDC and how it would erode their bottleneck positions. In the lead-up to the 2012 IATA Passenger Service Conference, where the standard would be discussed and debated, the GDSs collectively projected internal cohesion and pulled out all the stops to prevent the NDC from becoming a new standard. They worked overtly and covertly, applying ‘massive pressure’ and engaging in ‘massive lobbying to the regulators, massive lobbying to the travel agency community’, as one of our interviewees reported. In their lobbying effort, both in the US and the EU, the GDSs were ‘accusing [. . .] the airlines of colluding against the GDSs’. As an interviewee put it, the GDSs were ‘100% resistant. They were fighting it’, and described the period between 2011 and 2014 as ‘World War III’.
When IATA endorsed the NDC at the 2012 conference, it was a catalytic moment for the airline industry, which had built and showed integrative confidence because it established a standard independent of the GDSs, enabling a modular interface. One interviewee described this as a watershed event because it broke the GDSs’ chokehold. The NDC ‘completely disrupted an environment where they [the GDSs] were in a situation of oligopoly . . ., making lots of money’ (Int3). It was only in 2014, when the US Department of Transportation approved NDC Resolution 787, that the GDSs’ resistance started to fade.
As an important milestone and watershed, the approval of the NDC standard was only a precondition for breaking the GDSs’ bottleneck; on its own, it was not enough to do so. Travel agents had little incentive to opt for direct connections with airlines with or without a standard. Stickiness in resource use became apparent with the penalizing effects of industry standards and the legacy financial architecture still effective. NDC adoption was mentioned as extremely low, or ‘a trickle’, affecting some ‘0.1 percent of your business every month or whatever’ (Int6). This senior airline executive feared that if airlines did not act fast and keep the momentum of the NDC going, ‘this could die before it gets off the ground because the change is so slow. [. . .] We knew that if we didn’t have a significant groundswell of major global network carriers, this would die a miserable death quickly’ (Int6). Legacy technology was an important sticking point in preventing change, as airlines became painfully aware. They realized how difficult it was for them to change the systems that had been built up over decades. One airline VP with over 20 years of experience described these legacy effects: ‘. . .every single airline [. . .] pretty much everyone uses Sabre or Amadeus as a host; the websites are all built on top of this, and they have layers and layers and layers and layers of technology’ (Int4). As Int2 described it, the NDC gave airlines an opening – the potential – for breaking the GDS bottleneck rather than the solution for doing so: ‘For many airlines, particularly the ones that are more aggressive towards the GDSs, NDC has served as a way to create negotiation leverage and a way to shift volume away from GDSs.’ However, to shift ticket sales away from the GDSs, the airlines needed to establish a viable alternative distribution interface and do more to incentivize travel agents to move away from the financially attractive GDS distribution process because, beyond the GDSs, airlines had only a trickle of power.
European airlines had the most to gain and the least to lose from the NDC and from breaking the GDS bottleneck. Not only were they facing headwinds from low-cost carriers that did not rely on GDSs and were eating away at their market share, but they were also paying high GDS fees. This high pressure for modularization meant that European airlines, most prominently the Lufthansa Group and International Airlines Group (IAG; see Table 6 in the Appendix), initiated a third wave of resistance and built momentum to break down the GDS bottleneck. In 2015, the Lufthansa Group announced its ‘distribution cost charge’ policy (Jaccarino, 2006; Silk, 2015). Under this policy, travel agents had to pay an extra €16 per ticket for tickets sold via GDSs, compared to being charged no extra fees for direct connect bookings, a move clearly designed to incentivize travel agents to bypass GDSs when making Lufthansa bookings. Those working in the airline industry described this move as unexpected and ground-breaking: ‘Every airline in Europe kind of turned their head and said, “What did you just do?”’ (Int6), and Int5 described how the Lufthansa surcharge strategy ‘raised the bar on how aggressive airlines could be with rolling out their own strategy. . .’. Int10 said: I think when the history books are written about the distribution story, Lufthansa will play a big part in this because they said, ‘Enough! I’m not going to do full content anymore. I want freedom to sell my product the way I want to sell it.’ And they went out and made a huge change to the industry.
Lufthansa performed 25 additional change-oriented actions between 2014 and 2017, including establishing new partnerships with direct-connect technology players (e.g. Datalex and Concur) and carrying out direct-connect initiatives with travel agents (e.g. HRG; May, 2015; N.N., 2015; O’Neil, 2015a). IAG also made changes, engaging in 13 change-oriented actions such as entering into partnerships with Skyscanner, Concur and Vayant to foster NDC adoption (N.N., 2016, 2017; O’Neil, 2015b) and announcing in May 2017 its own GDS surcharge for British Airways and Iberia flights (M. B. Baker, 2017).
The combined effect of several escalating events gave Lufthansa the confidence it needed to act boldly and thus build further integrative confidence: the emergence of a new industry standard, the GDSs’ fight against it, and pioneers pushing for the adoption of direct-connect technologies. The airlines’ accumulated confidence led to Lufthansa’s engagement in power-based enabling actions that included risky strategies. Lufthansa’s strong competitive position in relatively large home markets cushioned it from the potential penalties it might have faced from being excluded by GDSs. Combined with the competitive pressure they were facing from low-cost carriers, this position gave them a perceived urgency to act and ‘endure’ the financial penalties that came with their bold move.
This power-shifting momentum of European airlines, reflected in their activities from 2014 to 2018 – during which 179 of the 464 worldwide actions occurred in Europe – reached full flow after years of moderate, largely stability-oriented actions between 2009 and 2013. Yet the 2014 to 2018 period was also one of response flexibility: Despite imposing a surcharge in 2015 for sales made through GDSs, Lufthansa shortly thereafter enabled GDS-facilitated channels to display its plane seat maps (Schaal, 2015a) and collaborated with Amadeus to make their new branded fares available through the GDS channel (Schaal, 2015b).
Combined, these developments and strategic moves in the airline distribution industry – the internet and the advances in technology and opportunities it presented for online commerce, increased factor mobility and input heterogeneity – threatened GDSs’ established bottleneck. For both sides, the stakes were massive, and the activity in this period can be seen as a tussle back and forth between interface adaptation and increased modularity. Airlines achieved piecemeal successes in undermining GDSs’ strongholds with their individual initiatives testing technological alternatives. The GDSs responded by exploiting their bottleneck position and reinforcing their role as gatekeepers, both for information and financial flow, by imposing more restrictive and controlling contracts with airlines and increasing financial penalties for airlines that tried to evade them. At the industry association level, airline pioneers began collective efforts and initiatives to establish alternatives to the existing standard. Thus, the GDSs went from fending off isolated direct attacks by individual US and European airlines to fighting a more global, collective movement of airlines that were building integrative confidence and pushing strongly in full flow momentum intensity to increase factor mobility.
Phase 4: Towards a new balance (2017–2021)
During phase 3, airlines took several essential steps to break the GDS bottleneck, and the GDSs worked hard to maintain their bottleneck for as long as possible. By 2017, the GDSs’ resistance was fading and their power waned. One interviewee imagined what the GDSs might have been thinking at this point: ‘I think [the] GDSs were realizing, this isn’t going away. “We thought maybe we had slowed this down enough that it would disappear, but these stupid airlines don’t know when they’re beaten and they won’t give up”’ (Int6).
In fact, it was the GDSs that were giving up their official resistance. At the 2017 IATA conference, the GDSs officially announced their support for the new NDC standard. Starting in 2017, airlines via IATA shifted their attention from supporting the NDC to implementing and adopting it. An IATA brochure outlined this shift and the plans for implementing it: ‘The focus of the NDC program has moved from capability to promoting critical mass adoption and this will cover the period from 1 Jan 2018 to 31 Dec 2020. The longer term vision is for mass adoption in 2025’ (IATA, 2019). Our action analysis found that between 2017 and 2020, airlines around the world announced that they were adopting the NDC or entering NDC-based partnerships, including Air Canada, American Airlines, Delta, Emirates, LATAM, Qantas and Singapore Airlines. IATA provided support by creating an airline leader board of a group of 20 global airlines committed to using an NDC channel for 20 percent of their transactions by 2020 (Int6; IATA, 2019). Despite the Covid pandemic, airlines reported that they had achieved this objective (IATA, 2021).
During this period, Lufthansa and other airlines continued to build momentum and followed through on their initiatives to build and capitalize on non-GDS channels. An interviewee recounted how risky Lufthansa’s position was and how much determination it took them to maintain that position. Being the only airline taking that position becomes a bit uncomfortable, and it does not help that those that are against [that] move keep on telling everybody that Lufthansa is on a lonely path [. . .] It has taken 1½ years until the first airline started [to follow them], or even two [years]. (Int11)
Int11 is referring to Lufthansa being joined by another airline: ‘It’s not long after that came IAG, and then I think the world was watching very closely as Lufthansa and IAG persisted with their strategy’ (Int5). Airlines on all continents followed suit and took a tougher stance towards the GDSs. In 2021, Emirates began adding surcharges for flights booked through GDSs (Int2); soon after, Avianca (South America) and Hawaiian Airlines did the same. While some of these moves – such as Hawaiian Airlines’ – was more symbolic than influential, these moves were part of a pattern of growing momentum, as Int10 noted: ‘Now I know it’s Inter-Hawaiian, so who cares, right? It’s not that big, but it’s a shot, right? It’s a stake in the ground. This is just the beginning.’
The successive effect of these moves indicated to the GDSs that ‘the balance of power is shifting’ (Int10) and that the momentum intensity was approaching full flow. The cumulative effect of multiple airlines taking the same position indicated just how far the balance of power had changed, as Int2 remarked: . . .the worst thing that could happen was always that Amadeus said ‘Well, we’ll just switch you off‘, or Sabre would say ‘We’ll just switch you off’. And that’s really changed, where some airlines said, ‘You know what? I’d rather not be in your system [. . .] than paying through the nose.’
Int11 claimed that the balance had shifted even further: ‘This is done, this is history. For the GDSs, they only have the remaining choice: Do we want to join and participate in this technology or not? We now have NDC online bookings of 60 to 70%, coming from 20%.’
In this phase of the GDSs’ fading power, which continues, the legacy of the co-specialized structure has been retained, yet increased inter-organizational product modularization has significantly reduced airlines’ dependence on GDSs. Consequently, the GDSs have less inter-segment bargaining power. Even though the new architecture has not taken a final shape, the new balance that has emerged without the GDS bottleneck has given the airlines back control and has allowed them to migrate value. The new modular structure that has emerged following the establishment of the new standard and that has devalued the co-specialized legacy structures has also led to fears of other new entrants such as Amazon or Google (Int11) and to fears of ‘GDSs finding new positions in the emerging architecture’ (Int2) that will create a new bottleneck.
An undisputed catalyst in dissolving the GDS bottleneck was technology. More important, however, was the process of choices and subsequent actions taken by the world’s airlines as bottleneck challengers, along with the choices and responses of GDSs as bottleneck firms. The technology that helped dissolve the bottleneck, such as the XML-based messaging standards, was available from the late 1990s; it was not until over a decade later that airlines made a concerted effort to use this technology. Since even the GDSs had changed their commercial contracts and had started to consume content in the NDC format (e.g. Int2), it is clear that dissolving the bottleneck was not a natural consequence of an emerging technology; instead, it was the strategic and tactical choices and actions of firms with divergent interests and objectives that led a cohesive drive to dissolve the bottleneck.
Discussion
Our study demonstrates how one segment in the architecture of the global airline ticket distribution industry – airlines – successfully worked to erode an adjacent segment’s – the global distribution systems’ – bottleneck position. On a product architecture level, this bottleneck dissolution process can be understood as a technology-enabled movement from an integrated to a modular product architecture (Schilling, 2000) in which the bottleneck segment’s ability to capture value from the co-specialized assets and interface is eroded. Accompanying this modularization process at the product architecture level were recursive power dynamics between the rival segments that played out continuously, influencing the division of labour among a set of co-specialized firms (i.e. an industry architecture; Jacobides et al. (2006)).
Figure 2 illustrates the recursive process of power distribution dynamics and how it influences industry evolution. This figure shows that players in both segments observe changes in modularization possibilities and experience pressures (1) that are unfavourable for the incumbent (current bottleneck) and favourable for the challenger segment. Both segments attempt to leverage their existing power bases (2a and 2b), either to fend off the threat of decreased value capture or to use modularization as an opportunity to capture more value. Each segment employs specific mechanisms to maintain and attain power (3a and 3b, respectively) and thus to influence how the power-shifting momentum develops (4) to their advantage within and across their segments. At various times during this process, the status of the power shift is fed back to the product architecture level, as it affects the foundational pressures on the modularization of the system (modularization pressure and factor mobility components), that is, reconnecting to (1).
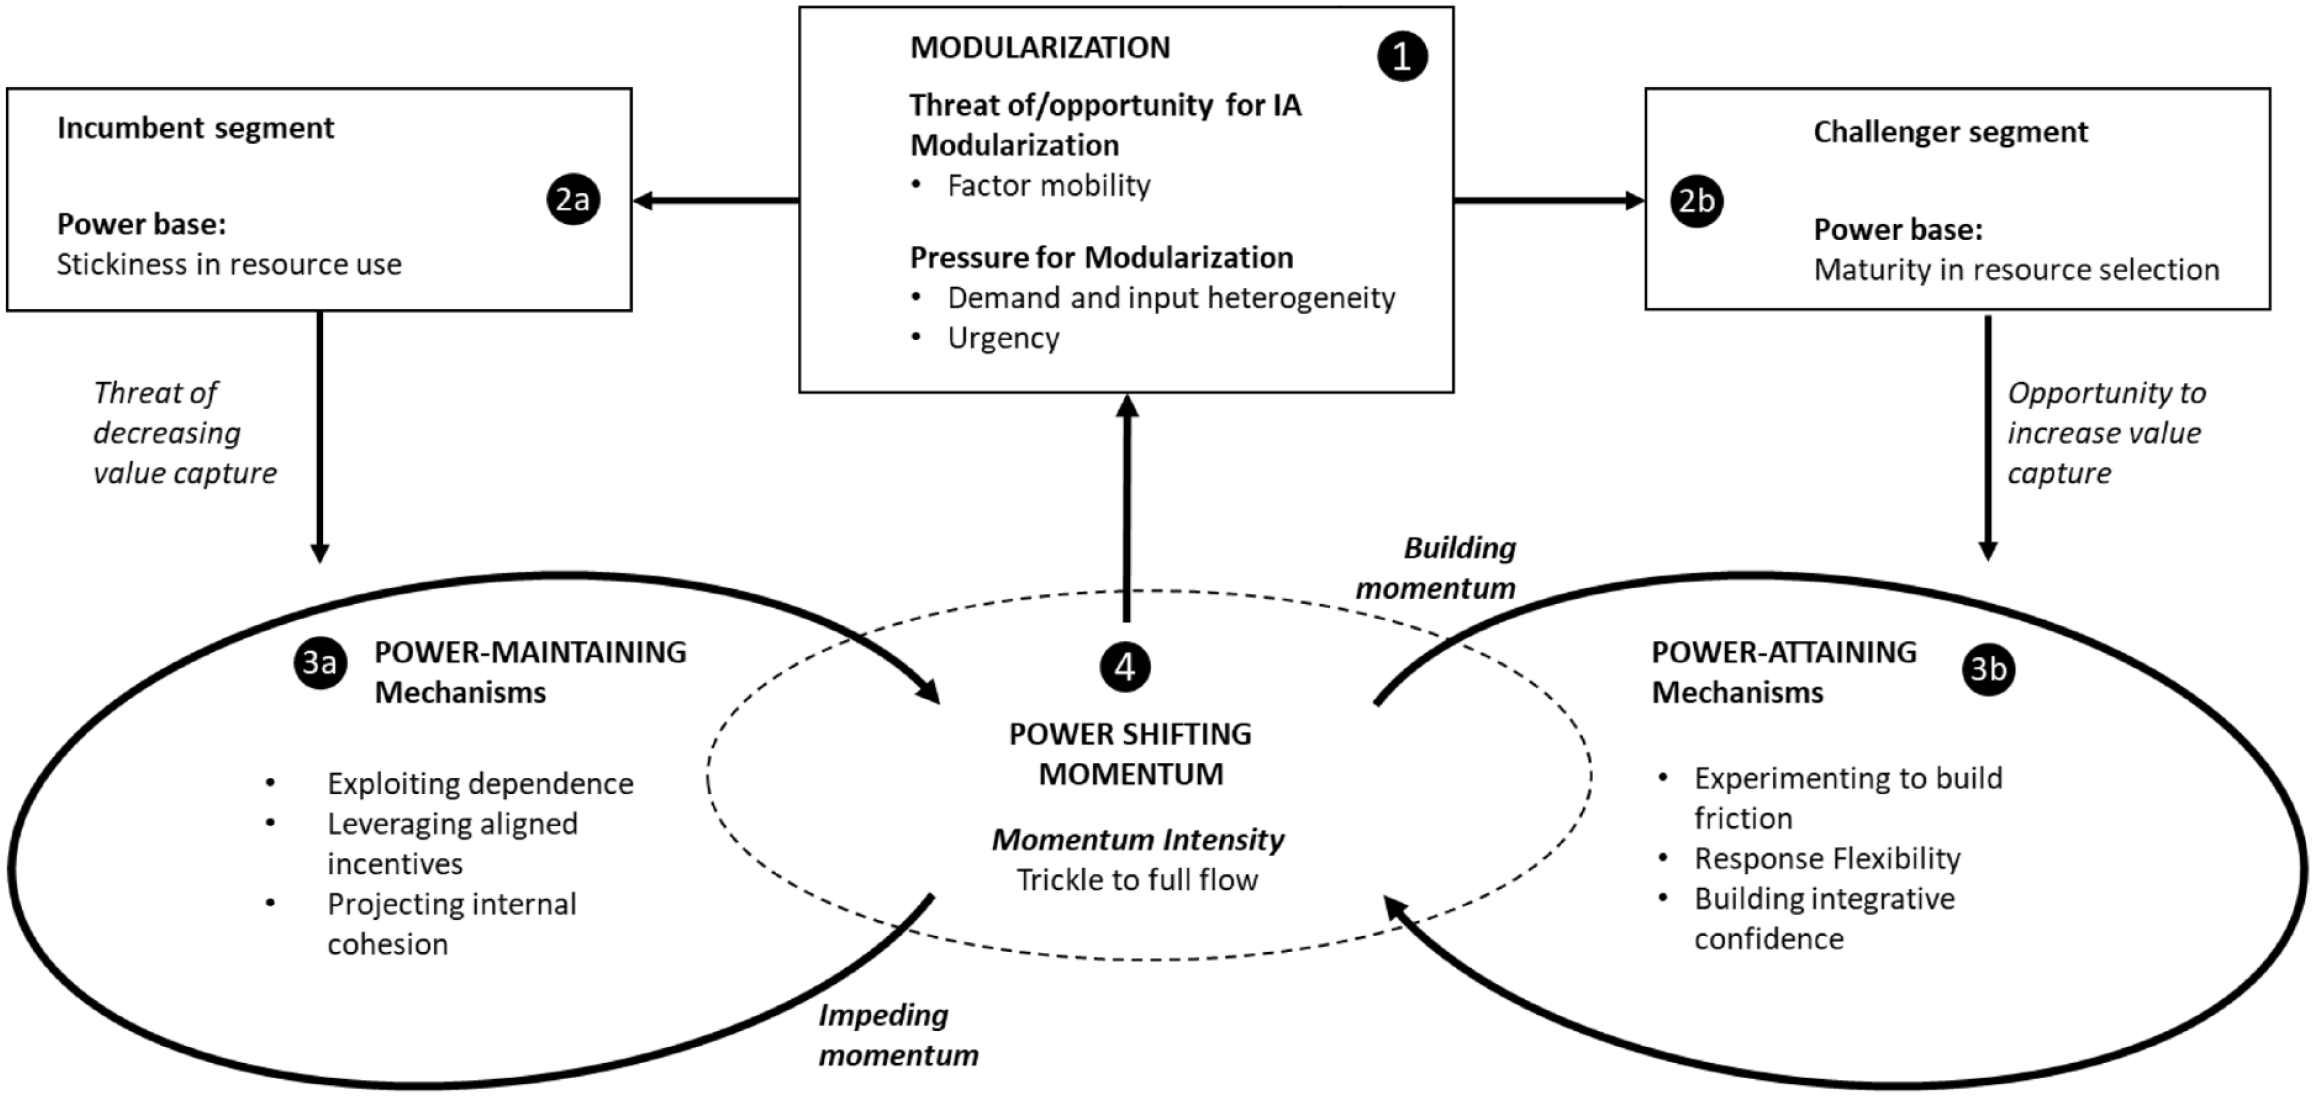
A model of power distribution dynamics in industry evolution.
Next, we explain in more detail the dynamics displayed in Figure 2, in which interorganizational product modularization threatens the highly co-specialized assets at the interface in integrated industry architectures.
(1)
(2a) The
(2b) For the
(3a) The incumbent segment seeks to prevent increased value capture by the challenger segment using
Bottleneck firms ensured that adjacent segments knew just how dependent they were on the GDSs. They took significant action to ensure that customers at the interface and travel agents, as intermediaries, were aware of this dependence. In fact, exploiting dependence was a recurring theme in our analysis, with GDSs continuously signalling across segments that what they considered as misbehaviour would have adverse consequences. Bottleneck firms actively deterred the challenger segment from building or gaining momentum to change, and they did the same for other segments (e.g. travel agents), seeking to prevent them from taking, accepting or supporting any actions that could be seen as contributing to building this momentum.
In addition to actively and vehemently trying to deter these segments, the bottleneck firms also took more fine-grained measures to exploit situations in which actors’ interests in the adjacent and challenger segments seemed well aligned and in which the bottleneck firms could provide short-term mutual benefits, such as offering travel agents additional financial incentives and airlines reduced fees to not use direct and NDC channels (leveraging aligned incentives across segments).
The incumbent segment used a portfolio of power-maintaining mechanisms within its segment and across segments. Within its segment, bottleneck firms used these mechanisms to maintain the internal cohesion necessary to collectively and effectively fend off threats that would have reduced their control over relevant co-specialized assets and thus would have diminished bottleneck firms’ value-capturing position; across segments, they used these mechanisms to deter and sanction any behaviour that supported change. These mechanisms align with the incumbent segment’s aim of preventing or slowing momentum. The build-up of momentum continuously and increasingly reduced the effectiveness of incumbents’ efforts to halt momentum building, and thus to maintain its own bottleneck and power.
(3b) Conversely, the challenger segment uses
Challengers build on their extant relationship with the incumbent segment using the mechanisms of experimenting to build frictions across segments (i.e. with travel agents and GNEs). These mechanisms include negotiation tactics that ranged from threatening to cancel contracts to providing financial incentives to sidestep the existing interface. The aim of this experimentation was to discover what was technologically feasible and to gauge bottleneck firms’ reactions. In responding to these reactions, the challengers displayed explicit response flexibility because they were aware of their vulnerability to the incumbents’ actions. This flexibility included accommodating actions – a contradictory response at first glance, but one that was tactical as it deescalated tensions between challengers and bottleneck firms.
(4) Each segment’s activities to build and impede the
Contributions and implications
This study analyses how a bottleneck in the airline ticket distribution industry dissolved; the recursive model we generated based on this analysis contributes to the strategy literature on industry evolution and the literature on industry architectural change in at least three ways.
First, the recursive process model of power distribution dynamics developed to model industry evolution extends our understanding of the concept of power in both the modularization and industry architecture literatures. The modularization literature primarily focuses on notions of control. Baldwin (2015) referred to the span of control as being contained in the property rights of a firm’s technical architecture, and Schilling (2000) referred to the concept of architectural control of a system (e.g. Microsoft has been argued to withhold information to third parties to protect its market). Controlling a technical bottleneck is a necessary precondition for ensuring that a strategic bottleneck is created and used for a firm’s advantage. However, the role of power, a close yet different concept (Tannenbaum, 1962) only features (albeit little) in the IA literature. Jacobides and Tae (2015) and Jacobides et al. (2016) have more recently started to engage with the role of power in and across industry segments, contemplating ‘the loose notion of “power”’. Our study shows how important and necessary power is for changing an industry structure. Moreover, our study identifies a series of power mechanisms that impede or build momentum for the respective incumbent and challenger segments, revealing the specific inter- and intra-segment processes within these mechanisms.
The dynamism of the power-shifting momentum in our model, which ebbs and flows back and forth between the bottleneck and challenger segments, also contributes to our understanding of momentum and inertia, as outlined in the literature on industry architecture. Schilling (2000) argues that ‘systems are characterized by inertia’ (p. 318), and that overcoming that inertia requires the urgency that comes from competitive factors that build momentum for modularization. In addition to introducing the concept of momentum and its corresponding momentum-building and momentum-impeding forces, our study shows that, although urgency may exist and is steadily increasing, the process of system change is sluggish, even inert, and responds slowly to specific actions. Despite this sometimes slow start and build-up of momentum, once it starts it becomes very difficult to stop completely. Thus, our model expands the notion of inertia to explain the combinations of activities and forces that can overcome it.
Our second contribution is showing how value appropriation evolves from a ‘complementary asset structure’ (Teece, 1986) to a modular structure as the bottleneck dissolves. This evolution begins with co-specialized assets formed when factor mobility is low. Over time, as the challenger segment increases the pressure for product heterogeneity, the pressure for modularization also increases. Our model of power distribution dynamics combines mobility and complementarity and specifies the role that each plays in the development and evolution of co-specialized and individualized assets over time in an industry architecture. Thus, this model highlights how the combination of increased opportunities for modularization along with increased pressure to modularize influences which asset structures are needed for an industry architecture to evolve so that challenger firms can appropriate greater value (Teece, 1986, 2006). What is unique about this study is that it not only identifies which components of industry architecture are needed to bring about IA change, but it also captures the process by which that change comes about. These findings contrast with prior IA work (e.g. Jacobides et al., 2006), which has primarily isolated the components of architectural change, such as standards and modularity, and investigated these components on their own. As for value creation and capture, prior research has investigated the context of these components but has often examined value creation and value capture separately. Researchers such as Schilling (2000) and Baldwin (2015) have approached co-specialization and modularity by focusing on how systems migrate, arguing that increased demand and higher input heterogeneity lead to less co-specialization and greater modularity.
Our study not only identifies the different drivers in the process of changing from a complementary asset structure to a modular one, but also looks at how this change comes about from the perspective of both the incumbent and challenger segments, thus providing a more fine-grained and dynamic model of how greater modularity occurs.
The third contribution concerns the role of resource selection maturity in bottleneck erosion. Essentially, this erosion starts when individual and collectives of firms in the challenger segment transform their vision into actions and processes that bring about such change, a process that Pettit, Balogun and Bennett (2023) described. Challenger segment firms demonstrate collective maturity by selecting the primary technology to use as a resource and identifying how to minimize the friction between the incumbent segment and firms in their own segment. Sustaining and further developing this maturity over time points towards an emerging architectural capability. Our study and the process model we develop respond to and go beyond Baldwin’s (2015) call for research that helps us better understand architectural capabilities and how they develop. It should be noted that differences in the ability to leverage this capability will arise depending on the self-selected groupings of firms in the challenger segment. In this study, pioneer firms, when compared with follower firms, were able to use this advantage to enhance their span of control and ultimately their competitive positioning. From a strategy perspective, these findings provide greater clarity on the dynamics of bottlenecks that authors such as Jacobides et al. (2016) and Jacobides and Tae (2015) call for. These findings corroborate Baldwin’s (2015) claim that sustaining this capability advantage requires firms within the challenger segment to continually refine their knowledge.
Our study opens at least two promising avenues for future research. The first is the potential it presents for researchers to more deeply understand strategic power processes (Pichault, 1995; Roome & Wijen, 2006; Zhu & Westphal, 2021) across the modularity, strategic architecture and general strategic management literatures. This study’s bridging nature helps unite the work of Schilling (2000) and Baldwin (2015), who focused on the more conceptual area of product architectural control, with the work of authors such as Jacobides et al. (e.g. 2006), who have concentrated on strategic architectural control. The concept of power that this study introduces, foreshadowed in Porter’s five forces model (Porter, 2008), which identifies the more static power that groups such as buyers and suppliers hold, also has implications for general management research. The power distribution model we developed shows how firms can use power-maintaining and power-attaining mechanisms to influence and change factor mobility and complementarity, thus appropriating greater value (Hurmelinna-Laukkanen & Yang, 2022). Therefore, this study provides a foundation for future research to continue investigating how firm segments can collectively strategize, either to retain their bottleneck positions or challenge the bottleneck and appropriate greater value from it.
Second, architectural researchers could benefit from a finer-grained awareness of how differing levels and associated nuances in the perceived maturity of associated technologies and willingness to engage in strategic manoeuvres by challenger firms impact in their ability to appropriate value. These nuances extend from the individual to the segment level, where researchers can investigate them and the strength of the challenger firms’ drive to appropriate value by either partially or completely dissolving the bottleneck. We would gain greater clarity on these nuances through longitudinal research in other industry settings. Such research would present exciting opportunities for developing a challenger segment architectural capability, as Baldwin (2015) called for to investigate strategic choices at the firm level to better understand firm-level dynamic capabilities (Teece, 1986, 2006), and to examine the relationship between this capability and strategic choice.
Footnotes
Appendix
Firm actions for exemplary airlines and time periods a .
| Action type | American Airlines | United Continental | ||||||
|---|---|---|---|---|---|---|---|---|
| 2010 | 2011 | 2012 | 2013 | 2010 | 2011 | 2012 | 2013 | |
| Change | ||||||||
| Collaboration initiation (core) | 4 | 2 | 1 | 1 | 1 | |||
| Legal intervention | 1 | 4 | ||||||
| Channel differentiation | 2 | 1 | ||||||
| Promotional campaigning | 2 | 1 | ||||||
| Other | 3 | 1 | 1 | |||||
| Stability | ||||||||
| Collaboration initiation (core) | 6 | 2 | 1 | 2 | 4 | 1 | ||
| Capability expansion | 1 | 2 | 1 | 1 | ||||
| Legal intervention | 1 | 1 | 1 | |||||
| Promotional campaigning | 1 | |||||||
| Other | ||||||||
| Total per year | 8 | 16 | 7 | 5 | 6 | 6 | 0 | 2 |
| Total 2010–2013 | 36 | 14 | ||||||
| Action type | Lufthansa Group | IAG | ||||||
| 2014 | 2015 | 2016 | 2017 | 2014 | 2015 | 2016 | 2017 | |
| Change | ||||||||
| Collaboration initiation (core) | 3 | 2 | 5 | 1 | 1 | 6 | ||
| Capability expansion | 1 | 4 | 2 | 2 | 1 | 1 | ||
| Promotional campaigning | 1 | 1 | 1 | |||||
| Channel differentiation | 1 | 1 | 2 | |||||
| Other | 1 | 1 | 1 | |||||
| Stability | ||||||||
| Collaboration initiation (core) | 1 | 1 | 2 | 1 | 2 | |||
| Capability expansion | 1 | 5 | 4 | |||||
| Collaboration initiation (non-core) | ||||||||
| Promotional campaigning | 1 | 1 | 1 | |||||
| Other | ||||||||
| Total per year | 5 | 15 | 7 | 10 | 2 | 3 | 7 | 10 |
| Total 2014–2017 | 37 | 22 | ||||||
This table shows the airlines in the overall dataset that were most active and the years during which they were most active. Between 2010 and 2013, American Airlines and United Continental accounted for approximately 48% of all actions among North American airlines. Between 2014 and 2017, Lufthansa Group and IAG accounted for approximately 33% of all actions among European airlines (see also Table 1).
Acknowledgements
Our paper has received much useful feedback during the course of its development. First and foremost we would like to thank Senior Editor Frank Wijen for his encouraging and developmental guidance and the three anonymous referees for their very constructive feedback. We would also like to thank our interviewees for the time and massive input they offered, without which we would not have been able to capture a sufficiently rich and comprehensive account of airline–GDS interactions.
Declaration of conflicting interests
The author(s) declared the following potential conflicts of interest with respect to the research, authorship, and/or publication of this article: The third and fourth authors have been (temporarily) affiliated with Deutsche Lufthansa AG: Dr. Daft is a Lufthansa employee, and Dr. Stabenow was employed on a Lufthansa-financed research project while pursuing his PhD at the University of Antwerp. They do not know the clear names and affiliations of the interviewees, did not participate in the interviews, and do not have access to the interview recordings and transcripts.
Funding
The author(s) received no financial support for the research, authorship, and/or publication of this article.