
Abstract
Research about the psychological effects of contracts on relationship quality hints that effective contract design is not only a matter of selecting the right clauses but also of communicating them in the right way. Recent studies have shown the benefits of using visualizations in contracts to advance clarity, but our understanding of contract visualization in practice is very limited, for lack of field research. We conducted a single case study of how a sales team created visualizations to improve the clarity and the ease-of-negotiation of outsourcing contract documents. Our findings suggest that visualizations help bridging three knowledge gaps in the contracting process: inter-firm; cross-professional; and between contracting phases. In particular, visualizations allow for more effective communication and coordination by increasing clarity and helping the parties to frame the contract and their burgeoning relationship positively. The study expands our understanding of contract design as a strategic relationship-building practice.
Keywords
Introduction
Communication underlies all organizational processes, and is a critical ingredient of coordination and success (Kapp and Barnett, 1983; Snyder and Morris, 1984). Contracts are no exception: the communicative aspects of the contracting process are equally important. Until recently, however, well-established research streams – like transaction cost economics (TCE) and the relational view of governance – have neglected contractual communication.
TCE-informed research looks at contracts as mechanisms to prevent exchange risks and opportunism (Williamson, 1985). Transactional attributes, level of contractual specification and varying levels of vertical integration drive contract design (Schepker et al., 2014), and the assumption is that as long as contracts contain appropriate safeguards, they will succeed in regulating transactions. Communication between parties, in person or through contracts, is not a concern.
The relational view instead acknowledges that contract documents have a psychological effect on the parties, influencing their relationship. While some argue that the mere existence of a contract signals distrust and negatively affects relationships (Ghoshal and Moran, 1996), others find that formal contracts lead to generally better relationships when they reduce information asymmetry and increase communication between the parties (Dyer, 1997; Dyer and Chu, 2003). However, interpersonal interactions – negotiations, dialogue and other coordination activities (Ring and Van de Ven, 1994) – rather than contractual documents appear as the locus of communication and sense-making.
Recent research has developed an interest in the psychological and communicative dimensions of contracts. Contracts, as information processing systems, influence how knowledge on inter-organizational relationships is gathered, processed, interpreted and acted upon (Lumineau, forthcoming). The information stored in contracts is more than simple court evidence: contracts can enhance business performance insofar they prevent parties’ misunderstandings and facilitate coordination (Ryall and Sampson, 2009). Different clauses, and their framing, shape the nature of transactions and relationships (Weber and Mayer, 2011).
Proactive contracting scholars also stress the importance of contracts as communication and coordination tools: good contracts should prevent legal troubles and help parties’ success (Haapio and Siedel, 2013), but can only do so if they are communicated in clear, simple ways that allow managers – not only lawyers and judges – to understand, implement and monitor their contractual promises (Barton et al., 2013; Berger-Walliser et al., 2011; Haapio, 2013). Addressing this need for clarity, researchers suggest complementing contract texts with explanatory visualizations – for example, charts, diagrams, icons – to make them more understandable and actionable (Berger-Walliser et al., forthcoming; Conboy, 2014; Passera and Haapio, 2011).
However, while clarity is fundamental, it is not the only factor in effective communication. Contracts are not neutral to-do and must-do lists, read in a fully rational and unemotional manner. Different ways to frame the provisions direct the parties’ attention to risks or losses, and to opportunities or gains – affecting their emotions, behaviours, reactions and ultimately the nature of their relationship (Weber and Mayer, 2011; Weber et al., 2011). For example, contract duration can be framed as an early termination clause or as an extendibility clause: while the substance is the same, the different framings will induce opposite outcomes – a vigilant, arms-length relationship in the first case, or a collaborative, flexible one in the second case (Weber et al., 2011).
This article focuses on the emerging topic of visualization in contracts, as we seek to ‘understand how to structure contracts to promote social processes that enhance outcomes’ (Schepker et al., 2014: 26) – an open question in contracting literature. We see contract design as the design of both content and presentation. Moreover, we see it as a process and not only as an outcome (Berger-Walliser et al., forthcoming). This informs our research question: how and why contract drafters use and integrate explanatory visualizations in contracts.
Since little is known on contract visualization as a real-life practice, 1 we conducted an inductive single case study, following the contract visualization efforts of a sales team at CartaFirm (a pseudonym), a firm operating in the paper industry. The sales team worked with a designer (one of the authors) to integrate diagrams and icons into their operation and maintenance outsourcing contract, with the goal of improving communication, coordination and shortening negotiations. We discovered that the participants envisioned visualizations as tools to disambiguate information, signal investment in the emerging relationship and impose a positive, promotive frame on the customers’ interpretation of the contract. Clarification and framing were strategies to decrease uncertainty, a hindrance to coordination and relational mechanisms between the parties. In particular, we identified that visualizations were used to reduce the uncertainty arising from three knowledge gaps in the contracting process: inter-firm; cross-professional; and between contracting phases.
Our findings provide an understanding of contract design choices and strategies as they are created, complementing the results of retrospective correlational studies (Lumineau and Henderson, 2012; Malhotra and Lumineau, 2011; Weber et al., 2011) and experiments (Bertrandias et al., 2010; Passera 2014, 2015a). 2
Theoretical background
Contracts: A communication perspective
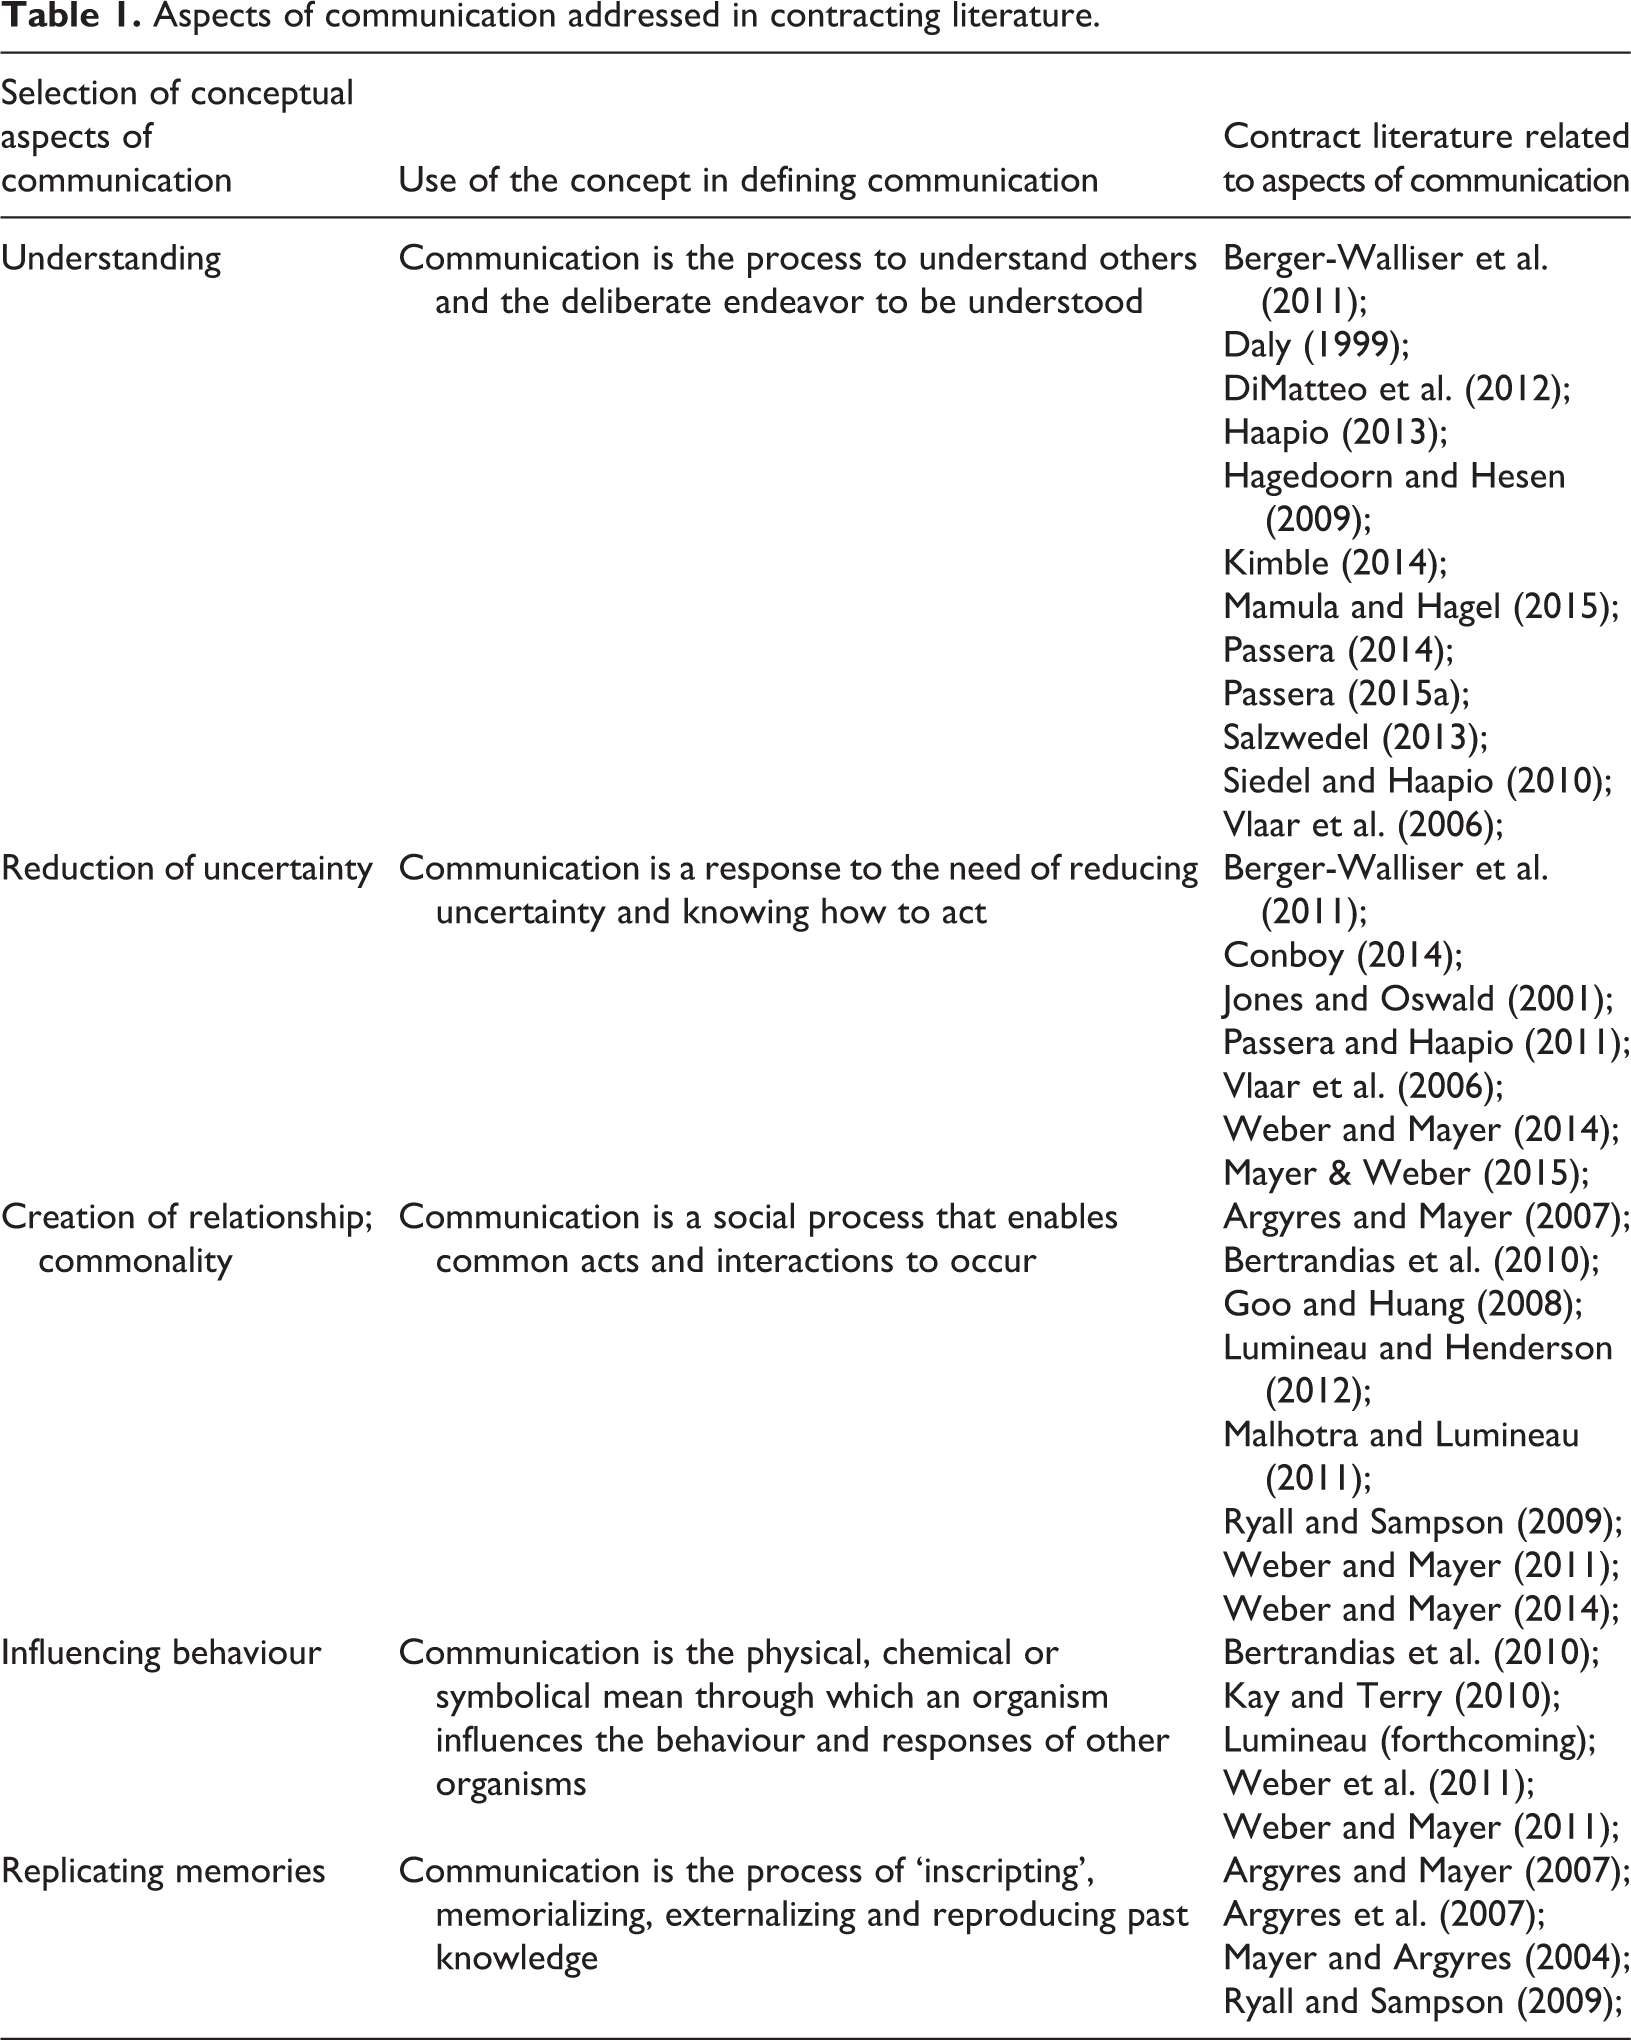
Dance (1970) identified 15 conceptual elements recurring in the definitions of communication, showing how it is actually a family of concepts rather than a single idea. Among these concepts, five have emerged – more or less explicitly – in the studies on contracts we review below (Table 1): understanding; reduction of uncertainty; creation of relationships and commonality; influence on behaviour; and replication of memories. Thus, when we talk about investigating the ‘communication perspective’ of contracts, we mean studying contracts (and contract design in particular) through the lens of these five themes, rather than focusing on safeguards and control/coercion mechanisms.
Aspects of communication addressed in contracting literature.
Organizational studies have mostly focused on contracts as safeguards against the risks of inter-firm transactions (Dyer, 1997; Schepker et al, 2014; Williamson, 1985), developing an important debate on whether formal contracts and relational mechanisms are complements to or substitutes in governing exchange and limiting transactional costs (Goo et al., 2009; Poppo and Zenger, 2002). Within this discourse, some studies examine the interplay between contracts and relationships in terms of contract design, exploring how different clauses (and how they are written) influence economic and relational outcomes.
Accurate, clear, adequate and implementable contract terms are a key factor in building successful relationships (Argyres and Mayer, 2007). In successful long-term relationships, the parties – as the result of learning – tend to strengthen clauses addressing communication, clarification of roles and expectations (Mayer and Argyres, 2004; Ryall and Sampson, 2009). Moreover, jointly developing a well-structured service-level agreement fosters relational quality, since trust and commitment are correlated with the presence of coordination-oriented provisions in the contract (Goo and Huang, 2008).
Recent studies sought a more nuanced understanding of the effects of contract design on relationships, and its role in how contracts complement or substitute for relational governance. A crucial realization is that contracts play both control and coordination functions. Control and coordination clauses influence differently calculative/rational and non-calculative/emotional judgments about the other party, resulting in varying levels of trust (Lumineau, forthcoming). Contractual coordination increases competence-based trust, while contractual control increases competence-based trust, but diminishes goodwill-based trust (Malhotra and Lumineau, 2011). Contracts are thus information processing systems, which affect the decision-making capacity and quality of the organization (Lumineau, forthcoming). Contract design thus assumes a wider meaning: it is not only the design of the optimal level of transactional safeguards, but a mechanism to influence and reinforce emergent relationships (Goo and Huang, 2008; Ryall and Sampson, 2009). The effect of contracts on relationship formation is seen most clearly in the so-called framing effect: alternative ways of presenting the same clause will induce different interpretations of goals, failures and the other party’s behaviour (Bertrandias et al., 2010; Weber and Mayer, 2011; Weber et al., 2011). The concept draws from regulatory focus theory (Higgins, 1998) and expectancy violation theory (Burgoon, 1993), distinguishing between preventive and promotion frames. Under a preventive frame, goals are seen as must-be-met requirements; the behaviour of the parties will focus on detecting deviations from the goal, resulting in an arms-length relationship characterized by high vigilance (Weber and Mayer, 2011). Under a promotive frame, instead, goals are seen as best-possible outcomes, influencing the parties to fully cooperate in the effort to maximize gains for both (Weber and Mayer, 2011). The effects of framing on trust formation (Bertrandias et al., 2010) establish the importance of deliberate communication strategies in contract documents.
However, trust alone does not ensure a smooth cooperation. The parties can decrease interpretive uncertainty through formalization (Vlaar et al., 2006) and frame alignment (Weber and Mayer, 2014), but contractual complexity – in terms of both content and presentation – remains a source of risk: ‘Economic actors do not fully comprehend contracts or are limited in their interpretation of the consequences of the content of their contract’ (Hagedoorn and Hesen, 2009: 841). Complex information demands intensive cognitive efforts, which often are insufficient to avoid mistakes and misunderstandings. Long-standing research on plain language (Daly, 1999; Kimble, 2014; Salzwedel, 2013) and proactive contracting (Berger-Walliser et al., 2011; DiMatteo et al., 2012; Haapio, 2013; Siedel and Haapio, 2010) show how the difficulty of understanding contracts increases the efforts and costs related to designing, writing, implementing, controlling and enforcing contracts. Good governance is also a matter of clear communication, and several authors have suggested explanatory visualizations – for example, tables, diagrams, flowcharts and timelines – as a practical and effective way to complement contractual texts and increase their understandability (Berger-Walliser et al., 2011; Berger-Walliser et al., forthcoming; Conboy, 2014; Jones and Oswald, 2001; Passera and Haapio, 2011). Initial experimental studies demonstrated that visualizations improve contract comprehension and engagement with the documents (Kay and Terry, 2010; Mamula and Hagel, 2015; Passera, 2014, 2015a), but have so far failed at exploring contract visualization as a real-life communication and coordination practice.
Visualizations as boundary objects
Before presenting our contract visualization case study, we introduce a number of studies on visualizations in organizational settings, which illustrate how visualizations can aid collaboration, coordination and knowledge sharing. This research stream conceptualizes visualizations as boundary objects – artifacts that support coordination and translation among different knowledge domains, since they are flexible enough to be used, interpreted and contextualized in different ways by different actors, while retaining a ‘robust’ common meaning which is needed to coordinate different actors (Star and Griesemer, 1989). An effective boundary object allows different actors to represent and transfer their knowledge, but also learn what they and their collaborators know and do not know, with the ultimate goal of integrating and transforming it all into new, shared knowledge (Carlile, 2002, 2004). New knowledge creation is crucial for the success of an organization, and effective externalization is one of its ‘engines’: it transfers valuable knowledge from the tacit to the explicit domain, enabling articulation, dialogue, analysis and joint action (Nonaka and Takeuchi, 1995).
In some cases, the boundary-bridging power of visualizations resides in their ability to clearly encode interdependencies and relationships between parts and wholes – of a product, a group, a process. Several studies show that such representations are essential in cross-disciplinary work, where different perspectives need to converge into a common outcome (Bechky, 2003; Carlile, 2002, 2004; Ewenstein and Whyte, 2009). In meetings, visualizations help in finding common ground and seeing the big picture, and decreasing personal and communication conflict (Mengis and Eppler, 2006). Even simple visualizations like Gantt charts (Yakura, 2002) or knowledge maps (Wilson and Herndl, 2007) are powerful coordination tools that offer common, concrete representation of the project and one’s role in it-- which then can be better discussed, managed and negotiated. The result is a more effective mobilization of resources.
Visualizations can also help elicit and externalize tacit knowledge. Visual facilitation techniques improve the quality, quantity and retention of ideas generated in meetings (Bresciani and Eppler, 2009). This is particularly helpful in discussing not-yet-established knowledge, when questions, inferences and contributions are necessary (Mills et al., 2013). Additionally, visualizations show more clearly trends, outliers and relationships between concepts, supporting analysis and decision-making in teams (Eppler and Platts, 2009; Lurie and Mason, 2007; Platts and Tan, 2004).
Lastly, visualizations act as organizational memories, aiding synchronization by capturing and systematizing knowledge – which can be later shared and applied in new settings (Cacciatori, 2008), at a later stage of a process (Henderson, 1991), or executed throughout the organization (Kernbach et al., 2015).
The remainder of the paper illustrates how visualizations can be used to bridge knowledge gaps in contracting and tackle issues arising from contractual complexity. It further analyses how these findings address the cognitive and affective roles of contract documents.
Methods
To understand how and why visualizations may be used in contracting, and whether they play a framing role, we chose to conduct a single case study – a methodology suitable to explore under-theorized practices (Lumineau et al., 2011), and when a phenomenon and contextual conditions highly overlap (Flyvbjerg, 2006; Yin, 2014).
For clarity’s sake, in this study we define contract visualizations as explanatory diagrams, charts and systems of icons, juxtaposed to textual clauses in contract documents. By contract documents we mean both drafts and signed versions of the formal agreement – which may include parts such as general terms and several appendices.
Even though we see communication as a process in which counterparts aim at the creation of shared meanings and realities, continuously switching their roles of message encoders and decoders (Shockley-Zalabak, 2006: 10–14), in this study we focus on the efforts of message construction of a single party, as the contract design activities we investigated took place before engaging with the other party.
Research setting
We performed our study at CartaFirm, following how a sales team collaborated with an information designer (one of the authors) to create visualizations and improve the understandability of their operations and maintenance (O&M) outsourcing agreement. The goal of the project was to create visualizations that could be used within and outside the contract documents: in the contract, they would complement and disambiguate selected contract clauses; at the same time, the visuals could be used in slides at meetings with customers.
CartaFirm is a leading technology supplier for the pulp and paper industries, operating globally with net sales of around €2.9 billion. In addition to traditional equipment manufacturing, CartaFirm nowadays provides O&M services, including the possibility to completely outsource these processes. By 2015, services became a key business line, accounting for approximately 38% of CartaFirm’s net sales.
The scope of CartaFirm’s O&M outsourcing is highly modular and tailored to customer’s needs, resulting in technically and managerially complex services, as they can include the entire operations, plus predictive and preventive maintenance of a plant. To add to complexity, O&M outsourcing is a relatively new trend in the paper industry: customers often cannot define their needs straightforwardly, as they have not outsourced O&M before. It takes considerable expertise on CartaFirm’s side to communicate the added value of O&M outsourcing, help customers audit their businesses, and envision the most suitable outsourcing solution.
The process to define and negotiate O&M outsourcing services is highly cross-disciplinary: alongside expertise in service business and sales, it requires collaboration with the financial, human resources and legal departments just to finalize an offer. Technical expertise is also needed to understand the customers’ systems and processes, and conceptualize a suitable service package. The customer also requires cross-disciplinary collaboration, at different organizational levels: headquarters management; local plant management; sourcing; operations; and even investors (as O&M solutions are often sought out to increase performance and/or reduce costs). Negotiations are generally long, possibly lasting up to two years. Moreover, they are highly discontinuous: intense interactions – whenever the customer is ready to take the next step in the negotiations – alternate with long periods of ‘radio silence’.
In terms of business culture, CartaFirm’s management, top negotiators and most employees are Nordics: honesty, fairness, directness, perseverance and effectiveness are defining values, and contributed to set the goals of CartaFirm’s contract visualization project: ‘make successful negotiations shorter,’ and present themselves as a company ‘easy to do good business with’.
Data collection
The six members of the O&M sales team were interviewed and then observed during design feedback sessions (details in Table 2, Table 3 and Figure 1).
Details on the interview and observation data.
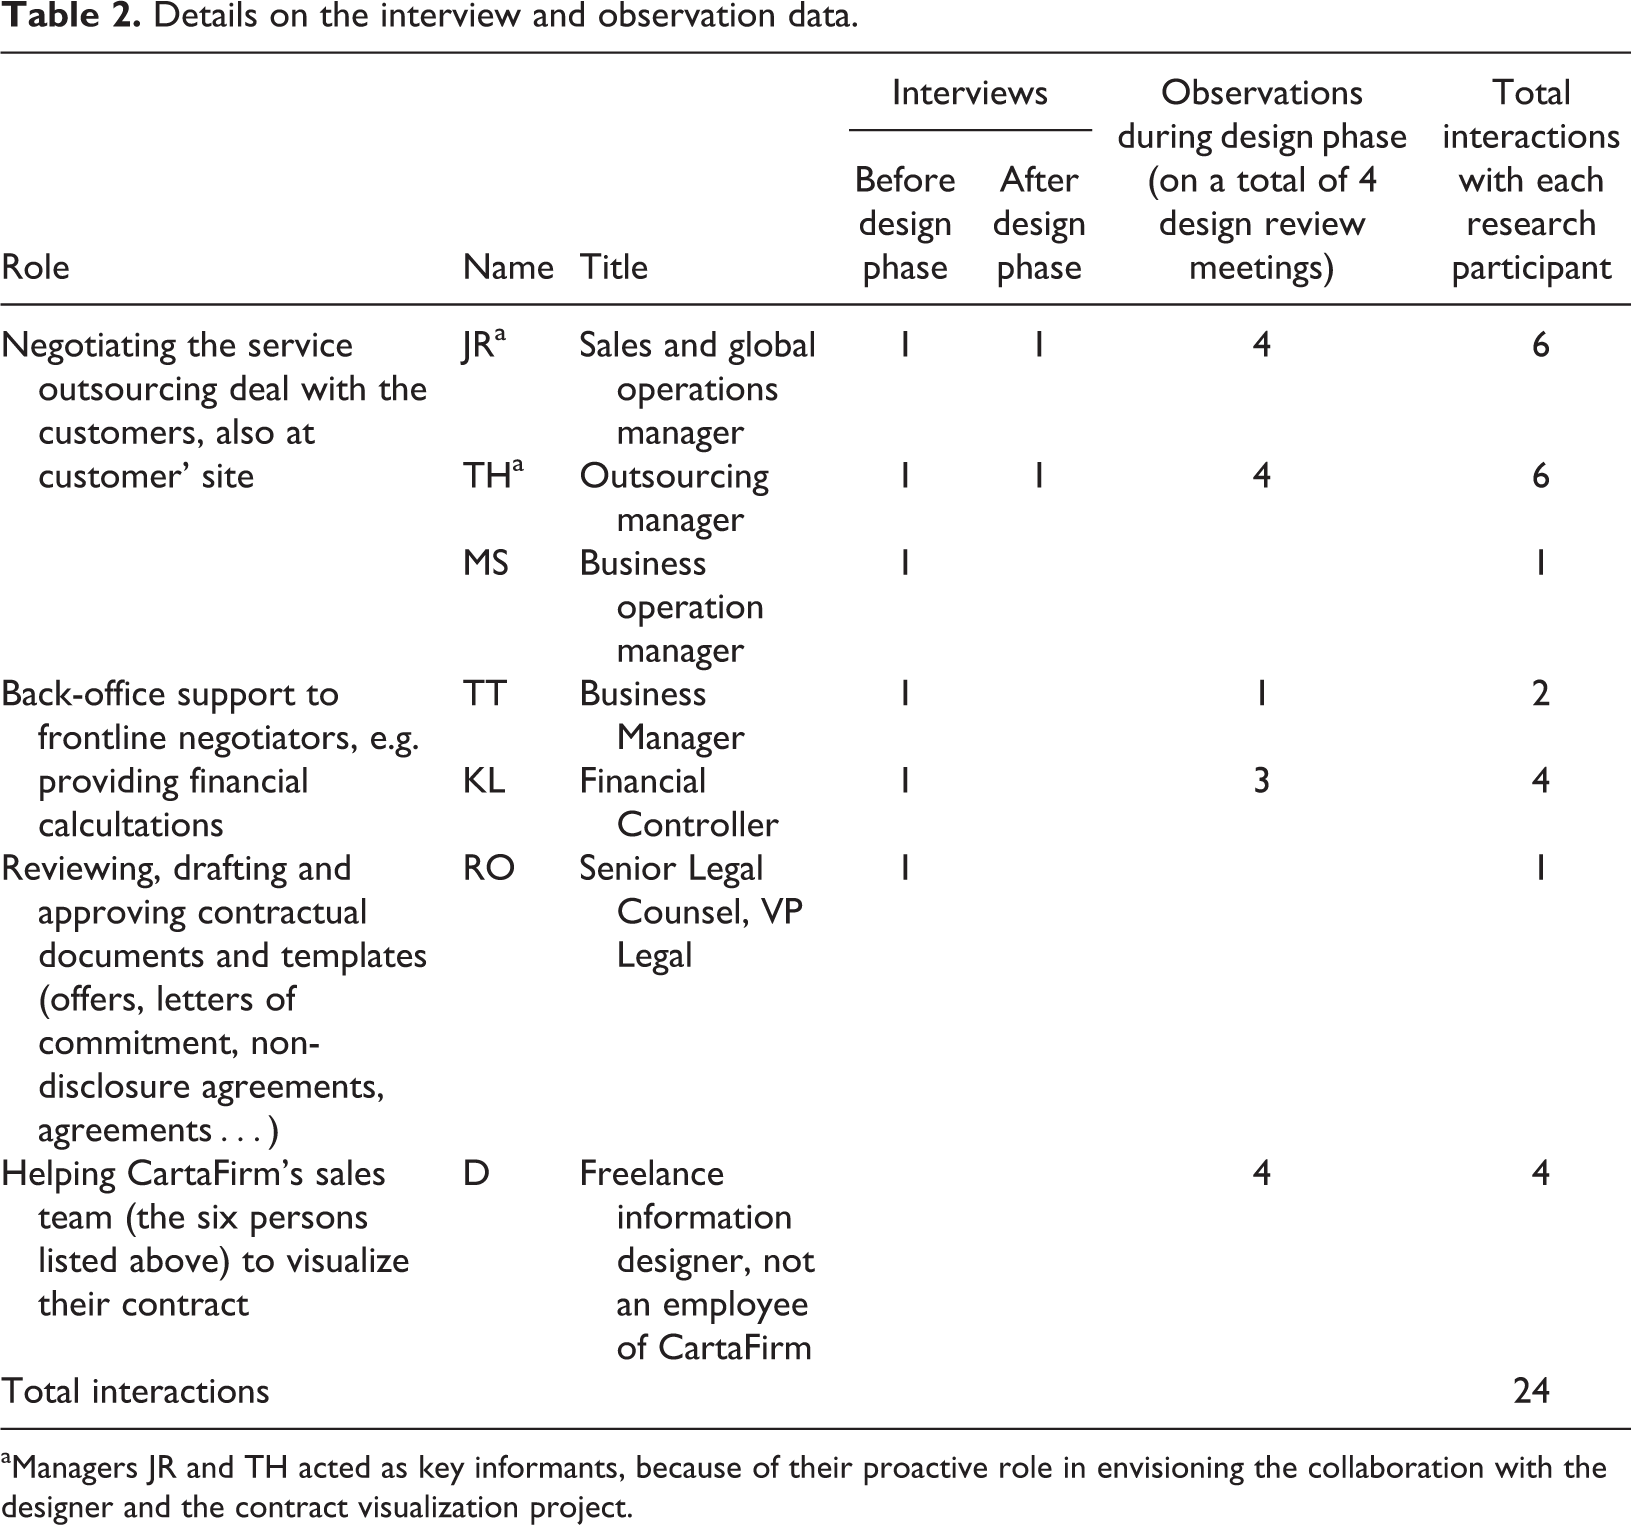
aManagers JR and TH acted as key informants, because of their proactive role in envisioning the collaboration with the designer and the contract visualization project.
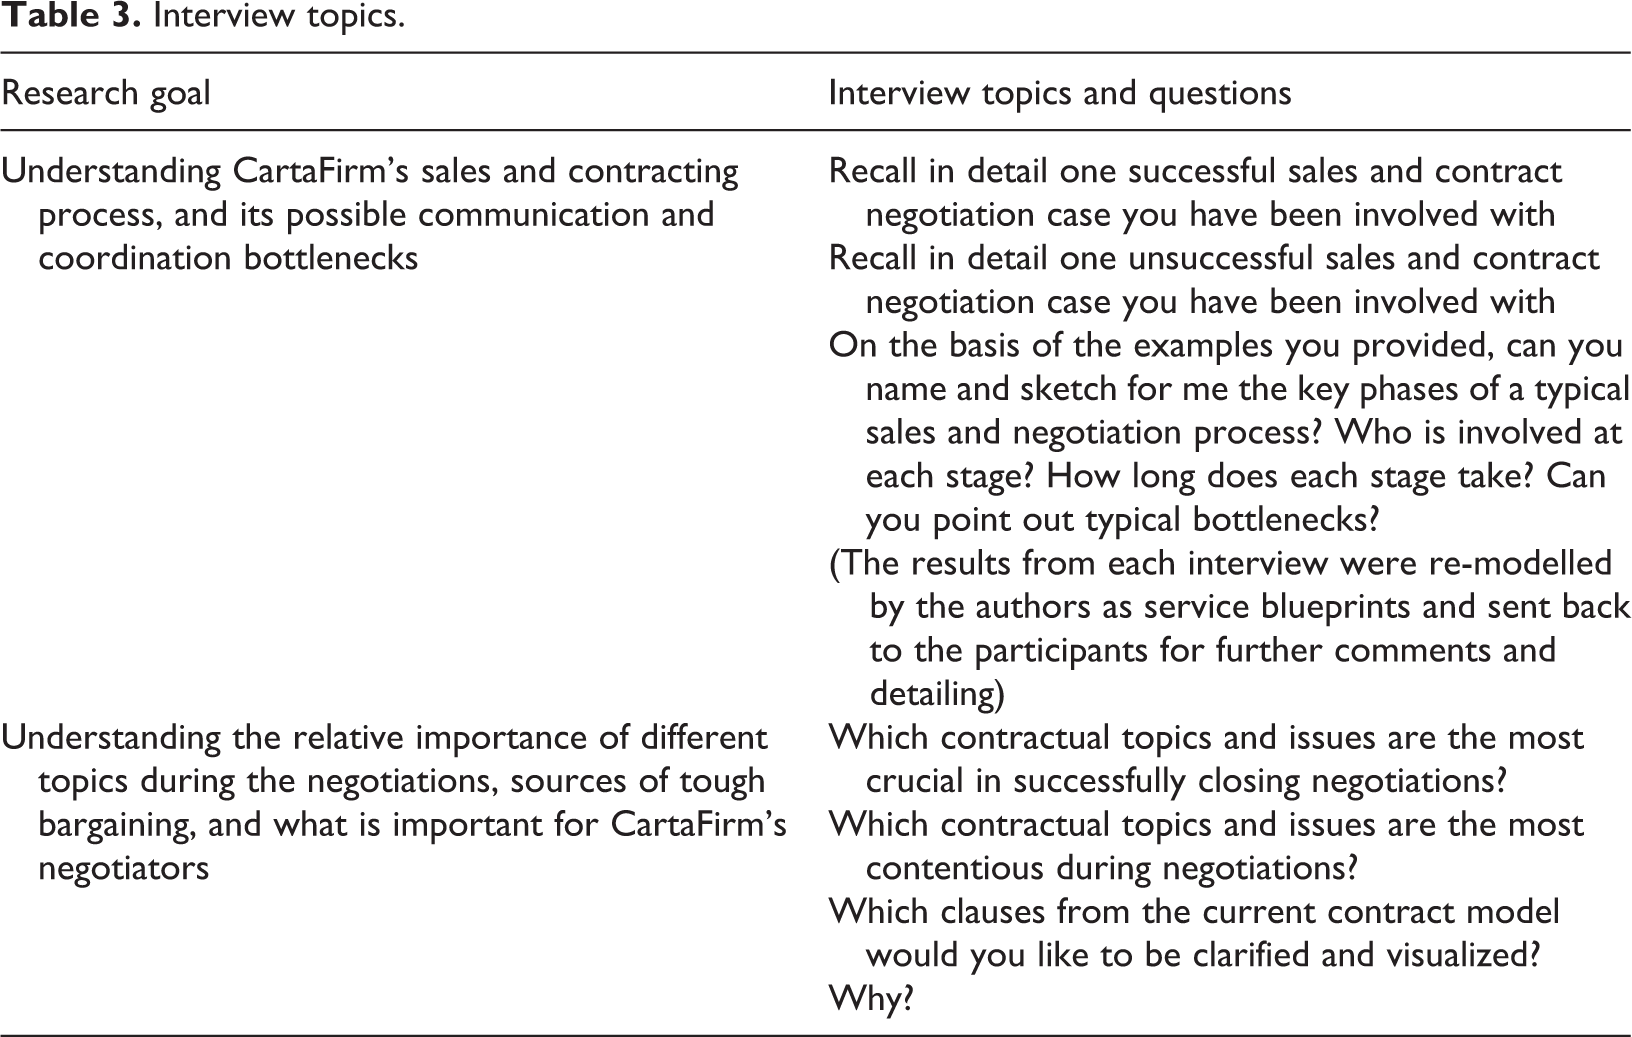
Interview topics.
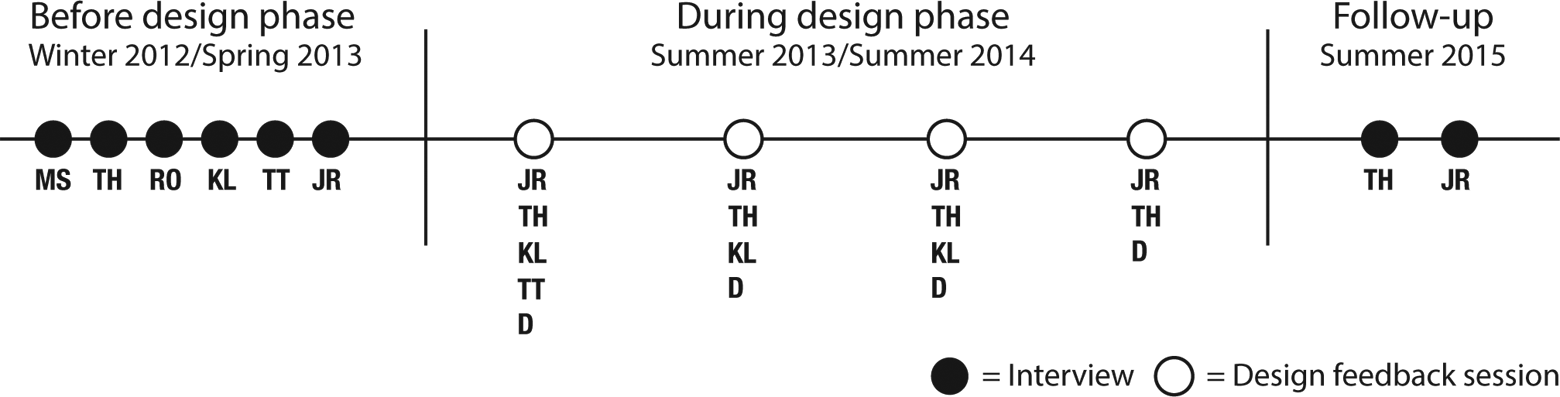
Timetable of the data collection process.
Each interview and design feedback session lasted around 2 hours. All were recorded and transcribed, and notes about the interactions of the participants and the designer were taken during the design feedback sessions.
We also collected and analysed the visualizations produced during the design process, and the emails exchanged to comment on preliminary designs. It was important to see how the visualizations evolved – and what feedback they elicited – as they progressively became what the research participants deemed ‘right’ for their needs.
Data analysis
When we conducted the follow-up interviews, we discovered that the sales cases where visualization had been employed were still in progress. Hence, we concentrated on analysing the sales team’s reasons and expectations for using visualization in contracting, and the communication strategies they envisioned.
The first round of analysis focused on pre-design interviews, aiming to identify the key contracting topics that the designer could visualize, and describe the visualizations produced. The selected topics were those that the sales team considered crucial to successfully close a deal, and that also had been, in their experience, a source of intense clarification efforts, tough bargaining, or misunderstandings. In order to describe and understand the visualizations in sufficient detail, we took inspiration from Carlile’s (2002) categorization of organizational objects in relation to their goals, adding further descriptive criteria of our own (Table 4).
Contracting topics and negotiation goals, supporting visualizations and their usage scenarios.
We then performed a thematic analysis (Braun and Clarke, 2008) on our complete dataset, focusing on understanding how visualizations would be used and why. We familiarized with the data through reading-and-rereading, and started the initial coding process (Braun and Clarke, 2008). From these codes, provisional themes began to take shape: what communication and coordination problems the sales team tried to address; what type of ideal relationship the sales team wanted to establish with the customer; the motivations to use visualization; and the role the sales team envisioned for each of the visualizations.
We analysed the data again through the lens of our provisional themes, refining our codes (Braun and Clarke, 2008). We iteratively restructured the themes, until we settled on a final thematic structure (Table 5), which displayed distinctiveness between, and coherency within, the themes.
Thematic structure and examples of supporting data.
Lastly, we applied these themes to describe the identified negotiation topics. We built case descriptions through illustrative ‘vignettes’ (Carlile, 2002) focusing on ‘the story’ of individual visualizations, or problems addressed by visualizations. These vignettes illustrate the existence of communication problems in contract documents and contracting; how these problems hindered the relational and exchange goals set by the sales team; and how the sales team envisioned the role of visualizations in solving these issues. The vignettes also allow us to communicate our findings in a fluent, holistic way, as narratives possess ‘the force of the example’ sought in revelatory single-case studies (Flyvbjerg, 2006).
Results
Our thematic analysis (Table 5) illustrates that even during negotiations the sales team envisions and pursues an ‘ideal relationship’ that is instrumental to successful O&M outsourcing: its key ingredients are trust, shared understanding on goals and tasks, consistency and flexibility to accommodate the other’s needs. Sales and contract negotiations are not only necessary to close the deal, but also the first step to pursue that ideal relationship. However, the creation of effective coordination and relational mechanisms is defined by three knowledge gaps that hinder communication and shared understanding: an inter-firm gap, characterized by knowledge asymmetries between the parties in regards to needs and service possibilities, and with the concomitant challenge to create common understanding, expectations and interpretive frames; a cross-professional gap, characterized by the challenge of coordinating different perspectives, ways of doing, goals and priorities of the different professional communities involved in the contracting process; and temporal gaps, characterized by the difficulty of coordinating across disconnected phases in contracting.
In the following selected vignettes, our interpretive analysis shows that CartaFirm’s visualizations were deliberately developed to tackle these gaps and smoothly achieve a shared vision about the deal, its implementation, the mindset and the needs of the counterparty. Visualizations were seen as fostering knowledge sharing in two ways: firstly, visualizations could increase clarity by disambiguating difficult clauses, making crucial information more salient, and inviting a more careful reading of the contract; and secondly, visualizations could act as framing devices, stressing the gains for the customer and how CartaFirm could be trusted on the basis of its expertise and willingness to communicate.
Since a sales team concentrates on interacting with customers, the participants provided richer data about the inter-firm gap. In general, all visualizations seem to have been crafted to address this gap: as shown in the vignettes, the participants were particularly preoccupied by how customers would receive and interpret each of the visualizations, and their main concern was to ‘get them right’. Comparatively, the participants were less clear on how individual visualizations could be used to minimize cross-professional and temporal knowledge gaps. Instead, they described scenarios in which a visualized contract document, as a whole, may minimize traditional contract communication problems (i.e. lack of clarity; and contract as a threat of coercion). To mirror the nature of the data, our article focuses more extendedly on the role of contract visualizations in the inter-firm gap, dedicating a merged section to cross-professional and temporal gaps.
Lastly, to better understand what participants call ‘contract visualizations’, we introduce the concept of visual templates, which they invented: visualizations are in a modifiable format, and can be used flexibly in slides and contract drafts during negotiations, until crystallized in the signed contract document as a ‘snapshot of the reached meeting-of-the-minds’. Contracts themselves similarly evolve through different manifestations: early on, a slideset illustrating the deal; later, a negotiable contract draft; then, a crystallized signature document. Passed over to implementation teams, they may become ‘project manager translations’ to ramp-up and run the project. The sales team aimed at producing visualizations that could be consistently used across different contract formalizations, creating a common, coherent way to conceptualize and present key contractual topics. Figure 2 illustrates how the participants envisioned using visualizations during the contracting process and in contract documents.
Use of visualizations during the contracting process, as envisioned by the research participants.
Bridging the inter-firm knowledge gap in contracting
Vignette 1: Framing and clarifying the service scope
The sales team considered knowledge asymmetry between themselves and the customers a typical challenge in conceptualizing tailored, flexible services that fit well with the customers’ needs: While we negotiate many such cases, and for us it is business-as-usual, for many of our customers it is the first time outsourcing operations, maintenance, or both, of their mills. It is a once-in-a-lifetime decision, but they need help to figure out what they actually need (TH). To some degree the customer always expects something different, or something more from your service […] they perceive it in a different way than we are […] and when there are these gaps, then there must be trust to keep us and the customer aligned. […] It would be great to present the service as a whole, from a bird’s-eye view, to show what is included and what is not, and what the service is all about (JR).
Example of Service Scope Map.
The visualization was to be used to illustrate, in a synthetic way, different service configurations. It would appear in presentations about service scope during negotiations and its finalized version would be incorporated into the scope appendix of the agreement. The map could be easily assembled with icons from a library, covering all key service concepts. The sales team was satisfied with the result, describing it as ‘clearer’ and ‘simpler’.
But what does ‘clearer’ mean? In our interpretation, the map was perceived as clearer because it encodes and communicates the service structure in a more perceptually immediate way than a textual description. The designer explained that the current solution, showing the modular service through ‘easy-to-see information chunks’, would be an effective way to communicate the modular design of the service, its key modules (e.g. daily production operation) and sub-modules (e.g. raw material quality control), and what service scope includes. This well satisfied the participants’ ambition to communicate the service ‘at a glance’. The map was also perceived as a good starting point to drill down on the details: whose responsibility is a certain task, adding missing details, and envisioning how to smoothly integrate outsourced and not-outsourced activities.
The design iterations leading to the final version of the map illustrate that clarity was not the only goal: the sales team deliberately sought to frame the service scope to positively affect the customer’s perceptions. The first version of the map was rather pictorial: it illustrated a model paper mill in which workers performed the tasks described in the scope (detail in Figure 4). The participants liked that the visualization made the service scope more concrete (in TH’s words: ‘the service map could work as the ‘packaging’ of the service. It provides something tangible to see, feel and think about, many months before the service becomes a reality’), but they were critical of how the value proposition of O&M outsourcing was wrongly framed.
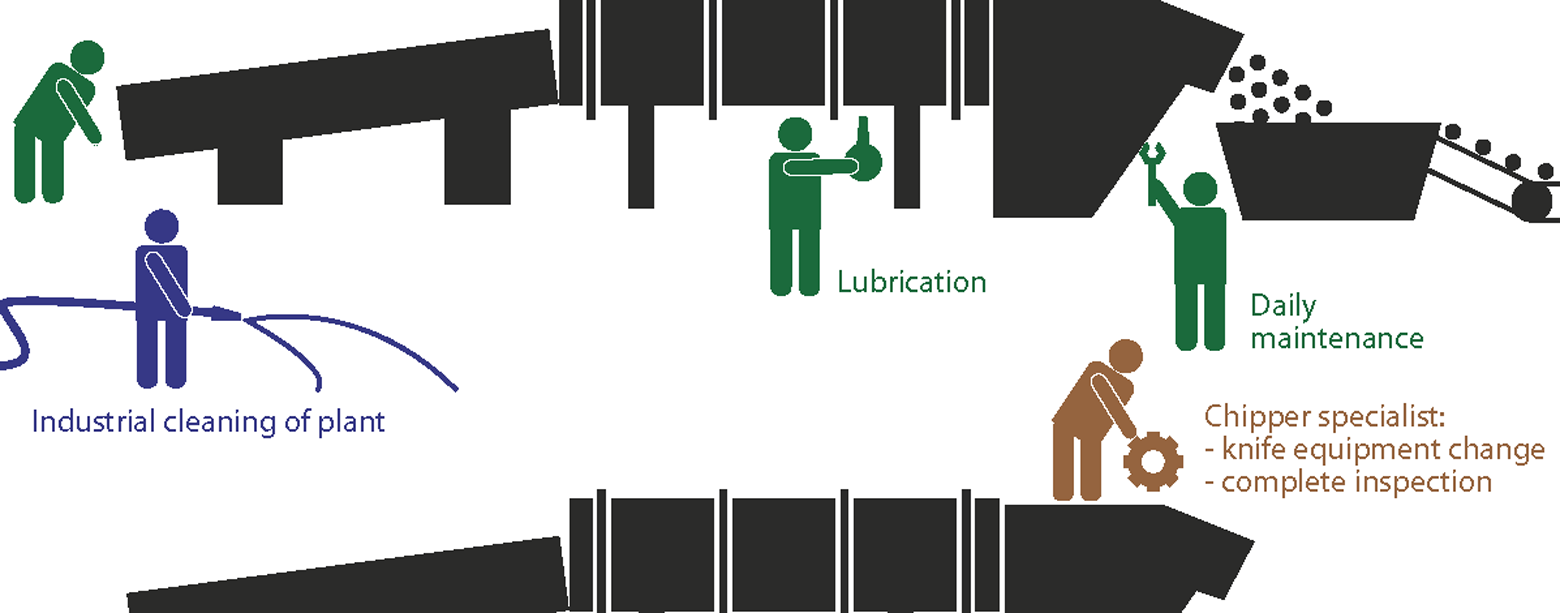
Detail of the first version of the Service Scope Map.
The image of workers servicing machinery with hand-tools was considered misleading and counterproductive: We want to show that ours is not ‘normal’ maintenance, where you fix stuff after it breaks. That is the wrong mental picture, that’s not what we sell. We sell predictive and preventive maintenance. We prevent problems. Our people work with sensors, laptops, and technological devices rather than with screwdrivers, and we need to show that, we need to show that difference to the customer (TH).
The increased transparency and concreteness of visual language forced the sales team to consider how to frame their message in order to actually align the parties’ understanding. A semi-realistic model mill created unwanted consequences. It did not show O&M personnel preventing equipment failure (although fixing broken machines would also be part of their job), and it did not make it any easier to identify ‘at a glance’ the service modules included in the scope. Moreover, it forced the viewer to wonder how exactly maintenance activities would look and be performed, with the negative result to induce a vigilance-oriented behaviour, rather than trust in the supplier to know best how to achieve the goal (Weber and Mayer, 2011). All these factors affected the design of the final Service Scope Map, which is conceptually detailed (the service modules and sub-modules are apparent) and accurate (the icon-like workers are equipped with technological tools), but not realistic.
Vignette 2: Framing and clarifying pricing
CartaFirm’s pricing model is based on actual productivity levels enabled by O&M services, plus a fixed fee to cover basic operative costs, and several key performance indicators agreed with the customer to assign possible bonuses and penalties at the end of each contract year.
This pricing model is customer-friendly, but price is always a delicate topic in negotiations, and subject to tough bargaining. By visualizing the pricing clause, the sales team aimed to strengthen its value-based selling strategy and shorten the time needed for price negotiations. During the preliminary interviews, the participants showed some simple pricing diagrams used in their negotiation slides (but not in the contract document) and suggested ways to improve them. Charts were seen as the most transparent way to present quantitative information and as a convincing way to communicate the promise of cost reduction and increased quality to the customer: an exact and ‘scientific’ description of the price model in the contract document could show competence and trustworthiness.
In the first design iteration, the designer proposed a diagram where the total compensation to CartaFirm would grow in relation to productivity (Figure 5, left). While mathematically correct, the sales team members were unanimous in saying that this was ‘not the point’:
If the customer just looks at this chart at a glance, they may believe that the price goes up. It gives the impression that they will spend more! The point is that it is advantageous for them in the long term. If they don’t see that, they won’t trust our proposal. I don’t know, cannot we invert the axes to show that the price actually goes down? Is there any way to show it differently? (JR)
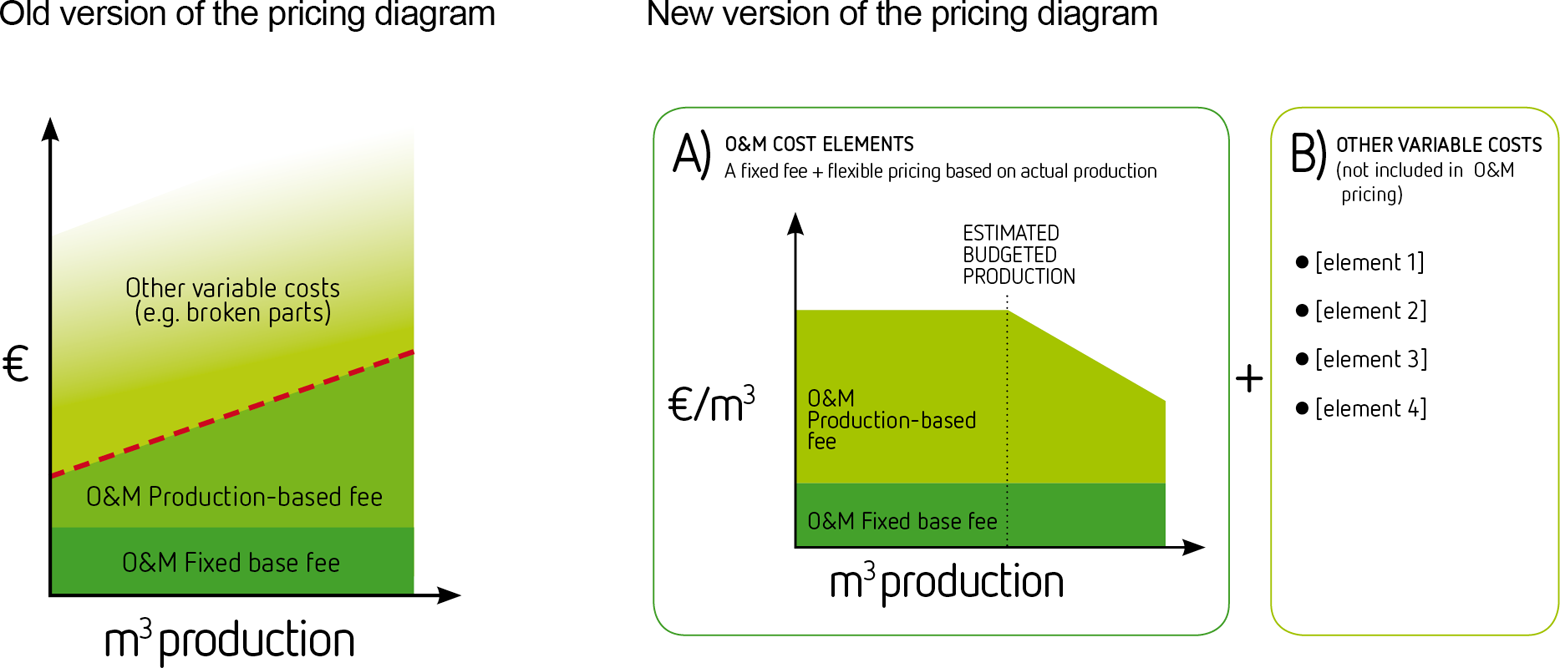
Early (left) and final version (right) of the pricing model diagram.
The designer had framed the visualization as gains only for CartaFirm: the better CartaFirm enables increased production, the more it is rewarded. But this ‘story’ can be told from another perspective. The new visualization (Figure 5, right) is still factually correct, but shows ‘at a glance’ the benefits for the customer: unitary price per cubic meter of production output stays fixed, and even decreases when CartaFirm’s performance exceeds expectations. The sales team was deliberate in creating a representation that would focus and restrict interpretations, and was well aware that often relationships are not only steered by what is said, but also by the impressions elicited by how it is said. Sensitive issues like pricing are likely to be judged both in terms of rational cost–benefit analysis, but also at a visceral, non-calculative level, with effects on the relationship between the parties (Lumineau, forthcoming).
Bridging cross-professional and temporal knowledge gaps in contracting
Vignette 3: Contracts as signs of commitment
During negotiations, the parties not only exchange knowledge on the features of the transaction and each other’s roles, but also try to make sense of the intentions and the contracting style of the other party (Lumineau et al., 2011). Sharing this type of implicit knowledge is made especially difficult by cross-professional misunderstandings and temporal discontinuities interrupting the negotiation process, as both increase the cognitive and collaborative efforts required by everyone involved.
The sales team described, as an exemplary problem of cross-professional communication in lengthy and discontinuous negotiations, the reaction of customers when the first contract draft is brought to the table: Unfortunately in some cases you start to scare the customer when you first bring out the contract, and they don’t want to discuss with you anymore, you lose the case…(JR) Just let the businessmen do the thing first, and then let the lawyers check what can be accepted and what cannot be accepted […] in some cases we’ve been wondering who is running the business, is it the customer’s business people and CEO, or is it just the lawyers? (MS).
The mere existence of a contract often elicits visceral, negative judgments, engendering mistrust that proves fatal for business relationships (Ghoshal and Moran, 1996; Lumineau, forthcoming). However, when perceived as an uncertainty-reducing factor, formal contracts can instead have positive effects on trust (Lumineau, forthcoming). Through framing, it may be possible to stress a positive interpretation: bringing the contract to the table as a sign of commitment.
Since formal contracts are associated with long, dense, textual documents, it may be possible to set a new course for expectations by bringing to the table a document that looks and feels less like a traditional contract. Adding visualizations – previously encountered in presentations – to contract drafts would help CartaFirm establish common ground, and show how the essence of the deal is the same – just presented in a different format. The sales team stressed how continuity, familiarity and reliability constitute a sign of trustworthiness and coherency: Customers need to feel that your service to them, everything you do, is somehow personalized. Trust starts building up already during negotiations. You need to interact with the same people, see the same faces, listen to the same ideas. For the customer, you need to become like a godfather that takes care of issues as soon as they arise (MS).
Vignette 4: Groundwork for contract implementation
The sales team described another typical episode where coordination is threatened by knowledge gaps between professionals and process phases: handing over the case to an implementation team. They felt that this passage was often managed sub-optimally from a communication perspective, and plenty of knowledge about the customer, gathered during sales, was often lost. More frustratingly, even though the parties had worked hard to document important details in the contract, the implementation teams could or would not adequately use this knowledge.
A first problem was that long, complex contracts are unenticing: If the contract looks more visual and easy to read, the team inheriting the project will be more likely to actually read it. At least the most important parts! Often people are lazy and do not really like to read through long documents. But they must, it’s important. Sometimes we have problems because we salespeople make a certain promise to the customer, but then new people take over, and they don’t read well the materials we give them about the case, and this introduces confusion and mistakes in the process (TH). charts are always a good idea. We and the customers are engineers. Even if the charts we make ourselves are not nice-looking they are always better than text only, like contracts. it’s just a big mess if you read clause 1 and clause 10 and clause 20, and the same topic is described in completely different ways. That is the biggest risk of too complicated contract texts. You can make a thousand-page contract, but that doesn’t make the performance of the daily implementation of the contract any better (MS).
Discussion
In this article, we have investigated the communicative dimension of contracts, discovering how visualizations can be strategically used to design contracts that aim at furthering clarity, coordination and relationships between parties.
Firstly, we identified that visualizations may contribute to bridge three knowledge gaps in contracting (between firms, between professions and between phases of the contracting process), which threaten coordination and relationship-building between the parties. These three knowledge gaps can be categorized as pragmatic knowledge boundaries (Carlile, 2002, 2004): they are not disruptive just because the parties initially lack a shared lexicon to communicate, but because they need to negotiate interests and make trade-offs in a situation of overall limited common knowledge. At pragmatic boundaries, boundary objects are crucial in enabling collaboration: the parties need concrete means to represent and negotiate their knowledge and interests, and coordinate across functional or professional domains (Carlile, 2004; Scarbrough et al., 2015).
At CartaFirm, visualizations were envisioned to play such role. Visualizations were not intended to simply be official explanations, but conscription devices (Henderson, 1991) to enlist more fully the perspectives and knowledge of different players in the contracting process. These visual templates were highly editable in order to support different users’ communication needs, but also provided a formalized, robust, shared way to represent contractual issues for all users (Star and Griesemer, 1989). By integrating visualizations into contracts the research participants adapted the documents to their own knowledge needs, while preserving structures and conventions that worked well for the lawyers, increasing the chances that the same document would be meaningful and useful for different professionals at the same time (Bechky, 2003; Levina and Vaast, 2005).
A second contribution is how visualizations bridge knowledge gaps and ensure better communication and coordination in contracting. The data suggest two specific strategies: information clarification and framing.
Participants aimed at employing visualizations to decrease the ambiguity of information, so that it would be easier to understand alternatives, converge on a shared interpretation and act upon it. CartaFirm’s sales team believed that engineering and business experts – the typical negotiators of O&M outsourcing deals in the paper industry – would be accustomed to read diagrams and charts, and would welcome any solution to facilitate their understanding of contracts. The sales team also believed that increasing the understandability and actionability of their documents would result in better governance, stemming from an increased ability to coordinate and rely on the other party – after all, ‘Contracts do not make things happen – people do’ (Haapio, 2013: 68). This result is important in extending the ecological validity of previous experimental research, which showed that visualizations in contract documents help increase comprehension accuracy and decrease reading time (Mamula and Hagel, 2015; Passera, 2014, 2015a), but did not observe the phenomena in a real-life setting.
Additionally, visualizations played a role in CartaFirm’s attempt to situationally induce a promotive contract framing – that is, stressing goals as maximal achievements instead of minimum requirements, and focusing on gains, opportunities and solutions over losses, risks and problems (Weber and Mayer, 2011). The framing effect of visualizations is present at two levels: at a global document level, the very use of explanatory diagrams signals the willingness of CartaFirm to invest time and effort in coordination and communication activities to ensure mutual business success; and at a local clause level, visualizations can more saliently direct attention to gains and benefits.
These findings contribute in several ways to the discussion of contract framing and contract design as mechanisms through which formal contracts affect the quality of relationships and exchange. We provide examples of contract framing ‘in action’, rather than retrospectively surmising them from contract documents (Weber et al., 2011). Managers make conscious framing decisions in contract design, not only at content level (e.g. Argyres et al., 2007; Mayer and Argyres, 2004; Ryall and Sampson, 2009), but also in communicating the contract. CartaFirm sought a cooperative and flexible relationship to enable its long-term, asset-specific O&M outsourcing services – and did so by promotively framing the content and presentation of its contract.
This study also shows how a promotively-framed contract is not only a complement to relational governance, but in fact is a tool to shape the nature of such relationships. Visualizations were envisioned as modifiable visual templates, which evolve and crystallize mirroring the parties’ understanding. To induce a promotive contract frame, CartaFirm’s strategy is to repeatedly expose the counterpart to the same frame-reinforcing visualizations, throughout the contracting process. Relational norms, such as trust, are created through participation, ‘the willingness of parties to make investments in the relationship and share information’ (Lumineau and Henderson, 2012: 383), and not vice versa. Repeated exposure to a frame is a crucial mechanism to increase its resonance and lead to its adoption (Weber and Mayer, 2014; Zajonc, 1968). Moreover, repeated interactions may support the parties in experientially and inferentially learning about each other, their goals and the process to achieve them (Lumineau et al., 2011), resulting in more successful coordination (Argyres et al., 2007; Mayer and Argyres, 2004; Ryall and Sampson, 2009). These results show how there is more than rational opportunism at play in the behaviour of contracting parties. Our results suggest that managers are deeply aware that actors behave and make decisions in a regime of bounded rationality: CartaFirm knows that its documents should not only appeal to the rationality of their counterparts, but should also promote non-calculative, visceral judgments conductive to positive interpretations of the emerging relationship, and ultimately to collaborative behaviours. In this sense, visualizations in contracts become highly symbolic: they demonstrate commitment to clear communication; they seek to give salience to the managerial and coordination aspects of contracts, over their legal and control features; and they try to make contracts look less dense, and more accessible and inviting.
Lastly, our results suggest that framing may reduce uncertainty both during negotiations and contract implementation – bridging the perspectives of Weber and Mayer (2014) and Zardkoohi and Bierman (2015). As shown by our vignettes, decreasing uncertainty and increasing relational bonds by inducing a promotive framing during the negotiation phase were crucial priorities for the research participants – consistent with Zardkoohi and Bierman (2015). In return, this commonly built interpretive frame – consistent with Weber and Mayer (2014, 2015) – could align the parties’ interpretations during contract implementation, or at least provide a basis of goodwill and trust that will keep the parties together in the face of unforeseen mistakes, misunderstandings and contingencies.
Limitations and further research
Our single case study, while suitable to explore a non-mainstream phenomenon, provides highly context-dependent knowledge, which requires careful generalizations and transparency about the contextual variables at play.
Firstly, we focused on contracting of O&M outsourcing services. The transaction between the parties is long-term, asset-specific, high-stake and characterized by a high level of novelty and uncertainty. The willingness to engage in clarification and framing efforts through visualizations may be strong in similarly complex exchanges, since increased communication and trust lead to decreased transaction costs (Dyer and Chu, 2003) and more resilient relationships (Malhotra and Lumineau, 2011). However, it may be absent in simpler, one-off, or short-term transactions, where the time and effort to create visualizations would not be justified.
Secondly, CartaFirm is a European company, and its approach to contracts is informed by a civil law tradition, resulting in a preference for comparatively simpler, shorter contracts. While the whole sales team was eager to explore the possibilities of contract visualization – and there was no opposition from the legal department – the same might not be true in firms with a different business and legal culture. If contracts had been seen only as tools for legal enforcement, and managers had not been involved in their drafting and negotiation, we suspect we would not have observed deliberate efforts in framing, let alone using visualizations.
Thirdly, we were not able to collect data on how visualizations are actually used in meetings with customers, or how the customers themselves make sense of these artifacts, as we did not have access to these data sources. Our results thus reflect only the service provider’s (and ‘contract author’s’) expectations, goals and communication strategies in relation to contract visualization, but the question on whether, how and when such coordination and communication efforts are successful remains open. Further research should look into how visualizations are used to interact with customers, and incorporate the counterpart’s perspective in the analysis. An ideal case would follow the whole contracting lifecycle, looking at the effectiveness of visualized contract documents during service implementation, and investigating how and why such documents may have affected the nature of the relationship and interaction between parties. Particular attention could be devoted to investigating how visualizations may influence both calculative/rational and non-calculative/visceral judgments, as they both affect the parties’ behaviours and ultimately the nature of their emerging relationship (Lumineau, forthcoming). Moreover, such study could shed light on the value of visualizations, as aids for comprehension, and visualizing, as a process of collaborative knowledge co-creation and exchange. While we believe that both may help parties in creating understanding, the mechanisms motivating such effects are most likely different, and may require focused analysis before any comparison or conceptual integration is possible.
Lastly, an important issue to consider, but for which this study provides no data, is how visualized contracts would work in a case of conflict between the parties, or in court. While the legal principle of freedom of contract does not preclude any format in contracting (even some verbal contracts have legal validity, even though harder to enforce), future research could investigate whether visualizations could play a beneficial effect in solving disagreements, or how other user groups (e.g. courts) would react to their presence in contracts.
Footnotes
Acknowledgments
We wish to thank Ivar Timmer and Eila Järvenpää for their comments on previous version of the manuscript. We also thank the editors of this Special Issue and the anonymous reviewers for their precious suggestions on how to strengthen our contribution.
Declaration of Conflicting Interests
The author(s) declared no potential conflicts of interest with respect to the research, authorship, and/or publication of this article.
Funding
The author(s) disclosed receipt of the following financial support for the research, authorship, and/or publication of this article: This study was funded by the FIMECC UXUS project (User Experience & Usability in Complex Systems) and Tekes – the Finnish Funding Agency for Technology and Innovation (grant number: Decision 1170/10 Dnro 2526/31/2010).