
Abstract
Background
Clinical trials for disease progression in multiple sclerosis (MS) often use a confirmed increase on the expanded disability status scale (EDSS) as the primary outcome.
Objective
To compare potential outcome measures of disease progression for MS clinical studies.
Methods
Data were simulated with clinical visits including measurement of the EDSS and relapses completed every 6 months. At each visit, the EDSS could increase due to a relapse, disease progression, or other reasons. Six definitions of disease progression were used based on the number of measurements required for the progression (1, 2, or 3) and whether concurrent relapse could have occurred. The power for each definition was calculated as the proportion of simulated datasets with a statistically significant treatment effect.
Results
All the approaches maintained the type I error rate when there was no overall treatment effect. The approach with progression at a single visit and no relapses led to the greatest power when there was only a treatment effect on progression and there were no increases due to other causes, and this scenario may be directly applicable to a progressive MS trial. For other scenarios, the best approach included a confirmation visit.
Conclusions
Choosing the best outcome definition for a clinical trial depends on the assumed mechanism of action of the treatment and the patient population.
Keywords
Introduction
The analysis of disability accumulation in clinical trials of people with multiple sclerosis (MS) is most commonly based on the time to confirmed disability worsening (CDW) or time to confirmed disease progression on the expanded disability status scale (EDSS). 1 In particular, numerous trials of progressive MS have used this as the primary clinical outcome.2,3 Some trials have used a combination of endpoints including timed 25-ft walk and nine-hole peg test as alternative outcomes to identify progression.4,5 The reason to require the disability worsening to be confirmed is that some increases on the EDSS or other outcome measures are transient due to relapses or other forms of disease activity. Further, there is intrarater and interrater variability in EDSS measurements that can lead to transient changes. 6
Although this outcome definition is widely adopted, there are some potential challenges associated with the definition. First, since all CDW events require two measurements to satisfy the definition, trials must be longer to observe the same number of events. Second, there have been numerous papers investigating the optimal confirmation interval. 7 These papers have generally shown that longer time intervals are required for the progression to be irreversible, indicating that the 3- or 6-month interval for trials may be insufficient. 8
More recently, progression independent of relapse activity (PIRA) has been proposed as an outcome measure in MS. 9 An important addition of this approach is to include both the increase on the EDSS and the absence of a concurrent relapse when identifying progression. Importantly, combining these two measures into a single measurement of the outcome shows the potential for a novel approach for the analysis of clinical trials. By focusing on disability accumulation in the absence of a relapse, the need for a confirmation visit may be removed. 10
In this paper, we investigated several different outcome definitions for the analysis of clinical trials. For each outcome definition, we assessed whether the approach maintained the type I error rate when there was no treatment effect. Then, we compared power for a variety of treatment effects on disease progression. Next, we assessed the impact of EDSS increases due to reasons other than relapses or progression. Finally, we compared definitions when there was a treatment effect on both progression and relapse activity.
Methods
To assess the impact of different outcome definitions on the characteristics of clinical trials, we simulated data, and the parameters used in the simulation study are provided in Table 1. For each of the simulation scenarios, we simulated 1000 datasets with 500 subjects per dataset (250 per treatment group). First, we simulated a baseline EDSS value. For this, we assume a relatively even distribution of EDSS scores from EDSS of 2 to 5 to mimic the expected characteristics of an early progressive or late relapsing MS trial. Note that for all these EDSS levels a one-unit increase on the EDSS would be required for the subject to meet the standard definition of progression.
Simulation parameters.

EDSS: expanded disability status scale.
Next, five follow-up measurements were simulated for each subject corresponding to a trial with six total measurements (baseline, month 6, month 12, month 18, month 24, month 30). All subjects either had the event or were administratively censored at month 30. For each follow-up measurement, the probability of EDSS worsening by each of three mechanisms was used: relapse, disease progression, and all other causes of EDSS worsening. The other causes of EDSS worsening could be illness, fatigue, or intrarater/interrater variability. Each of these forms of worsening was assumed to lead to a one-unit increase on the EDSS. For both the relapse and other causes of EDSS worsening, the EDSS increase was assumed to be transient so that the EDSS reverted to the previous EDSS level prior to the next visit. For disease progression independent of relapse, the increase in the EDSS remained.
For the probabilities of EDSS worsening by the three mechanisms, the range of values assumed as parameters in our simulation were determined through literature-based estimates from MS clinical studies. The probability of disease progression-related EDSS worsening was assumed to be 0.025, 0.05, or 0.1 over each 6-month interval to represent a low, moderate, and high probability of progression. The probability of relapse-related EDSS worsening was assumed to range from 0 to 0.1 to represent a zero, low, moderate, and high probability of relapse-related worsening. 11 This range of relapse probabilities corresponds to different subtypes of MS or potential clinical trial populations. A relapse probability of zero (0) represents nonactive secondary progressive multiple sclerosis (SPMS) with no relapses; a low (0.01) probability represents nonactive SPMS with minimal relapse or relapsing-remitting multiple sclerosis (RRMS) with add-on therapies to highly effective treatment such as ocrelizumab; moderate (0.05) and high (0.1) probabilities represent either active SPMS or RRMS.12,13 Therefore, the results of this first simulation estimate the power under several realistic clinical trial scenarios.
The probability of other causes of EDSS worsening has not been established hence our simulation assumed a range of probabilities including 0, 0.01, 0.05, or 0.1. This range was a necessary addition to our simulation to account for interrater variability which has shown to impact measurement of disability. 14
For treatment effect on disability worsening rate or relapse rate, we assumed rate ratios of 0.4, 0.5, 0.6, 0.7, 0.8, 0.9, and 1, which reflected the range of treatment effects shown in the updated network meta-analysis when comparing both low and high efficacy treatments relative to placebo. 15
The outcome definitions that were compared in this analysis were (1) time to first disability accumulation on the EDSS without confirmation, (2) time to first disability accumulation on the EDSS in the absence of concurrent relapse without confirmation, (3) time to first disability accumulation on the EDSS with one visit of confirmation, (4) time to first disability accumulation on the EDSS in the absence of concurrent relapse with one visit of confirmation, (5) time to first disability accumulation on the EDSS with two visits of confirmation, and (6) time to first disability accumulation on the EDSS in the absence of concurrent relapse with two visits of confirmation. For each of these outcomes, we estimated the treatment effect using a Cox proportional hazards model with a main effect of treatment, and we performed the analysis at the two-sided 0.05 level.
In the initial set of simulation studies, we estimated the type I error rate associated with each outcome definition. For this, we assumed no treatment effect on either the probability of disease progression, the probability of relapses, or the probability of other increases on the EDSS. This simulation ensured that each analysis approach maintained the appropriate type I error rate of 0.05 when there was no treatment effect on any aspect of the disease.
In the second set of simulations, we assumed patients could increase on the EDSS due to progression-related worsening (probability = 0.025, 0.05, 0.1) or due to relapses (probability = 0, 0.01, 0.05, 0.1), but the probability of worsening due to other causes was equal to 0. Additionally, we assumed a treatment effect only on the probability of disease progression, and we assume that the risk ratio comparing the treatment group to the placebo group was between 0.4 and 1 with a step size of 0.1. In this simulation, we assumed no effect on the probability of relapse.
In the third set of simulations, we assumed patients could increase on the EDSS due to worsening related to progression, relapse, and other factors. The probability of progression was assumed to be 0.025 or 0.1, the probability of a relapse was assumed to be 0.01 or 0.05, and the probability of other factors was assumed to be 0.01, 0.05, and 0.1. As with the previous simulation, the treatment was assumed to only impact the probability of progression, and the risk ratio comparing the treatment group to the placebo group was between 0.4 and 1 with a step size of 0.1. In this simulation, we assumed no effect on the probability of a relapse. This simulation was designed to evaluate the combined impact of increases on the EDSS due to progression, relapse, and other factors, while isolating the treatment effect on progression.
In the fourth set of simulations, we used the same approach as the second simulation setting, but we allowed there to be a treatment effect on both the probability of progression and the probability of relapse. We assumed a risk ratio comparing the treatment group to the placebo group for both progression and relapse to be between 0.4 and 1 with a step size of 0.1. In this simulation, the probability of other increases on the EDSS was 0.
In the fifth set of simulations, we used the same approach as the third simulation setting, but we allowed there to be a treatment effect on both the probability of progression and the probability of relapse. We assumed a risk ratio comparing the treatment group to the placebo group for both progression and relapse to be between 0.4 and 1 with a step size of 0.1.
All statistical simulations were completed in the statistical package R version 4.4.2 (www.r-project.org).
Results
In the first set of simulations, data were generated under the null hypothesis of no treatment effect on the probability of progression, relapse, or other increases on the EDSS. The simulation results demonstrated that each of the six outcome measures maintained the appropriate type I error rate of approximately 0.05 across all sets of values for the probability of progression (column variable), relapse (row variable), or other increase (x-axis), which demonstrated that each outcome measure can be used for valid statistical inference (Figure 1).
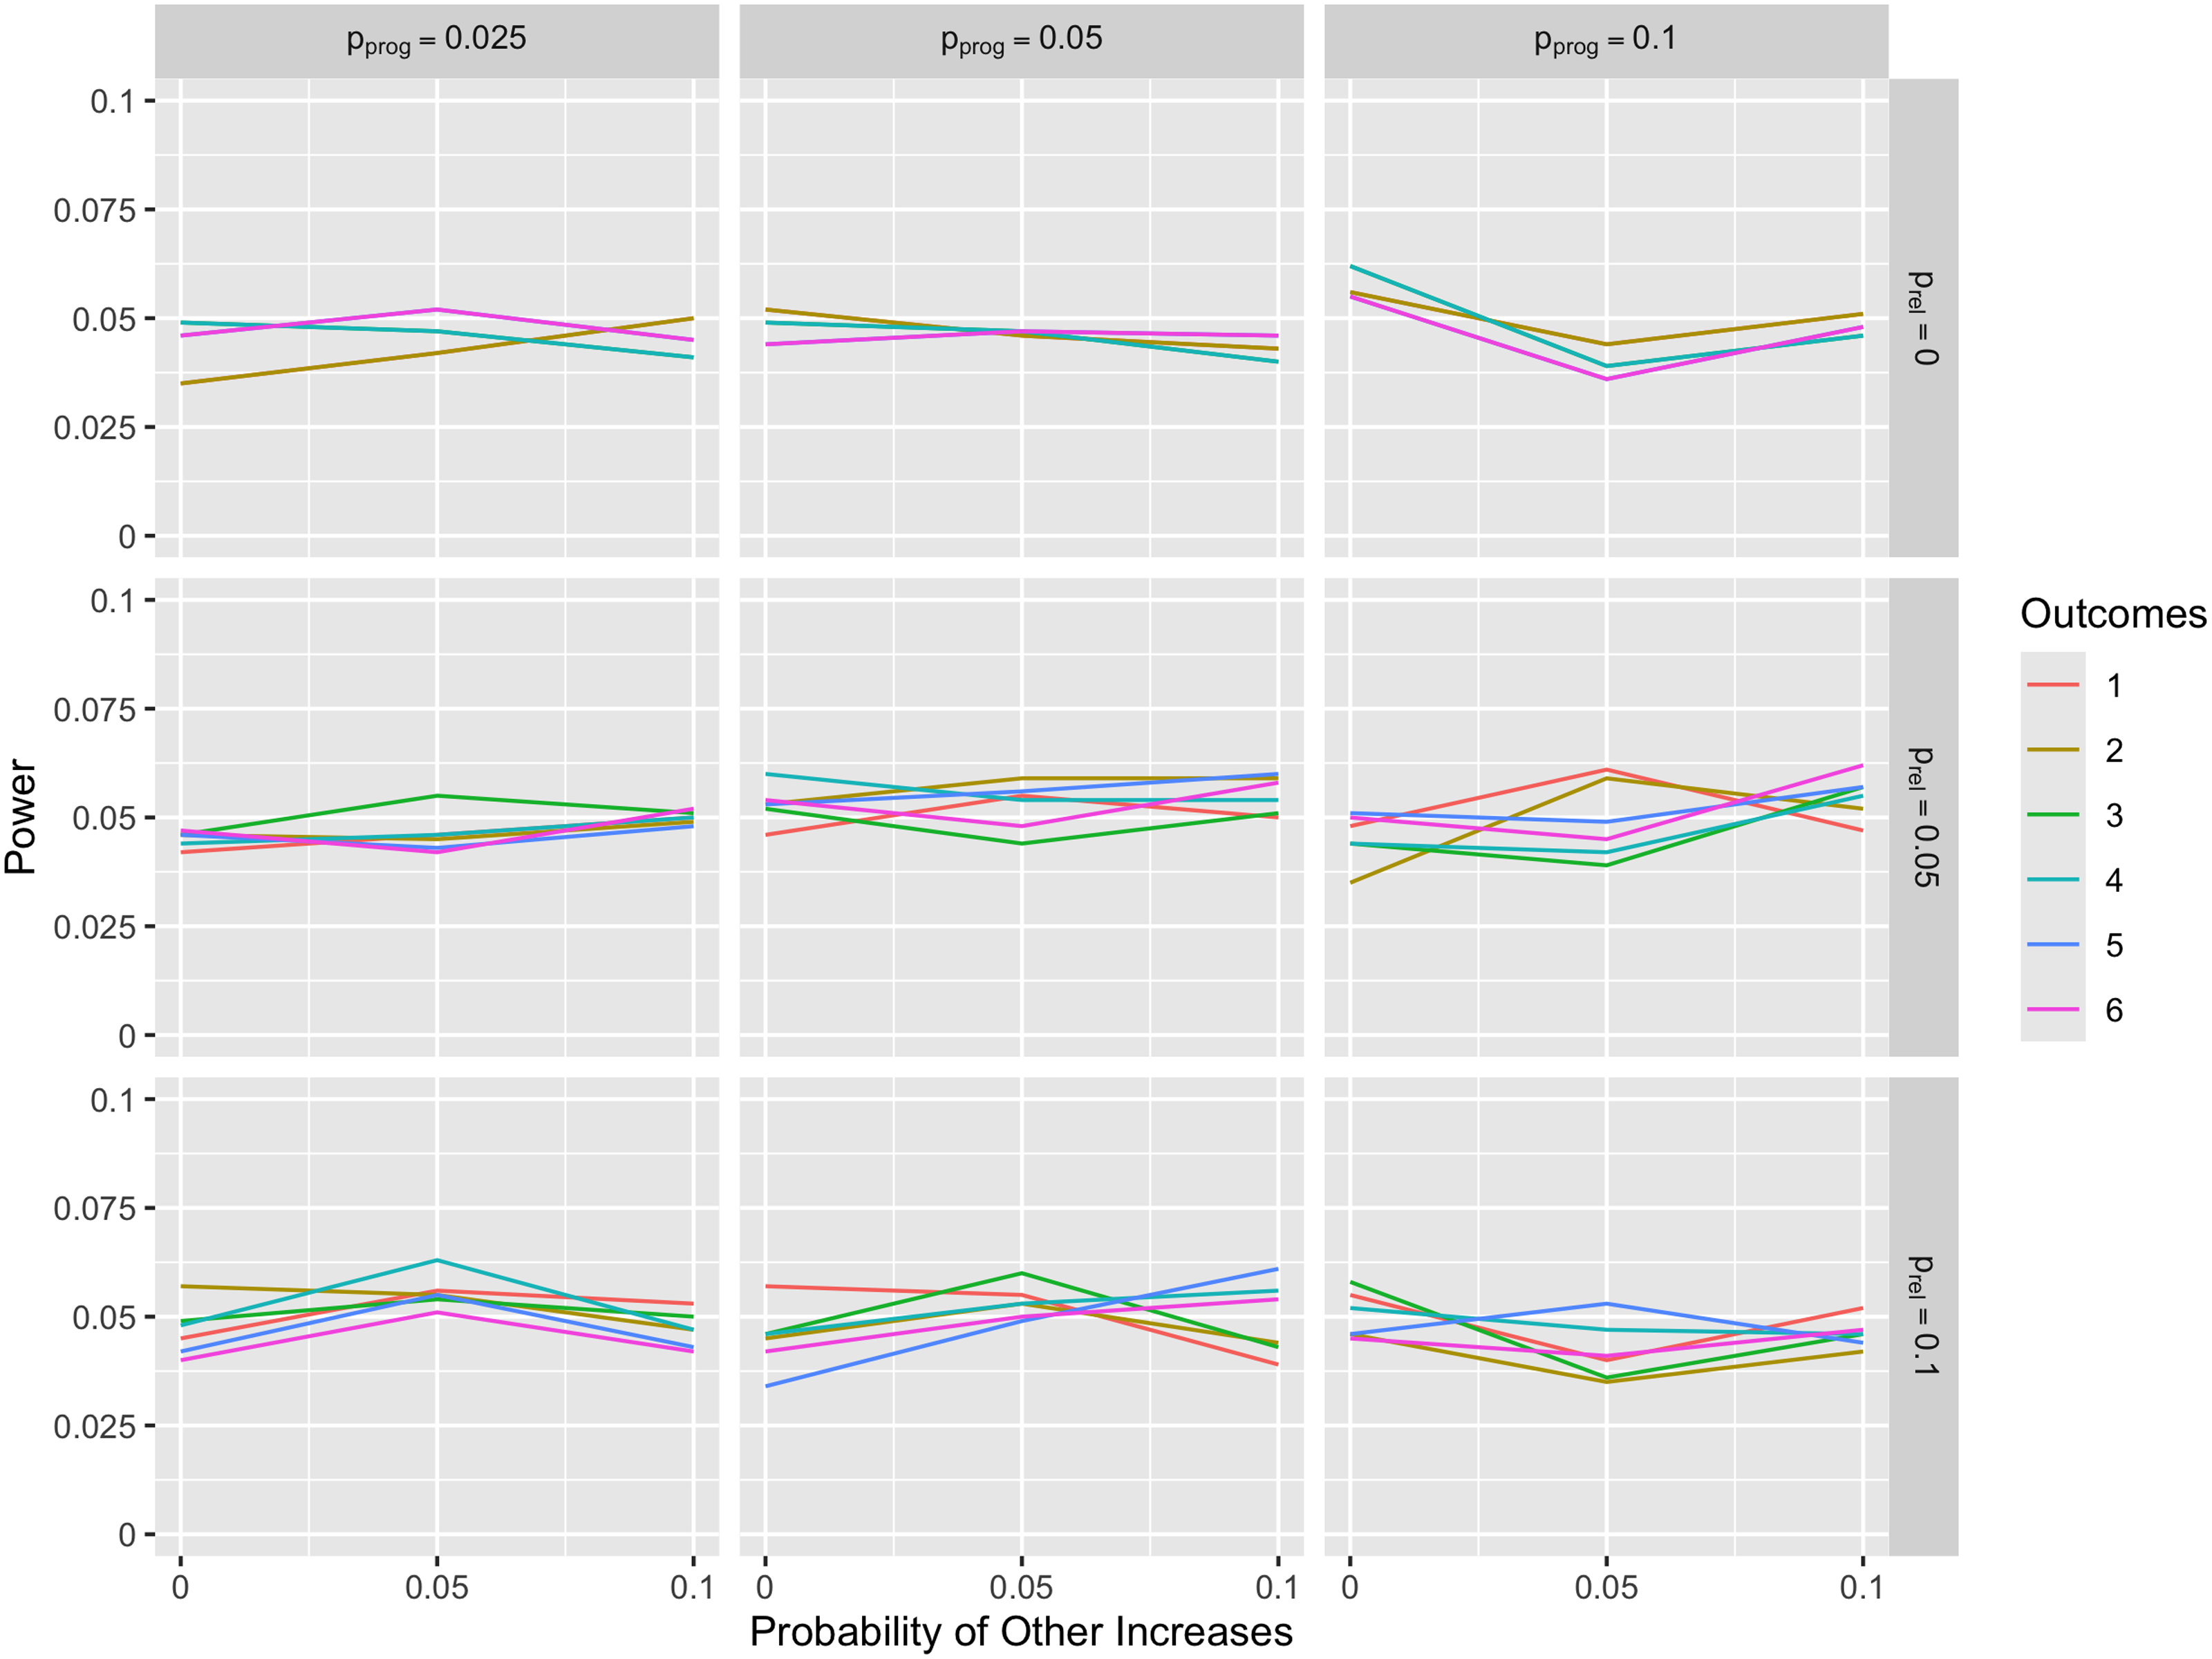
Comparison of type I error for simulation scenarios. The lines on the graphs show probability of rejecting the null hypothesis (i.e. type I error rate) as a function of probability of other increases with the columns representing probability of progression and the rows representing probability of a relapse. The outcomes legend on the right shows each of the six definitions represented with a different color in the line plot. These six outcomes show the time to these six events: (1) time to disability accumulation on the EDSS without confirmation, (2) time to disability accumulation on the EDSS in the absence of concurrent relapse without confirmation, (3) time to disability accumulation on the EDSS with 6-month confirmation, (4) time to disability accumulation on the EDSS in the absence of concurrent relapse with 6-month confirmation, (5) time to disability accumulation on the EDSS with 12-month confirmation, and (6) time to disability accumulation on the EDSS in the absence of concurrent relapse with 12-month confirmation. EDSS: expanded disability status scale.
In the second set of simulations, there was a treatment effect on the probability of progression and the EDSS could increase due to progression or relapse only (i.e. the probability of EDSS increase due to other causes was equal to 0). All outcomes maintained the type I error rate for all scenarios (bottom right point for each graph when risk ratio = 1). When the relapse probability was also equal to 0 (top row of Figure 2), outcomes 1 and 2 were equivalent, outcomes 3 and 4 were equivalent, and outcomes 5 and 6 were equivalent, leading to only three lines in these graphs. Both outcomes 1 and 2 had the highest power of detecting the treatment effect. This result held regardless of the probability of progression, but higher probabilities of progression were associated with higher power. Further, outcomes 3 and 4 had higher power compared to outcomes 5 and 6. These results demonstrated that, in the absence of EDSS increases due to relapses and other causes, confirmation visits decreased the power to detect treatment effects, and a second confirmation visit leads to an even greater decrease in statistical power.

Comparison of power across different relapse and progression probabilities with treatment effect on progression only. The lines on the graphs show power as a function of the treatment effect on the probability of progression expressed as the risk ratio. Values of 0.4, 0.5, 0.6, 0.7, 0.8, 0.9, and 1 for the risk ratio are presented. The columns show three possible values (0.025, 0.05, 0.1) for the probability of progression in the placebo group, and the rows show four possible values for the probability of relapse (0, 0.01, 0.05, 0.1). The outcomes legend on the right shows the color associated with each of the six outcome definitions. The six outcomes were the time to these six events: (1) time to disability accumulation on the EDSS without confirmation, (2) time to disability accumulation on the EDSS in the absence of concurrent relapse without confirmation, (3) time to disability accumulation on the EDSS with 6-month confirmation, (4) time to disability accumulation on the EDSS in the absence of concurrent relapse with 6-month confirmation, (5) time to disability accumulation on the EDSS with 12-month confirmation, and (6) time to disability accumulation on the EDSS in the absence of concurrent relapse with 12-month confirmation. EDSS: expanded disability status scale.
When the relapse probability was greater than zero (second, third, and fourth rows of Figure 2), outcome 2 was no longer equivalent to outcome 1, and outcome 2 had the highest power among the outcomes. In particular, the additional condition of the absence of concurrent relapses in outcome 2 led to improved power for outcome 2 compared to outcome 1, and the difference was the largest as the probability of relapse increased (fourth row of Figure 2). When compared to outcomes 3–6, outcome 2 had higher power than any of these outcomes, demonstrating that the confirmation visits led to a small decrease in power to detect a treatment effect regardless of the risk ratio. Outcome 6 had lower power compared to outcome 4 in all scenarios, showing that requiring a second confirmation visit also led to a decrease in power. Finally, the power of all outcomes was observed to increase as the treatment effect measured by the risk ratio increased and the probability of progression increased.
For the third set of simulations, the probability of other increases on the EDSS was assumed to equal 0.01, 0.05, or 0.1 (Figure 3). All outcomes maintained the type I error rate for all scenarios (bottom right point for each graph when risk ratio = 1). In this case, outcome 4 generally had the highest power across the simulations. Outcome 4, time to disability accumulation on the EDSS in the absence of concurrent relapses with 6-month confirmation (i.e. PIRA), best handled the fact that the EDSS could increase due to relapses and other causes. An important exception to this was when the probability of relapse and probability of other increases were low (0.01) compared to the probability of progression (0.1) (fourth column of Figure 3). In this case, outcome 2 had the highest power by a small margin, indicating that when the majority of the EDSS events are due to progression, outcome 2 led to the best performance. Conversely, when the probability of other increases was high, both outcomes 1 and 2 had noticeable lower power compared to the other outcomes. In nearly all cases, outcome 1 had the worst performance because EDSS increases associated with relapses or other causes were common and equally distributed between the two treatment groups.
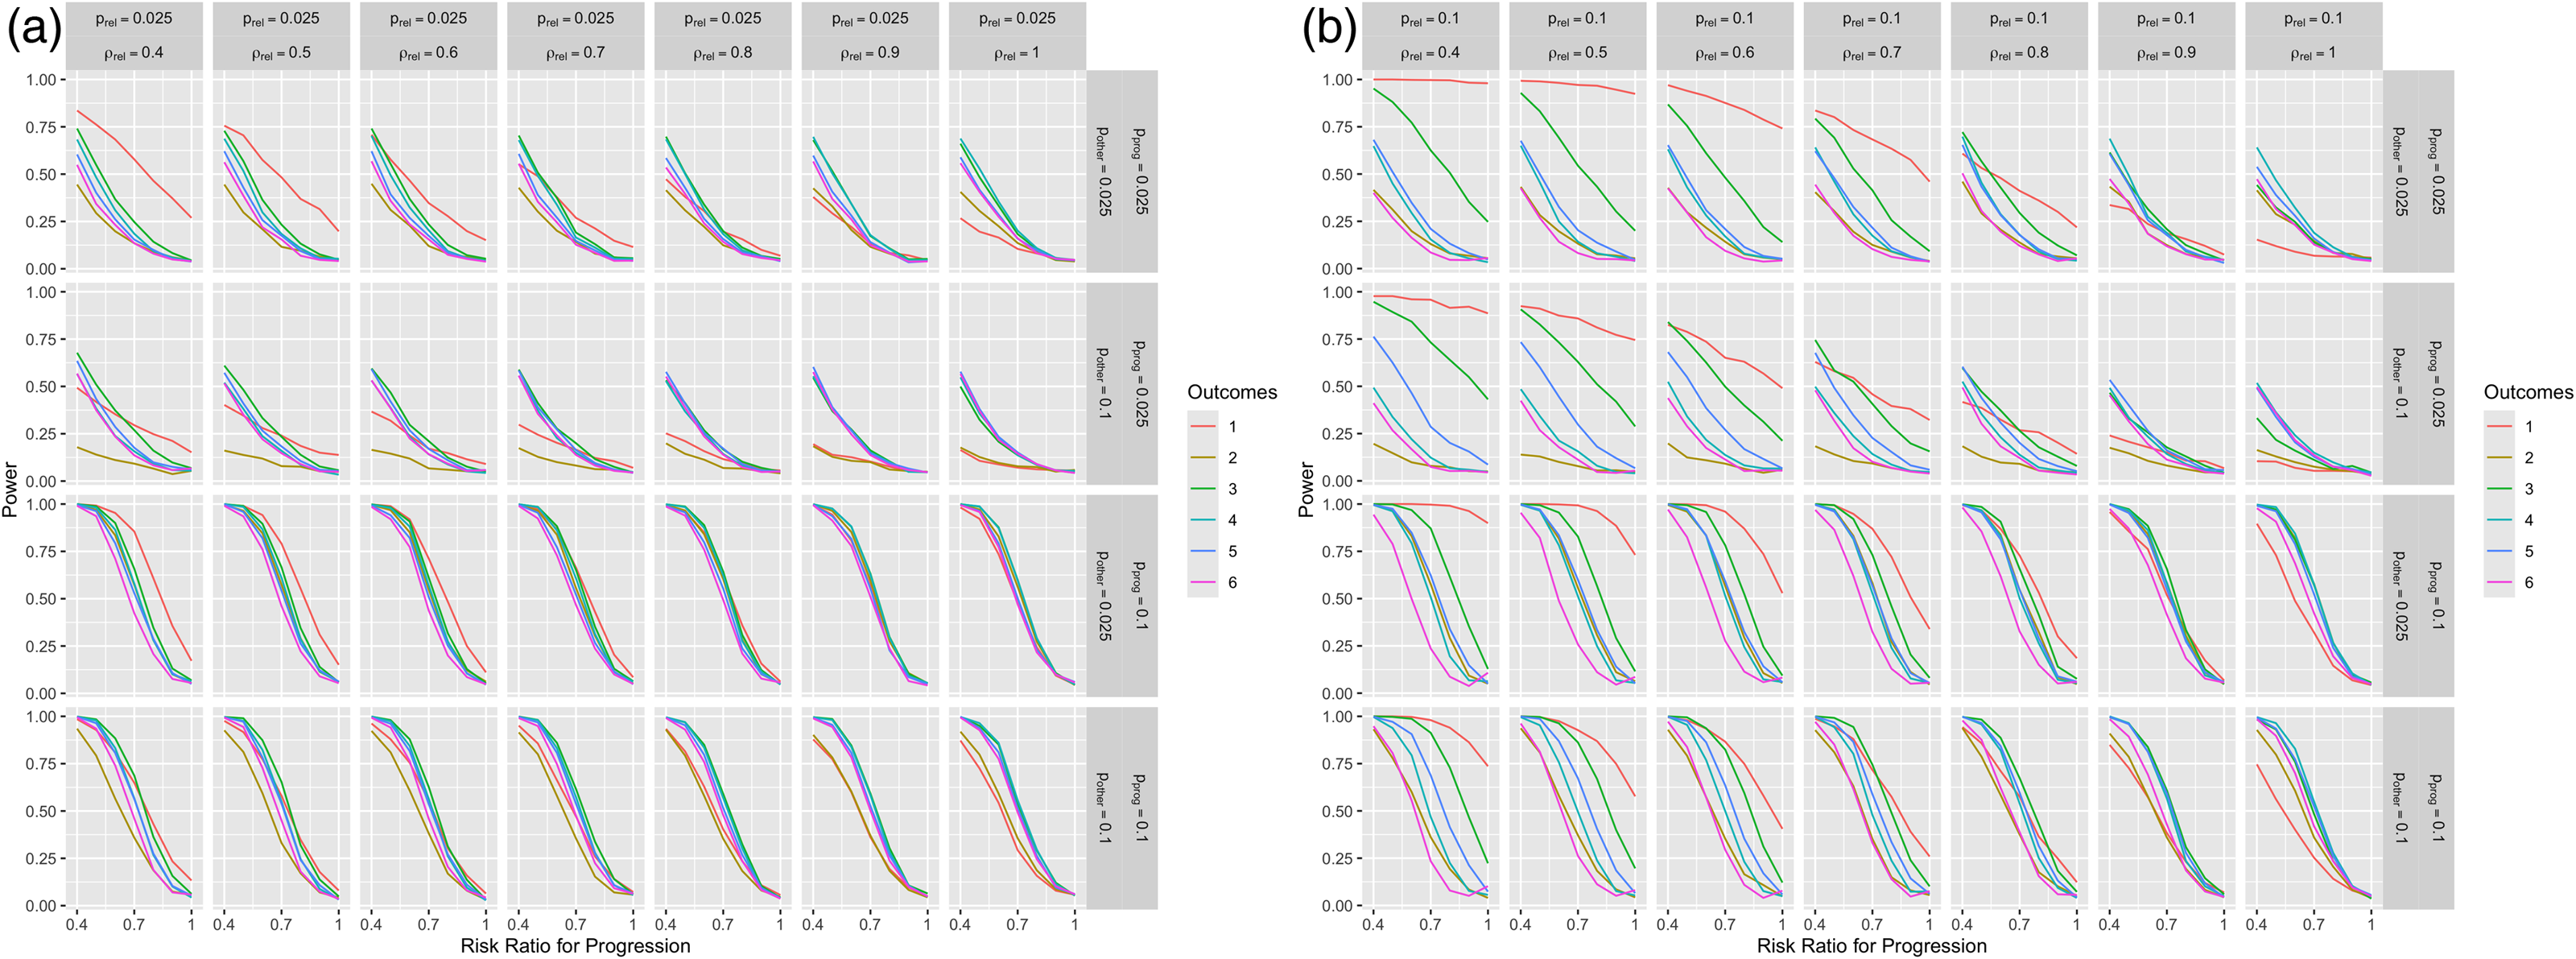
In the fourth sets of simulations, the treatment had an effect on both the probability of a relapse and the probability of progression, and there were only increases on the EDSS due to relapses and progression (Figure 4(a) and (b)). Figure 4(a) shows the results when the probability of progression is equal to 0.025, and Figure 4(b) shows the results when the probability of progression is equal to 0.1. Outcomes 1 and 3 failed to maintain the type I error rate when there was no effect on progression (bottom right point for each graph when risk ratio for progression = 1), demonstrating that this outcome is not providing a valid test of the treatment effect on progression. Therefore, these outcomes should not be used. Conversely, outcomes 2, 4, 5, and 6 approximately maintain the type I error rate at 0.05 when there is no treatment effect on progression, indicating that these definitions could be used in trials. Among these definitions, outcome 2 provided slight improvements in power as seen in Figure 2, but the differences were small.

Comparison of power across different relapse, progression, and other increase probabilities with treatment effects on progression. The lines on the graphs show the estimated power as a function of the treatment effect on the probability of progression expressed as the risk ratio. Values of 0.4, 0.5, 0.6, 0.7, 0.8, 0.9, and 1 for the risk ratio are presented. The columns show two possible values for the probability of progression in the placebo group (top label; 0.025 or 0.1) as well as three possible values for the probability of EDSS increases due to other causes (bottom label; 0.01, 0.05, 0.1). The rows show two possible values for the probability of relapse (0.01, 0.05). The outcomes legend on the right shows the color associated with each of the six outcome definitions. The six outcomes were the time to these six events: (1) time to disability accumulation on the EDSS without confirmation, (2) time to disability accumulation on the EDSS in the absence of concurrent relapse without confirmation, (3) time to disability accumulation on the EDSS with 6-month confirmation, (4) time to disability accumulation on the EDSS in the absence of concurrent relapse with 6-month confirmation, (5) time to disability accumulation on the EDSS with 12-month confirmation, and (6) time to disability accumulation on the EDSS in the absence of concurrent relapse with 12-month confirmation. EDSS: expanded disability status scale.

Comparison of power across different relapse and progression probabilities with treatment effects on relapses and progression. The lines on the graphs show the estimated power as a function of the treatment effect on the probability of progression expressed as the risk ratio. Values of 0.4, 0.5, 0.6, 0.7, 0.8, 0.9, and 1 for the risk ratio are presented on the x-axis. The probability of relapse is equal to 0.025 for all facets of (a) and equal to 0.1 for all facets of (b). The columns show different risk ratios for the treatment effect on the probability of a relapse. The rows in both parts show two possible values for the probability of progression (0.025, 0.1). The outcomes legend on the right shows the color associated with each of the six outcome definitions. The six outcomes were the time to these six events: (1) time to disability accumulation on the EDSS without confirmation, (2) time to disability accumulation on the EDSS in the absence of concurrent relapse without confirmation, (3) time to disability accumulation on the EDSS with 6-month confirmation, (4) time to disability accumulation on the EDSS in the absence of concurrent relapse with 6-month confirmation, (5) time to disability accumulation on the EDSS with 12-month confirmation, and (6) time to disability accumulation on the EDSS in the absence of concurrent relapse with 12-month confirmation.
In the final sets of simulations, the treatment had effects on both the probability of a relapse and the probability of progression, and there were increases on the EDSS due to relapses, progression, and other causes (Figure 5). As with the previous figure, outcomes 1 and 3 failed to maintain the type I error rate when there was no effect on progression (bottom right point for each graph when risk ratio for progression = 1), demonstrating that this outcome is not providing a valid test for the treatment effect on progression. Outcomes 2, 4, 5, and 6 approximately maintain the type I error rate at 0.05 when there is no treatment effect on progression, indicating that these definitions could be used in trials. Among these definitions, outcome 4 had the highest power across the scenarios as seen in Figure 3.
Comparison of power across different relapses, progression, and other increase probabilities with treatment effects on relapses and progression. The lines on the graphs show the estimated power as a function of the treatment effect on the probability of progression expressed as the risk ratio. Values of 0.4, 0.5, 0.6, 0.7, 0.8, 0.9, and 1 for the risk ratio are presented on the x-axis. The probability of relapse is equal to 0.025 for all facets of (a) and equal to 0.1 for all facets of b. The columns show different risk ratios for the treatment effect on the probability of a relapse. The rows in both parts show two possible values for the probability of progression (0.025, 0.1) and two possible values for the probability of other increases (0.025, 0.1). The outcomes legend on the right shows the color associated with each of the six outcome definitions. The six outcomes were the time to these six events: (1) time to disability accumulation on the EDSS without confirmation, (2) time to disability accumulation on the EDSS in the absence of concurrent relapse without confirmation, (3) time to disability accumulation on the EDSS with 6-month confirmation, (4) time to disability accumulation on the EDSS in the absence of concurrent relapse with 6-month confirmation, (5) time to disability accumulation on the EDSS with 12-month confirmation, and (6) time to disability accumulation on the EDSS in the absence of concurrent relapse with 12-month confirmation.
Discussion
In this paper, we have assessed several definitions for the primary outcome of a clinical trial in MS focused on progression. All definitions maintained the type I error under the global null of no treatment effect on the disease. Further, the results show that the definition with the highest power depends on the mechanisms for EDSS increases as well as the treatment effect. When the treatment impacts only the probability of disease progression and EDSS increases only occur due to relapses or progression, the outcome focused on an increase on the EDSS without a concurrent relapse at a single visit (outcome 2) led to the highest statistical power. Importantly, confirmation visits became important when there were EDSS increases due to other causes like interrater difference or fatigue. When treatment has an impact on both relapses and progression, some of the outcomes failed to maintain the type I error rate when there was no effect of the treatment on progression, indicating that these outcomes should not be used. Other outcomes were appropriate to measure treatment effect on progression, and the best approach followed the same patterns as when there was no treatment effect on relapses.
Many MS clinical trials have used CDW as the primary outcome when measuring disease progression, which corresponds to outcome 3 in our simulation.2,16 This outcome was rarely chosen as the outcome with the most power across our simulations, and this outcome did not maintain the type I error rate in some cases where there was a treatment effect on both progression and relapses. A recent article investigated definitions of disability worsening and advocated adding increases on timed 25-ft walk or the nine-hole peg test to increases on the EDSS. 7 Although adding these measures would allow the definition to incorporate other aspects of the disease measured by the multiple sclerosis functional composite (MSFC) that are not measured well by the EDSS, 17 it is not clear that this change would solve the problem associated with relapse-associated worsening or EDSS increases due to other causes.
In addition to CDW, several researchers have advocated using PIRA as a measure of disability accumulation. One definition of PIRA is that a patient must experience an increase on the EDSS in the absence of a relapse that is confirmed at the next visit. 9 This corresponds to our outcome 4. More recently, the definition of PIRA has been adjusted to require three visits with an increase on the EDSS and the absence of a relapse, which would correspond to our outcome 6. 10 If the primary goal is to reduce the impact of relapse on the estimation of a treatment effect on progression, our simulation results show that requiring one or two confirmation visits lead to a decrease in power compared to requiring an EDSS increase in the absence of a relapse at a single visit. Outcome 4 was the chosen definition when there was a moderate or high probability of EDSS increases due to causes other than relapses or progression. While this is a potential concern for a trial, several attempts have been made to increase the interrater reliability and measurement of the EDSS including the NeuroStatus. 18 Although PIRA performing well in the presence of EDSS increases due to other causes is an important result, improvement in the measurement of the EDSS might also reduce this source of error.
An important implication of our results is that a likely scenario for progressive MS trials is the simulation in which there are increases in the EDSS just due to relapses or progression and the treatment is only impacting the probability of progression. In this case, the outcome that led to the greatest power was an increase on the EDSS at a single time point in the absence of a concurrent relapse. Since our results indicate the strength of outcome 2 or outcome 4 depending on the presence of other increases on the EDSS, the burden of frequent clinical visits would likely be reduced for the patients as these outcomes require one confirmation visit at most. These improvements in patient experience could influence patient adherence to trial protocols and potentially lead to more reliable data.
In our simulations, we considered EDSS increases due to relapses, progression, or other causes. Another important outcome for MS trials is new or enhancing magnetic resonance imaging (MRI) lesions. When a clinical trial includes MRIs at the same time intervals as the clinical visits, new or enhancing MRI lesions could be considered the same as relapses for the analysis because even asymptomatic lesions are detected. Using our simulation framework, inclusion of MRI relapses in the outcome definition would focus attention on the simulation scenarios where the relapse probability is higher, which corresponds to the final two rows of Figure 2 as an example. When a trial does not have MRIs or has MRIs at less frequent intervals, some MRI relapses will not be observed (though symptomatic relapses will still be captured clinically). Consequently, any accompanying EDSS increases stemming from the asymptomatic lesions will be considered an EDSS increase for the other reasons in our simulation. Therefore, the results shown in Figures 3 and 5 would be most relevant for this case.
The results from Figures 4 and 5 assessed when a treatment impacts both the probability of progression and the probability of a relapse. Treatments impacting both relapses and progression may be quite common as demonstrated in the recent MS trials. 16 In this case, outcomes 1 and 3 failed to maintain the type I error rate in at least some cases when there was no treatment effect on progression. This means that these outcomes should not be used to estimate the treatment effect on progression since they will reject the null in favor of the treatment too often. In terms of comparison of the outcomes that did maintain the type I error rate, these simulations showed similar results to the results from Figures 2 and 3 in that outcome 2 had the best performance in the absence of EDSS increases due to other causes and outcome 4 had the best performance in the presence of EDSS increases due to other causes.
Our paper has several limitations that warrant further discussion. First, our simulation focused on relapses that led to transient worsening only. This means that no subjects had relapse-associated worsening that was sustained. This type of worsening would have led to a larger number of events in outcomes 3 and 5 since these outcomes do not include relapses. Second, our simulation focused exclusively on power calculations to compare the analysis approaches. Although power is an important consideration for clinical trials, estimation of the treatment effect is also a consideration. Future analyses will compare the outcomes in terms of estimation of the treatment effect. Third, our simulation assumed specific probabilities for EDSS increases due to disease progression, relapse, and other causes that may not fully capture the variability and complexity of MS progression in clinical practice which may limit generalizability of our findings. Fourth, our simulation did not include EDSS improvement. Since EDSS improvement would lower the number of progression events observed in the trial, the estimated power would be lower in the presence of improvement compared to our reported results. Finally, our simulation focused on EDSS progression. Although our results could be applied to other measures of disease progression that are dichotomized like specific amount of worsening on the MSFC, the specific parameters used and the impact of relapses or measurement error might be different than what we observed in our simulation.
Conclusions
The choice of the outcome measure has an important impact on the power of clinical trials in MS. Clinical trials should consider both the mechanism of action of the treatment and patient population when choosing the best outcome definition.
Footnotes
Declaration of conflicting interests
The authors declared no potential conflicts of interest with respect to the research, authorship, and/or publication of this article.
Funding
The authors received no financial support for the research, authorship, and/or publication of this article.
Ethical approval
Since the data in this study was simulated, there were no human participants or data.
Data availability
Data sharing not applicable to this article as no datasets were generated or analyzed during the current study.