
Abstract
Background
Optic neuritis (ON) is a common manifestation of multiple sclerosis and related disorders (MSRD) characterized by retinal neurodegeneration, including thinning of ganglion cell-inner plexiform layer (GCIPL). Compared to absolute values, inter-eye differences (IED) account for variation in baseline structure and function before ON.
Objectives
To determine retinal layer IED thresholds associated with multimodal visual dysfunction after unilateral demyelinating ON.
Methods
In this cross-sectional study, MSRD participants with and without a history of unilateral ON, and healthy controls underwent optical coherence tomography, best-corrected visual acuity, 2.5% and 1.25% low-contrast letter acuity (LCLA), standard automated perimetry, and color vision testing.
Results
Sixty-six participants with MSRD (33 with unilateral ON history, 33 without ON history) and 15 healthy controls were included. For the ON cohort, a GCIPL IED threshold of 6.5% was associated with dyschromatopsia (AUC = 0.76, p = 0.011), 11% with 1.25% LCLA IED of >5 letters (AUC = 0.75, p = 0.008), 13% with 2.5% LCLA IED of >5 letters (AUC = 0.86, p < 0.001), 15% with VFMD IED of >2 dB (AUC = 0.75, p = 0.031), and 27% with logarithm of minimum angle of resolution IED of >0.3 (AUC = 1.00, p < 0.001). These associations were more robust compared to other retinal layer IED.
Conclusions
GCIPL IED thresholds more accurately reflect multimodal visual dysfunction after ON compared to other retinal layer IED.
Keywords
Introduction
Optic neuritis (ON) affects up to 70% of people with multiple sclerosis and related disorders (MSRD) across their lifetime.1–4 Chronic and persistent visual dysfunction is common following the resolution of the acute phase of demyelinating ON, which is difficult to predict in clinical practice and has important ramifications on patient-reported quality of life.5,6 The ability to prognosticate persistent visual impairment, across various visual modalities, after ON remains limited, and therefore the development of additional tools that are predictive of multimodal visual recovery would be of value in clinical practice.
Optical coherence tomography (OCT) is a non-invasive and reproducible imaging technique enabling high-resolution, three-dimensional imaging of retinal layers. 7 Within the first 6 months following the acute phase of ON, thinning of the peripapillary retinal nerve fiber layer (pRNFL), reflecting axonal loss of retinal ganglion cells, and ganglion cell-inner plexiform layer (GCIPL), predominantly reflecting ganglion cell neuronal drop-out, is typically observed.8,9
Earlier studies have investigated distinct pRNFL thickness cutoffs associated with a decline in visual field mean deviation (VFMD).10,11 However, previous investigations have focused on the examination of a limited number of visual modalities in isolation. Furthermore, limited research exists regarding comparable thresholds for GCIPL thickness, which has been shown to be a more sensitive predictor of visual dysfunction after ON, as compared to pRNFL thickness, since it is less influenced by acute retinal nerve fiber layer edema. 8 Absolute values of pRNFL or GCIPL thickness do not account for the variation in baseline (pre-ON) thickness of these layers between subjects, whereas inter-eye differences (IED) in people with unilateral ON might better capture the extent of loss by using the non-ON eye as a control and provides a subject-specific measure of retinal ganglion cell reserve after ON. 12
In this study, we sought to: (1) evaluate the relationships of inter-eye pRNFL, GCIPL, and deeper retinal layer thickness loss after unilateral ON (expressed as a percentage loss relative to the contralateral unaffected eye) with visual dysfunction across various modalities comprising best-corrected visual acuity, low contrast letter acuity, VFMD, and color vision; and (2) estimate specific retinal layer IED cutoff values associated with the highest accuracy of predicting persistent dysfunction across these visual modalities after demyelinating ON.
Methods
Study participants
Participants were recruited by convenience sampling from a longitudinal observational study conducted at the Multiple Sclerosis (MS) and Neuroimmunology clinic of Cedars-Sinai Medical Center (MS-Research Biomarkers study, ClinicalTrials.gov identifier NCT05204459) who underwent research study assessments between September 2021 and December 2023. Participants diagnosed with MSRD, as well as healthy controls (HC), were included in analyses. The MSRD cohort consisted of participants diagnosed with MS and clinically isolated syndrome (CIS), who have had a history of unilateral ON, as well as no known prior ON history or optic neuropathy in the contralateral eye (Figure 1). MS diagnosis was confirmed by the treating neurologists (OA, NS, MK, and BG) in accordance with the 2017 revised McDonald criteria. 13 A control cohort of MSRD patients without a history of ON in either eye matched by age, sex, race, diagnosis, and disease duration was also included in analyses (Table 1). 13 Participants were excluded if they had (1) a history of recent acute ON within six months of enrollment, (2) bilateral ON or optic neuropathy, and (3) presence of ophthalmological disorders that could confound OCT measurements in either eye, including but not limited to: recent ocular surgery within the last two months, refractive errors equal to or greater than ±6 diopters, glaucoma, age-related macular degeneration, or diabetic retinopathy.

Flowchart depicting the patient selection process. Thumbnails represent GCIPL thickness maps of the right eye (OD) and left eye (OS) for a patient with left ON (left panel) and a HC (right panel).
Study demographics and clinical characteristics.

ON: optic neuritis; SD: standard deviation; RRMS: relapsing-remitting multiple sclerosis; SPMS: secondary progressive multiple sclerosis; CIS: clinically isolated syndrome; IQR: inter-quartile range; EDSS: expanded disability status scale; DMT: disease-modifying therapy.
Kruskal-Wallis rank sum test.
Chi-square test.
Fisher's exact test.
Wilcoxon rank sum test.
Low-/moderate-efficacy DMTs: interferon beta-1a/beta-1b, glatiramer acetate, dimethyl/diroximel fumarate, and S1P receptor modulators.
High-efficacy DMTs: natalizumab and anti-CD20 B-cell treatment.
Optical coherence tomography
Study participants underwent OCT imaging using a spectral-domain Cirrus HD-OCT device (model 5000, software version 11.5.2; Carl Zeiss Meditec, Dublin, CA). Peripapillary and macular scans were obtained using the Optic Disc Cube 200 × 200 and Macular Cube 512 × 128 protocols, respectively. Scans with a signal strength below 7, out of a maximum of 10, were excluded from the analysis. All macular cube scans were reviewed to ensure proper fixation and sufficient quality per the OSCAR-IB criteria. 14 Cirrus HD-OCT software was used to generate pRNFL thickness measures for both eyes of study participants as described in detail elsewhere.15,16 Macular OCT segmentation was performed using an automated open-source system to compute thicknesses of the GCIPL, inner nuclear and outer plexiform layers (INL), outer nuclear, inner and outer segments (ONL) as described in detail previously.17–19
Visual function testing
Patients underwent the following multimodal visual function testing assessments: best corrected visual acuity (BCVA), low-contrast letter acuity (LCLA) at 2.5% and 1.25% contrast levels, standard automated perimetry, and standardized color vision testing. All tests were conducted monocularly, and habitual glasses or contact lenses were used to correct for any refractive errors as applicable.
BCVA testing was conducted using a Reichert ClearChart 4X Digital Acuity System at a distance of 3 m. BCVA scores were obtained using Snellen notation and converted to the logarithm of the minimum angle of resolution (logMAR) for data analysis. 20 LCLA was conducted using 2.5% and 1.25% Sloan letter charts at 2 m. LCLA scores were calculated based on the number of letters correctly read using each chart.17,18
Standard automated perimetry was performed using an Octopus standard automated perimetry device (Model 600, Haag-Streit Diagnostics, Koeniz Switzerland) utilizing the physiology-based G-pattern protocol and the Tendency-Oriented Perimetry examination strategy. 21 For each tested point in the visual field, the device measured the deviation in sensitivity threshold from the normal reference values, quantified in decibels (dB). 19 The VFMD was calculated for each eye with negative values indicating worse performance compared to a reference healthy population. Unreliable testing results, defined as those having greater than 20% fixation losses, false positive or negative catch trials, were excluded. 21
Standardized color vision assessment was conducted using the Waggoner Computerized Color Vision Test and the Waggoner Adult Diagnostic mode (Ishihara plate-based examination).22,23 Dyschromatopsia was evaluated for each of the color deficiencies: protan (red-green, mostly red), deutan (red-green, mostly green), and/or tritan (blue). Participants with genetic color vision deficiencies were excluded from the analysis.
To binarize the visual functional outcomes, we utilized the following standard definitions for visual dysfunction: LogMAR IED >0.3 (representing a shift from 20/20 to 20/40 on Snellen chart), LCLA IED >5 letters (representing loss of one line on Sloan charts), VFMD IED >2 dB, and >3 incorrect ishihara plates for dyschromatopsia. For BCVA, we considered a logMAR change of >0.3 as clinically significant as suggested by prior studies.24,25 For LCLA, we considered a one-line loss (5 letters) as clinically meaningful in accordance with previous studies. 26
Statistical analysis
Statistical analysis was performed using R (version 2023.3.1.446, R Foundation for Statistical Computing, Vienna, Austria). The Shapiro-Wilk test was used to assess the normality of distributions. Comparisons between groups were performed using Wilcoxon rank-sum or Kruskal-Wallis tests for non-normally distributed continuous data, as well as Fisher's exact or Chi-square tests for categorical variables.
In the ON group, IED for retinal layer thickness measurements, VFMD, and LCLA scores were calculated by subtracting the values of the ON eye from the contralateral non-ON eye values. For retinal layer thickness, the thickness loss was expressed as a percentage relative to the retinal layer thickness in the contralateral fellow eye. In the non-ON and HC groups, IED were calculated by considering the eye with the lower GCIPL thickness value as the index and the contralateral eye as reference in a similar fashion.
To study the relationships between retinal layer thickness and multimodal visual function measures, multivariable linear and logistic regression analyses were used for each of the three groups (ON, non-ON, and HCs groups) adjusting for age, sex, race, and diagnosis (relapsing-remitting MS [RRMS], secondary progressive MS [SPMS], or CIS; only for ON and non-ON groups). Receiver operating characteristic (ROC) curves and the area under the curves (AUC) were generated. Retinal layer thickness optimal cutoff points were generated for various visual functional modalities by maximizing the Youden index. Statistical significance was defined as p < 0.05.
Results
Study population
A total of 66 patients with MSRD (57 RRMS, 2 SPMS, 7 CIS) and 15 HCs participated in the study. The MSRD cohort was divided into ON and non-ON groups with 33 participants in each group matched by age, sex, race, diagnosis, and disease duration (Table 1). GCIPL IED were significantly higher in ON MSRD cases compared to both non-ON MSRD and HCs (median (inter-quartile range [IQR]): 11.4 [10.7]% vs 1.0 [1.7]%, p < 0.001; median [IQR]: 11.4 [10.7]% vs 0.01 [0.01]%, p < 0.001, respectively), and in non-ON MSRD compared to HCs (median [IQR]: 1.0 [1.7]% vs 0.01 [0.01]%, p < 0.001). Similarly, pRNFL IED medians were significantly higher in ON MSRD compared to both non-ON MSRD and HCs only (median [IQR]: 9.4 [11.0]% vs 1.2 [6.2]%, p < 0.001; median [IQR]: 9.4 [11.0]% vs 0.02 [0.03]%, p < 0.001) (Table 2).
Differences in retinal layer thicknesses for the study cohort.
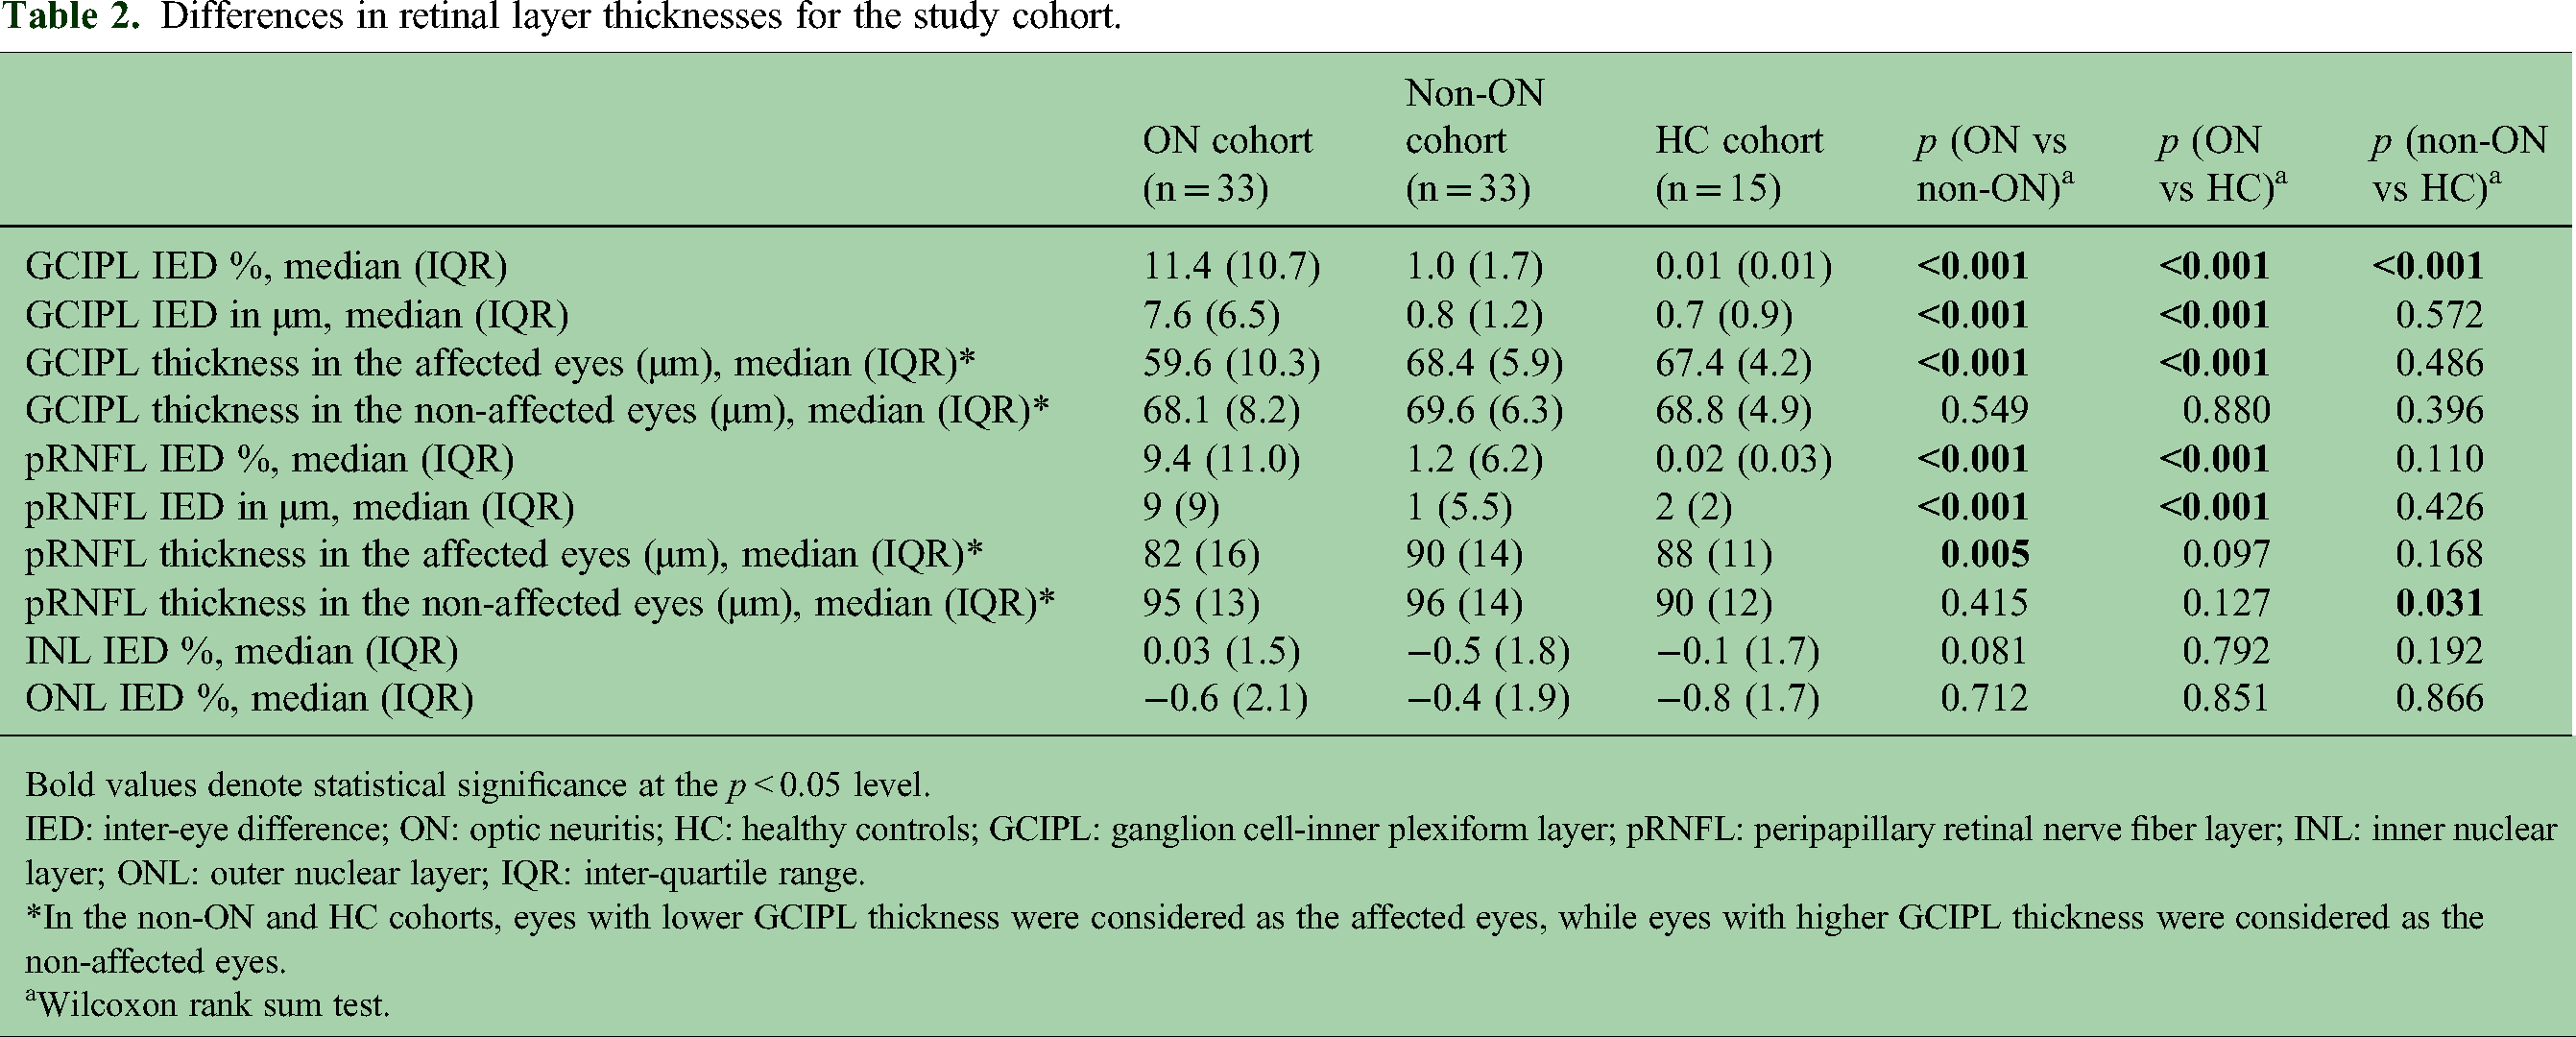
Bold values denote statistical significance at the p < 0.05 level.
IED: inter-eye difference; ON: optic neuritis; HC: healthy controls; GCIPL: ganglion cell-inner plexiform layer; pRNFL: peripapillary retinal nerve fiber layer; INL: inner nuclear layer; ONL: outer nuclear layer; IQR: inter-quartile range.
*In the non-ON and HC cohorts, eyes with lower GCIPL thickness were considered as the affected eyes, while eyes with higher GCIPL thickness were considered as the non-affected eyes.
Wilcoxon rank sum test.
Optimal thresholds associated with multimodal visual dysfunction
Multivariable logistic regression model for ON cohort demonstrated that GCIPL IED increase of 1% was associated with increased odds of BCVA dysfunction (odds ratio (OR) [95% confidence interval (CI)] = 1.21 [1.01–1.45], p = 0.045), 2.5% LCLA dysfunction (OR [CI] = 1.26 [1.10–1.53], p = 0.005), 1.25% LCLA (OR [CI] = 1.16 [1.05–1.34], p = 0.014), and VFMD (OR [CI] = 1.17 [1.03–1.43], p = 0.039), but not color vision (OR [CI] = 1.09 [0.90–1.33], p = 0.385). pRNFL IED increase of 1% was associated with increased odds of 2.5% LCLA dysfunction only (OR [CI] = 1.14 [1.03–1.31], p = 0.023) (Supplemental Table 1). GCIPL IED had higher overall accuracy for detecting BCVA, LCLA, and visual field dysfunction over pRNFL IED (Figure 3 and Table 3). The data for ON cohort is shown in Figure 2.
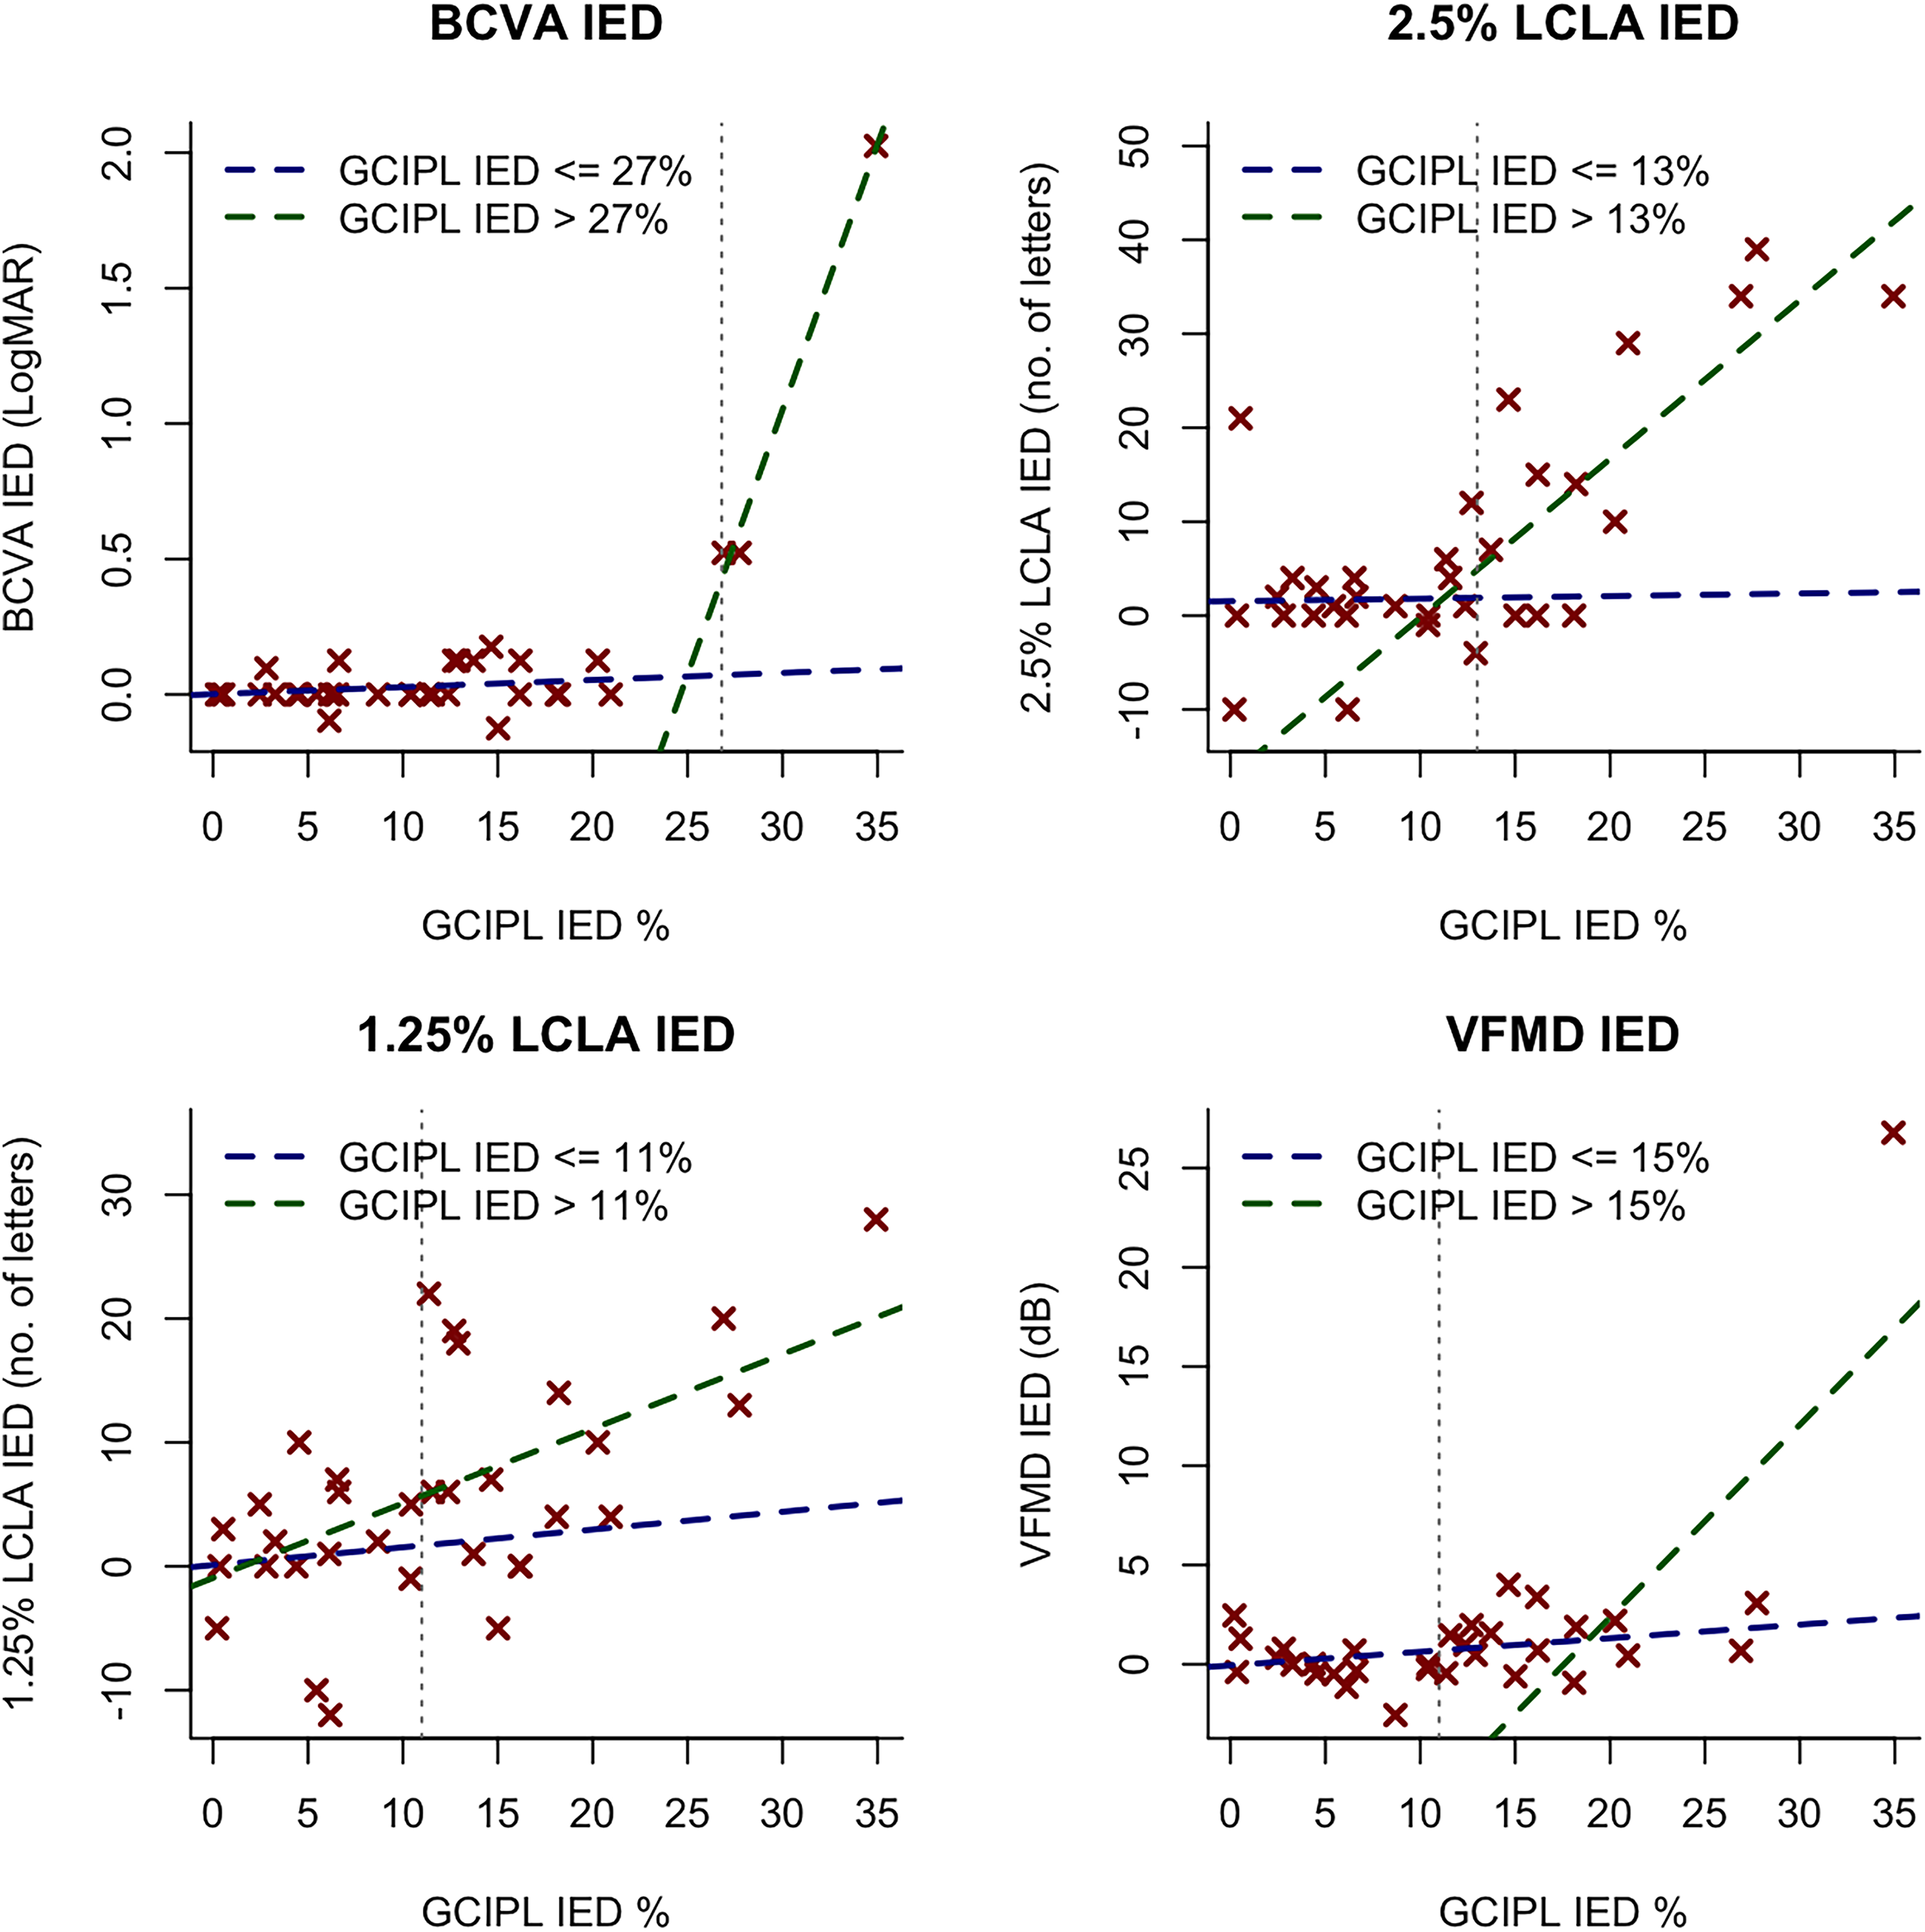
Depiction of the relationship between GCIPL IED and visual function modalities in the optic neuritis subgroup. Regression lines for the data before (blue dashed lines) and after (green dashed lines) the optimal GCIPL IED thresholds (vertical grey dashed lines) are shown. No significant differences detected in the slopes before and after the GCIPL IED thresholds.

ROC curves for GCIPL and pRNFL IED associated with multimodal visual dysfunction. GCIPL IED curves demonstrated improved accuracy in predicting multimodal visual dysfunction, except for color vision.
GCIPL and pRNFL IED optimal cutoff points associated with multimodal visual dysfunction.

Bold values denote statistical significance at the p < 0.05 level and AUC ≥ 0.7.
BCVA: best-corrected visual acuity; LogMAR: logarithm of the minimal angle of resolution; LCLA: low-contrast letter acuity; IED: inter-eye difference; VFMD: visual field mean deviation; GCIPL: ganglion cell-inner plexiform layer; pRNFL: peripapillary retinal nerve fiber layer; AUC: area under the receiver operating characteristic curve; CI: confidence interval; Sens.: sensitivity; Spec.: specificity; Opt. cutoff: optimal cutoff point.
BCVA and LCLA
A GCIPL IED threshold of 27% (AUC = 1.00, CI: [1.00–1.00], p < 0.001), and no significant pRNFL IED thresholds (AUC = 0.66, CI: [0.23–1], p = 0.199) were associated with BCVA dysfunction. 2.5% LCLA dysfunction was associated with a GCIPL IED threshold of 13% (AUC = 0.86, CI: [0.70–1.00], p < 0.001), and a pRNFL IED threshold of 13% (AUC = 0.75, CI: [0.54–0.95], p = 0.003). 1.25% LCLA dysfunction was associated with a GCIPL IED threshold of 11% (AUC = 0.75, CI: [0.58–0.92], p = 0.002), with no significant pRNFL IED thresholds (AUC = 0.63, CI: [0.43–0.83], p = 0.101). INL IED and ONL IED did not show any significant thresholds for BCVA, 2.5% LCLA, or 1.25% LCLA dysfunction (Figure 3).
Moreover, the absolute thicknesses in micrometers demonstrated a GCIPL IED threshold of 20 µm (AUC = 0.91, CI: [1.00–1.00], p = 0.002) but no significant pRNFL IED thresholds were associated with BCVA dysfunction (AUC = 0.64, CI: [0.21–1.00], p = 0.227). A GCIPL IED threshold of 8.5 µm (AUC = 0.82, CI: [0.65–0.99], p < 0.001), and a pRNFL IED threshold of 12 µm (AUC = 0.74, CI: [0.54–0.94], p = 0.012) were associated with 2.5% LCLA dysfunction. A GCIPL IED threshold of 3 µm (AUC = 0.70, p = 0.025), and no significant pRNFL IED thresholds (AUC = 0.63, CI = [0.43–0.83], p = 0.101) were associated with 1.25% LCLA dysfunction. INL IED and ONL IED did not show any significant thresholds associated with BCVA, 2.5% LCLA, or 1.25% LCLA dysfunction.
Visual fields
Using visual field sensitivity loss data (i.e. deviation from age-corrected normative values), VFMD IED of greater than 2 dB was associated with a GCIPL IED threshold of 15% (AUC = 0.75, CI: [0.44–1.00], p = 0.031). No significant pRNFL IED threshold was associated with VFMD dysfunction (AUC = 0.65, CI: [0.29–1.00], p = 0.139). For absolute IED in micrometers, A GCIPL IED threshold of 12 µm (AUC = 0.75 CI: [0.43–1.00], p = 0.030) and no significant pRNFL IED thresholds (AUC = 0.62, CI: [0.28–0.96], p = 0.192) were associated with VFMD dysfunction. No thresholds for INL and ONL IED were observed with VFMD IED.
Color vision
Dyschromatopsia of any type was associated with GCIPL IED threshold of 6.5% (AUC = 0.76 CI: [0.57–0.94], p = 0.011), and pRNFL IED threshold of 8% (AUC = 0.81 [0.63–0.98], p = 0.004). For absolute IED, GCIPL IED threshold was 11 µm (AUC = 0.72 [0.52–0.92], p = 0.027) and pRNFL IED threshold was 6 µm (AUC = 0.81 [0.63–0.98], p = 0.003). Protan and deutan were the most prevalent dyschromatopsia subtypes observed in the ON cohort (52%), followed by tritan deficits (35%). No relationship was observed for INL and ONL IED thresholds with dyschromatopsia of any type. Retinal layer IED optimal cutoff points and ROC curve analysis values are summarized in Table 3, Table 4, and Supplemental Table 2.
GCIPL and pRNFL IED optimal cutoff points associated with color vision dysfunction (dyschromatopsia) across the three cardinal color vision subtypes.
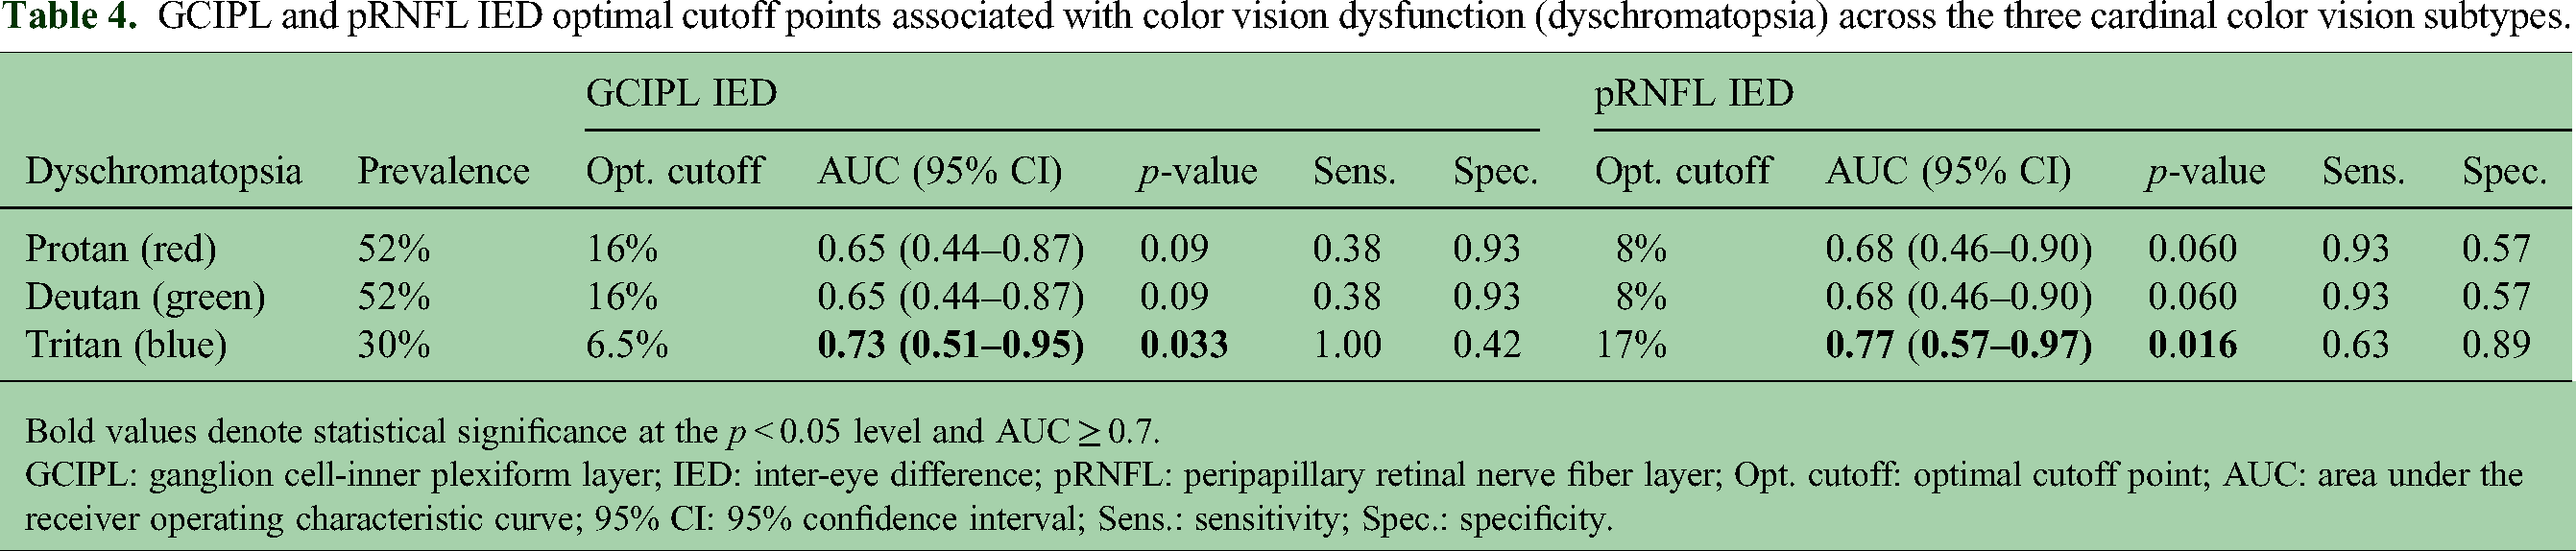
Bold values denote statistical significance at the p < 0.05 level and AUC ≥ 0.7.
GCIPL: ganglion cell-inner plexiform layer; IED: inter-eye difference; pRNFL: peripapillary retinal nerve fiber layer; Opt. cutoff: optimal cutoff point; AUC: area under the receiver operating characteristic curve; 95% CI: 95% confidence interval; Sens.: sensitivity; Spec.: specificity.
Discussion
ON is characterized by inflammatory demyelination of the optic nerve and is a common manifestation of MSRD. Variable rates of visual recovery are often observed after ON, which is in part determined by the extent of axonal transection, neuroaxonal drop-out and retrograde degeneration of retinal ganglion cells. This ultimately results in the thinning of the pRNFL and GCIPL on OCT imaging. 27 Clinical measurements of pRNFL and GCIPL thickness using specialized segmentation algorithms has therefore become an important tool for the diagnosis and management of ON. GCIPL thinning has been shown to demonstrate improved structure-function correlation with respect to pivotal visual outcomes after ON, such as high-contrast, 2.5% low-contrast, and 1.25% LCLA in MSRD. 28 In keeping with these findings, our study demonstrates that the severity of GCIPL thickness loss relative to the contralateral unaffected eye showed the highest association for worse visual outcomes compared to other retinal layers, including pRNFL. More recently, investigations of early GCIPL loss after ON have elucidated the importance of assessing IED in GCIPL thickness for improved sensitivity of ON detection. 29 However, the putative impact of GCIPL IED analysis on prognostication of visual impairment across several modalities has not been previously fully explored.
Interestingly, GCIPL IED thresholds showed distinct associations across visual function modalities. Dyschromatopsia appeared to be the most susceptible to mild degrees of retinal ganglion cell loss. The most prevalent dyschromatopsia subtypes were protan and deutan, followed by tritan dyschromatopsia. This is in line with previous studies showing the distinct relationship between red-green color vision deficits in optic neuropathy. 30 This is followed by deficits in low contrast acuity at 1.25% and 2.5%, which is in accordance with previous investigations demonstrating the sensitivity and reliability of low contrast visual screening in MSRD visual assessment for the detection of demyelinating optic neuropathy, even in the absence of ON history where pRNFL and GCIPL thinning is less pronounced.18,26 VFMD deficits, on the other hand, tended to occur with intermediate GCIPL IED loss thresholds in our study. VFMD reduction has indeed been shown to be a sensitive predictor of ON severity and extent of GCIPL loss. 29
BCVA dysfunction was more apparent in eyes experiencing the greatest extent of retinal ganglion cell loss. Persistent central visual loss after an episode of ON is likely related to the extent of papillomacular bundle (PMB) damage since these fibers directly subserve the macula. 31 Our findings suggest that BCVA deficits are more likely to occur in eyes with the highest extent of either diffuse or more severe retinal macular ganglion cell loss, which is more likely to encompass PMB projections. Additionally, it is known that the central 2 degrees of the visual field corresponds to the BCVA, indicating that high contrast visual acuity is most effective within this narrow field around the fovea. 32 Further studies examining the association between the spatial dynamics of GCIPL IED in the macula (i.e. focal or diffuse) and the pattern of visual field sensitivity loss and BCVA deficits will be needed to confirm the utility of GCIPL IED a surrogate for ganglion cell loss in the very central area of the macula.
In our analysis, we did not observe a significant effect modification relationship between ON history and GCIPL IED with respect to the visual function outcomes tested. This suggests that neuroaxonal loss of retinal ganglion cells appears to be a key factor associated with multimodal visual dysfunction irrespective of the presence of ON or not. Given that the pRNFL primarily consists of unmyelinated retinal ganglion cell axons coursing towards the optic disc, it is not surprising that pRNFL IED was also associated with multimodal visual dysfunction after ON, albeit to a lesser extent compared to GCIPL IED (Table 3). These differences could be explained by differential rates of reactive gliosis, which tends to be more pronounced in the papillary and peripapillary region following ON, manifesting as optic nerve head pallor in the chronic stages of ON following the resolution of acute inflammation.33,34 As a result, this can therefore influence the pRNFL thickness leading to decorrelation in structure-function relationships. In our study, we did not observe significant thresholds for INL or ONL thicknesses and multimodal visual outcomes after demyelinating ON. This could be due to the relatively less pronounced atrophy observed in these layers following ON or the fact that they can be susceptible to dynamic changes with relative increase in thickness during the acute phase, followed by gradual return to or below the baseline thickness months after ON resolution. 16
Our study has several limitations. Given the strict inclusion/exclusion criteria and focus on unilateral ON cases, one of the limitations of our work is the relatively small sample size. In our cohort, the majority of ON participants were not on any disease modifying therapy (DMT) at the time of the ON episode (Table 1). Further longitudinal studies are warranted to closely examine the effect of acute interventions, and maintenance DMT on GCIPL IED and visual outcomes following ON stratified by the underlying diagnostic category. Finally, since our analysis focused on retinal layer IED relative to the contralateral unaffected eye, our study results cannot be generalized to patients having a history of bilateral historical ON or optic neuropathy in the non-ON eye.
In summary, our analyses demonstrate the utility of GCIPL IED as a potential biomarker of retinal ganglion cell neuroprotection after ON that is closely linked with progression of multimodal visual deficits. Compared to GCIPL IED, pRNFL IED thresholds showed a lower overall association with visual dysfunction. These findings carry important implications for the prognostication of visual loss using OCT in MSRD and highlight the role of the anterior visual pathway as a model for assessing neuroprotection in MSRD clinical trials using quantitative structure-function assessments of retinal ganglion cell integrity following ON.
Supplemental Material
sj-docx-1-mso-10.1177_20552173251397302 - Supplemental material for Retinal ganglion cell loss is associated with multimodal visual dysfunction following demyelinating optic neuritis
Supplemental material, sj-docx-1-mso-10.1177_20552173251397302 for Retinal ganglion cell loss is associated with multimodal visual dysfunction following demyelinating optic neuritis by Mustafa Subhi, Sargis Manukyan, Gabriela Zabala, Laura Locke, Brooke Guerrero, Marwa Kaisey, Afshin James Khodabakhsh, Aaron Carass, Jerry L. Prince, Shiv Saidha, Peter A. Calabresi, Nancy L. Sicotte, Pascal Sati and Omar Al-Louzi in Multiple Sclerosis Journal – Experimental, Translational and Clinical
Supplemental Material
sj-docx-2-mso-10.1177_20552173251397302 - Supplemental material for Retinal ganglion cell loss is associated with multimodal visual dysfunction following demyelinating optic neuritis
Supplemental material, sj-docx-2-mso-10.1177_20552173251397302 for Retinal ganglion cell loss is associated with multimodal visual dysfunction following demyelinating optic neuritis by Mustafa Subhi, Sargis Manukyan, Gabriela Zabala, Laura Locke, Brooke Guerrero, Marwa Kaisey, Afshin James Khodabakhsh, Aaron Carass, Jerry L. Prince, Shiv Saidha, Peter A. Calabresi, Nancy L. Sicotte, Pascal Sati and Omar Al-Louzi in Multiple Sclerosis Journal – Experimental, Translational and Clinical
Footnotes
Acknowledgements
We wish to thank all the research participants and their families, who made this study possible. We also wish to thank the staff of the Cedars-Sinai Neurology clinic for their support and assistance with all aspects of our research study.
Ethical considerations
The research protocol was approved by the Cedars-Sinai institutional review board (IRB number: STUDY00001690). All individuals provided written informed consent before enrollment.
Author contributions
MS, SM, PS, and OA conceptualized and designed the study. MS, SM, GZ, LL, BG, MK, and NLS gathered the data. MS, SM, PS, and OA analyzed and interpreted the data. All authors drafted, revised, and critically reviewed the manuscript. NLS, PS, and OA supervised the study.
Funding
The authors disclosed receipt of the following financial support for the research, authorship, and/or publication of this article: This work was supported by the Department of Defense (HT9425-23-1-0571), the Cedars-Sinai Women's Guild Neurology, National MS Society (NMSS) RG-2110-38526, and Erwin Rautenberg Foundation for research support.
Declaration of conflicting interest
The authors declared the following potential conflicts of interest with respect to the research, authorship, and/or publication of this article: SS has received consulting fees from Medical Logix for the development of CME programs in neurology; has served on scientific advisory boards for Biogen, Clene, Genentech, Impaact Bio, Horizon Therapeutics, Amgen, Novartis Pharmaceuticals Corporation, and ReWind Therapeutics; has been a consultant for Genentech, Biogen, InnoCare Pharma, JuneBrain, Kiniksa, LAPIX Therapeutics, Setpoint Medical and Novartis Pharmaceuticals Corporation; is the Principal Investigator of Investigator-initiated studies funded by Biogen, Genentech, and Novartis Pharmaceuticals Corporation; has received support from the Race to Erase MS foundation; has received equity compensation for consulting from JuneBrain; was the site Investigator of trials sponsored by Clene and MedDay; and is the site Investigator of trials sponsored by LAPIX Therapeutics and Novartis Pharmaceuticals Corporation. MS, SM, GZ, LL, BG, MK, AJK, AC, JP, PAC, NLS, PS, and OA declared no potential conflicts of interest with respect to the research, authorship, and/or publication of this article.
Data availability
Anonymized data can be made available upon reasonable email request to the corresponding author (Dr Omar Al-Louzi; omar.allouzi@cshs.org). Requesters will be asked to detail proposed use, and a data sharing agreement will need to be completed.
Supplemental material
Supplemental material for this article is available online.
References
Supplementary Material
Please find the following supplemental material available below.
For Open Access articles published under a Creative Commons License, all supplemental material carries the same license as the article it is associated with.
For non-Open Access articles published, all supplemental material carries a non-exclusive license, and permission requests for re-use of supplemental material or any part of supplemental material shall be sent directly to the copyright owner as specified in the copyright notice associated with the article.