
Abstract
Background
Multiple sclerosis (MS) is characterized by impairment of physical function that is often linked to neuromuscular and cardiovascular deficits. However, the specific contributions of muscle strength and aerobic capacity to physical function in MS are not fully understood.
Objective
This study aimed to investigate the independent roles of maximal muscle strength (MVC) and aerobic capacity (VO2peak) on lower extremity physical function, as measured by the 6-minute walk test (6MWT) and five-time sit-to-stand test (5STS) in people with MS (pwMS).
Methods
In a cross-sectional study, 150 pwMS underwent assessment of VO2peak, maximal voluntary contraction (MVC), and physical function (6MWT and 5STS). Regression analyses were conducted to explore the associations between physiological parameters and physical function.
Results
MVC and VO2peak were moderately associated with (i.e., explained) 6MWT (R² = 0.40, p < 0.001), yet with VO2peak (β = 7.9, std. β = 0.45, p < 0.001) having a preferential influence compared to MVC (β = 48.2, std. β = 0.26, p < 0.001). MVC and VO2peak were weakly associated with (i.e., explained) 5STS (R² = 0.14, p < 0.001), yet with MVC (β = 0.06, std. β = 0.28, p = 0.004) having a preferential influence compared to VO2peak (β = 0.00, std. β = 0.16, p = 0.101).
Conclusion
Both maximal muscle strength and aerobic capacity to physical function in pwMS. Maximal muscle strength was preferentially linked to performance in the 5STS test, whereas aerobic capacity was preferentially linked to performance in the 6MWT. These findings support the need for tailored exercise interventions to target specific physiological deficits during MS rehabilitation.
Introduction
Multiple sclerosis (MS) manifests with a variety of symptoms, 1 with limited physical function as one of the most disabling symptoms, according to patients themselves. 2 Limitations in physical function can be attributed to impairments in two of the main physiological systems: the neuromuscular and cardiovascular systems. Over time, these impairments and limitations can increase disability and are associated with lowered health-related quality of life and higher societal costs. 3 Hence, treatments to reduce disability are highly warranted.
One treatment shown to be highly effective in improving physical function (e.g. walking capacity) in persons with MS (pwMS) is exercise.4,5 The two most commonly applied exercise modalities are resistance training and aerobic resistance training,4,6 which seem equally effective in improving physical function. 4 Inherently, these two exercise modalities induce adaptations within the neuromuscular and cardiovascular systems. To reflect the capacity of these two systems, assessments of maximal muscle strength and maximal aerobic capacity are often performed. 7 Physical function covers a wide array of activities that can be assessed in multiple ways. However, two of the most frequently applied tests are the five-time sit-to-stand test (5STS) and the 6-minute walk test (6MWT),4,8 commonly known to be preferentially influenced by the parameters of maximal muscle strength and aerobic capacity, respectively.9,10 Understanding the extent to which physiological systems (i.e. the neuromuscular or cardiovascular system) affect performance in these two separate tests is essential for providing problem-targeted and, thus, personalized physical rehabilitation. In addition, from a clinical perspective, identifying the extent to which being impaired in one of the physiological systems (i.e. being below the 5th percentile of healthy age- and sex-matched controls) influences performance in the two separate tests is interesting. Hence, when the contributing factors are determined, the exercise modality targeting these factors can expectedly be prescribed at a higher precision.
Studies have previously investigated both the cardiovascular and neuromuscular systems and their association with lower limb physical function.9–11 However, previous studies assessing both domains also included other parameters such as walking function in their analysis. 10 To the best of our knowledge, no study has investigated the associations between markers of both the neuromuscular and cardiovascular systems and outcomes assessing lower extremity physical function, without adding other parameters to influence the associations. Furthermore, to our knowledge, no study has investigated how impairments in the neuromuscular or cardiovascular system affect lower extremity physical function. Therefore, the present study investigated how lower limb maximal muscular strength and aerobic capacity independently influence physical function assessed as performance in the 6MWT and the 5STS tests. To further evaluate the influence of these aspects of physical capacity on impairments, analyses were performed based on group comparisons of impaired vs. non-impaired individuals, along with regression analyses. Based on previous studies,4,10,12,13 we expected that aerobic capacity would be associated with performance in the 6MWT to a greater extent than muscle strength. Conversely, we expected lower limb muscular strength to be associated with the performance of the 5STS to a greater extent than aerobic capacity. Furthermore, it was investigated to which extent impairments in maximal muscle strength and aerobic capacity would influence performance in the 6MWT and the 5STS.
Materials and methods
This cross-sectional study was based on baseline data from an ongoing randomized controlled trial (RCT). 14 A total of n = 150 participants were recruited from Danish MS Clinics. First, participants were screened through a telephone interview to ensure that they met the following inclusion criteria: (a) a definite diagnosis of MS according to the revised McDonald criteria 15 ; (b) exercise two times or less per week of moderate-to-high intensity during the past 6 months; and (c) age between 18 and 60 years. Participants were excluded if (a) they had comorbidities that may would influence their exercise response (e.g. cardiovascular-, respiratory-, orthopedic- or other neurological diseases) or (b) they had cognitive impairments at a level hindering participation (i.e. unable to understand and follow training and testing instructions).
After completion of the phone screening, participants were scheduled for testing at either Aarhus University or Copenhagen University depending on their geographical location. After receiving information, participants gave written informed consent. The study was approved by The Central Denmark Region Committees on Health Research Ethics (Journal No. 1-10-72-237-21) and registered at the Danish Data Protection Agency (2016-051-000001) and Clinicaltrials.gov (identifier: NCT04913012).
Outcomes
Aerobic capacity
The participants performed an incremental exercise test to assess aerobic capacity until exhaustion on a bicycle ergometer (Aarhus: SRM, Jülich, Germany; Copenhagen: Monark, Ergomedic 839 E). Prior to testing, the flow and gas analyzers were calibrated. In Aarhus, a 3 L syringe (Hans Rudolph, series 5530, Shawnee, KS, USA) and certified reference gasses (4.00% CO2 and 16.5% O2) were used. In Copenhagen, the system was automatically calibrated (MasterScreen CPX, Carefusion, Germany).
The bicycle ergometer settings were adjusted according to the participants’ anthropometrics, and body mass was measured on a scale.
The test started with a 5-min warm-up at 60 watts (W) followed by increments of 10 W/min (women) and 15 W/min (men) until voluntary exhaustion. Based on the expected maximal power output determined based on age, sex, disability, and body size, individual power output adjustments were made after the 5-min warm-up to exhaust the subjects within 8 to 12 min after warm-up. 16
The participants were verbally encouraged to continue for as long as possible throughout the test. The cadence throughout the test was held at a self-chosen level between 50 and 95 revolutions per minute. Expired gas was collected in a mixing bag. The rate of oxygen uptake (VO2), carbon dioxide release (VCO2), and respiratory exchange ratio (RER) were determined continuously by an online respiratory gas exchange analyzer (Aarhus: Oxigraf O2CPX, Oxigraf Inc., Sunnyvale, CA, USA, expressed as 10-s averages using Indoor 8.00 software (Innovision ApS, Glamsbjerg, Denmark) Copenhagen: MasterScreen CPX, Carefusion, Germany, expressed as 15-s averages using the MasterScreen CPX, Carefusion, Germany).
Both work rate (W) and heart rate (HR) (Wahoo Tickr2, Wahoo Fitness, Atlanta, USA) were continuously monitored during the test. Following the test, participants were asked to rate their perceived exertion (RPE) after voluntary exhaustion using the 6-20 Borg Scale. 17 The highest recorded 30-s VO2 average attained during the test was considered the VO2peak.
Maximal muscle strength measurements
After a 5-minute warm-up on a bicycle ergometer (MonarkLT2, Monark, Sweden), participants were seated with a hip angle of 90°, depending on test-site, either in an isokinetic dynamometer (Aarhus) (Humac Norm, CSMi, Stoughton, Massachusetts, USA) or in a special designed chair with one ankle strapped to an isometric strain gauge (Copenhagen). The weakest/most affected leg was attached to a dynamometer lever arm. The test was performed with both arms crossed at the chest and the upper body strapped to the chair to ensure that only the knee extensors affected the torque outcome. The lever arm was fixed at a 70-degree angle (Aarhus) or 90-degree (Copenhagen) for the test. To ensure that data could be compared across both sites, all test results (Nm/kg) derived from a 90-degree angle were converted to comparable 70-degree values based on previous studies (multiplied by 1.22 to estimate 70-degree angle test results).18,19
The participants were instructed to maximally extend their knee with full force for 3–5 s while being verbally encouraged. The participants were given three attempts interspersed with a 1–2-min break. If a participant made three consecutive attempts with increasing peak force, a fourth attempt was made (Figure 1).
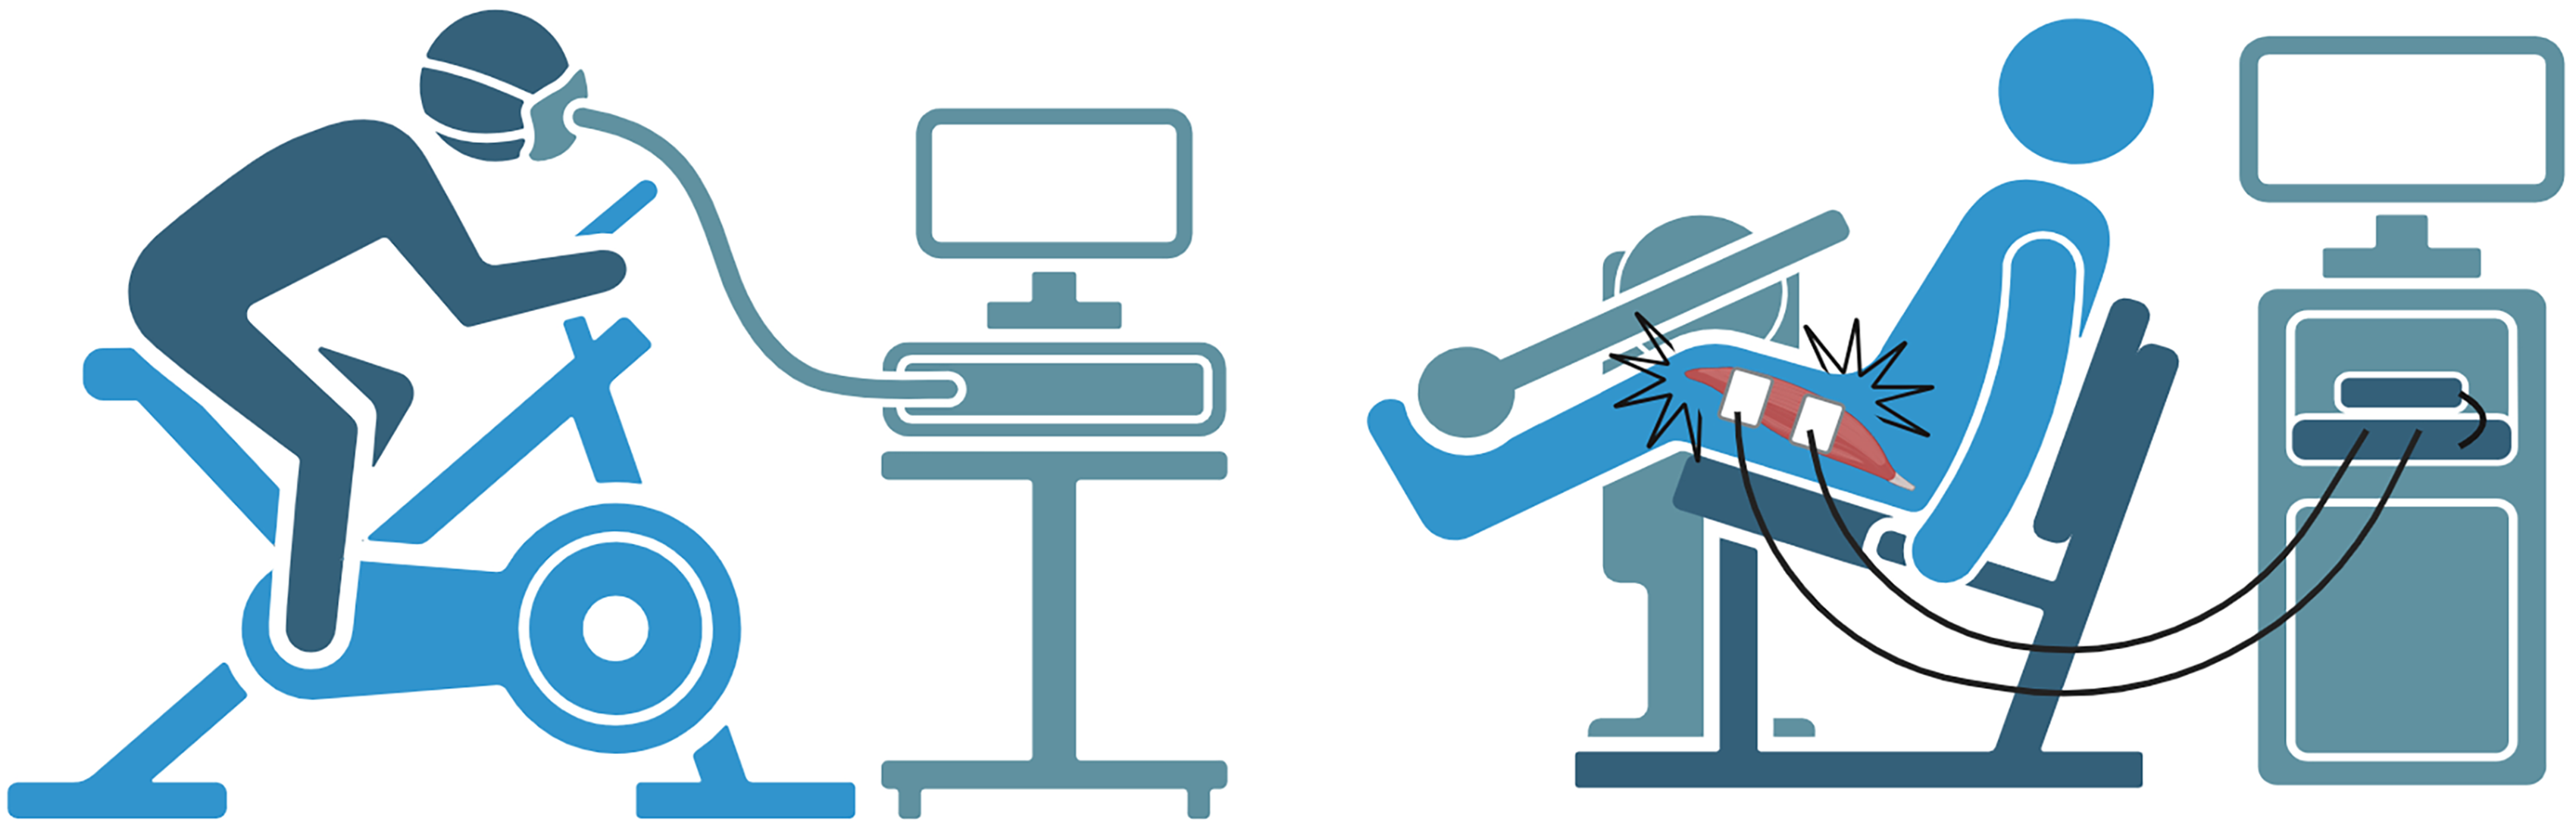
Illustrations of the test procedures of aerobic capacity and maximal muscle strength (created with BioRender)
Prior to the actual test, participants were given a maximum of three familiarization attempts.
The trial with the highest peak force was used for further analysis, and the peak force was considered the maximal voluntary contraction (MVC) force.
Physical function
Performance in the 6MWT was assessed on a 30-m track to evaluate walking endurance. The test was performed in accordance with the script of Goldman et al., 20 and the total distance walked was taken as the final result. Participants were instructed to walk as far as possible. 21
For assessment of performance in the 5STS, participants were instructed to perform five sit-to-stand movements as fast as possible on a chair without an armrest. 22 This was repeated twice and the total time from the best attempt was taken as the final result.
Statistics
The distribution of data was assessed by visual inspection of the QQ plots and histograms. All data followed a normal distribution, except for the 5STS, which was subsequently adjusted accordingly (inverse transformation to serve as a proxy of 5STS speed “rounds/sec”).
Simple and multivariable linear regression analyses were conducted to examine the association between the dependent (6MWT, 5STS) and independent (VO2peak, MVC) variables. Furthermore, prespecified variables (age, sex, time since diagnosis, and expanded disability status scale (EDSS)) were added to the multivariable linear regression model, as they are known to influence the performance in both the 6MWT and the 5STS. Notably, the test-site was considered as a variable, but as it did not influence the results (data not shown), it was not included in the models to avoid overfitting. The following models were created, with either the 6MWT or 5STS as the dependent variable: model 1, VO2peak and MVC; model 2, VO2peak, MVC, age, and sex; and model 3, VO2peak, MVC, age, sex, time since diagnosis, and EDSS. Associations were considered weak if R2 < 0.16, moderate if 0.16 ≤ R2 < 0.49, strong if 0.49 ≤ R2 < 0.81, and very strong if R2 ≥ 0.81. 23 Standardized β values were calculated to compare the independent variables in the multivariable regression analysis.
Furthermore, the prevalence of pwMS with impairments in aerobic capacity and/or in muscle strength was determined using normative data (aerobic capacity24–26 and muscle strength9,27,28) from healthy controls, with those being below the 5th percentile of healthy controls (age and sex-matched) considered “impaired.” Subsequently, the participants were categorized and divided into four groups: (a) impairments in both aerobic capacity and muscle strength (IMP) and (b) impairments in aerobic capacity only (IMP_AER.); and (c) impairments in muscle strength only (IMP_STR) and (d) no impairment (NO_IMP). To support the regression analysis data, the performance data on the 6MWT and 5STS were determined for these four groups. Five participants had missing data on either aerobic capacity or muscle strength for various reasons and were left out of these analyses.
The power calculation, which applied a statistical level of 0.05% and a statistical power of 80%, was based on results on physical function from previous studies and suggested a total sample size of 150. For further information, please refer to our protocol paper. 14
Data are presented as mean ± standard deviation and mean ± 95CI. Statistical analysis was performed using STATA v. 18.0 (StataCorp, College Station, TX, USA) and GraphPad Prism v. 10.0 (GraphPad Software, Boston, Massachusetts, USA).
Results
A total of n = 150 pwMS (69 tested in Aarhus, 81 tested in Copenhagen) (45 ± 8.8 years, 75% females) were enrolled (see Figure 2) and completed evaluation of VO2peak (25.8 ± 7.5 ml O2/min/kg), MVC (1.8 ± 0.6 Nm/Kg), 5STS (0.49 ± 0.15 rounds/s), and 6MWT (545 ± 134 m) (Table 1).
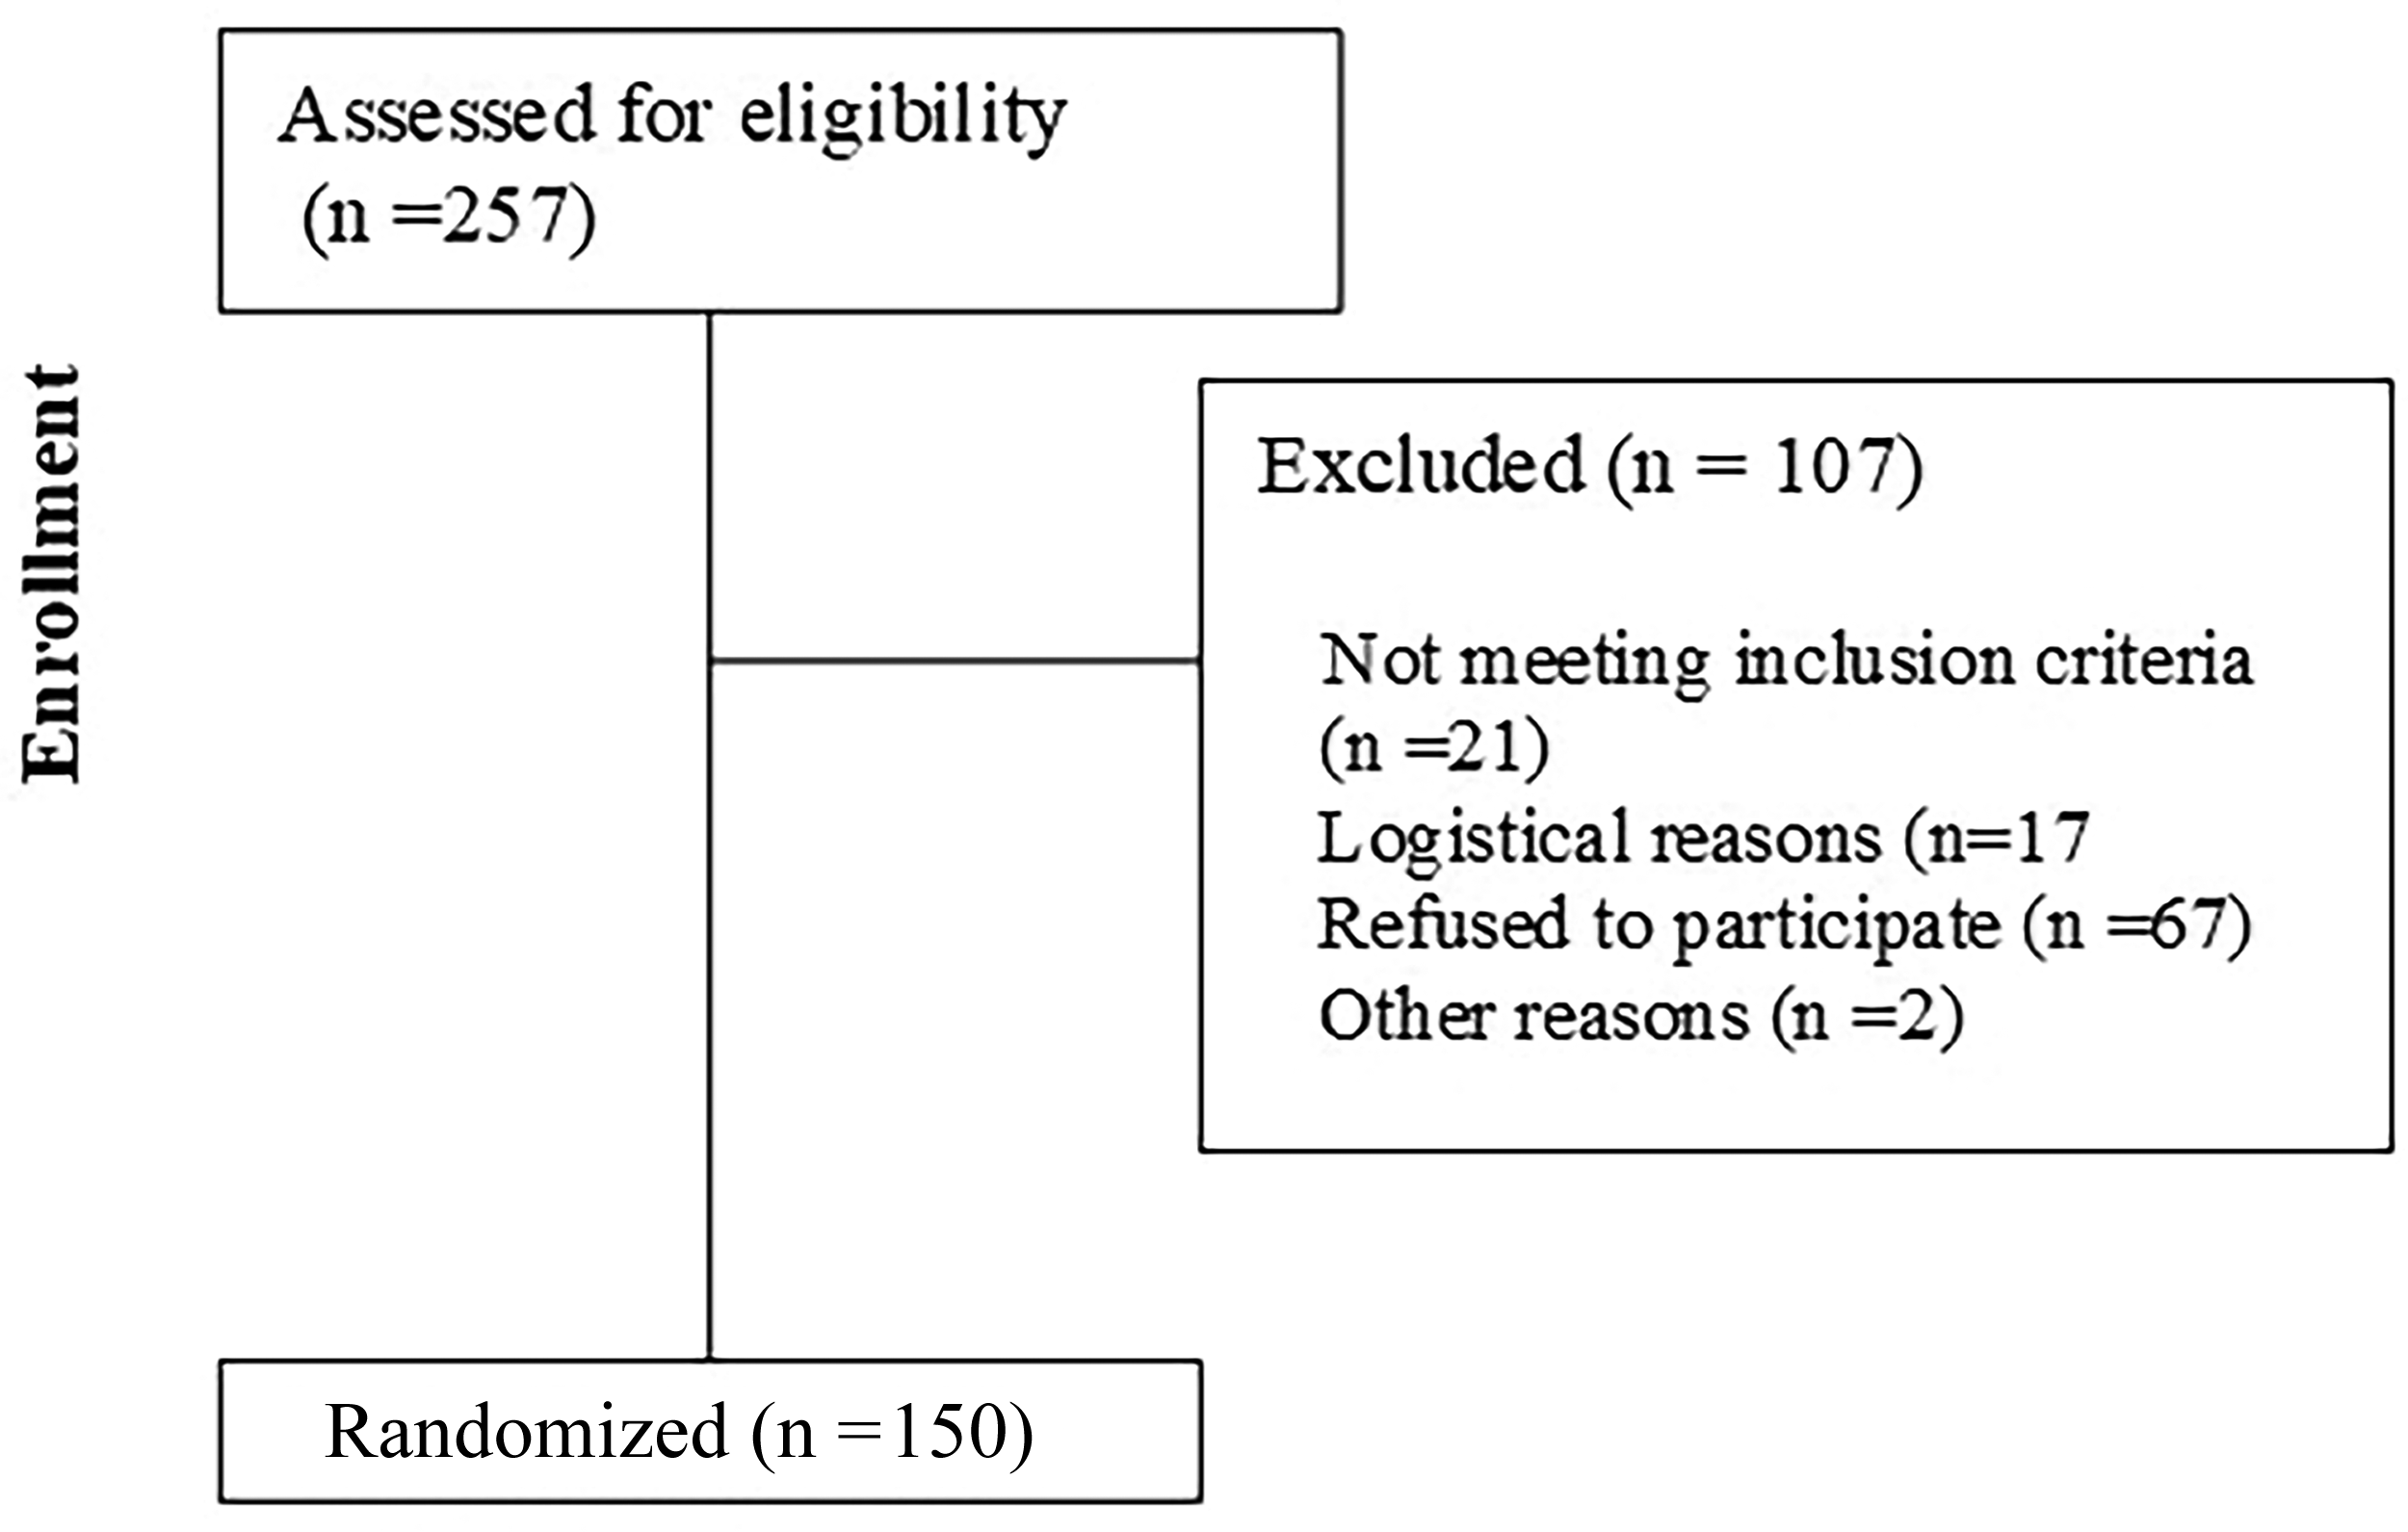
Flowchart of the study.
Participants demographics and measures of physiological parameters and physical function. Abbreviations: IMP: impairments; IMP_AER: impairments in aerobic capacity; IMP_STR: impairments in muscle strength; NO_IMP: no impairments in aerobic capacity or muscle strength; EDSS: expanded disability status scale; RRMS: relapsing remitting multiple sclerosis; SPMS: secondary progressive multiple sclerosis; PPMS: primary progressive multiple sclerosis; 5STS: five-time sit-to-stand test; 6MWT: 6-minute walk test.

Presented as median [interquartile range].
Regression models
Simple regression analyses showed a weak association between 5STS performance and MVC (R2 = 0.15, p < 0.01) and between 5STS performance and VO2peak (R2 = 0.10, p < 0.00). Moderate associations were observed between 6MWT performance and MVC (R2 = 0.26, p < 0.01) and between 6MWT performance and VO2peak R2 = 0.36, p < 0.01).
Multivariable regression analyses (Model 1) showed a moderate association (R²=0.40, p < 0.01) between 6MWT performance, aerobic capacity (β=7.9, std β=0.45), and MVC (β=48.2, std β=0.26), whereas weak associations (R²=0.14) were observed between 5STS performance, aerobic capacity (β=0.00, std β=0.16), and MVC (β=0.06, std β=0.28) (Table 2).
Multivariate regression models of the association between the 6MWT or the 5STS and (model 1) aerobic capacity and muscle strength, (model 2) aerobic capacity, muscle strength, age and gender, (model 3) aerobic capacity, muscle strength, age, gender, EDSS and time since diagnosis. Male served as reference value. Abbreviations: EDSS: expanded disability status scale; 5STS: five-time sit-to-stand test; 6MWT: 6-minute walk test.

Multivariable regression analyses (Model 2) showed a moderate association (R²=0.46, p < 0.01) between 6MWT performance, aerobic capacity (β=8.2, std β=0.47), MVC (β=56.0, std β=0.30), age (β=−1.3, std β=−0.08), and sex (β=−79.1, std β=−0.26). In addition, a moderate association (R²=0.27, p < 0.01) was found between 5STS performance, aerobic capacity (β=0.00, std β=0.20), MVC (β=0.10, std β=0.40), age (β=−0.00, std β=−0.00), and sex (β=−0.14, std β=−0.41) (Table 2).
Multivariable regression analysis (model 3) showed a strong association (R²=0.63, p < 0.01) between 6MWT performance, aerobic capacity (β=6.0, std β=0.34), MVC (β=35.9, std β=0.19), age (β=0.88, std β=−0.05), sex (β=−38.6, std β=−0.13), EDSS (β=−43.4, std β=−0.49), and time since diagnosis (β=−0.33, std β=−0.02). A moderate association (R²=0.32, p < 0.01) was found between 5STS performance, aerobic capacity (β=0.00, std β=0.12), MVC (β=0.08, std β=0.35), age (β=0.00, std β=0.07), sex (β=−0.11, std β=−0.33), EDSS (β=−0.02, std β=−0.28) and time since diagnosis (β=−0.00, std β=−0.02) (Table 2).
Impairments
Approximately half of the participants, 49% (n = 71), did not display impairments in either aerobic capacity or muscle strength. In contrast, 9% (n = 13) had impairments in aerobic capacity only, 17% (n = 25) had impairments in muscle strength only, and 25% (n = 36) displayed impairments in both aerobic capacity and muscle strength based on norm data (see Table 1).
Performance in the 6-minute walk test
Across different groups, the following was shown for performance in the 6MWT;
The NO_IMP group walked further than all the other groups, NO_IMP > IMP_AER +81 [15;148] m, NO_IMP > IMP_STR +69 [18;121] m, NO_IMP > IMP +166 [121;212] m.
The IMP_AER walked further than the IMP, IMP_AER > IMP +85 [13;156] m and so did the IMP_STR, IMP_STR > IMP +97 [38;155] m.
Finally, there was no difference between IMP_AER and IMP_STR; IMP_AER ≤ IMP_STR +12 [−63;87] m. (Figure 3).

Performance in the 6MWT based on impairments in the physiological systems. Abbreviations: 6MWT: 6-minute walk test, IMP: impairments in both aerobic capacity and muscle strength; IMP_AER: impairments in aerobic capacity; IMP_STR: impairments in muscle strength; NO_IMP: no impairments. Difference values are displayed as mean [95%CI].
Performance in the five-time sit-to-stand test
Across different groups, the following was observed for performance in the 5STS.
The NO_IMP group was faster than both IMP_STR and IMP: NO_IMP > IMP_STR +0.09 [0.03;0.15] rounds/s, NO_IMP > IMP +0.15 [0.10;0.20] rounds/s, whereas there was no difference compared to IMP_AER: NO_IMP = IMP_AER +0.01 [−0.06;0.08] rounds/s.
The IMP_AER was faster than the IMP, IMP_AER < IMP +0.14 [0.06;0.22] rounds/sec, whereas only a tendency was seen for the IMP_STR, IMP_STR ≥ IMP +0.05 [−0.01;0.12] rounds/sec.
Finally, IMP_AER was faster than IMP_STR, IMP_AER > IMP_STR +0.08 [0.00;0.16] rounds/sec. (Figure 4).

Performance in the 5STS based on impairments in the physiological systems. Abbreviations: 5STS: five-time sit-to-stand test. IMP: impairments in both aerobic capacity and muscle strength: IMP_AER: impairments in aerobic capacity; IMP_STR: impairments in muscle strength; NO_IMP: no impairments. Difference values are displayed as mean [95%CI].
Discussion
In the present study, both maximal muscle strength and aerobic capacity affected performance in the 6MWT and the 5STS. Maximal muscle strength appeared superior in explaining performance in the 5STS, whereas aerobic capacity appeared superior in explaining performance in the 6MWT. These findings aligned with our expectations and suggest that exercise interventions aimed at improving walking endurance should emphasize/prioritize aerobic training, whereas exercise interventions aimed at improving sit-to-stand should emphasize/prioritize resistance training. Although the results are based on cross-sectional data, our findings can guide the precision of future exercise programs targeting specific lower extremity functions in pwMS.
To the best of our knowledge, this is the first study to investigate the associations between MVC of the knee extensors, VO2peak, and physical function. Notably, the present study confirms previous findings showing a good association between VO2peak and performance in the 6MWT,10,29 as well as between muscle strength, and 5STS.22,30
The present study expands previous findings by adding a multivariable regression analysis. With 6MWT performance as the dependent variable, the std β values for MVC (0.25), and VO2peak (0.46) indicated that aerobic capacity had a greater impact than muscle strength on 6MWT performance. Conversely, with 5STS as the dependent variable, the std β values for MVC (0.28) and VO2peak (0.16) indicated that muscle strength had a greater impact than aerobic capacity on 5STS performance (see Table 2). This finding is supported by the “impairment analysis,” which showed that the group with impaired strength performed worse than those with impairments in aerobic capacity only, −0.08 rounds/sec [−0.16;0.00].
When adding age, sex, EDSS, and time since diagnosis to the models, they were able to explain 63% and 35% of the performance in the 6MWT and 5STS, respectively. Interestingly, although EDSS was closely related to both the 6MWT and 5STS, the association between muscle strength, aerobic capacity, and 6MWT remained after adjusting for EDSS and time since diagnosis, whereas it only remained for muscle strength and 5STS in the other model.
Hence, it must be addressed that although the cardiovascular and neuromuscular systems are the two most dominant physiological systems, many additional factors affect performance in the applied tests. Using a multivariable regression model, Wetzel et al. found that a model including the score on the Activities-Specific Balance Confidence Scale, time on a functional stair test, and static standing balance explained 77% (R²=0.77) of the variation in the 6MWT, indicating that balance explains a substantial part of the variance in performance in the 6MWT. 31 As for the 5STS, based on results by Stagsted et al., muscle power could be considered a superior measure of muscle function than MVC when explaining the performance in the 5STS. 32 However, the present study did not assess this parameter.
The present study found that 34% of the participants had impairments in aerobic capacity, which is somewhat lower than previously reported in male/female pwMS in their forties by Schlagheck et al. 26 This discrepancy is most likely due to the lower EDSS in the participants of the present study, linked to the fact that the participants in the study by Schlagheck et al. 26 were inpatients admitted to a rehabilitation hospital. Nevertheless, it emphasizes that aerobic capacity is substantially reduced in pwMS, thus posing a major health risk. 33 To the best of our knowledge, this is the first study to provide data on the prevalence of pwMS with impaired muscle strength. A total of 42% of patients had impaired maximal knee extensor isometric muscle strength. As for the aerobic capacity mentioned above, this is an important finding since muscle strength is an important indicator of physical function, 4 and in the risk of morbidity and all-cause mortality. 34
Clinical perspectives
From a clinical point of view, it is important to note that both aerobic capacity and muscle strength are components that targeted exercise programs can improve. 4 In addition, improvements in aerobic capacity have been shown to improve the performance of the 6MWT,12,35 whereas only a few studies have investigated the effects of aerobic training on the 5STS, yet with at least one reporting a beneficial effect. 36 Furthermore, resistance training has been shown to be effective in improving the performance in both the 5STS and the 6MWT.13,37
If the underlying physiological parameters for a given functional capacity aspect are better understood, treatment can likely be optimized based on this. The authors acknowledge that the cardiovascular and neuromuscular systems are not the only meaningful parameters to be investigated. Nevertheless, we consider them among the most important from a physical point of view. Thus, an improved understanding of the relationship between these systems and important daily performance markers can likely improve the precision and quality of prescribed (exercise) interventions.
Methodological considerations
The present study has some limitations that must be considered when interpreting the results. First, the cross-sectional nature of the study does not allow for conclusions on causality. As such, it cannot be concluded whether aerobic capacity or muscle strength affects performance in a physical function task, or vice versa. However, modulating aerobic capacity or muscle strength over time has been shown to affect the performance in physical function tasks. 4
Second, data from the present study were obtained from an ongoing RCT, where one inclusion criterion was that participants were not allowed to exercise more than twice a week. A natural result of this is is a relatively untrained sample, which somehow biases the results as the variation in the sample is decreased. However, as one would expect trained people to perform better on the tests, the associations would most likely be underestimated.
Third, impairments in the present study were defined as being below the 5th percentile of healthy controls for aerobic capacity and muscle strength. As such, this is not a direct limitation, but it can be discussed if a cut-off point anchored in patients’ perceptions would be a better measure. However, to the best of our knowledge, such a cut-off does not exist for muscle strength. Hence, the 5th percentile was chosen to compare aerobic capacity and muscle strength.
Fourth, as comorbidity is common in pwMS, 38 the present results may not be applicable for all pwMS, as people with either cardiovascular, respiratory, orthopedic, or other neurological diseases were excluded from the present study.
Finally, in line with point two, this was a secondary analysis from an ongoing RCT, and the study was not powered to evaluate this research question.
Conclusion
The present study shows that while maximal muscle strength and aerobic capacity contribute substantially to physical function, maximal muscle strength is preferentially linked to performance in the 5STS, whereas aerobic capacity is preferentially linked to performance in the 6MWT.
Impairments in maximal muscle strength negatively affect performance in the 5STS more than impairments in aerobic capacity, whereas impairments in aerobic capacity do not affect performance in the 6MWT compared to impairments in maximal muscle strength.
Evaluation of both physical capacity and functional outcomes can guide exercise prescription to optimally target physiological impairments and physical functional limitations in pwMS.
Footnotes
Acknowledgments
The authors wish to thank the study participants and the collaborating MS clinics (Aarhus University Hospital, Rigshospitalet, Odense University Hospital, and Hospital of Southwest Jutland).
Authors contributions
The conception and design of the work were done by LTM, LGH, and UD. LTM, JLJ, MKB, and HR handled the data collection. Data analysis was performed by LTM and LGH. All authors were responsible for data interpretation, manuscript drafting, revision, and the final approval of the version to be published.
Declaration of conflicting interests
The authors declared no potential conflicts of interest with respect to the research, authorship, and/or publication of this article.
Funding
The authors disclosed receipt of the following financial support for the research, authorship, and/or publication of this article: This work was supported by the Tømmerhandler Johannes Fogs Fond, Fonden af 1870, TrygFonden, Jascha Fonden, Scleroseforeningen, Helsefonden, (grant number 154868, 2021-0120, A42692, 21-B-0236).